Cheshire, MA Map & Demographics
Cheshire Map
Cheshire Overview
$47,190
PER CAPITA INCOME
$128,306
AVG FAMILY INCOME
37.8%
WAGE / INCOME GAP [ % ]
62.2¢/ $1
WAGE / INCOME GAP [ $ ]
0.33
INEQUALITY / GINI INDEX
547
TOTAL POPULATION
215
MALE POPULATION
332
FEMALE POPULATION
64.76
MALES / 100 FEMALES
154.42
FEMALES / 100 MALES
60.1
MEDIAN AGE
2.3
AVG FAMILY SIZE
1.6
AVG HOUSEHOLD SIZE
236
LABOR FORCE [ PEOPLE ]
45.4%
PERCENT IN LABOR FORCE
Cheshire Zip Codes
Cheshire Area Codes
Income in Cheshire
Income Overview in Cheshire
| Characteristic | Number | Measure |
| Per Capita Income | 547 | $47,190 |
| Median Family Income | 140 | $128,306 |
| Mean Family Income | 140 | $117,899 |
| Median Household Income | 330 | $0 |
| Mean Household Income | 330 | $80,027 |
| Income Deficit | 140 | $0 |
| Wage / Income Gap (%) | 547 | 37.75% |
| Wage / Income Gap ($) | 547 | 62.25¢ per $1 |
| Gini / Inequality Index | 547 | 0.33 |
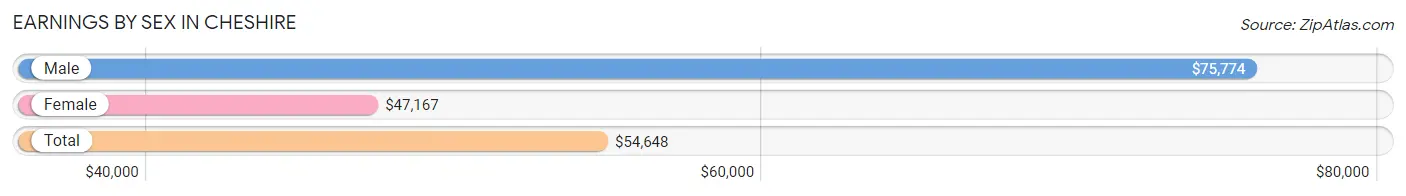
Earnings by Sex in Cheshire
Average Earnings in Cheshire are $54,648, $75,774 for men and $47,167 for women, a difference of 37.8%.
| Sex | Number | Average Earnings |
| Male | 137 (54.1%) | $75,774 |
| Female | 116 (45.9%) | $47,167 |
| Total | 253 (100.0%) | $54,648 |
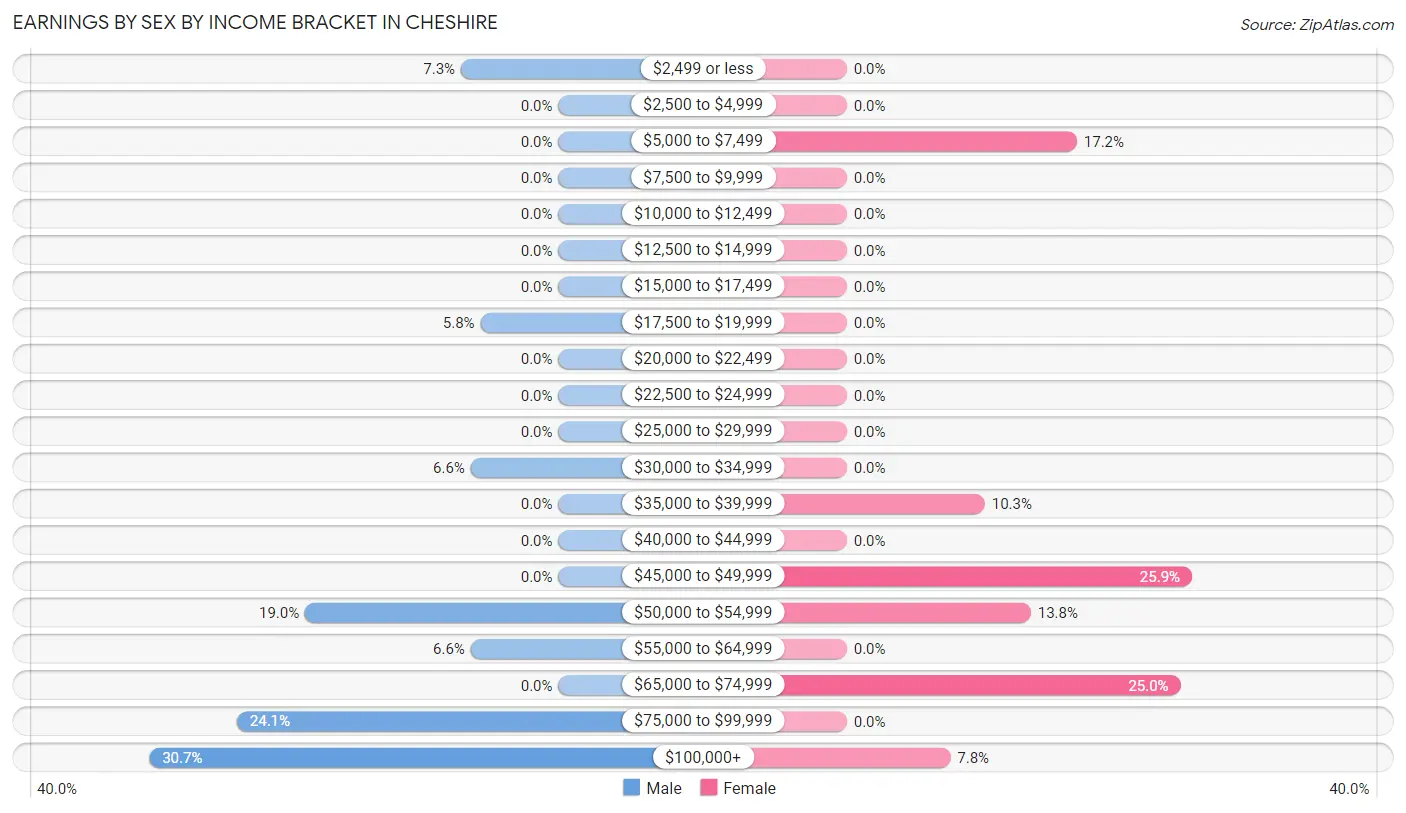
Earnings by Sex by Income Bracket in Cheshire
The most common earnings brackets in Cheshire are $100,000+ for men (42 | 30.7%) and $45,000 to $49,999 for women (30 | 25.9%).
| Income | Male | Female |
| $2,499 or less | 10 (7.3%) | 0 (0.0%) |
| $2,500 to $4,999 | 0 (0.0%) | 0 (0.0%) |
| $5,000 to $7,499 | 0 (0.0%) | 20 (17.2%) |
| $7,500 to $9,999 | 0 (0.0%) | 0 (0.0%) |
| $10,000 to $12,499 | 0 (0.0%) | 0 (0.0%) |
| $12,500 to $14,999 | 0 (0.0%) | 0 (0.0%) |
| $15,000 to $17,499 | 0 (0.0%) | 0 (0.0%) |
| $17,500 to $19,999 | 8 (5.8%) | 0 (0.0%) |
| $20,000 to $22,499 | 0 (0.0%) | 0 (0.0%) |
| $22,500 to $24,999 | 0 (0.0%) | 0 (0.0%) |
| $25,000 to $29,999 | 0 (0.0%) | 0 (0.0%) |
| $30,000 to $34,999 | 9 (6.6%) | 0 (0.0%) |
| $35,000 to $39,999 | 0 (0.0%) | 12 (10.3%) |
| $40,000 to $44,999 | 0 (0.0%) | 0 (0.0%) |
| $45,000 to $49,999 | 0 (0.0%) | 30 (25.9%) |
| $50,000 to $54,999 | 26 (19.0%) | 16 (13.8%) |
| $55,000 to $64,999 | 9 (6.6%) | 0 (0.0%) |
| $65,000 to $74,999 | 0 (0.0%) | 29 (25.0%) |
| $75,000 to $99,999 | 33 (24.1%) | 0 (0.0%) |
| $100,000+ | 42 (30.7%) | 9 (7.8%) |
| Total | 137 (100.0%) | 116 (100.0%) |
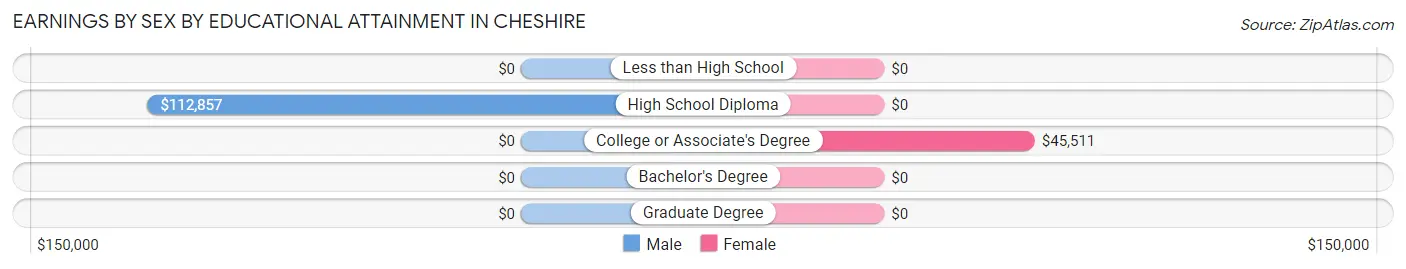
Earnings by Sex by Educational Attainment in Cheshire
Average earnings in Cheshire are $75,774 for men and $53,359 for women, a difference of 29.6%. Men with an educational attainment of high school diploma enjoy the highest average annual earnings of $112,857, while those with high school diploma education earn the least with $112,857. Women with an educational attainment of college or associate's degree earn the most with the average annual earnings of $45,511, while those with college or associate's degree education have the smallest earnings of $45,511.
| Educational Attainment | Male Income | Female Income |
| Less than High School | - | - |
| High School Diploma | $112,857 | $0 |
| College or Associate's Degree | - | - |
| Bachelor's Degree | - | - |
| Graduate Degree | - | - |
| Total | $75,774 | $53,359 |
Family Income in Cheshire
Family Income Brackets in Cheshire
According to the Cheshire family income data, there are 109 families falling into the $100,000 to $149,999 income range, which is the most common income bracket and makes up 77.9% of all families.
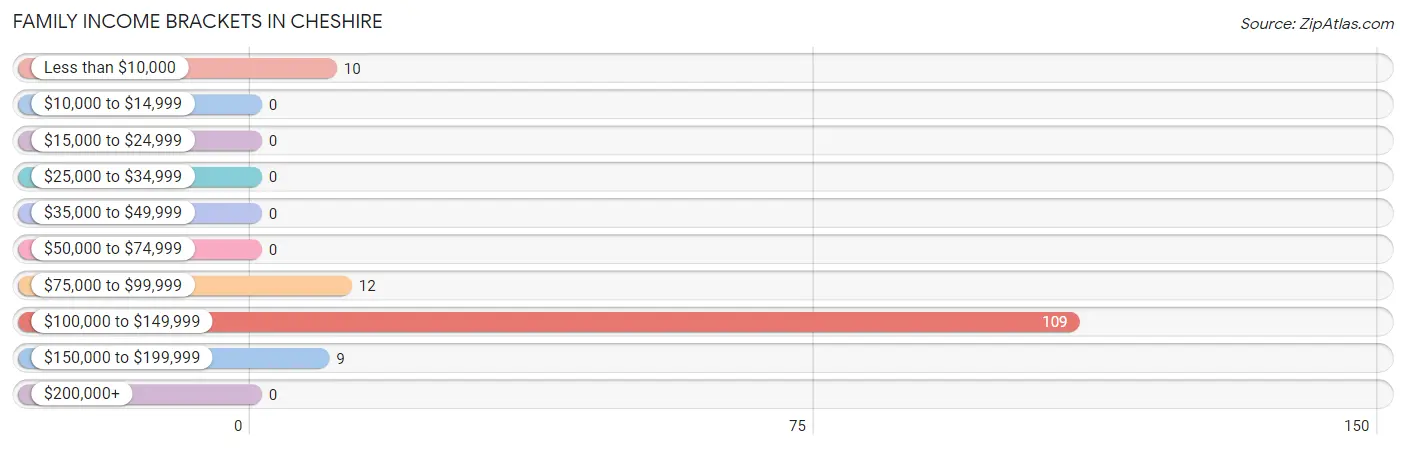
| Income Bracket | # Families | % Families |
| Less than $10,000 | 10 | 7.1% |
| $10,000 to $14,999 | 0 | 0.0% |
| $15,000 to $24,999 | 0 | 0.0% |
| $25,000 to $34,999 | 0 | 0.0% |
| $35,000 to $49,999 | 0 | 0.0% |
| $50,000 to $74,999 | 0 | 0.0% |
| $75,000 to $99,999 | 12 | 8.6% |
| $100,000 to $149,999 | 109 | 77.9% |
| $150,000 to $199,999 | 9 | 6.4% |
| $200,000+ | 0 | 0.0% |
Family Income by Famaliy Size in Cheshire
2-person families (108 | 77.1%) account for the highest median family income in Cheshire with $128,611 per family, while 2-person families (108 | 77.1%) have the highest median income of $64,306 per family member.
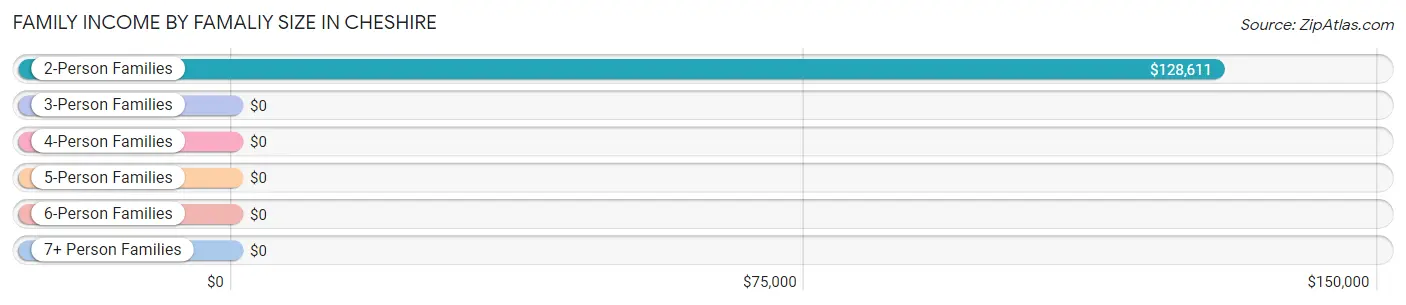
| Income Bracket | # Families | Median Income |
| 2-Person Families | 108 (77.1%) | $128,611 |
| 3-Person Families | 0 (0.0%) | $0 |
| 4-Person Families | 32 (22.9%) | $0 |
| 5-Person Families | 0 (0.0%) | $0 |
| 6-Person Families | 0 (0.0%) | $0 |
| 7+ Person Families | 0 (0.0%) | $0 |
| Total | 140 (100.0%) | $128,306 |
Family Income by Number of Earners in Cheshire
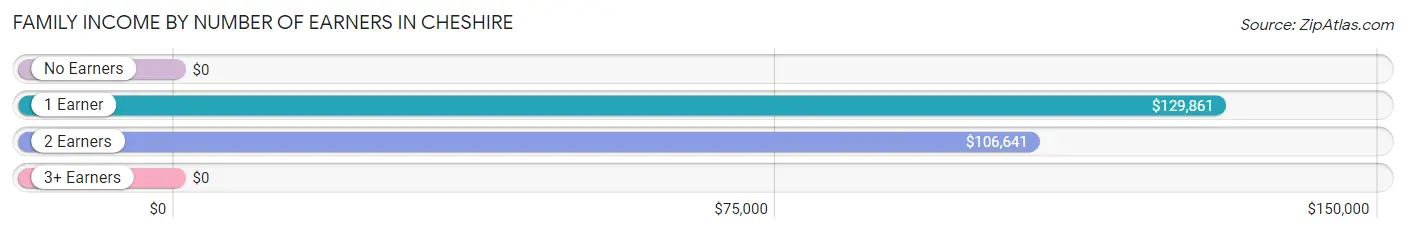
| Number of Earners | # Families | Median Income |
| No Earners | 8 (5.7%) | $0 |
| 1 Earner | 65 (46.4%) | $129,861 |
| 2 Earners | 45 (32.1%) | $106,641 |
| 3+ Earners | 22 (15.7%) | $0 |
| Total | 140 (100.0%) | $128,306 |
Household Income in Cheshire
Household Income Brackets in Cheshire
With 151 households falling in the category, the $100,000 to $149,999 income range is the most frequent in Cheshire, accounting for 45.8% of all households.
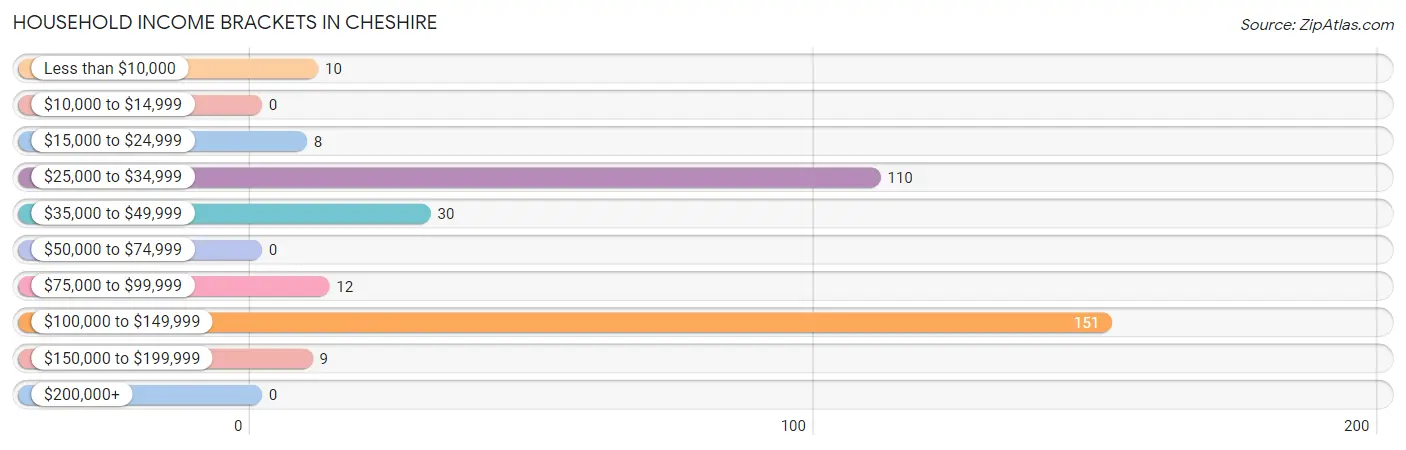
| Income Bracket | # Households | % Households |
| Less than $10,000 | 10 | 3.0% |
| $10,000 to $14,999 | 0 | 0.0% |
| $15,000 to $24,999 | 8 | 2.4% |
| $25,000 to $34,999 | 110 | 33.3% |
| $35,000 to $49,999 | 30 | 9.1% |
| $50,000 to $74,999 | 0 | 0.0% |
| $75,000 to $99,999 | 12 | 3.6% |
| $100,000 to $149,999 | 151 | 45.8% |
| $150,000 to $199,999 | 9 | 2.7% |
| $200,000+ | 0 | 0.0% |
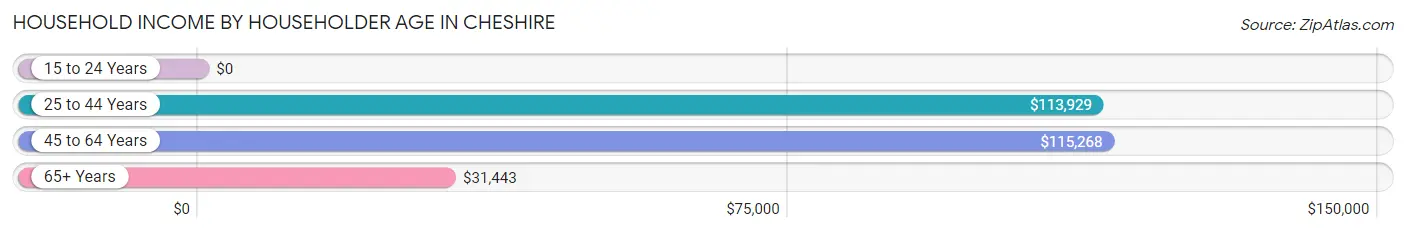
Household Income by Householder Age in Cheshire
The median household income in Cheshire is $0, with the highest median household income of $115,268 found in the 45 to 64 years age bracket for the primary householder. A total of 107 households (32.4%) fall into this category.
| Income Bracket | # Households | Median Income |
| 15 to 24 Years | 0 (0.0%) | $0 |
| 25 to 44 Years | 80 (24.2%) | $113,929 |
| 45 to 64 Years | 107 (32.4%) | $115,268 |
| 65+ Years | 143 (43.3%) | $31,443 |
| Total | 330 (100.0%) | $0 |
Poverty in Cheshire
Income Below Poverty by Sex and Age in Cheshire
With 8.4% poverty level for males and 6.0% for females among the residents of Cheshire, 6 to 11 year old males and 45 to 54 year old females are the most vulnerable to poverty, with 8 males (100.0%) and 10 females (52.6%) in their respective age groups living below the poverty level.
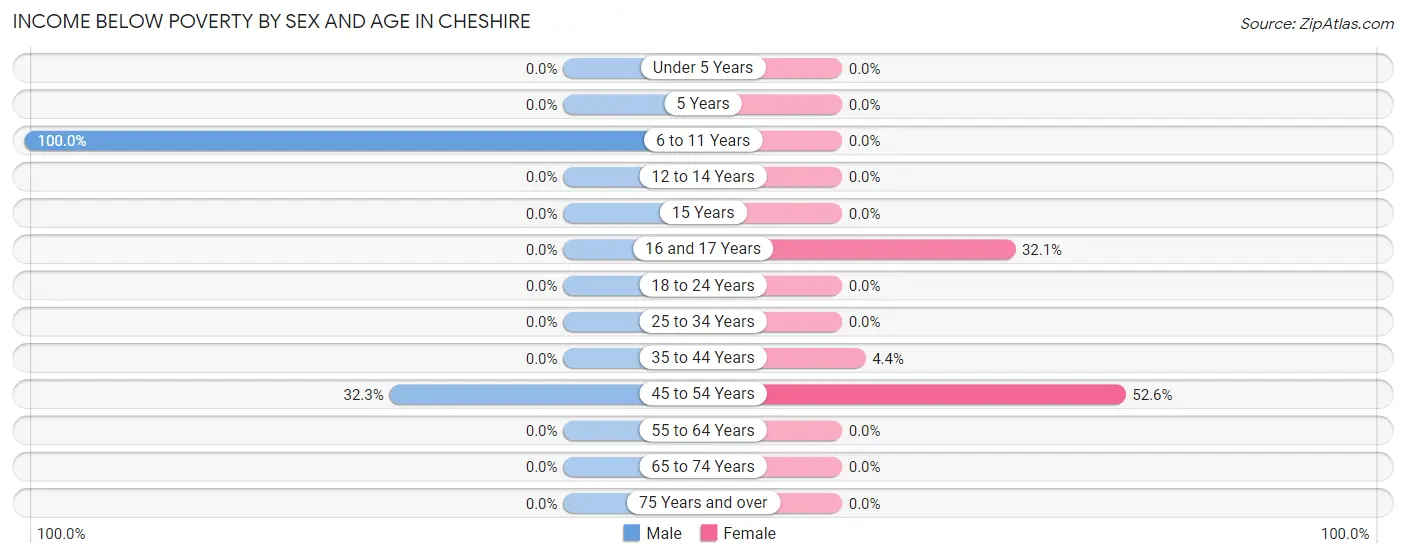
| Age Bracket | Male | Female |
| Under 5 Years | 0 (0.0%) | 0 (0.0%) |
| 5 Years | 0 (0.0%) | 0 (0.0%) |
| 6 to 11 Years | 8 (100.0%) | 0 (0.0%) |
| 12 to 14 Years | 0 (0.0%) | 0 (0.0%) |
| 15 Years | 0 (0.0%) | 0 (0.0%) |
| 16 and 17 Years | 0 (0.0%) | 9 (32.1%) |
| 18 to 24 Years | 0 (0.0%) | 0 (0.0%) |
| 25 to 34 Years | 0 (0.0%) | 0 (0.0%) |
| 35 to 44 Years | 0 (0.0%) | 1 (4.3%) |
| 45 to 54 Years | 10 (32.3%) | 10 (52.6%) |
| 55 to 64 Years | 0 (0.0%) | 0 (0.0%) |
| 65 to 74 Years | 0 (0.0%) | 0 (0.0%) |
| 75 Years and over | 0 (0.0%) | 0 (0.0%) |
| Total | 18 (8.4%) | 20 (6.0%) |
Income Above Poverty by Sex and Age in Cheshire
According to the poverty statistics in Cheshire, males aged 25 to 34 years and females aged 15 years are the age groups that are most secure financially, with 100.0% of males and 100.0% of females in these age groups living above the poverty line.
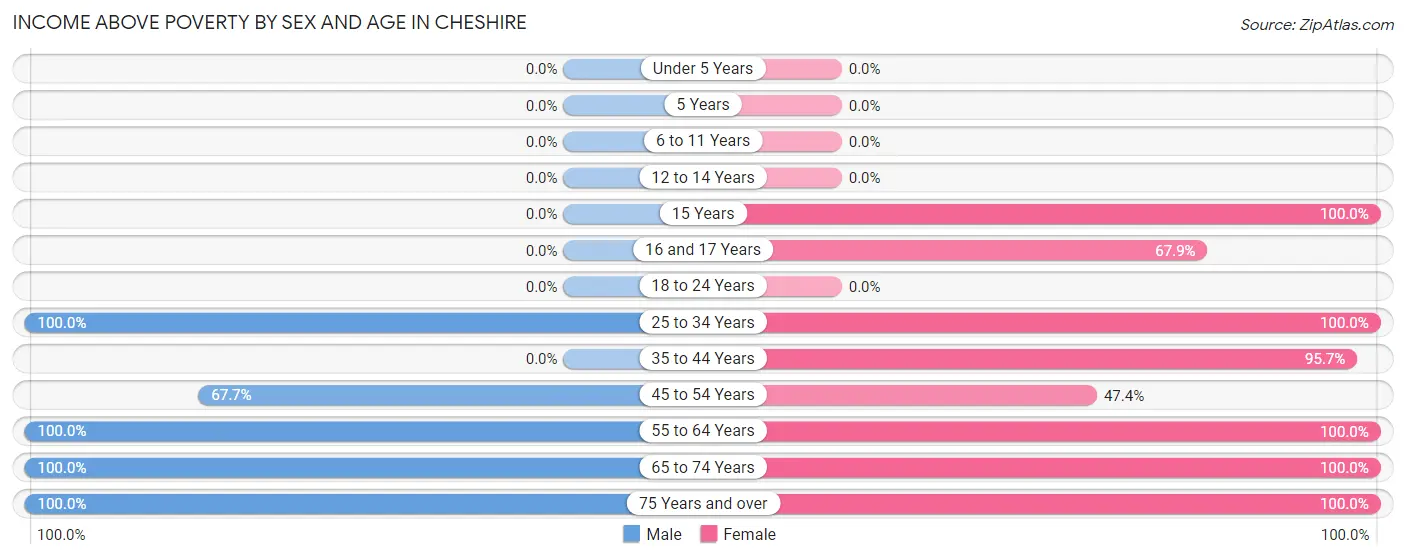
| Age Bracket | Male | Female |
| Under 5 Years | 0 (0.0%) | 0 (0.0%) |
| 5 Years | 0 (0.0%) | 0 (0.0%) |
| 6 to 11 Years | 0 (0.0%) | 0 (0.0%) |
| 12 to 14 Years | 0 (0.0%) | 0 (0.0%) |
| 15 Years | 0 (0.0%) | 19 (100.0%) |
| 16 and 17 Years | 0 (0.0%) | 19 (67.9%) |
| 18 to 24 Years | 0 (0.0%) | 0 (0.0%) |
| 25 to 34 Years | 58 (100.0%) | 16 (100.0%) |
| 35 to 44 Years | 0 (0.0%) | 22 (95.7%) |
| 45 to 54 Years | 21 (67.7%) | 9 (47.4%) |
| 55 to 64 Years | 93 (100.0%) | 83 (100.0%) |
| 65 to 74 Years | 8 (100.0%) | 117 (100.0%) |
| 75 Years and over | 17 (100.0%) | 27 (100.0%) |
| Total | 197 (91.6%) | 312 (94.0%) |
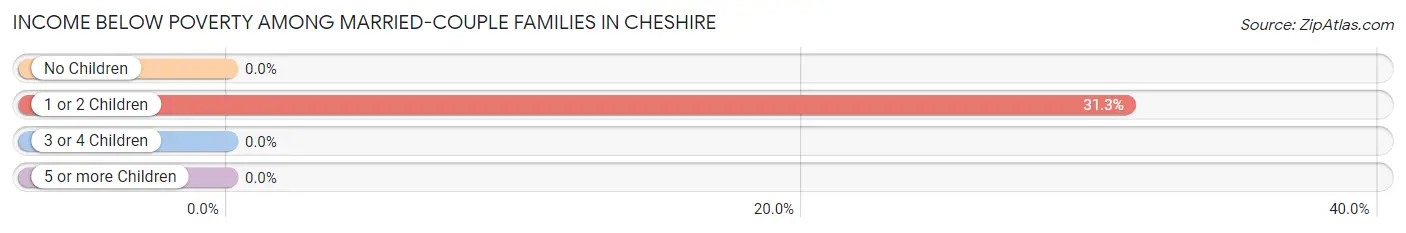
Income Below Poverty Among Married-Couple Families in Cheshire
The poverty statistics for married-couple families in Cheshire show that 7.1% or 10 of the total 140 families live below the poverty line. Families with 1 or 2 children have the highest poverty rate of 31.2%, comprising of 10 families. On the other hand, families with no children have the lowest poverty rate of 0.0%, which includes 0 families.
| Children | Above Poverty | Below Poverty |
| No Children | 108 (100.0%) | 0 (0.0%) |
| 1 or 2 Children | 22 (68.8%) | 10 (31.2%) |
| 3 or 4 Children | 0 (0.0%) | 0 (0.0%) |
| 5 or more Children | 0 (0.0%) | 0 (0.0%) |
| Total | 130 (92.9%) | 10 (7.1%) |
Income Below Poverty Among Single-Parent Households in Cheshire
| Children | Single Father | Single Mother |
| No Children | 0 (0.0%) | 0 (0.0%) |
| 1 or 2 Children | 0 (0.0%) | 0 (0.0%) |
| 3 or 4 Children | 0 (0.0%) | 0 (0.0%) |
| 5 or more Children | 0 (0.0%) | 0 (0.0%) |
| Total | 0 (0.0%) | 0 (0.0%) |
Income Below Poverty Among Married-Couple vs Single-Parent Households in Cheshire
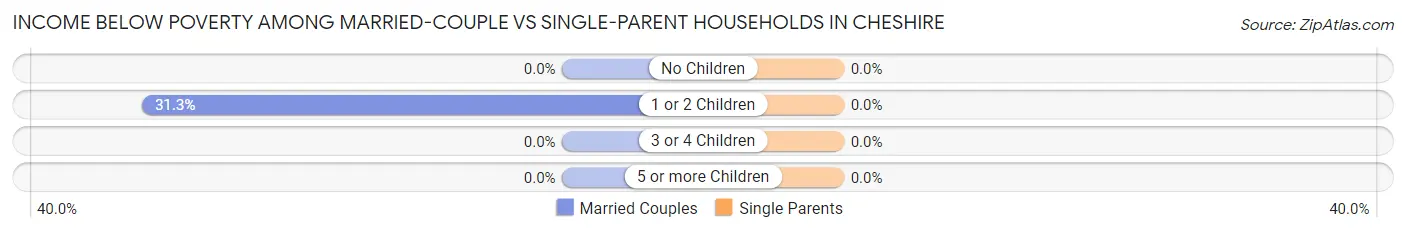
| Children | Married-Couple Families | Single-Parent Households |
| No Children | 0 (0.0%) | 0 (0.0%) |
| 1 or 2 Children | 10 (31.2%) | 0 (0.0%) |
| 3 or 4 Children | 0 (0.0%) | 0 (0.0%) |
| 5 or more Children | 0 (0.0%) | 0 (0.0%) |
| Total | 10 (7.1%) | 0 (0.0%) |
Race in Cheshire
The most populous races in Cheshire are White / Caucasian (547 | 100.0%), and Hispanic or Latino (1 | 0.2%).
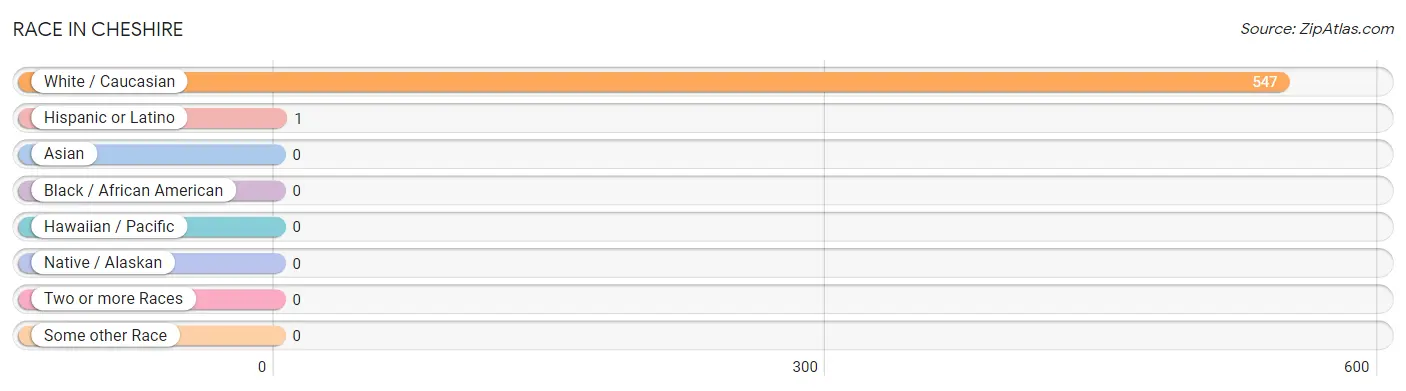
| Race | # Population | % Population |
| Asian | 0 | 0.0% |
| Black / African American | 0 | 0.0% |
| Hawaiian / Pacific | 0 | 0.0% |
| Hispanic or Latino | 1 | 0.2% |
| Native / Alaskan | 0 | 0.0% |
| White / Caucasian | 547 | 100.0% |
| Two or more Races | 0 | 0.0% |
| Some other Race | 0 | 0.0% |
| Total | 547 | 100.0% |
Ancestry in Cheshire
The most populous ancestries reported in Cheshire are Irish (136 | 24.9%), French (100 | 18.3%), Italian (80 | 14.6%), German (77 | 14.1%), and French Canadian (56 | 10.2%), together accounting for 82.1% of all Cheshire residents.
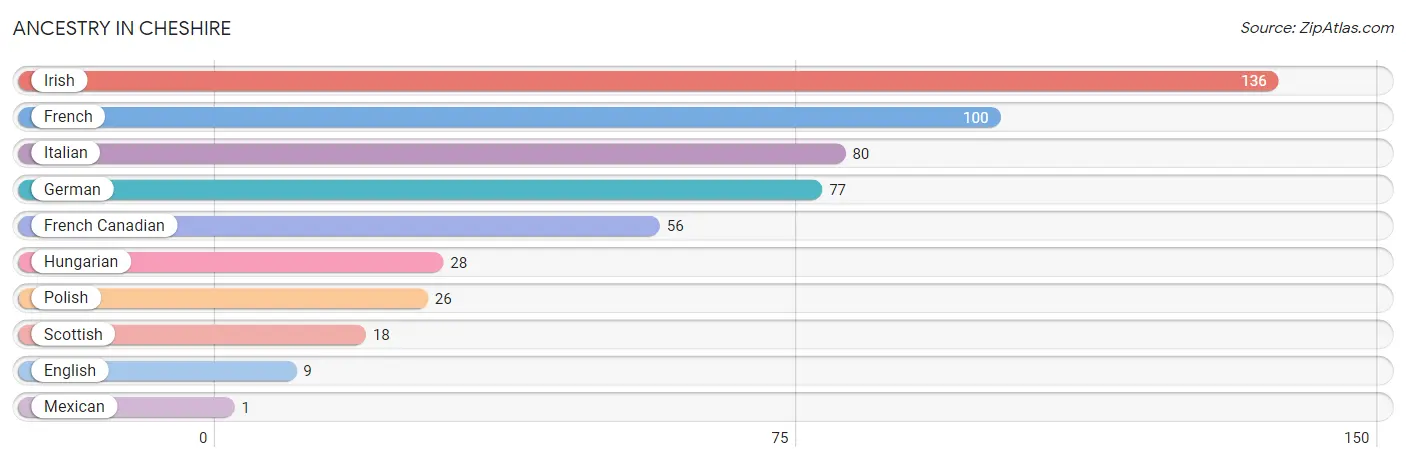
| Ancestry | # Population | % Population |
| English | 9 | 1.7% |
| French | 100 | 18.3% |
| French Canadian | 56 | 10.2% |
| German | 77 | 14.1% |
| Hungarian | 28 | 5.1% |
| Irish | 136 | 24.9% |
| Italian | 80 | 14.6% |
| Mexican | 1 | 0.2% |
| Polish | 26 | 4.8% |
| Scottish | 18 | 3.3% | View All 10 Rows |
Immigrants in Cheshire

| Immigration Origin | # Population | % Population | View All 0 Rows |
Sex and Age in Cheshire
Sex and Age in Cheshire
The most populous age groups in Cheshire are 25 to 29 Years (58 | 27.0%) for men and 70 to 74 Years (100 | 30.1%) for women.
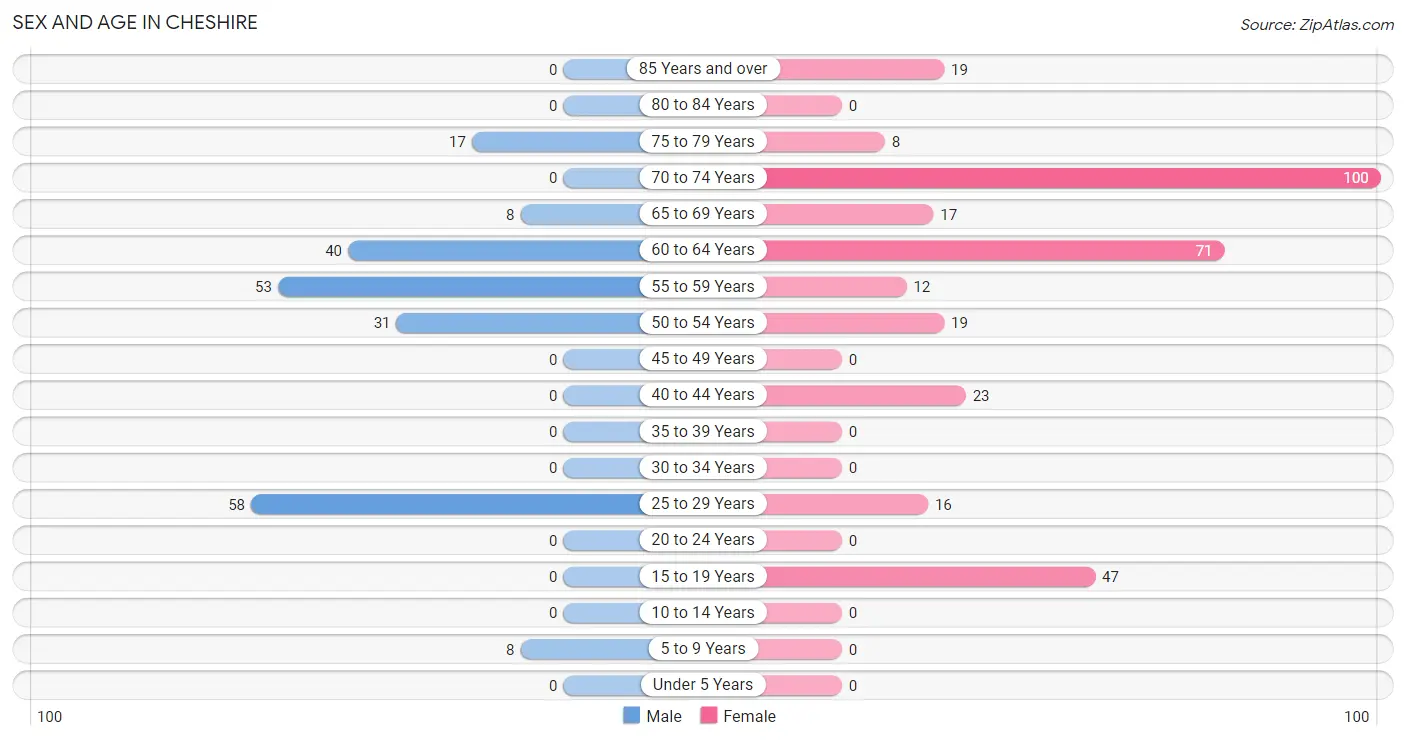
| Age Bracket | Male | Female |
| Under 5 Years | 0 (0.0%) | 0 (0.0%) |
| 5 to 9 Years | 8 (3.7%) | 0 (0.0%) |
| 10 to 14 Years | 0 (0.0%) | 0 (0.0%) |
| 15 to 19 Years | 0 (0.0%) | 47 (14.2%) |
| 20 to 24 Years | 0 (0.0%) | 0 (0.0%) |
| 25 to 29 Years | 58 (27.0%) | 16 (4.8%) |
| 30 to 34 Years | 0 (0.0%) | 0 (0.0%) |
| 35 to 39 Years | 0 (0.0%) | 0 (0.0%) |
| 40 to 44 Years | 0 (0.0%) | 23 (6.9%) |
| 45 to 49 Years | 0 (0.0%) | 0 (0.0%) |
| 50 to 54 Years | 31 (14.4%) | 19 (5.7%) |
| 55 to 59 Years | 53 (24.6%) | 12 (3.6%) |
| 60 to 64 Years | 40 (18.6%) | 71 (21.4%) |
| 65 to 69 Years | 8 (3.7%) | 17 (5.1%) |
| 70 to 74 Years | 0 (0.0%) | 100 (30.1%) |
| 75 to 79 Years | 17 (7.9%) | 8 (2.4%) |
| 80 to 84 Years | 0 (0.0%) | 0 (0.0%) |
| 85 Years and over | 0 (0.0%) | 19 (5.7%) |
| Total | 215 (100.0%) | 332 (100.0%) |
Families and Households in Cheshire
Median Family Size in Cheshire
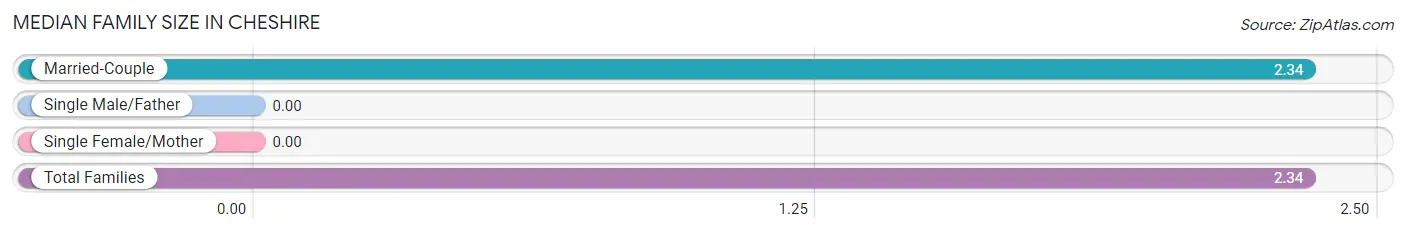
| Family Type | # Families | Family Size |
| Married-Couple | 140 (100.0%) | 2.34 |
| Single Male/Father | 0 (0.0%) | - |
| Single Female/Mother | 0 (0.0%) | - |
| Total Families | 140 (100.0%) | 2.34 |
Median Household Size in Cheshire
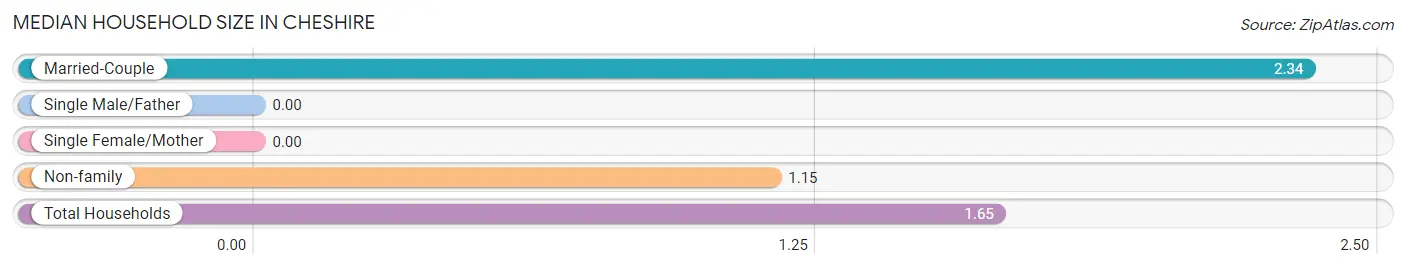
| Household Type | # Households | Household Size |
| Married-Couple | 140 (42.4%) | 2.34 |
| Single Male/Father | 0 (0.0%) | - |
| Single Female/Mother | 0 (0.0%) | - |
| Non-family | 190 (57.6%) | 1.15 |
| Total Households | 330 (100.0%) | 1.65 |
Household Size by Marriage Status in Cheshire
Out of a total of 330 households in Cheshire, 140 (42.4%) are family households, while 190 (57.6%) are nonfamily households. The most numerous type of family households are 2-person households, comprising 108, and the most common type of nonfamily households are 1-person households, comprising 160.
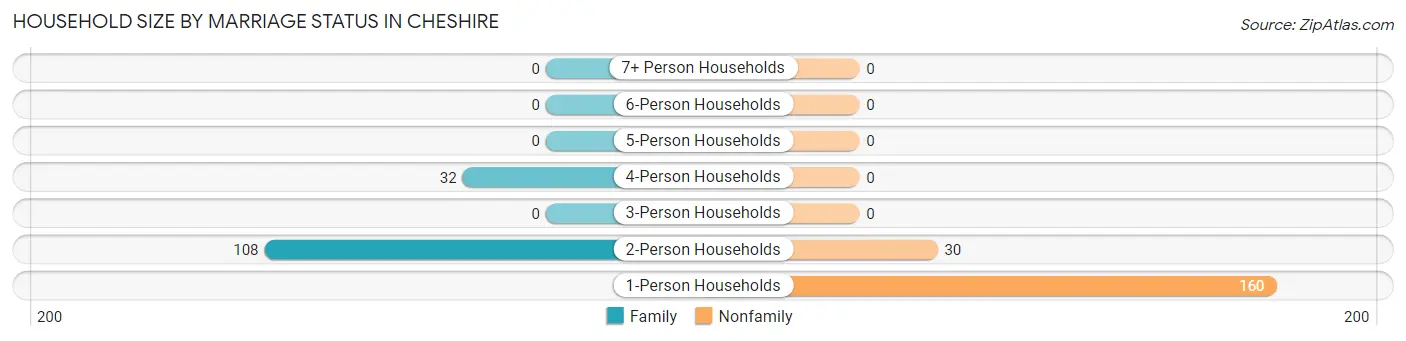
| Household Size | Family Households | Nonfamily Households |
| 1-Person Households | - | 160 (48.5%) |
| 2-Person Households | 108 (32.7%) | 30 (9.1%) |
| 3-Person Households | 0 (0.0%) | 0 (0.0%) |
| 4-Person Households | 32 (9.7%) | 0 (0.0%) |
| 5-Person Households | 0 (0.0%) | 0 (0.0%) |
| 6-Person Households | 0 (0.0%) | 0 (0.0%) |
| 7+ Person Households | 0 (0.0%) | 0 (0.0%) |
| Total | 140 (42.4%) | 190 (57.6%) |
Female Fertility in Cheshire
Fertility by Age in Cheshire
| Age Bracket | Women with Births | Births / 1,000 Women |
| 15 to 19 years | 0 (0.0%) | 0.0 |
| 20 to 34 years | 0 (0.0%) | 0.0 |
| 35 to 50 years | 0 (0.0%) | 0.0 |
| Total | 0 (0.0%) | 0.0 |
Fertility by Age by Marriage Status in Cheshire
| Age Bracket | Married | Unmarried |
| 15 to 19 years | 0 (0.0%) | 0 (0.0%) |
| 20 to 34 years | 0 (0.0%) | 0 (0.0%) |
| 35 to 50 years | 0 (0.0%) | 0 (0.0%) |
| Total | 0 (0.0%) | 0 (0.0%) |
Fertility by Education in Cheshire
| Educational Attainment | Women with Births | Births / 1,000 Women |
| Less than High School | 0 (0.0%) | 0.0 |
| High School Diploma | 0 (0.0%) | 0.0 |
| College or Associate's Degree | 0 (0.0%) | 0.0 |
| Bachelor's Degree | 0 (0.0%) | 0.0 |
| Graduate Degree | 0 (0.0%) | 0.0 |
| Total | 0 (0.0%) | 0.0 |
Fertility by Education by Marriage Status in Cheshire
| Educational Attainment | Married | Unmarried |
| Less than High School | 0 (0.0%) | 0 (0.0%) |
| High School Diploma | 0 (0.0%) | 0 (0.0%) |
| College or Associate's Degree | 0 (0.0%) | 0 (0.0%) |
| Bachelor's Degree | 0 (0.0%) | 0 (0.0%) |
| Graduate Degree | 0 (0.0%) | 0 (0.0%) |
| Total | 0 (0.0%) | 0 (0.0%) |
Employment Characteristics in Cheshire
Employment by Class of Employer in Cheshire
Among the 236 employed individuals in Cheshire, private company employees (108 | 45.8%), local government employees (92 | 39.0%), and not-for-profit organizations (25 | 10.6%) make up the most common classes of employment.
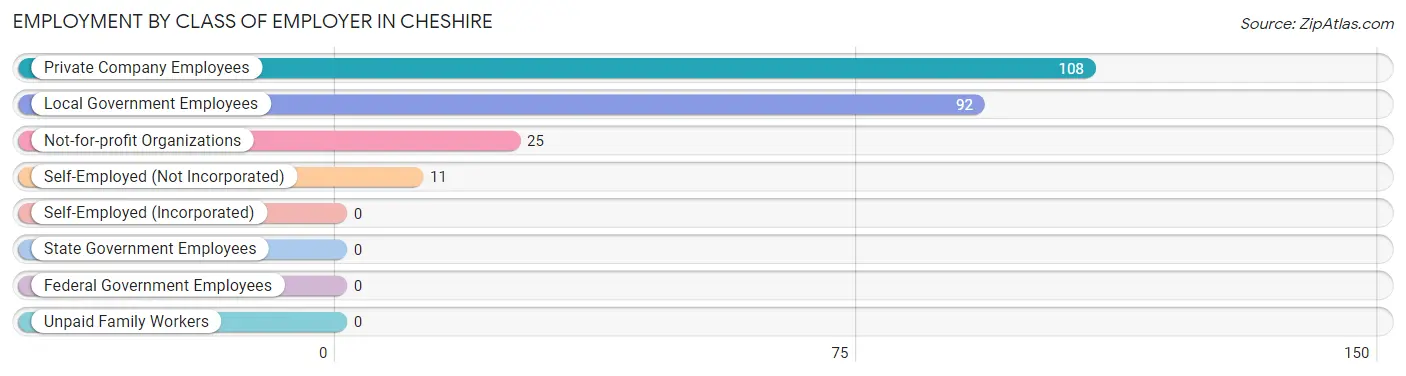
| Employer Class | # Employees | % Employees |
| Private Company Employees | 108 | 45.8% |
| Self-Employed (Incorporated) | 0 | 0.0% |
| Self-Employed (Not Incorporated) | 11 | 4.7% |
| Not-for-profit Organizations | 25 | 10.6% |
| Local Government Employees | 92 | 39.0% |
| State Government Employees | 0 | 0.0% |
| Federal Government Employees | 0 | 0.0% |
| Unpaid Family Workers | 0 | 0.0% |
| Total | 236 | 100.0% |
Employment Status by Age in Cheshire
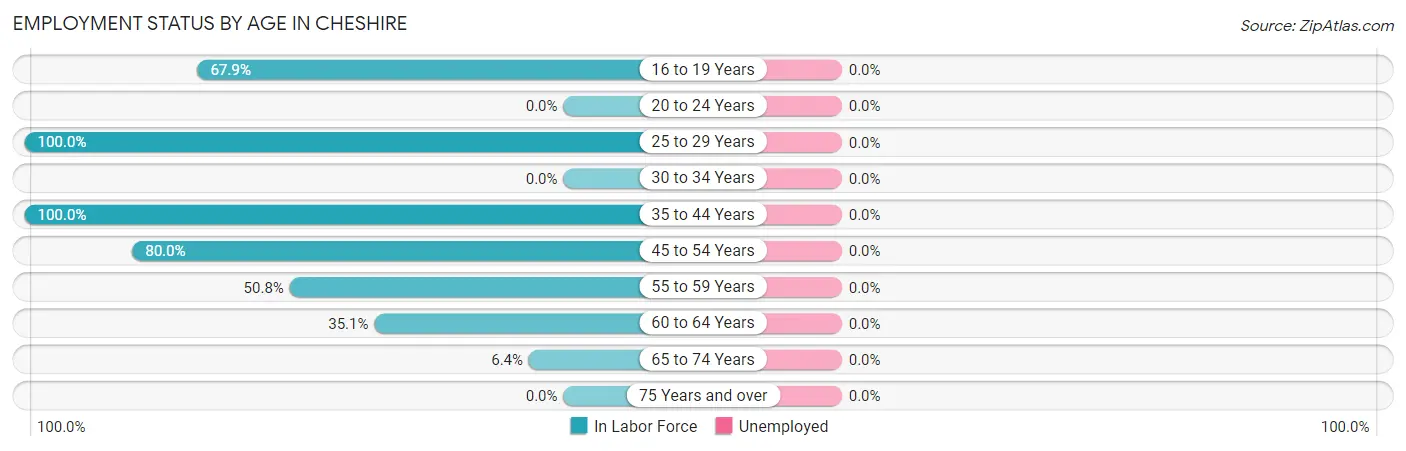
| Age Bracket | In Labor Force | Unemployed |
| 16 to 19 Years | 19 (67.9%) | 0 (0.0%) |
| 20 to 24 Years | 0 (0.0%) | 0 (0.0%) |
| 25 to 29 Years | 74 (100.0%) | 0 (0.0%) |
| 30 to 34 Years | 0 (0.0%) | 0 (0.0%) |
| 35 to 44 Years | 23 (100.0%) | 0 (0.0%) |
| 45 to 54 Years | 40 (80.0%) | 0 (0.0%) |
| 55 to 59 Years | 33 (50.8%) | 0 (0.0%) |
| 60 to 64 Years | 39 (35.1%) | 0 (0.0%) |
| 65 to 74 Years | 8 (6.4%) | 0 (0.0%) |
| 75 Years and over | 0 (0.0%) | 0 (0.0%) |
| Total | 236 (45.4%) | 0 (0.0%) |
Employment Status by Educational Attainment in Cheshire
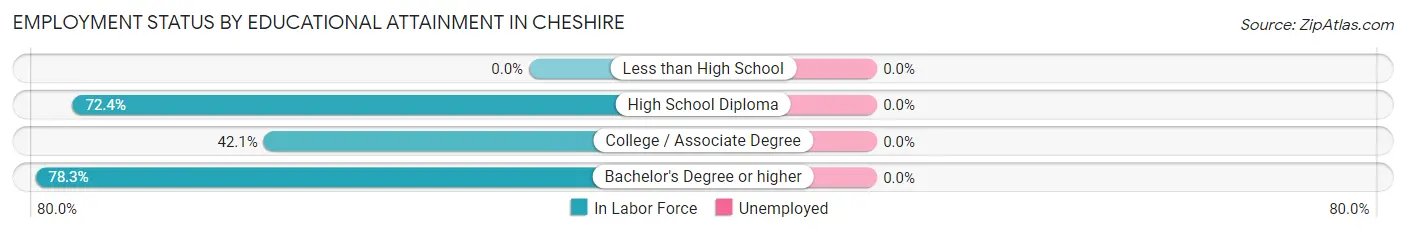
| Educational Attainment | In Labor Force | Unemployed |
| Less than High School | 0 (0.0%) | 0 (0.0%) |
| High School Diploma | 63 (72.4%) | 0 (0.0%) |
| College / Associate Degree | 45 (42.1%) | 0 (0.0%) |
| Bachelor's Degree or higher | 101 (78.3%) | 0 (0.0%) |
| Total | 209 (64.7%) | 0 (0.0%) |
Employment Occupations by Sex in Cheshire
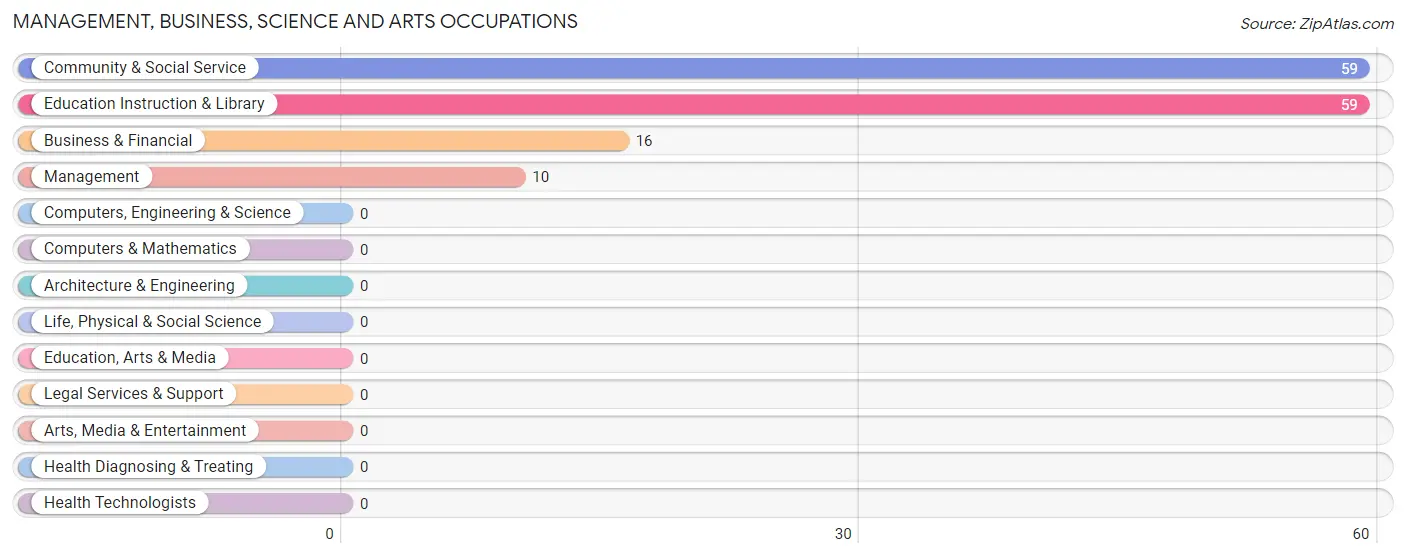
Management, Business, Science and Arts Occupations
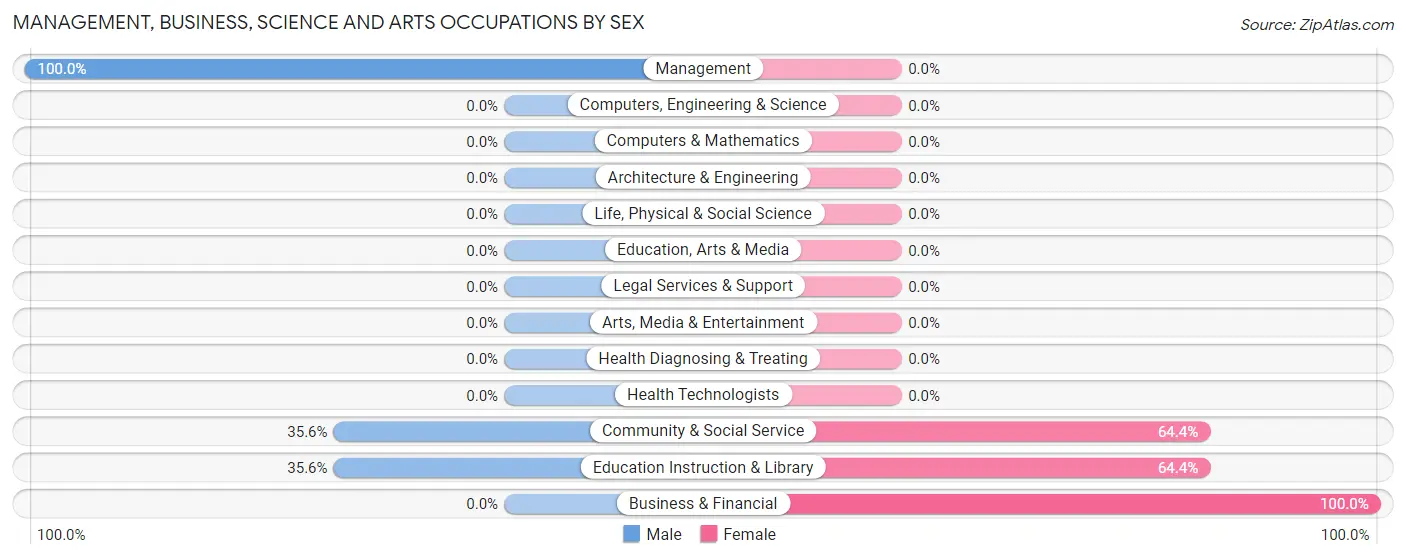
The most common Management, Business, Science and Arts occupations in Cheshire are Community & Social Service (59 | 25.0%), Education Instruction & Library (59 | 25.0%), Business & Financial (16 | 6.8%), and Management (10 | 4.2%).
Management, Business, Science and Arts Occupations by Sex
Within the Management, Business, Science and Arts occupations in Cheshire, the most male-oriented occupations are Management (100.0%), Community & Social Service (35.6%), and Education Instruction & Library (35.6%), while the most female-oriented occupations are Business & Financial (100.0%), Community & Social Service (64.4%), and Education Instruction & Library (64.4%).
| Occupation | Male | Female |
| Management | 10 (100.0%) | 0 (0.0%) |
| Business & Financial | 0 (0.0%) | 16 (100.0%) |
| Computers, Engineering & Science | 0 (0.0%) | 0 (0.0%) |
| Computers & Mathematics | 0 (0.0%) | 0 (0.0%) |
| Architecture & Engineering | 0 (0.0%) | 0 (0.0%) |
| Life, Physical & Social Science | 0 (0.0%) | 0 (0.0%) |
| Community & Social Service | 21 (35.6%) | 38 (64.4%) |
| Education, Arts & Media | 0 (0.0%) | 0 (0.0%) |
| Legal Services & Support | 0 (0.0%) | 0 (0.0%) |
| Education Instruction & Library | 21 (35.6%) | 38 (64.4%) |
| Arts, Media & Entertainment | 0 (0.0%) | 0 (0.0%) |
| Health Diagnosing & Treating | 0 (0.0%) | 0 (0.0%) |
| Health Technologists | 0 (0.0%) | 0 (0.0%) |
| Total (Category) | 31 (36.5%) | 54 (63.5%) |
| Total (Overall) | 128 (54.2%) | 108 (45.8%) |
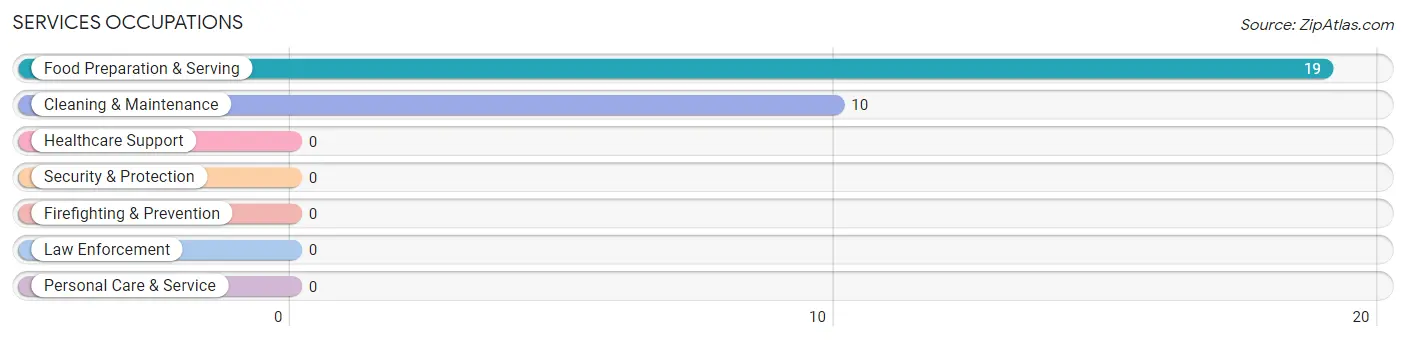
Services Occupations
The most common Services occupations in Cheshire are Food Preparation & Serving (19 | 8.1%), and Cleaning & Maintenance (10 | 4.2%).
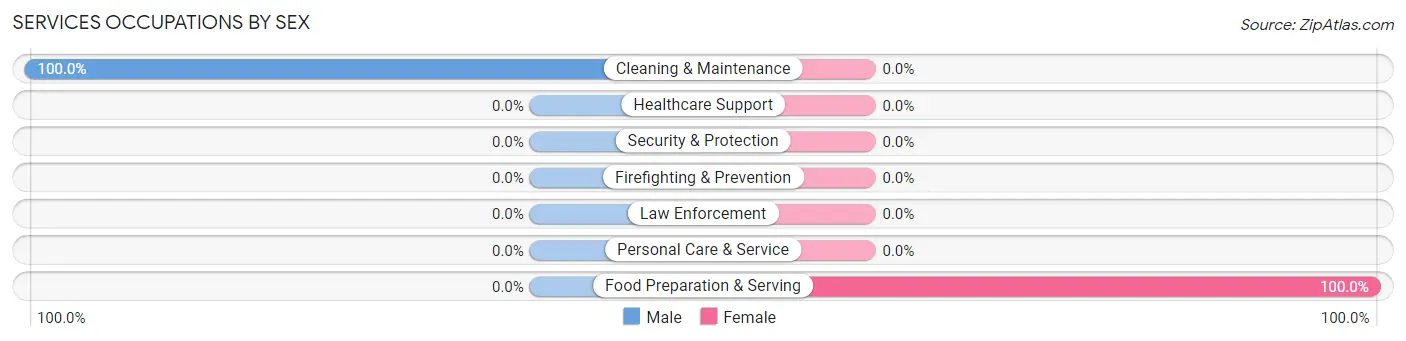
Services Occupations by Sex
| Occupation | Male | Female |
| Healthcare Support | 0 (0.0%) | 0 (0.0%) |
| Security & Protection | 0 (0.0%) | 0 (0.0%) |
| Firefighting & Prevention | 0 (0.0%) | 0 (0.0%) |
| Law Enforcement | 0 (0.0%) | 0 (0.0%) |
| Food Preparation & Serving | 0 (0.0%) | 19 (100.0%) |
| Cleaning & Maintenance | 10 (100.0%) | 0 (0.0%) |
| Personal Care & Service | 0 (0.0%) | 0 (0.0%) |
| Total (Category) | 10 (34.5%) | 19 (65.5%) |
| Total (Overall) | 128 (54.2%) | 108 (45.8%) |
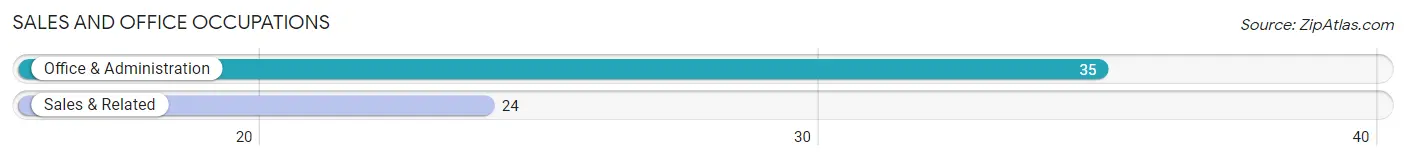
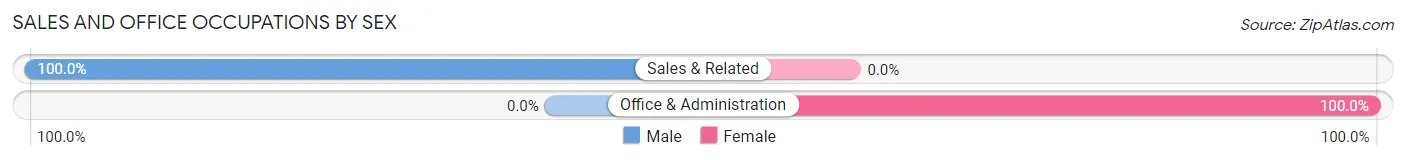
Sales and Office Occupations
The most common Sales and Office occupations in Cheshire are Office & Administration (35 | 14.8%), and Sales & Related (24 | 10.2%).
Sales and Office Occupations by Sex
| Occupation | Male | Female |
| Sales & Related | 24 (100.0%) | 0 (0.0%) |
| Office & Administration | 0 (0.0%) | 35 (100.0%) |
| Total (Category) | 24 (40.7%) | 35 (59.3%) |
| Total (Overall) | 128 (54.2%) | 108 (45.8%) |
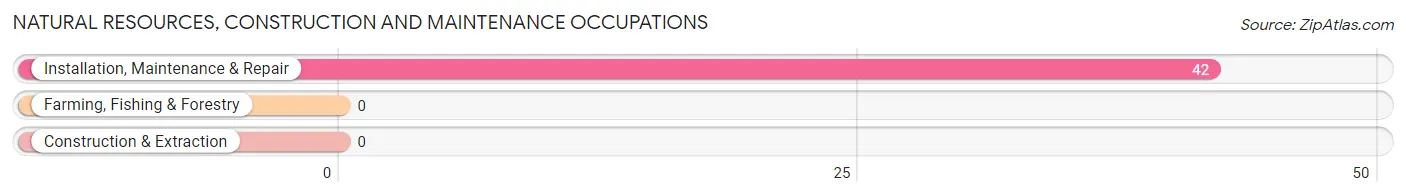
Natural Resources, Construction and Maintenance Occupations
The most common Natural Resources, Construction and Maintenance occupations in Cheshire are , and Installation, Maintenance & Repair (42 | 17.8%).
Natural Resources, Construction and Maintenance Occupations by Sex
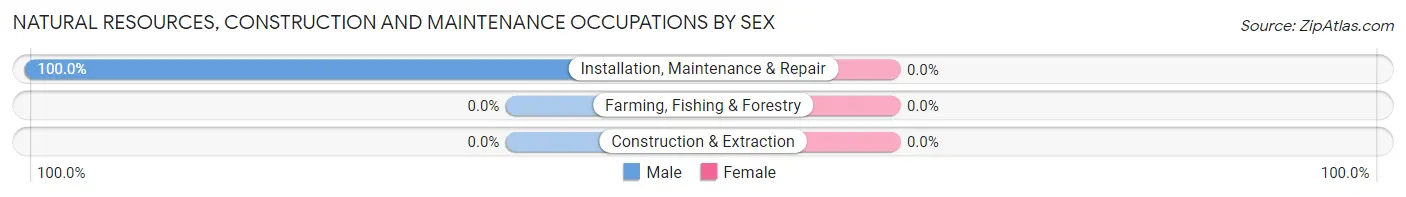
| Occupation | Male | Female |
| Farming, Fishing & Forestry | 0 (0.0%) | 0 (0.0%) |
| Construction & Extraction | 0 (0.0%) | 0 (0.0%) |
| Installation, Maintenance & Repair | 42 (100.0%) | 0 (0.0%) |
| Total (Category) | 42 (100.0%) | 0 (0.0%) |
| Total (Overall) | 128 (54.2%) | 108 (45.8%) |
Production, Transportation and Moving Occupations
The most common Production, Transportation and Moving occupations in Cheshire are , and Production (21 | 8.9%).
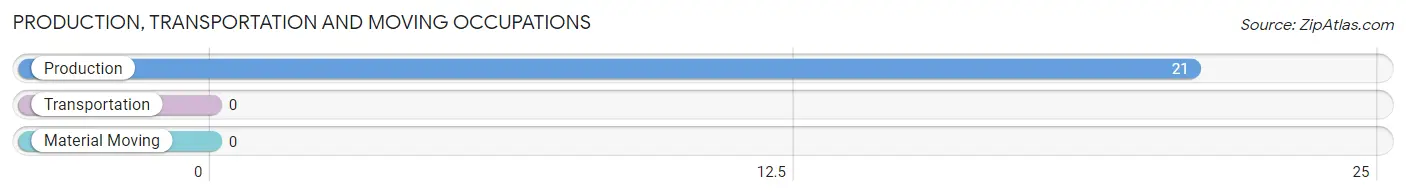
Production, Transportation and Moving Occupations by Sex
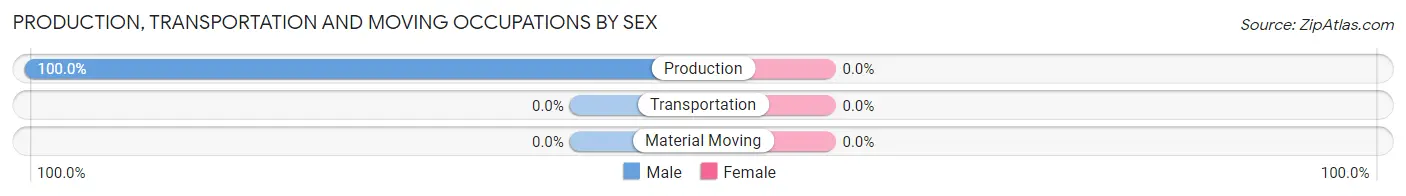
| Occupation | Male | Female |
| Production | 21 (100.0%) | 0 (0.0%) |
| Transportation | 0 (0.0%) | 0 (0.0%) |
| Material Moving | 0 (0.0%) | 0 (0.0%) |
| Total (Category) | 21 (100.0%) | 0 (0.0%) |
| Total (Overall) | 128 (54.2%) | 108 (45.8%) |
Employment Industries by Sex in Cheshire
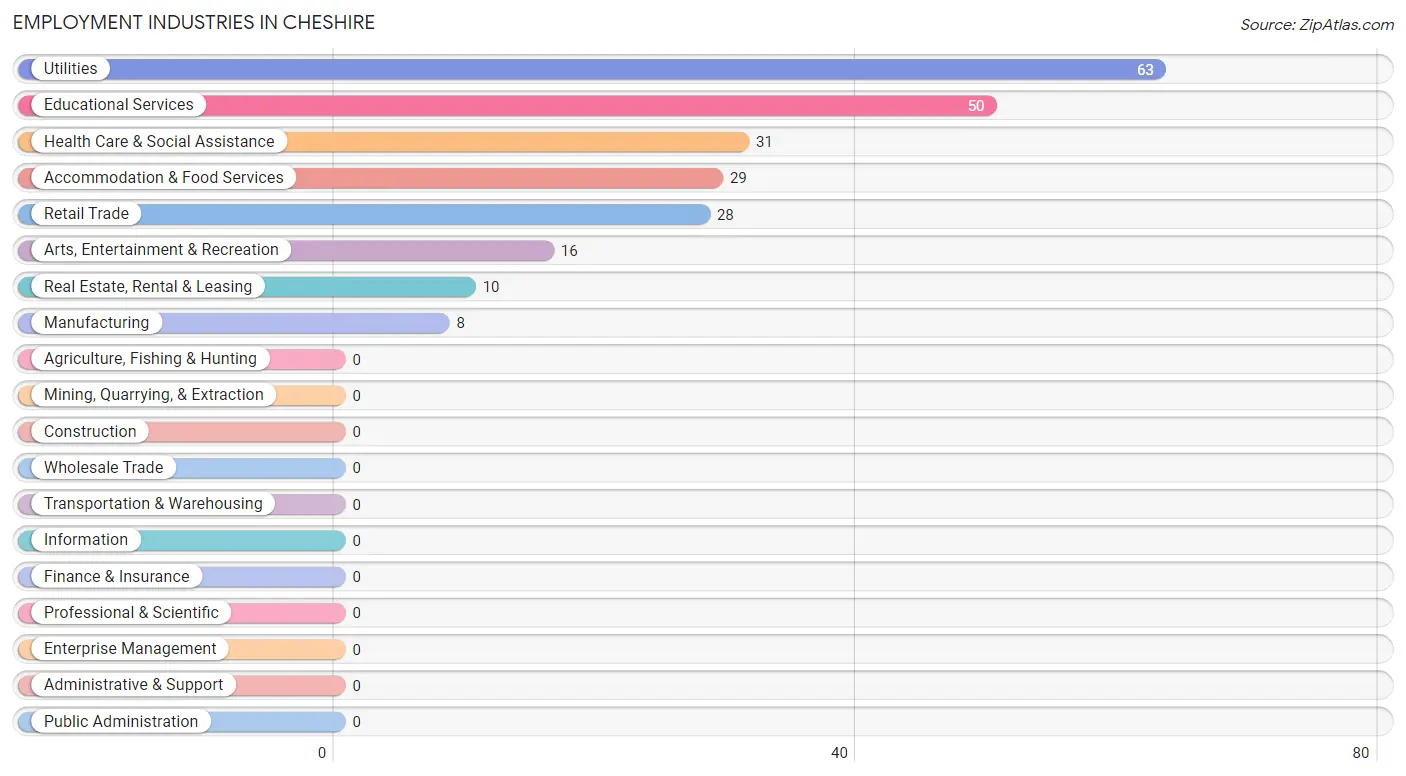
Employment Industries in Cheshire
The major employment industries in Cheshire include Utilities (63 | 26.7%), Educational Services (50 | 21.2%), Health Care & Social Assistance (31 | 13.1%), Accommodation & Food Services (29 | 12.3%), and Retail Trade (28 | 11.9%).
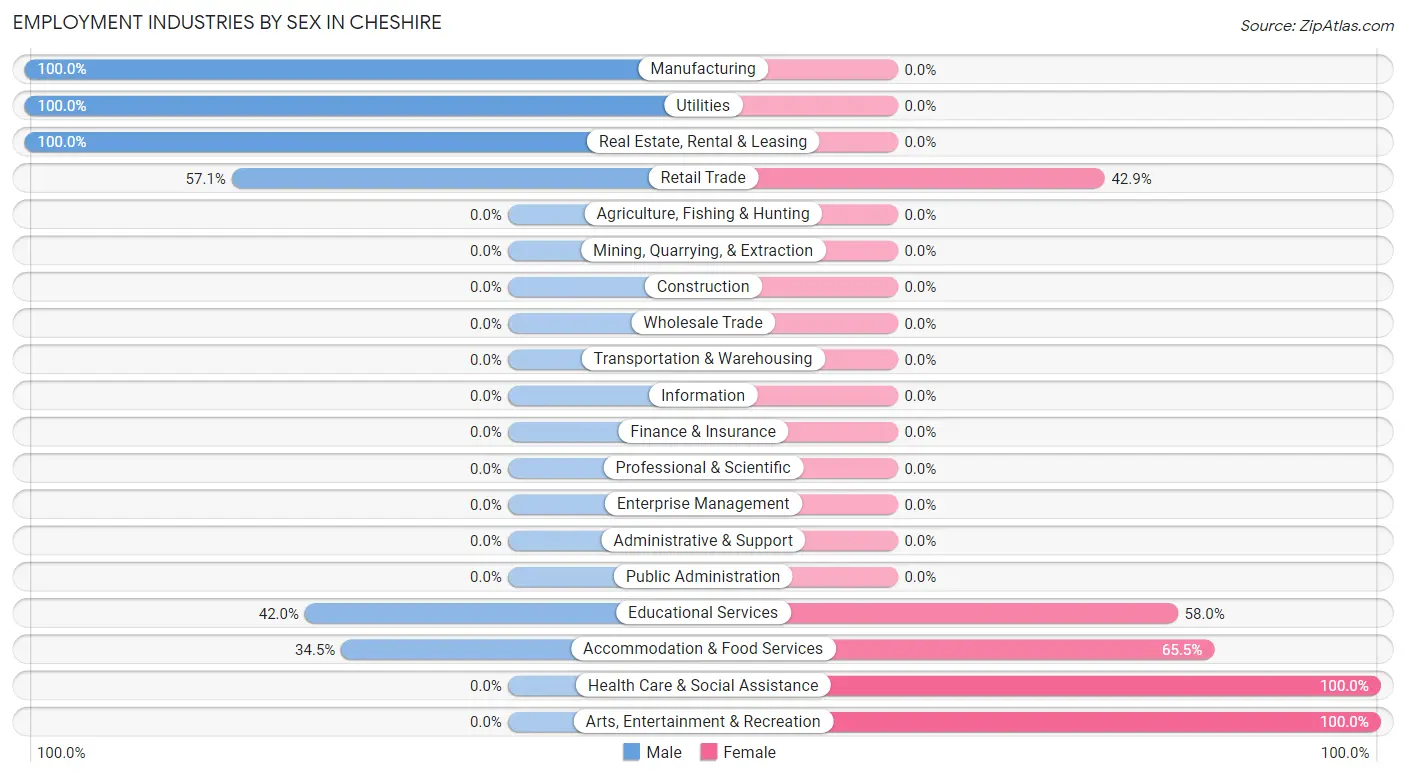
Employment Industries by Sex in Cheshire
The Cheshire industries that see more men than women are Manufacturing (100.0%), Utilities (100.0%), and Real Estate, Rental & Leasing (100.0%), whereas the industries that tend to have a higher number of women are Health Care & Social Assistance (100.0%), Arts, Entertainment & Recreation (100.0%), and Accommodation & Food Services (65.5%).
| Industry | Male | Female |
| Agriculture, Fishing & Hunting | 0 (0.0%) | 0 (0.0%) |
| Mining, Quarrying, & Extraction | 0 (0.0%) | 0 (0.0%) |
| Construction | 0 (0.0%) | 0 (0.0%) |
| Manufacturing | 8 (100.0%) | 0 (0.0%) |
| Wholesale Trade | 0 (0.0%) | 0 (0.0%) |
| Retail Trade | 16 (57.1%) | 12 (42.9%) |
| Transportation & Warehousing | 0 (0.0%) | 0 (0.0%) |
| Utilities | 63 (100.0%) | 0 (0.0%) |
| Information | 0 (0.0%) | 0 (0.0%) |
| Finance & Insurance | 0 (0.0%) | 0 (0.0%) |
| Real Estate, Rental & Leasing | 10 (100.0%) | 0 (0.0%) |
| Professional & Scientific | 0 (0.0%) | 0 (0.0%) |
| Enterprise Management | 0 (0.0%) | 0 (0.0%) |
| Administrative & Support | 0 (0.0%) | 0 (0.0%) |
| Educational Services | 21 (42.0%) | 29 (58.0%) |
| Health Care & Social Assistance | 0 (0.0%) | 31 (100.0%) |
| Arts, Entertainment & Recreation | 0 (0.0%) | 16 (100.0%) |
| Accommodation & Food Services | 10 (34.5%) | 19 (65.5%) |
| Public Administration | 0 (0.0%) | 0 (0.0%) |
| Total | 128 (54.2%) | 108 (45.8%) |
Education in Cheshire
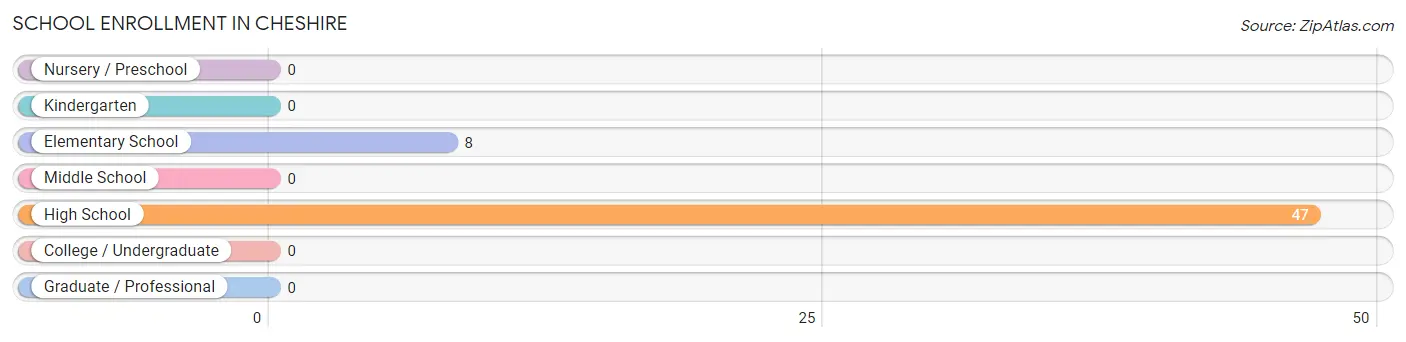
School Enrollment in Cheshire
The most common levels of schooling among the 55 students in Cheshire are high school (47 | 85.5%), and elementary school (8 | 14.5%).
| School Level | # Students | % Students |
| Nursery / Preschool | 0 | 0.0% |
| Kindergarten | 0 | 0.0% |
| Elementary School | 8 | 14.5% |
| Middle School | 0 | 0.0% |
| High School | 47 | 85.5% |
| College / Undergraduate | 0 | 0.0% |
| Graduate / Professional | 0 | 0.0% |
| Total | 55 | 100.0% |
School Enrollment by Age by Funding Source in Cheshire
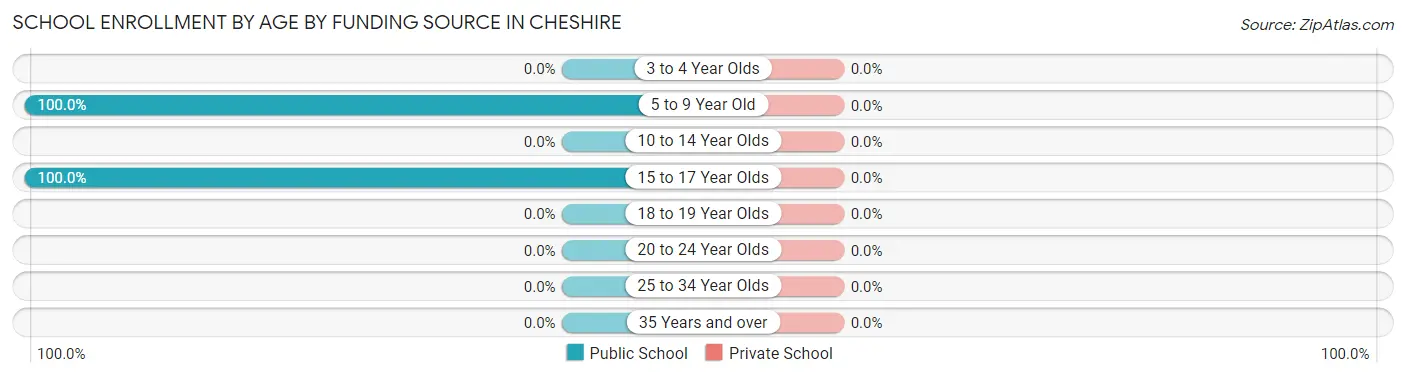
| Age Bracket | Public School | Private School |
| 3 to 4 Year Olds | 0 (0.0%) | 0 (0.0%) |
| 5 to 9 Year Old | 8 (100.0%) | 0 (0.0%) |
| 10 to 14 Year Olds | 0 (0.0%) | 0 (0.0%) |
| 15 to 17 Year Olds | 47 (100.0%) | 0 (0.0%) |
| 18 to 19 Year Olds | 0 (0.0%) | 0 (0.0%) |
| 20 to 24 Year Olds | 0 (0.0%) | 0 (0.0%) |
| 25 to 34 Year Olds | 0 (0.0%) | 0 (0.0%) |
| 35 Years and over | 0 (0.0%) | 0 (0.0%) |
| Total | 55 (100.0%) | 0 (0.0%) |
Educational Attainment by Field of Study in Cheshire
Education (58 | 35.8%), science & technology (53 | 32.7%), business (34 | 21.0%), arts & humanities (9 | 5.6%), and bio, nature & agricultural (8 | 4.9%) are the most common fields of study among 162 individuals in Cheshire who have obtained a bachelor's degree or higher.
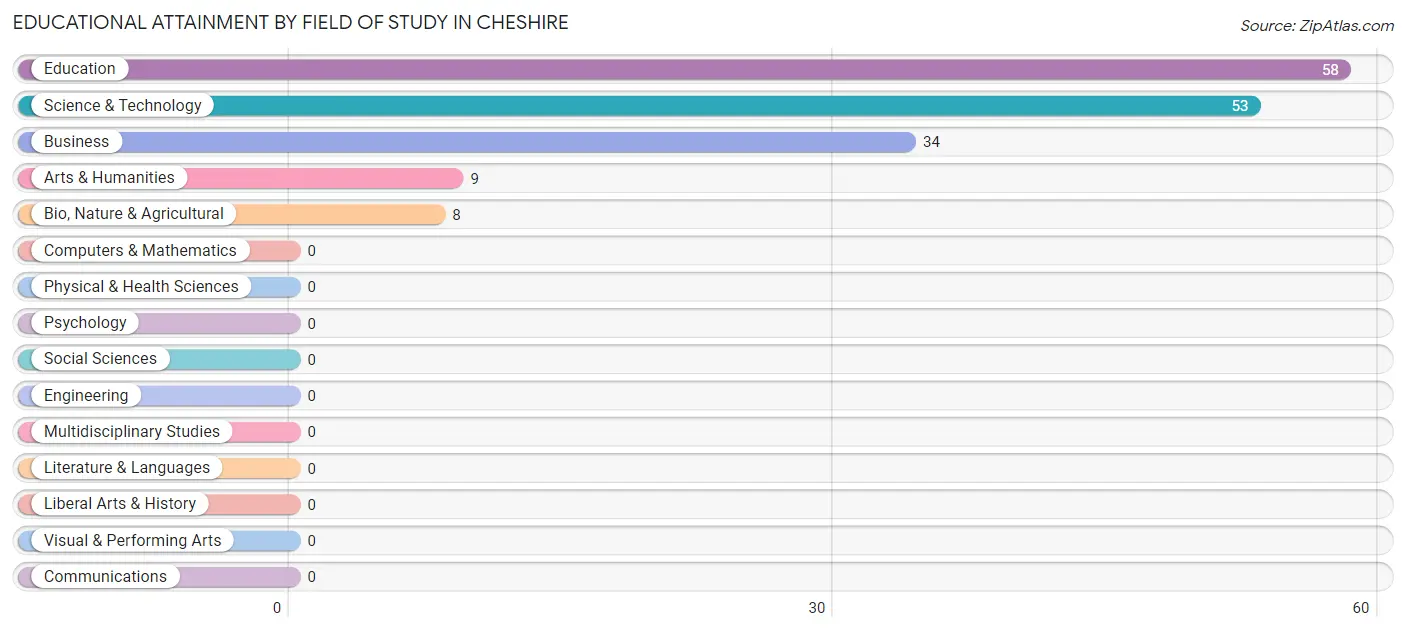
| Field of Study | # Graduates | % Graduates |
| Computers & Mathematics | 0 | 0.0% |
| Bio, Nature & Agricultural | 8 | 4.9% |
| Physical & Health Sciences | 0 | 0.0% |
| Psychology | 0 | 0.0% |
| Social Sciences | 0 | 0.0% |
| Engineering | 0 | 0.0% |
| Multidisciplinary Studies | 0 | 0.0% |
| Science & Technology | 53 | 32.7% |
| Business | 34 | 21.0% |
| Education | 58 | 35.8% |
| Literature & Languages | 0 | 0.0% |
| Liberal Arts & History | 0 | 0.0% |
| Visual & Performing Arts | 0 | 0.0% |
| Communications | 0 | 0.0% |
| Arts & Humanities | 9 | 5.6% |
| Total | 162 | 100.0% |
Transportation & Commute in Cheshire
Vehicle Availability by Sex in Cheshire
The most prevalent vehicle ownership categories in Cheshire are males with 2 vehicles (47, accounting for 36.7%) and females with 2 vehicles (66, making up 43.9%).
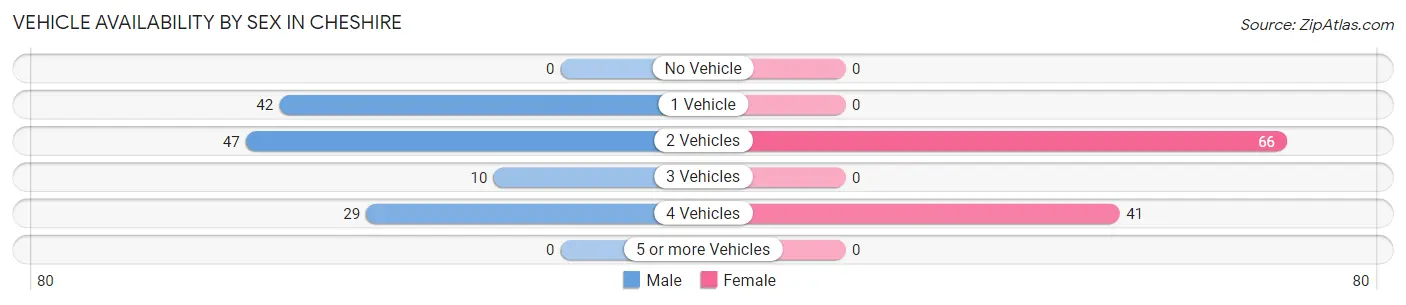
| Vehicles Available | Male | Female |
| No Vehicle | 0 (0.0%) | 0 (0.0%) |
| 1 Vehicle | 42 (32.8%) | 0 (0.0%) |
| 2 Vehicles | 47 (36.7%) | 66 (61.7%) |
| 3 Vehicles | 10 (7.8%) | 0 (0.0%) |
| 4 Vehicles | 29 (22.7%) | 41 (38.3%) |
| 5 or more Vehicles | 0 (0.0%) | 0 (0.0%) |
| Total | 128 (100.0%) | 107 (100.0%) |
Commute Time in Cheshire
The most frequently occuring commute durations in Cheshire are 20 to 24 minutes (91 commuters, 38.6%), 25 to 29 minutes (44 commuters, 18.6%), and 30 to 34 minutes (43 commuters, 18.2%).
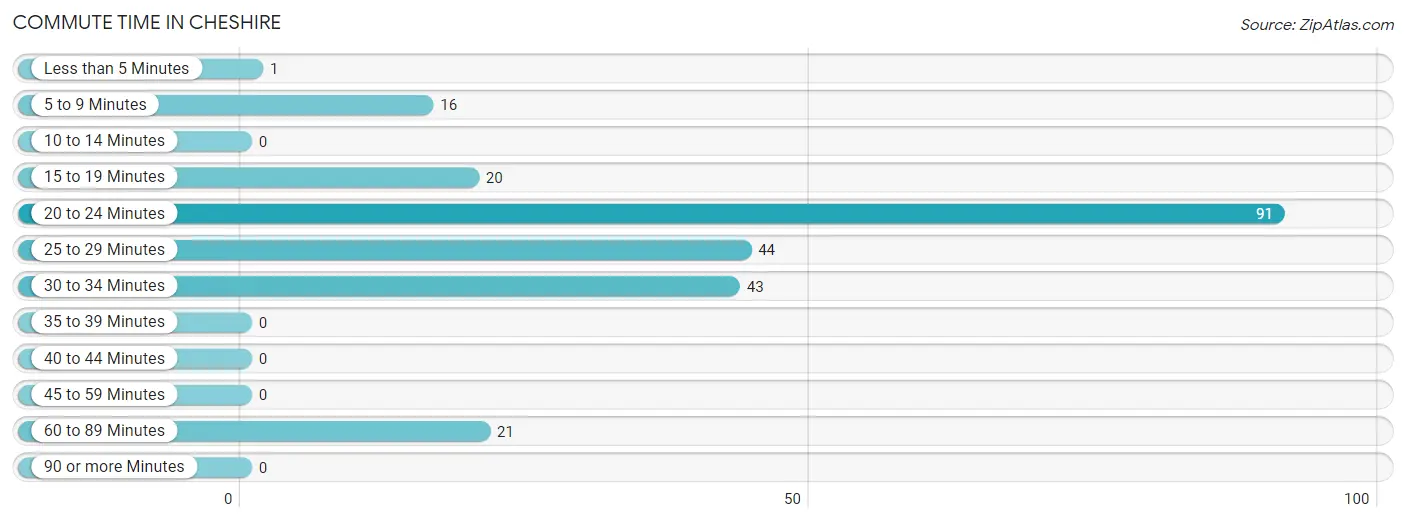
| Commute Time | # Commuters | % Commuters |
| Less than 5 Minutes | 1 | 0.4% |
| 5 to 9 Minutes | 16 | 6.8% |
| 10 to 14 Minutes | 0 | 0.0% |
| 15 to 19 Minutes | 20 | 8.5% |
| 20 to 24 Minutes | 91 | 38.6% |
| 25 to 29 Minutes | 44 | 18.6% |
| 30 to 34 Minutes | 43 | 18.2% |
| 35 to 39 Minutes | 0 | 0.0% |
| 40 to 44 Minutes | 0 | 0.0% |
| 45 to 59 Minutes | 0 | 0.0% |
| 60 to 89 Minutes | 21 | 8.9% |
| 90 or more Minutes | 0 | 0.0% |
Commute Time by Sex in Cheshire
The most common commute times in Cheshire are 20 to 24 minutes (62 commuters, 48.4%) for males and 25 to 29 minutes (44 commuters, 40.7%) for females.
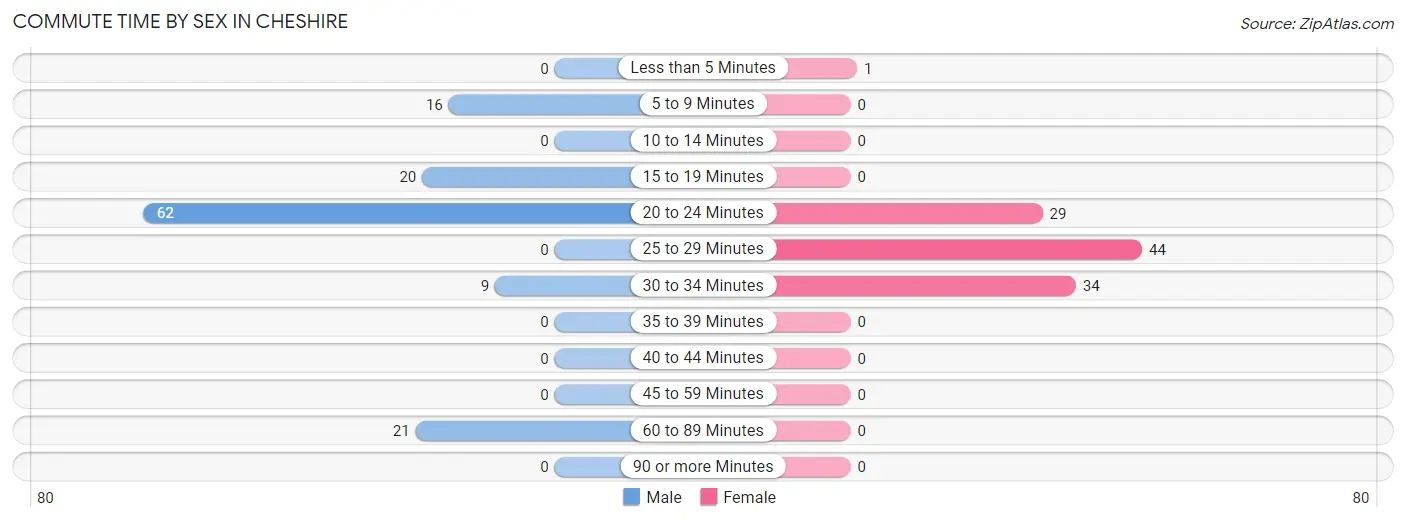
| Commute Time | Male | Female |
| Less than 5 Minutes | 0 (0.0%) | 1 (0.9%) |
| 5 to 9 Minutes | 16 (12.5%) | 0 (0.0%) |
| 10 to 14 Minutes | 0 (0.0%) | 0 (0.0%) |
| 15 to 19 Minutes | 20 (15.6%) | 0 (0.0%) |
| 20 to 24 Minutes | 62 (48.4%) | 29 (26.9%) |
| 25 to 29 Minutes | 0 (0.0%) | 44 (40.7%) |
| 30 to 34 Minutes | 9 (7.0%) | 34 (31.5%) |
| 35 to 39 Minutes | 0 (0.0%) | 0 (0.0%) |
| 40 to 44 Minutes | 0 (0.0%) | 0 (0.0%) |
| 45 to 59 Minutes | 0 (0.0%) | 0 (0.0%) |
| 60 to 89 Minutes | 21 (16.4%) | 0 (0.0%) |
| 90 or more Minutes | 0 (0.0%) | 0 (0.0%) |
Time of Departure to Work by Sex in Cheshire
The most frequent times of departure to work in Cheshire are 7:00 AM to 7:29 AM (42, 32.8%) for males and 7:00 AM to 7:29 AM (54, 50.0%) for females.
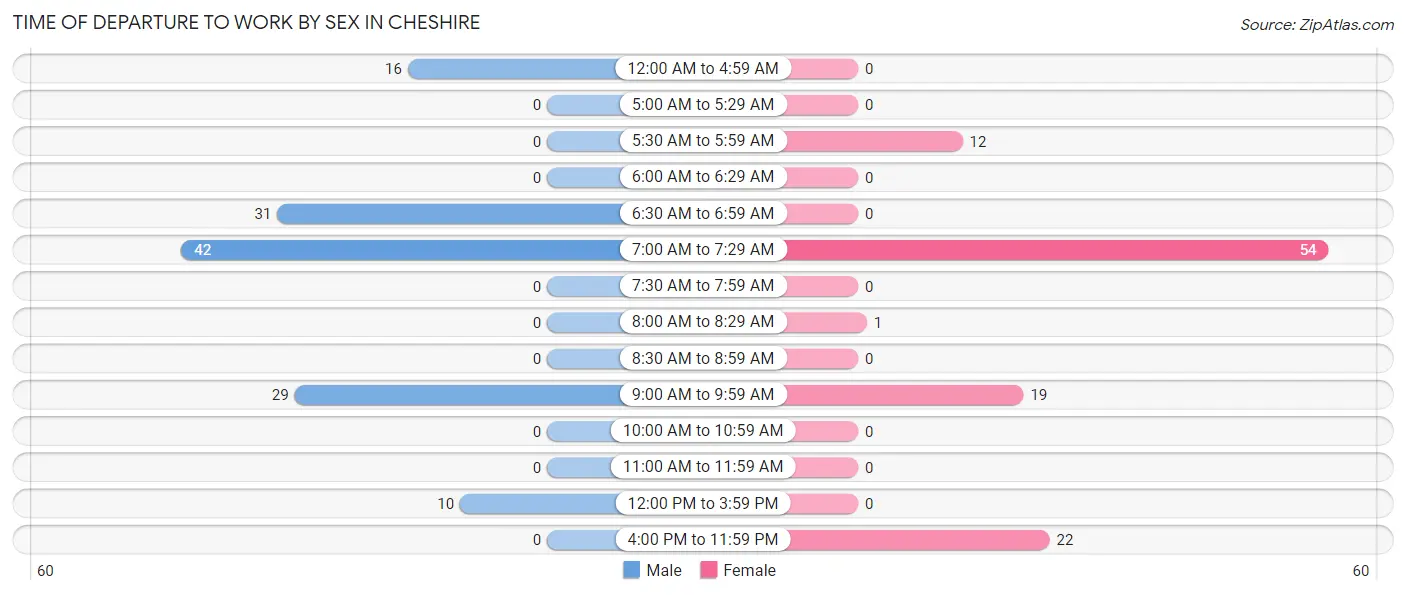
| Time of Departure | Male | Female |
| 12:00 AM to 4:59 AM | 16 (12.5%) | 0 (0.0%) |
| 5:00 AM to 5:29 AM | 0 (0.0%) | 0 (0.0%) |
| 5:30 AM to 5:59 AM | 0 (0.0%) | 12 (11.1%) |
| 6:00 AM to 6:29 AM | 0 (0.0%) | 0 (0.0%) |
| 6:30 AM to 6:59 AM | 31 (24.2%) | 0 (0.0%) |
| 7:00 AM to 7:29 AM | 42 (32.8%) | 54 (50.0%) |
| 7:30 AM to 7:59 AM | 0 (0.0%) | 0 (0.0%) |
| 8:00 AM to 8:29 AM | 0 (0.0%) | 1 (0.9%) |
| 8:30 AM to 8:59 AM | 0 (0.0%) | 0 (0.0%) |
| 9:00 AM to 9:59 AM | 29 (22.7%) | 19 (17.6%) |
| 10:00 AM to 10:59 AM | 0 (0.0%) | 0 (0.0%) |
| 11:00 AM to 11:59 AM | 0 (0.0%) | 0 (0.0%) |
| 12:00 PM to 3:59 PM | 10 (7.8%) | 0 (0.0%) |
| 4:00 PM to 11:59 PM | 0 (0.0%) | 22 (20.4%) |
| Total | 128 (100.0%) | 108 (100.0%) |
Housing Occupancy in Cheshire
Occupancy by Ownership in Cheshire
Of the total 330 dwellings in Cheshire, owner-occupied units account for 274 (83.0%), while renter-occupied units make up 56 (17.0%).
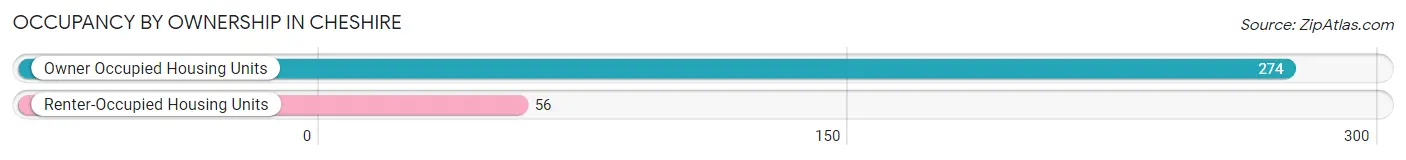
| Occupancy | # Housing Units | % Housing Units |
| Owner Occupied Housing Units | 274 | 83.0% |
| Renter-Occupied Housing Units | 56 | 17.0% |
| Total Occupied Housing Units | 330 | 100.0% |
Occupancy by Household Size in Cheshire
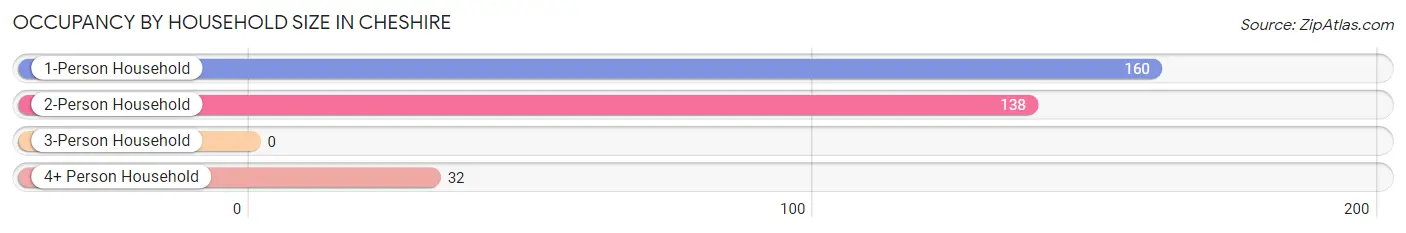
| Household Size | # Housing Units | % Housing Units |
| 1-Person Household | 160 | 48.5% |
| 2-Person Household | 138 | 41.8% |
| 3-Person Household | 0 | 0.0% |
| 4+ Person Household | 32 | 9.7% |
| Total Housing Units | 330 | 100.0% |
Occupancy by Ownership by Household Size in Cheshire
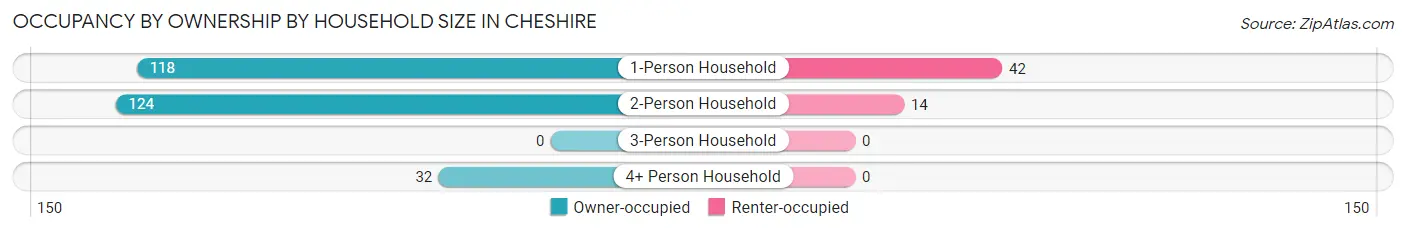
| Household Size | Owner-occupied | Renter-occupied |
| 1-Person Household | 118 (73.8%) | 42 (26.3%) |
| 2-Person Household | 124 (89.9%) | 14 (10.1%) |
| 3-Person Household | 0 (0.0%) | 0 (0.0%) |
| 4+ Person Household | 32 (100.0%) | 0 (0.0%) |
| Total Housing Units | 274 (83.0%) | 56 (17.0%) |
Occupancy by Educational Attainment in Cheshire
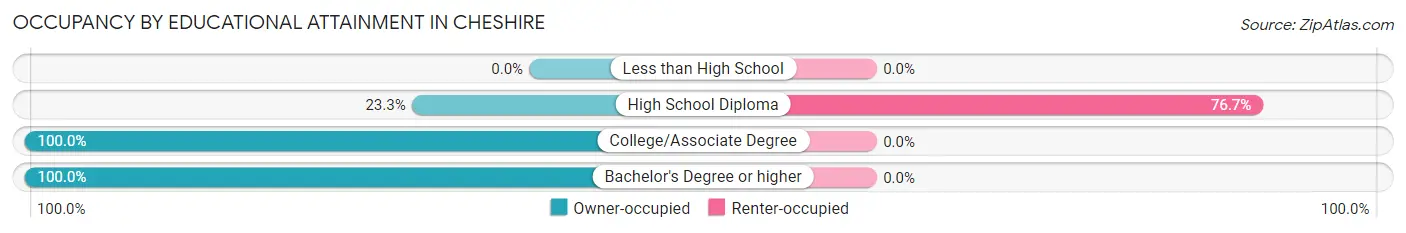
| Household Size | Owner-occupied | Renter-occupied |
| Less than High School | 0 (0.0%) | 0 (0.0%) |
| High School Diploma | 17 (23.3%) | 56 (76.7%) |
| College/Associate Degree | 206 (100.0%) | 0 (0.0%) |
| Bachelor's Degree or higher | 51 (100.0%) | 0 (0.0%) |
Occupancy by Age of Householder in Cheshire
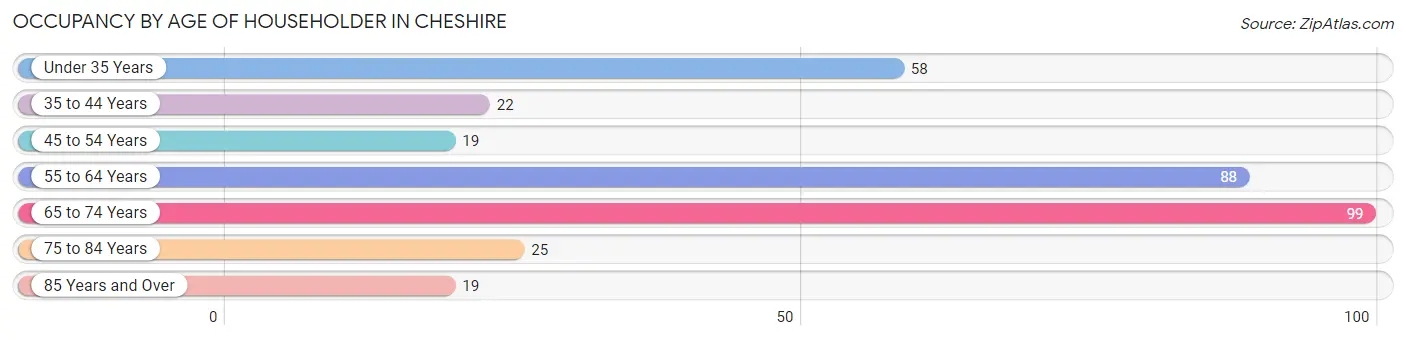
| Age Bracket | # Households | % Households |
| Under 35 Years | 58 | 17.6% |
| 35 to 44 Years | 22 | 6.7% |
| 45 to 54 Years | 19 | 5.8% |
| 55 to 64 Years | 88 | 26.7% |
| 65 to 74 Years | 99 | 30.0% |
| 75 to 84 Years | 25 | 7.6% |
| 85 Years and Over | 19 | 5.8% |
| Total | 330 | 100.0% |
Housing Finances in Cheshire
Median Income by Occupancy in Cheshire
| Occupancy Type | # Households | Median Income |
| Owner-Occupied | 274 (83.0%) | $0 |
| Renter-Occupied | 56 (17.0%) | $0 |
| Average | 330 (100.0%) | $0 |
Occupancy by Householder Income Bracket in Cheshire
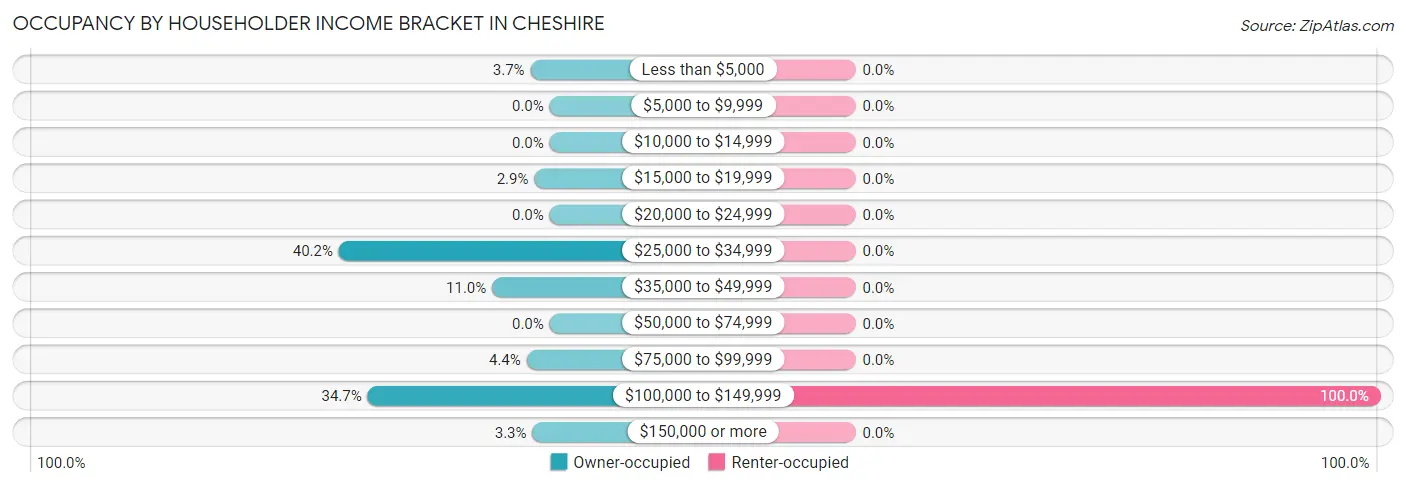
| Income Bracket | Owner-occupied | Renter-occupied |
| Less than $5,000 | 10 (3.6%) | 0 (0.0%) |
| $5,000 to $9,999 | 0 (0.0%) | 0 (0.0%) |
| $10,000 to $14,999 | 0 (0.0%) | 0 (0.0%) |
| $15,000 to $19,999 | 8 (2.9%) | 0 (0.0%) |
| $20,000 to $24,999 | 0 (0.0%) | 0 (0.0%) |
| $25,000 to $34,999 | 110 (40.2%) | 0 (0.0%) |
| $35,000 to $49,999 | 30 (11.0%) | 0 (0.0%) |
| $50,000 to $74,999 | 0 (0.0%) | 0 (0.0%) |
| $75,000 to $99,999 | 12 (4.4%) | 0 (0.0%) |
| $100,000 to $149,999 | 95 (34.7%) | 56 (100.0%) |
| $150,000 or more | 9 (3.3%) | 0 (0.0%) |
| Total | 274 (100.0%) | 56 (100.0%) |
Monthly Housing Cost Tiers in Cheshire
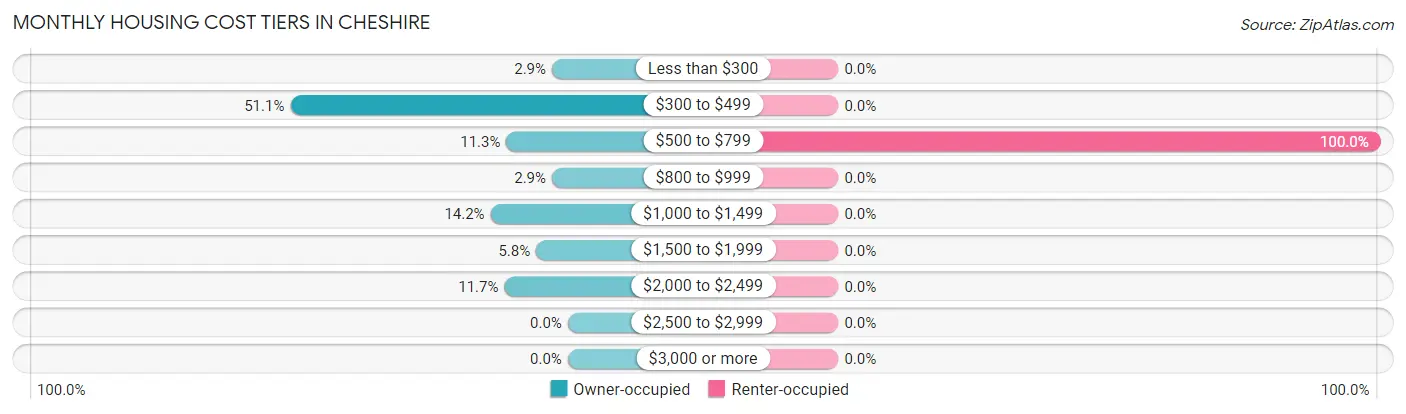
| Monthly Cost | Owner-occupied | Renter-occupied |
| Less than $300 | 8 (2.9%) | 0 (0.0%) |
| $300 to $499 | 140 (51.1%) | 0 (0.0%) |
| $500 to $799 | 31 (11.3%) | 56 (100.0%) |
| $800 to $999 | 8 (2.9%) | 0 (0.0%) |
| $1,000 to $1,499 | 39 (14.2%) | 0 (0.0%) |
| $1,500 to $1,999 | 16 (5.8%) | 0 (0.0%) |
| $2,000 to $2,499 | 32 (11.7%) | 0 (0.0%) |
| $2,500 to $2,999 | 0 (0.0%) | 0 (0.0%) |
| $3,000 or more | 0 (0.0%) | 0 (0.0%) |
| Total | 274 (100.0%) | 56 (100.0%) |
Physical Housing Characteristics in Cheshire
Housing Structures in Cheshire
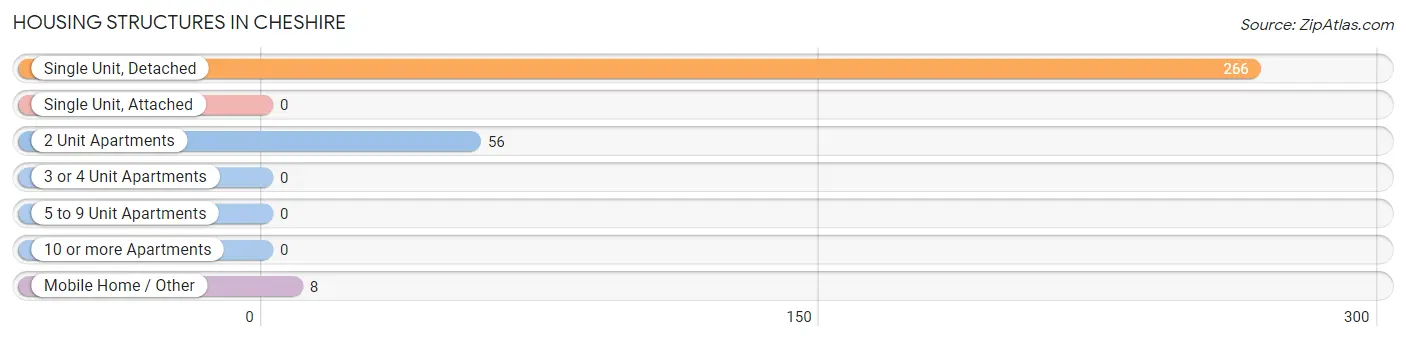
| Structure Type | # Housing Units | % Housing Units |
| Single Unit, Detached | 266 | 80.6% |
| Single Unit, Attached | 0 | 0.0% |
| 2 Unit Apartments | 56 | 17.0% |
| 3 or 4 Unit Apartments | 0 | 0.0% |
| 5 to 9 Unit Apartments | 0 | 0.0% |
| 10 or more Apartments | 0 | 0.0% |
| Mobile Home / Other | 8 | 2.4% |
| Total | 330 | 100.0% |
Housing Structures by Occupancy in Cheshire
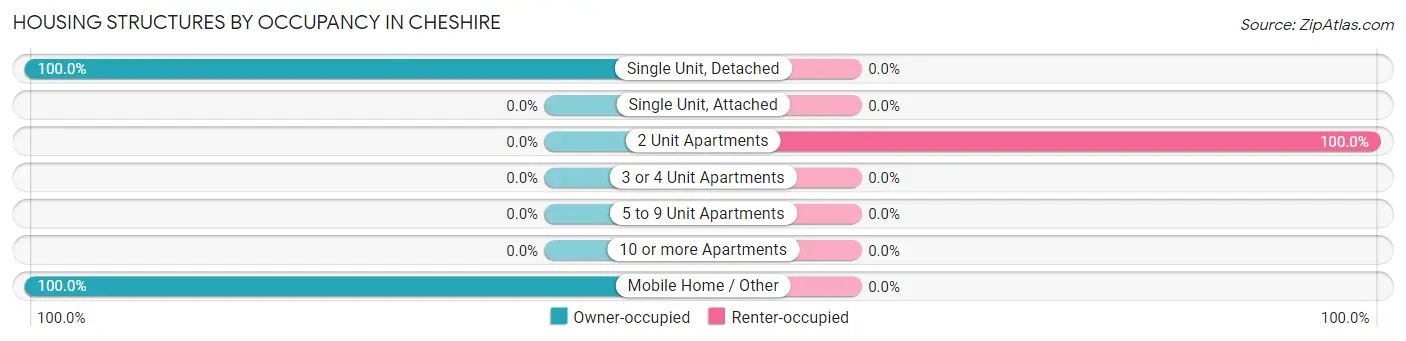
| Structure Type | Owner-occupied | Renter-occupied |
| Single Unit, Detached | 266 (100.0%) | 0 (0.0%) |
| Single Unit, Attached | 0 (0.0%) | 0 (0.0%) |
| 2 Unit Apartments | 0 (0.0%) | 56 (100.0%) |
| 3 or 4 Unit Apartments | 0 (0.0%) | 0 (0.0%) |
| 5 to 9 Unit Apartments | 0 (0.0%) | 0 (0.0%) |
| 10 or more Apartments | 0 (0.0%) | 0 (0.0%) |
| Mobile Home / Other | 8 (100.0%) | 0 (0.0%) |
| Total | 274 (83.0%) | 56 (17.0%) |
Housing Structures by Number of Rooms in Cheshire
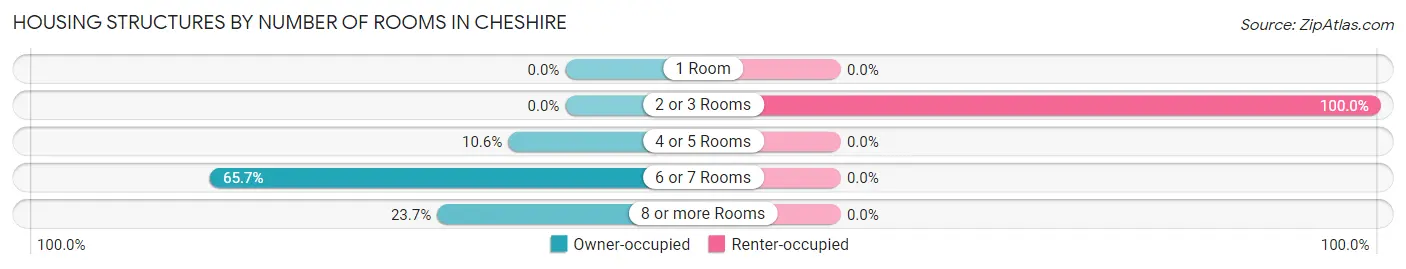
| Number of Rooms | Owner-occupied | Renter-occupied |
| 1 Room | 0 (0.0%) | 0 (0.0%) |
| 2 or 3 Rooms | 0 (0.0%) | 56 (100.0%) |
| 4 or 5 Rooms | 29 (10.6%) | 0 (0.0%) |
| 6 or 7 Rooms | 180 (65.7%) | 0 (0.0%) |
| 8 or more Rooms | 65 (23.7%) | 0 (0.0%) |
| Total | 274 (100.0%) | 56 (100.0%) |
Housing Structure by Heating Type in Cheshire
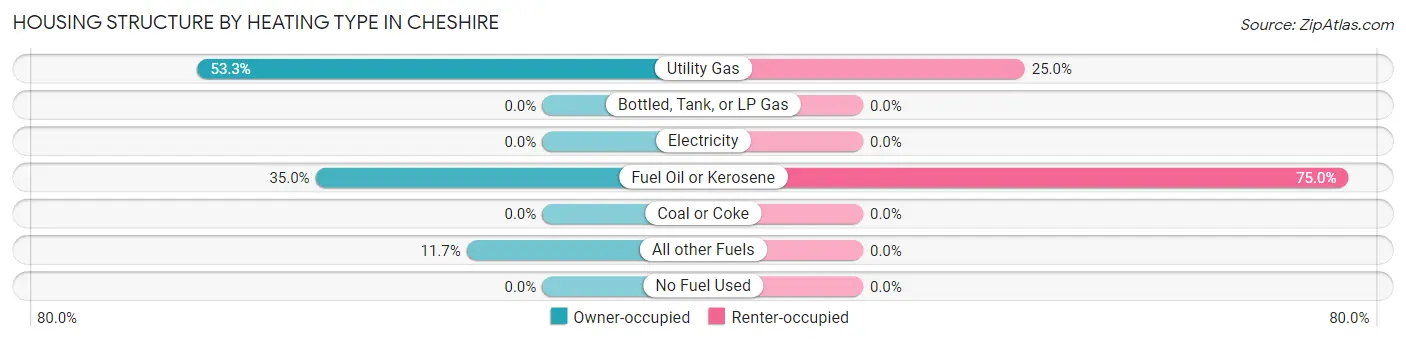
| Heating Type | Owner-occupied | Renter-occupied |
| Utility Gas | 146 (53.3%) | 14 (25.0%) |
| Bottled, Tank, or LP Gas | 0 (0.0%) | 0 (0.0%) |
| Electricity | 0 (0.0%) | 0 (0.0%) |
| Fuel Oil or Kerosene | 96 (35.0%) | 42 (75.0%) |
| Coal or Coke | 0 (0.0%) | 0 (0.0%) |
| All other Fuels | 32 (11.7%) | 0 (0.0%) |
| No Fuel Used | 0 (0.0%) | 0 (0.0%) |
| Total | 274 (100.0%) | 56 (100.0%) |
Household Vehicle Usage in Cheshire
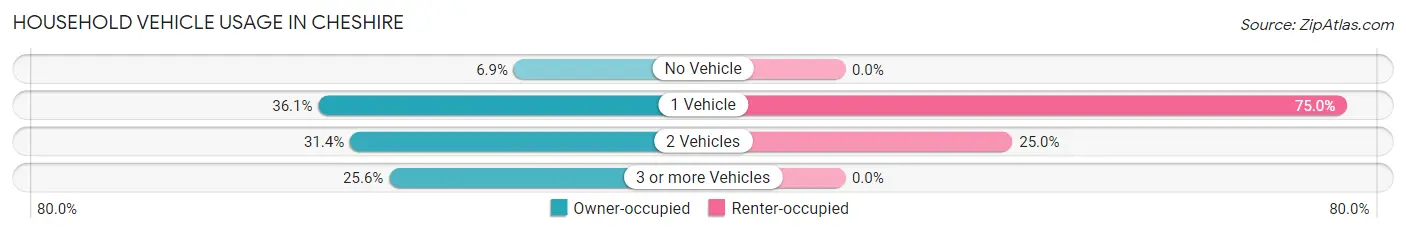
| Vehicles per Household | Owner-occupied | Renter-occupied |
| No Vehicle | 19 (6.9%) | 0 (0.0%) |
| 1 Vehicle | 99 (36.1%) | 42 (75.0%) |
| 2 Vehicles | 86 (31.4%) | 14 (25.0%) |
| 3 or more Vehicles | 70 (25.6%) | 0 (0.0%) |
| Total | 274 (100.0%) | 56 (100.0%) |
Real Estate & Mortgages in Cheshire
Real Estate and Mortgage Overview in Cheshire
| Characteristic | Without Mortgage | With Mortgage |
| Housing Units | 157 | 117 |
| Median Property Value | - | - |
| Median Household Income | $31,602 | $9 |
| Monthly Housing Costs | $332 | $0 |
| Real Estate Taxes | $1,339 | $10 |
Property Value by Mortgage Status in Cheshire
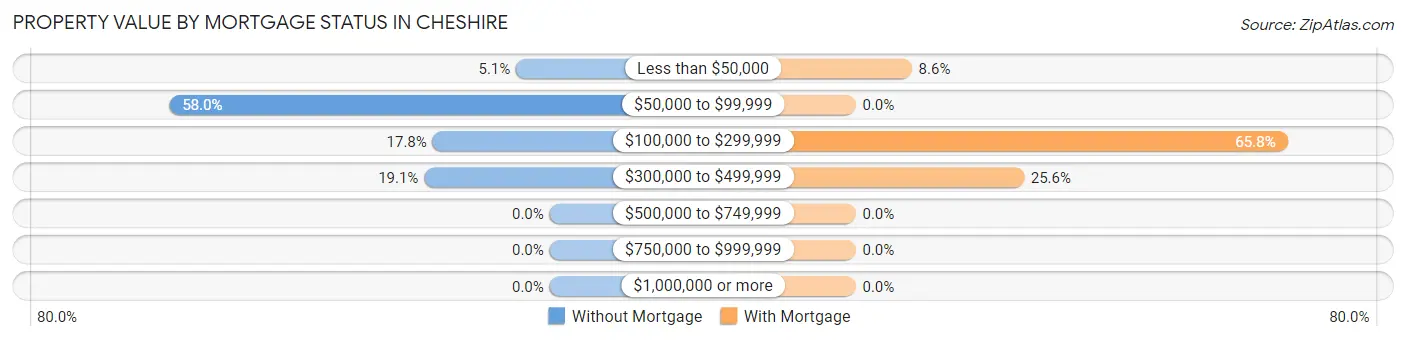
| Property Value | Without Mortgage | With Mortgage |
| Less than $50,000 | 8 (5.1%) | 10 (8.6%) |
| $50,000 to $99,999 | 91 (58.0%) | 0 (0.0%) |
| $100,000 to $299,999 | 28 (17.8%) | 77 (65.8%) |
| $300,000 to $499,999 | 30 (19.1%) | 30 (25.6%) |
| $500,000 to $749,999 | 0 (0.0%) | 0 (0.0%) |
| $750,000 to $999,999 | 0 (0.0%) | 0 (0.0%) |
| $1,000,000 or more | 0 (0.0%) | 0 (0.0%) |
| Total | 157 (100.0%) | 117 (100.0%) |
Household Income by Mortgage Status in Cheshire
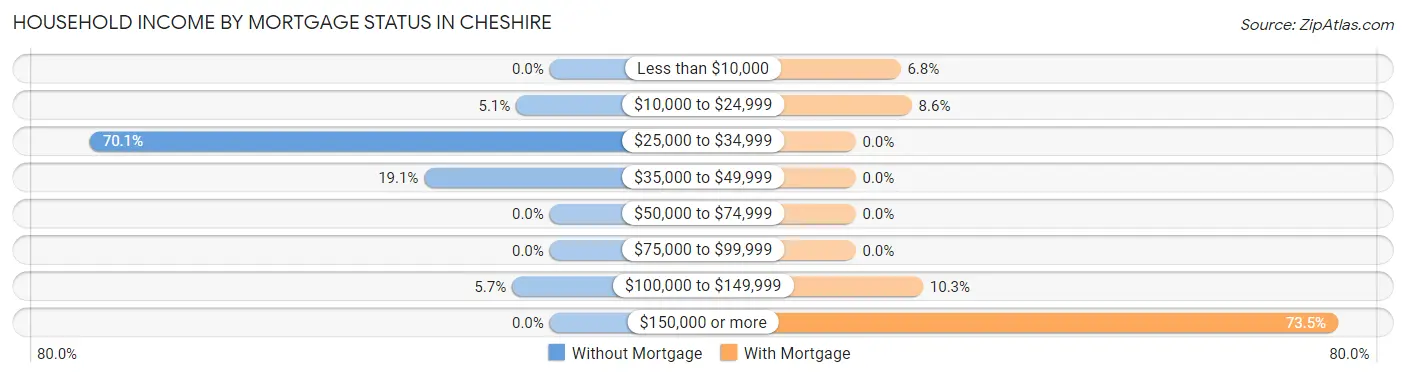
| Household Income | Without Mortgage | With Mortgage |
| Less than $10,000 | 0 (0.0%) | 8 (6.8%) |
| $10,000 to $24,999 | 8 (5.1%) | 10 (8.6%) |
| $25,000 to $34,999 | 110 (70.1%) | 0 (0.0%) |
| $35,000 to $49,999 | 30 (19.1%) | 0 (0.0%) |
| $50,000 to $74,999 | 0 (0.0%) | 0 (0.0%) |
| $75,000 to $99,999 | 0 (0.0%) | 0 (0.0%) |
| $100,000 to $149,999 | 9 (5.7%) | 12 (10.3%) |
| $150,000 or more | 0 (0.0%) | 86 (73.5%) |
| Total | 157 (100.0%) | 117 (100.0%) |
Property Value to Household Income Ratio in Cheshire
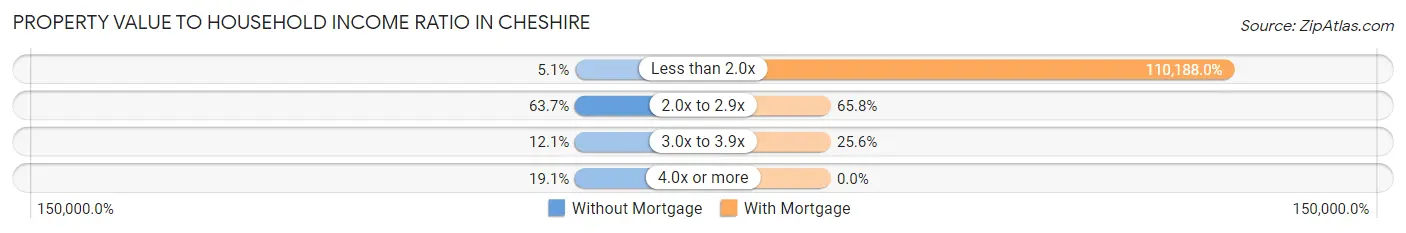
| Value-to-Income Ratio | Without Mortgage | With Mortgage |
| Less than 2.0x | 8 (5.1%) | 128,920 (110,188.0%) |
| 2.0x to 2.9x | 100 (63.7%) | 77 (65.8%) |
| 3.0x to 3.9x | 19 (12.1%) | 30 (25.6%) |
| 4.0x or more | 30 (19.1%) | 0 (0.0%) |
| Total | 157 (100.0%) | 117 (100.0%) |
Real Estate Taxes by Mortgage Status in Cheshire
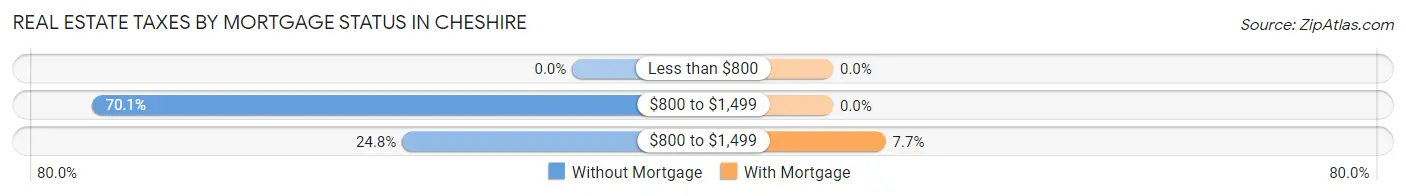
| Property Taxes | Without Mortgage | With Mortgage |
| Less than $800 | 0 (0.0%) | 0 (0.0%) |
| $800 to $1,499 | 110 (70.1%) | 0 (0.0%) |
| $800 to $1,499 | 39 (24.8%) | 9 (7.7%) |
| Total | 157 (100.0%) | 117 (100.0%) |
Health & Disability in Cheshire
Health Insurance Coverage by Age in Cheshire
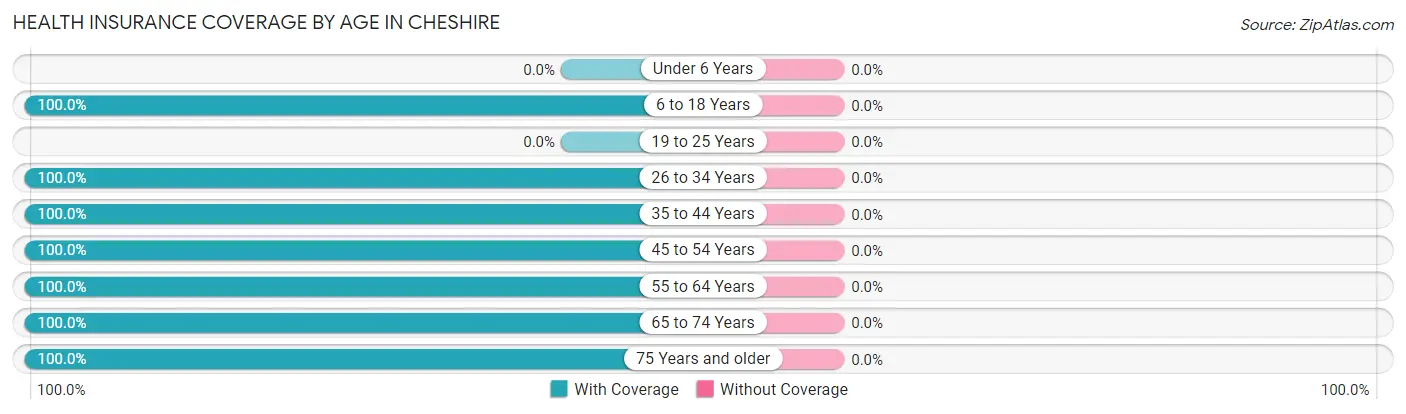
| Age Bracket | With Coverage | Without Coverage |
| Under 6 Years | 0 (0.0%) | 0 (0.0%) |
| 6 to 18 Years | 55 (100.0%) | 0 (0.0%) |
| 19 to 25 Years | 0 (0.0%) | 0 (0.0%) |
| 26 to 34 Years | 74 (100.0%) | 0 (0.0%) |
| 35 to 44 Years | 23 (100.0%) | 0 (0.0%) |
| 45 to 54 Years | 50 (100.0%) | 0 (0.0%) |
| 55 to 64 Years | 176 (100.0%) | 0 (0.0%) |
| 65 to 74 Years | 125 (100.0%) | 0 (0.0%) |
| 75 Years and older | 44 (100.0%) | 0 (0.0%) |
| Total | 547 (100.0%) | 0 (0.0%) |
Health Insurance Coverage by Citizenship Status in Cheshire
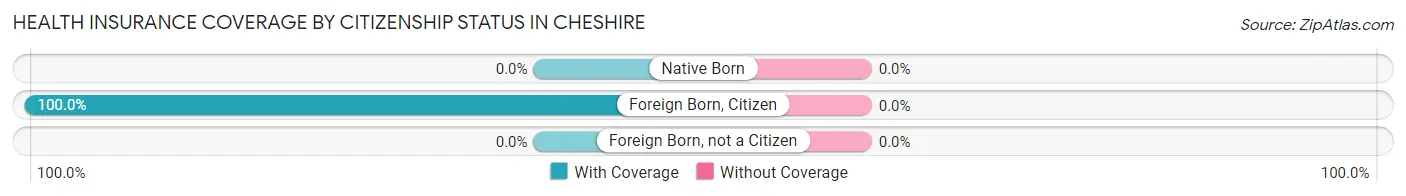
| Citizenship Status | With Coverage | Without Coverage |
| Native Born | 0 (0.0%) | 0 (0.0%) |
| Foreign Born, Citizen | 55 (100.0%) | 0 (0.0%) |
| Foreign Born, not a Citizen | 0 (0.0%) | 0 (0.0%) |
Health Insurance Coverage by Household Income in Cheshire
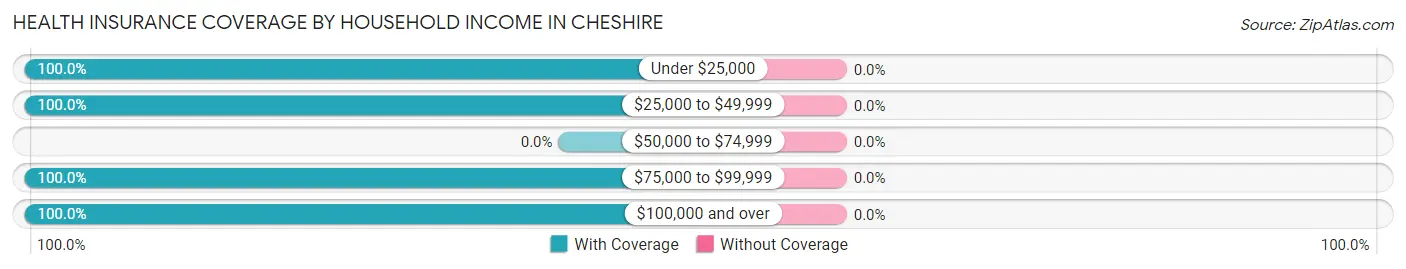
| Household Income | With Coverage | Without Coverage |
| Under $25,000 | 45 (100.0%) | 0 (0.0%) |
| $25,000 to $49,999 | 168 (100.0%) | 0 (0.0%) |
| $50,000 to $74,999 | 0 (0.0%) | 0 (0.0%) |
| $75,000 to $99,999 | 22 (100.0%) | 0 (0.0%) |
| $100,000 and over | 311 (100.0%) | 0 (0.0%) |
Public vs Private Health Insurance Coverage by Age in Cheshire
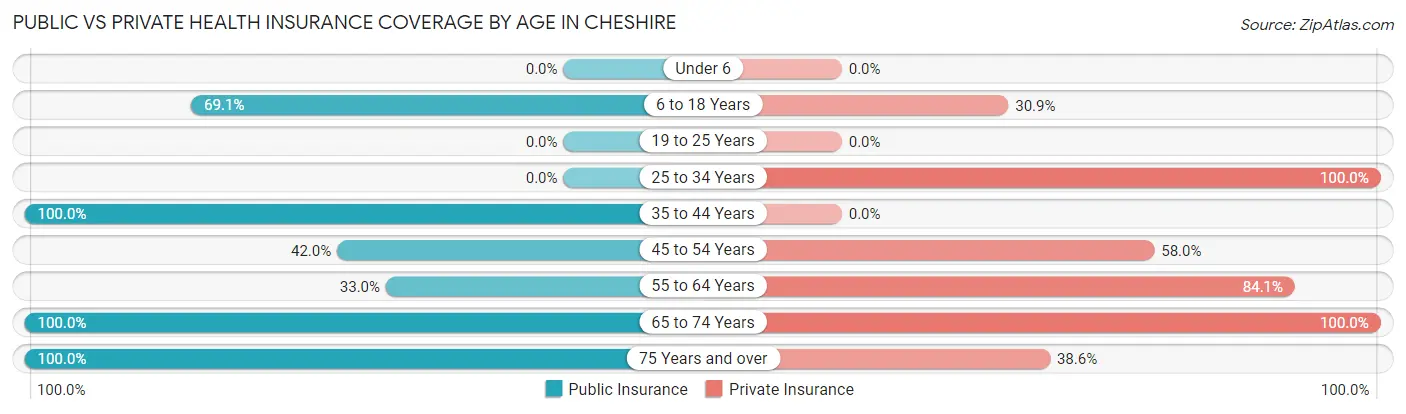
| Age Bracket | Public Insurance | Private Insurance |
| Under 6 | 0 (0.0%) | 0 (0.0%) |
| 6 to 18 Years | 38 (69.1%) | 17 (30.9%) |
| 19 to 25 Years | 0 (0.0%) | 0 (0.0%) |
| 25 to 34 Years | 0 (0.0%) | 74 (100.0%) |
| 35 to 44 Years | 23 (100.0%) | 0 (0.0%) |
| 45 to 54 Years | 21 (42.0%) | 29 (58.0%) |
| 55 to 64 Years | 58 (33.0%) | 148 (84.1%) |
| 65 to 74 Years | 125 (100.0%) | 125 (100.0%) |
| 75 Years and over | 44 (100.0%) | 17 (38.6%) |
| Total | 309 (56.5%) | 410 (75.0%) |
Disability Status by Sex by Age in Cheshire
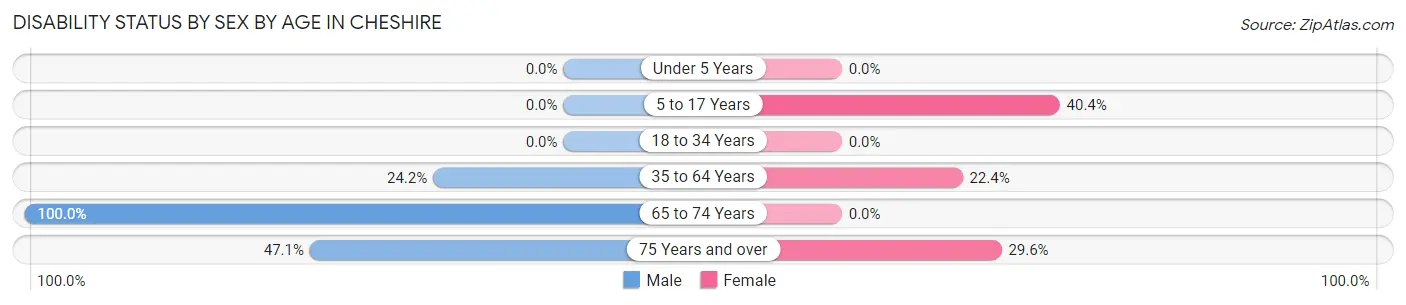
| Age Bracket | Male | Female |
| Under 5 Years | 0 (0.0%) | 0 (0.0%) |
| 5 to 17 Years | 0 (0.0%) | 19 (40.4%) |
| 18 to 34 Years | 0 (0.0%) | 0 (0.0%) |
| 35 to 64 Years | 30 (24.2%) | 28 (22.4%) |
| 65 to 74 Years | 8 (100.0%) | 0 (0.0%) |
| 75 Years and over | 8 (47.1%) | 8 (29.6%) |
Disability Class by Sex by Age in Cheshire
Disability Class: Hearing Difficulty
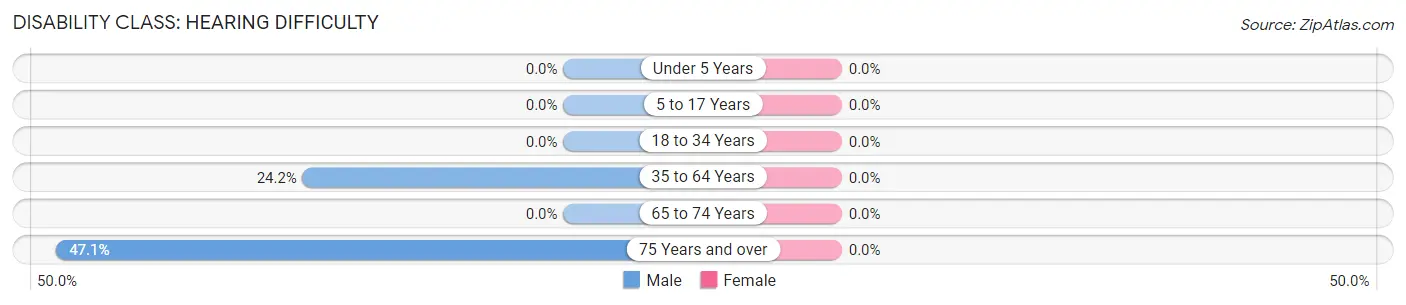
| Age Bracket | Male | Female |
| Under 5 Years | 0 (0.0%) | 0 (0.0%) |
| 5 to 17 Years | 0 (0.0%) | 0 (0.0%) |
| 18 to 34 Years | 0 (0.0%) | 0 (0.0%) |
| 35 to 64 Years | 30 (24.2%) | 0 (0.0%) |
| 65 to 74 Years | 0 (0.0%) | 0 (0.0%) |
| 75 Years and over | 8 (47.1%) | 0 (0.0%) |
Disability Class: Vision Difficulty
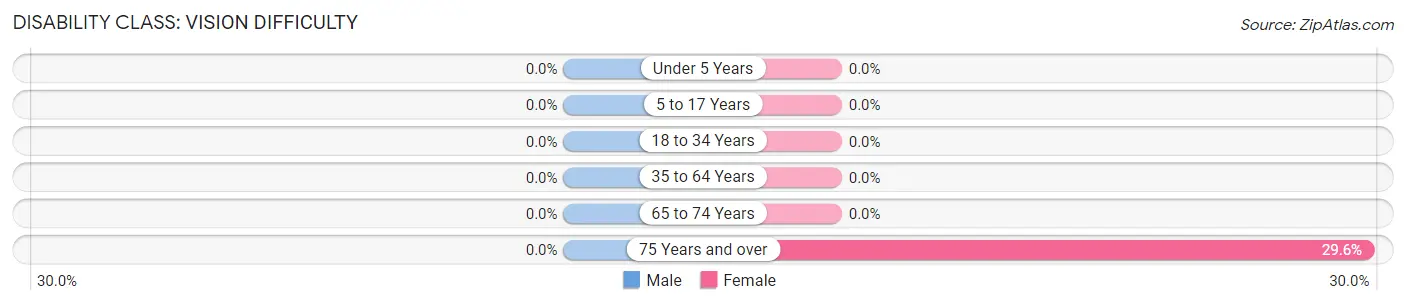
| Age Bracket | Male | Female |
| Under 5 Years | 0 (0.0%) | 0 (0.0%) |
| 5 to 17 Years | 0 (0.0%) | 0 (0.0%) |
| 18 to 34 Years | 0 (0.0%) | 0 (0.0%) |
| 35 to 64 Years | 0 (0.0%) | 0 (0.0%) |
| 65 to 74 Years | 0 (0.0%) | 0 (0.0%) |
| 75 Years and over | 0 (0.0%) | 8 (29.6%) |
Disability Class: Cognitive Difficulty
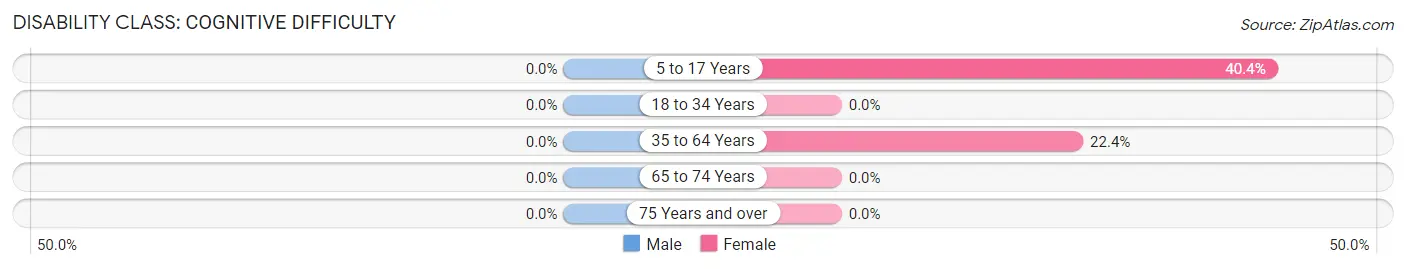
| Age Bracket | Male | Female |
| 5 to 17 Years | 0 (0.0%) | 19 (40.4%) |
| 18 to 34 Years | 0 (0.0%) | 0 (0.0%) |
| 35 to 64 Years | 0 (0.0%) | 28 (22.4%) |
| 65 to 74 Years | 0 (0.0%) | 0 (0.0%) |
| 75 Years and over | 0 (0.0%) | 0 (0.0%) |
Disability Class: Ambulatory Difficulty
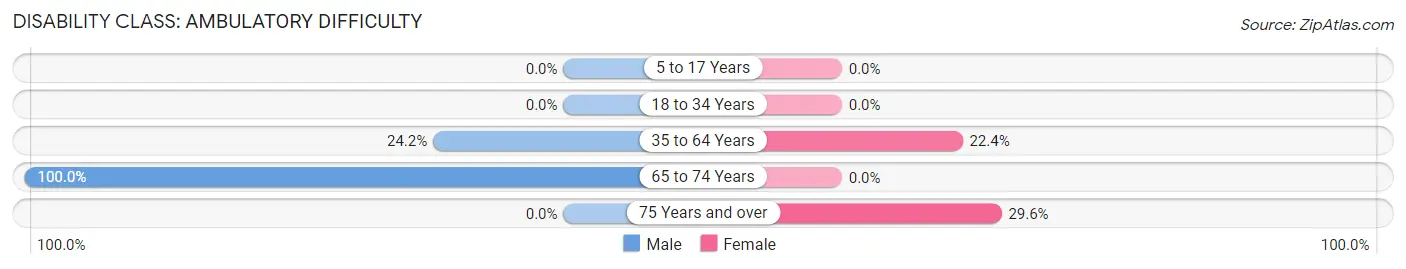
| Age Bracket | Male | Female |
| 5 to 17 Years | 0 (0.0%) | 0 (0.0%) |
| 18 to 34 Years | 0 (0.0%) | 0 (0.0%) |
| 35 to 64 Years | 30 (24.2%) | 28 (22.4%) |
| 65 to 74 Years | 8 (100.0%) | 0 (0.0%) |
| 75 Years and over | 0 (0.0%) | 8 (29.6%) |
Disability Class: Self-Care Difficulty
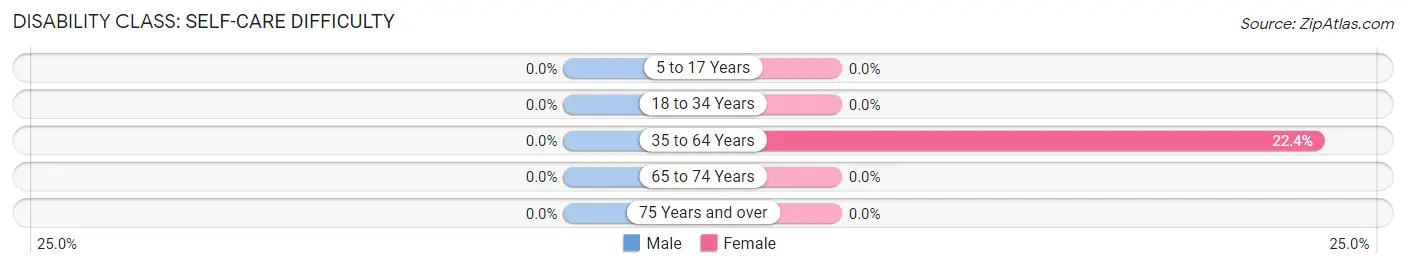
| Age Bracket | Male | Female |
| 5 to 17 Years | 0 (0.0%) | 0 (0.0%) |
| 18 to 34 Years | 0 (0.0%) | 0 (0.0%) |
| 35 to 64 Years | 0 (0.0%) | 28 (22.4%) |
| 65 to 74 Years | 0 (0.0%) | 0 (0.0%) |
| 75 Years and over | 0 (0.0%) | 0 (0.0%) |
Technology Access in Cheshire
Computing Device Access in Cheshire
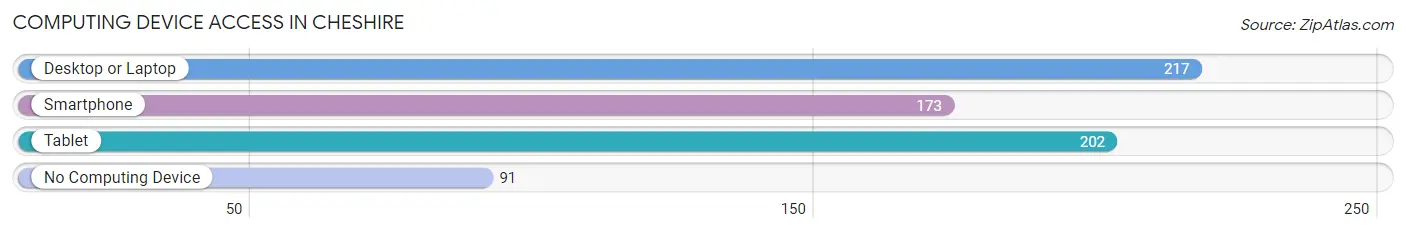
| Device Type | # Households | % Households |
| Desktop or Laptop | 217 | 65.8% |
| Smartphone | 173 | 52.4% |
| Tablet | 202 | 61.2% |
| No Computing Device | 91 | 27.6% |
| Total | 330 | 100.0% |
Internet Access in Cheshire
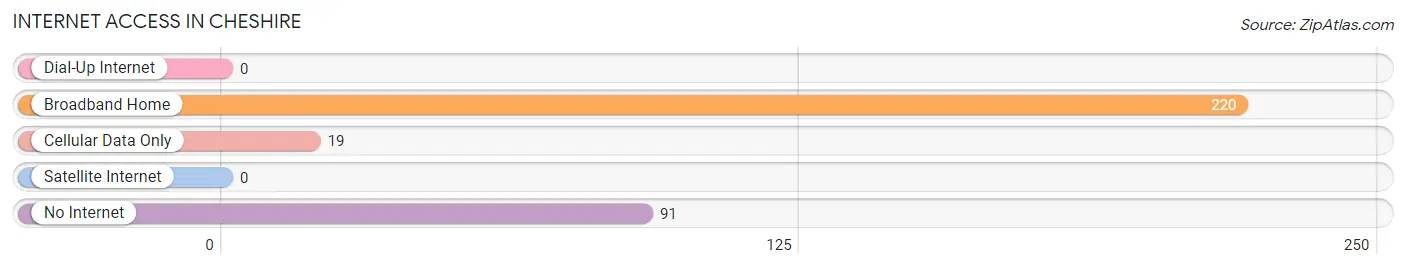
| Internet Type | # Households | % Households |
| Dial-Up Internet | 0 | 0.0% |
| Broadband Home | 220 | 66.7% |
| Cellular Data Only | 19 | 5.8% |
| Satellite Internet | 0 | 0.0% |
| No Internet | 91 | 27.6% |
| Total | 330 | 100.0% |
Cheshire Summary
Cheshire, Massachusetts is a small town located in Berkshire County in the western part of the state. It is bordered by the towns of Lanesborough, Adams, and Savoy. The town has a population of approximately 2,500 people and covers an area of about 11.5 square miles.
History
Cheshire was first settled in 1762 by a group of settlers from Connecticut. The town was officially incorporated in 1793 and was named after the English county of Cheshire. The town was primarily an agricultural community, with dairy farming being the main industry. In the late 19th century, the town began to develop a manufacturing industry, with the opening of several mills.
Geography
Cheshire is located in the western part of Berkshire County, in the foothills of the Berkshire Mountains. The town is situated on the banks of the Hoosic River, which runs through the center of town. The town is mostly rural, with rolling hills and forests. The highest point in town is the summit of Mount Greylock, which is located in the neighboring town of Adams.
Economy
Cheshire’s economy is primarily based on agriculture and manufacturing. The town is home to several dairy farms, as well as a number of small businesses. The town also has a number of small manufacturing companies, including a paper mill and a plastics factory. The town is also home to a number of small retail stores and restaurants.
Demographics
As of the 2010 census, the population of Cheshire was 2,521. The racial makeup of the town was 97.2% White, 0.7% African American, 0.3% Native American, 0.3% Asian, 0.1% Pacific Islander, 0.3% from other races, and 1.2% from two or more races. Hispanic or Latino of any race were 1.2% of the population.
The median household income in Cheshire was $50,938, and the median family income was $60,938. The per capita income for the town was $25,938. About 8.2% of families and 10.2% of the population were below the poverty line, including 14.2% of those under age 18 and 5.2% of those age 65 or over.
Cheshire is a small town with a rich history and a diverse economy. The town is home to a number of small businesses and manufacturing companies, as well as a number of dairy farms. The town has a population of approximately 2,500 people and is located in the western part of Berkshire County.
Common Questions
What is Per Capita Income in Cheshire?
Per Capita income in Cheshire is $47,190.
What is the Median Family Income in Cheshire?
Median Family Income in Cheshire is $128,306.
What is Income or Wage Gap in Cheshire?
Income or Wage Gap in Cheshire is 37.8%.
Women in Cheshire earn 62.2 cents for every dollar earned by a man.
What is Inequality or Gini Index in Cheshire?
Inequality or Gini Index in Cheshire is 0.33.
What is the Total Population of Cheshire?
Total Population of Cheshire is 547.
What is the Total Male Population of Cheshire?
Total Male Population of Cheshire is 215.
What is the Total Female Population of Cheshire?
Total Female Population of Cheshire is 332.
What is the Ratio of Males per 100 Females in Cheshire?
There are 64.76 Males per 100 Females in Cheshire.
What is the Ratio of Females per 100 Males in Cheshire?
There are 154.42 Females per 100 Males in Cheshire.
What is the Median Population Age in Cheshire?
Median Population Age in Cheshire is 60.1 Years.
What is the Average Family Size in Cheshire
Average Family Size in Cheshire is 2.3 People.
What is the Average Household Size in Cheshire
Average Household Size in Cheshire is 1.6 People.
How Large is the Labor Force in Cheshire?
There are 236 People in the Labor Forcein in Cheshire.
What is the Percentage of People in the Labor Force in Cheshire?
45.4% of People are in the Labor Force in Cheshire.