North Scituate, MA Map & Demographics
North Scituate Map
North Scituate Overview
$65,395
PER CAPITA INCOME
$180,453
AVG FAMILY INCOME
$127,339
AVG HOUSEHOLD INCOME
24.6%
WAGE / INCOME GAP [ % ]
75.4¢/ $1
WAGE / INCOME GAP [ $ ]
0.47
INEQUALITY / GINI INDEX
5,675
TOTAL POPULATION
2,832
MALE POPULATION
2,843
FEMALE POPULATION
99.61
MALES / 100 FEMALES
100.39
FEMALES / 100 MALES
44.6
MEDIAN AGE
3.4
AVG FAMILY SIZE
2.8
AVG HOUSEHOLD SIZE
3,161
LABOR FORCE [ PEOPLE ]
69.0%
PERCENT IN LABOR FORCE
5.6%
UNEMPLOYMENT RATE
North Scituate Area Codes
Income in North Scituate
Income Overview in North Scituate
Per Capita Income in North Scituate is $65,395, while median incomes of families and households are $180,453 and $127,339 respectively.
| Characteristic | Number | Measure |
| Per Capita Income | 5,675 | $65,395 |
| Median Family Income | 1,477 | $180,453 |
| Mean Family Income | 1,477 | $223,005 |
| Median Household Income | 2,028 | $127,339 |
| Mean Household Income | 2,028 | $181,899 |
| Income Deficit | 1,477 | $0 |
| Wage / Income Gap (%) | 5,675 | 24.64% |
| Wage / Income Gap ($) | 5,675 | 75.36¢ per $1 |
| Gini / Inequality Index | 5,675 | 0.47 |
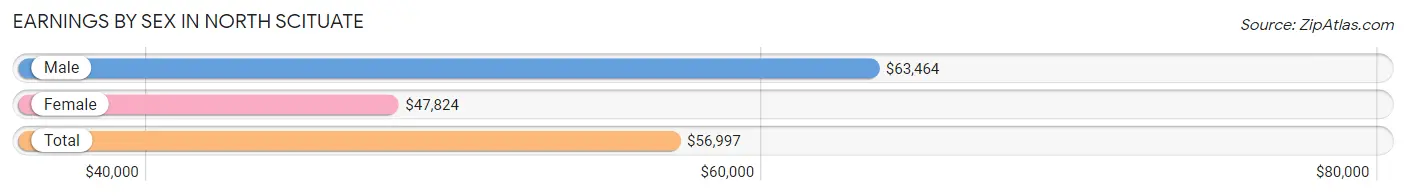
Earnings by Sex in North Scituate
Average Earnings in North Scituate are $56,997, $63,464 for men and $47,824 for women, a difference of 24.6%.
| Sex | Number | Average Earnings |
| Male | 1,885 (55.9%) | $63,464 |
| Female | 1,486 (44.1%) | $47,824 |
| Total | 3,371 (100.0%) | $56,997 |
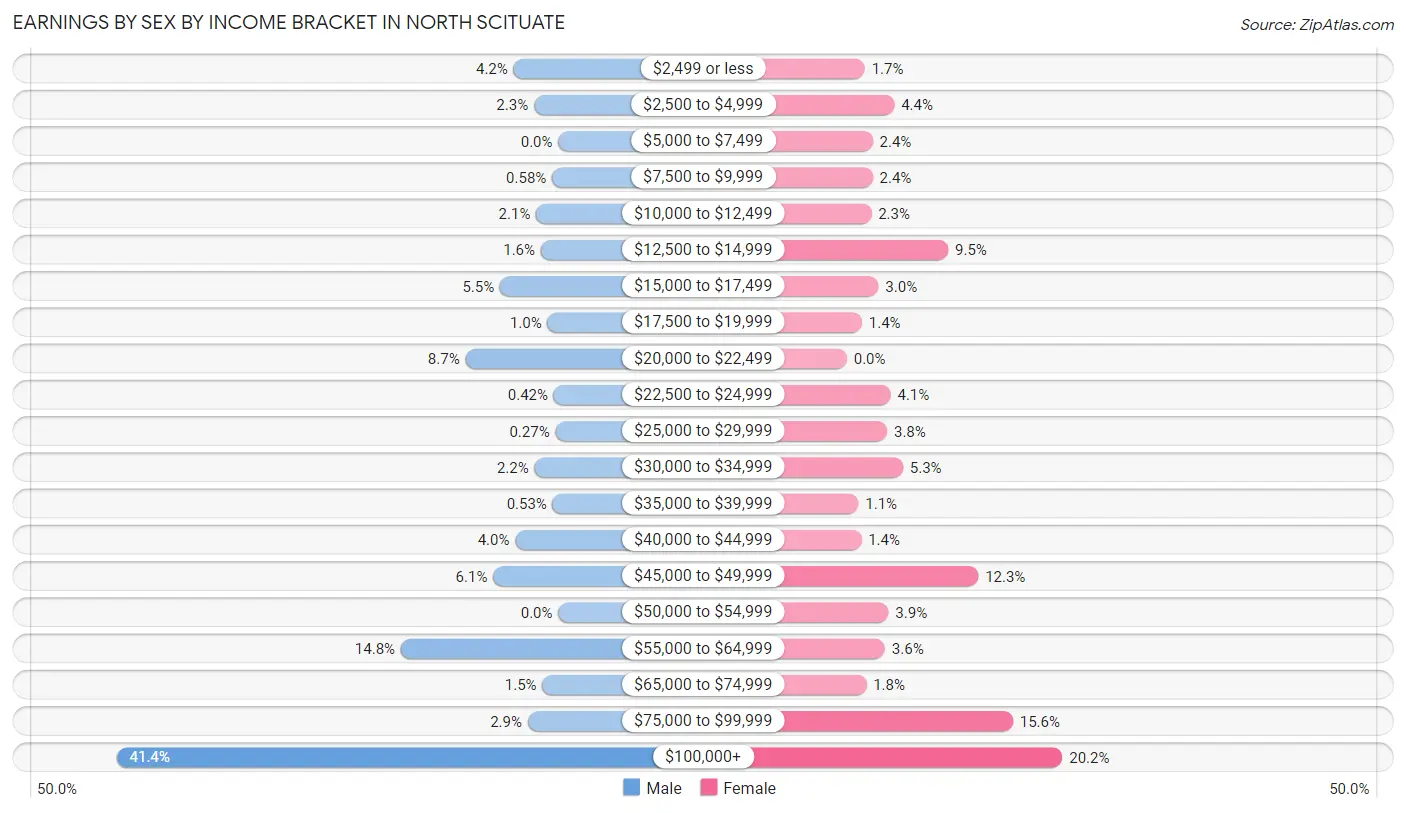
Earnings by Sex by Income Bracket in North Scituate
The most common earnings brackets in North Scituate are $100,000+ for men (780 | 41.4%) and $100,000+ for women (300 | 20.2%).
| Income | Male | Female |
| $2,499 or less | 79 (4.2%) | 25 (1.7%) |
| $2,500 to $4,999 | 43 (2.3%) | 66 (4.4%) |
| $5,000 to $7,499 | 0 (0.0%) | 36 (2.4%) |
| $7,500 to $9,999 | 11 (0.6%) | 36 (2.4%) |
| $10,000 to $12,499 | 39 (2.1%) | 34 (2.3%) |
| $12,500 to $14,999 | 31 (1.6%) | 141 (9.5%) |
| $15,000 to $17,499 | 103 (5.5%) | 44 (3.0%) |
| $17,500 to $19,999 | 19 (1.0%) | 21 (1.4%) |
| $20,000 to $22,499 | 164 (8.7%) | 0 (0.0%) |
| $22,500 to $24,999 | 8 (0.4%) | 61 (4.1%) |
| $25,000 to $29,999 | 5 (0.3%) | 56 (3.8%) |
| $30,000 to $34,999 | 42 (2.2%) | 78 (5.2%) |
| $35,000 to $39,999 | 10 (0.5%) | 16 (1.1%) |
| $40,000 to $44,999 | 76 (4.0%) | 20 (1.3%) |
| $45,000 to $49,999 | 115 (6.1%) | 183 (12.3%) |
| $50,000 to $54,999 | 0 (0.0%) | 58 (3.9%) |
| $55,000 to $64,999 | 278 (14.7%) | 53 (3.6%) |
| $65,000 to $74,999 | 28 (1.5%) | 27 (1.8%) |
| $75,000 to $99,999 | 54 (2.9%) | 231 (15.5%) |
| $100,000+ | 780 (41.4%) | 300 (20.2%) |
| Total | 1,885 (100.0%) | 1,486 (100.0%) |
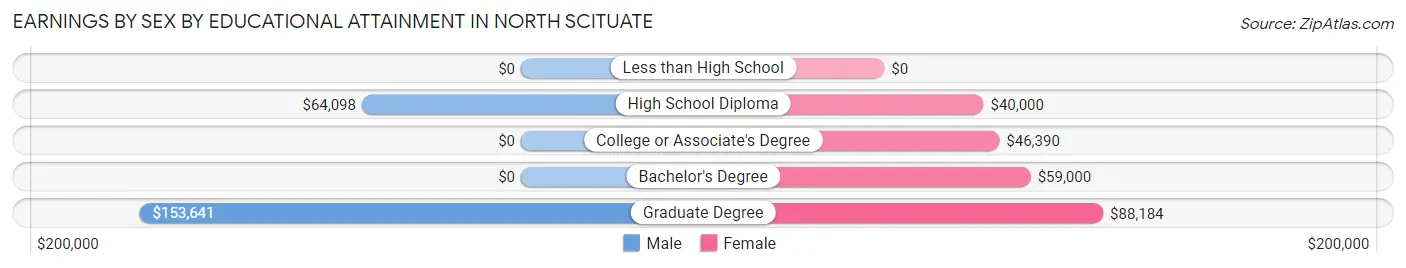
Earnings by Sex by Educational Attainment in North Scituate
Average earnings in North Scituate are $104,000 for men and $54,214 for women, a difference of 47.9%. Men with an educational attainment of graduate degree enjoy the highest average annual earnings of $153,641, while those with high school diploma education earn the least with $64,098. Women with an educational attainment of graduate degree earn the most with the average annual earnings of $88,184, while those with high school diploma education have the smallest earnings of $40,000.
| Educational Attainment | Male Income | Female Income |
| Less than High School | - | - |
| High School Diploma | $64,098 | $40,000 |
| College or Associate's Degree | - | - |
| Bachelor's Degree | - | - |
| Graduate Degree | $153,641 | $88,184 |
| Total | $104,000 | $54,214 |
Family Income in North Scituate
Family Income Brackets in North Scituate
According to the North Scituate family income data, there are 611 families falling into the $200,000+ income range, which is the most common income bracket and makes up 41.4% of all families.
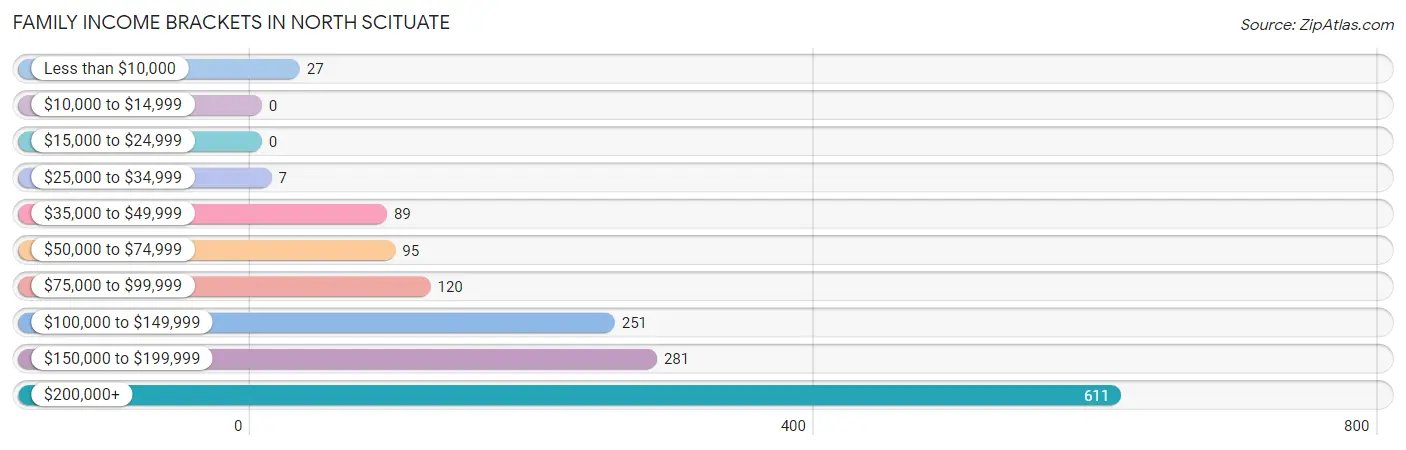
| Income Bracket | # Families | % Families |
| Less than $10,000 | 27 | 1.8% |
| $10,000 to $14,999 | 0 | 0.0% |
| $15,000 to $24,999 | 0 | 0.0% |
| $25,000 to $34,999 | 7 | 0.5% |
| $35,000 to $49,999 | 89 | 6.0% |
| $50,000 to $74,999 | 95 | 6.4% |
| $75,000 to $99,999 | 120 | 8.1% |
| $100,000 to $149,999 | 251 | 17.0% |
| $150,000 to $199,999 | 281 | 19.0% |
| $200,000+ | 611 | 41.4% |
Family Income by Famaliy Size in North Scituate
4-person families (431 | 29.2%) account for the highest median family income in North Scituate with $234,345 per family, while 3-person families (225 | 15.2%) have the highest median income of $62,623 per family member.
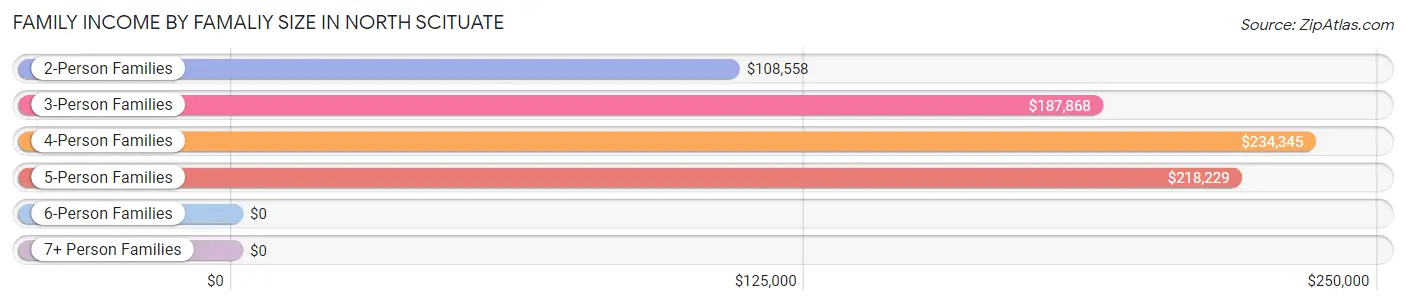
| Income Bracket | # Families | Median Income |
| 2-Person Families | 508 (34.4%) | $108,558 |
| 3-Person Families | 225 (15.2%) | $187,868 |
| 4-Person Families | 431 (29.2%) | $234,345 |
| 5-Person Families | 289 (19.6%) | $218,229 |
| 6-Person Families | 24 (1.6%) | $0 |
| 7+ Person Families | 0 (0.0%) | $0 |
| Total | 1,477 (100.0%) | $180,453 |
Family Income by Number of Earners in North Scituate
The median family income in North Scituate is $180,453, with families comprising 2 earners (606) having the highest median family income of $243,036, while families with no earners (145) have the lowest median family income of $69,883, accounting for 41.0% and 9.8% of families, respectively.
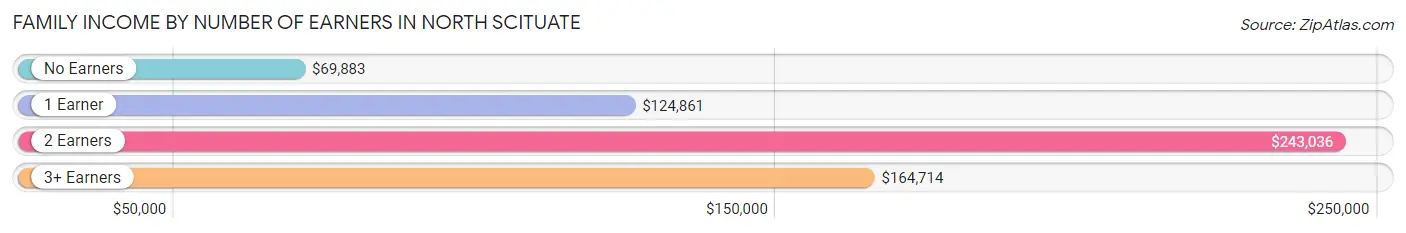
| Number of Earners | # Families | Median Income |
| No Earners | 145 (9.8%) | $69,883 |
| 1 Earner | 407 (27.6%) | $124,861 |
| 2 Earners | 606 (41.0%) | $243,036 |
| 3+ Earners | 319 (21.6%) | $164,714 |
| Total | 1,477 (100.0%) | $180,453 |
Household Income in North Scituate
Household Income Brackets in North Scituate
With 635 households falling in the category, the $200,000+ income range is the most frequent in North Scituate, accounting for 31.3% of all households. In contrast, only 22 households (1.1%) fall into the $25,000 to $34,999 income bracket, making it the least populous group.
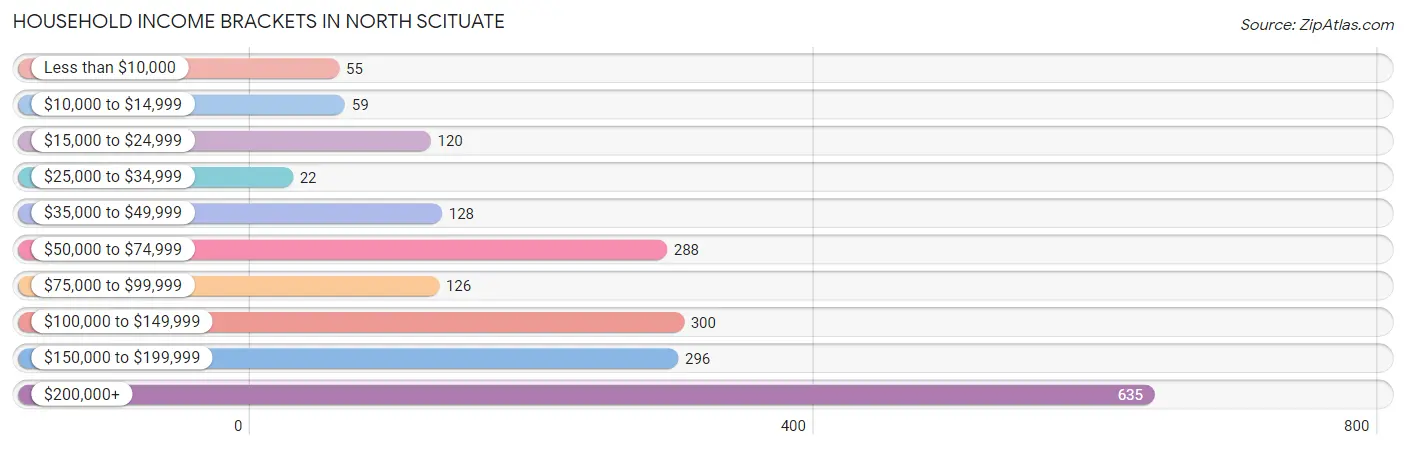
| Income Bracket | # Households | % Households |
| Less than $10,000 | 55 | 2.7% |
| $10,000 to $14,999 | 59 | 2.9% |
| $15,000 to $24,999 | 120 | 5.9% |
| $25,000 to $34,999 | 22 | 1.1% |
| $35,000 to $49,999 | 128 | 6.3% |
| $50,000 to $74,999 | 288 | 14.2% |
| $75,000 to $99,999 | 126 | 6.2% |
| $100,000 to $149,999 | 300 | 14.8% |
| $150,000 to $199,999 | 296 | 14.6% |
| $200,000+ | 635 | 31.3% |
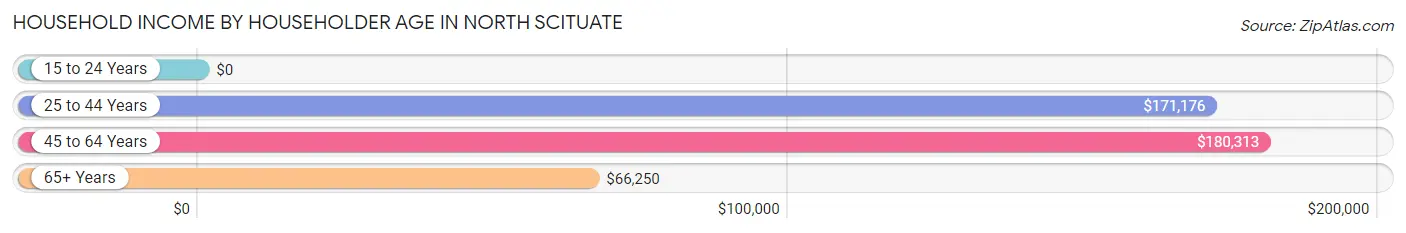
Household Income by Householder Age in North Scituate
The median household income in North Scituate is $127,339, with the highest median household income of $180,313 found in the 45 to 64 years age bracket for the primary householder. A total of 1,089 households (53.7%) fall into this category.
| Income Bracket | # Households | Median Income |
| 15 to 24 Years | 0 (0.0%) | $0 |
| 25 to 44 Years | 400 (19.7%) | $171,176 |
| 45 to 64 Years | 1,089 (53.7%) | $180,313 |
| 65+ Years | 539 (26.6%) | $66,250 |
| Total | 2,028 (100.0%) | $127,339 |
Poverty in North Scituate
Income Below Poverty by Sex and Age in North Scituate
With 2.1% poverty level for males and 3.2% for females among the residents of North Scituate, 65 to 74 year old males and 55 to 64 year old females are the most vulnerable to poverty, with 23 males (9.1%) and 48 females (12.3%) in their respective age groups living below the poverty level.
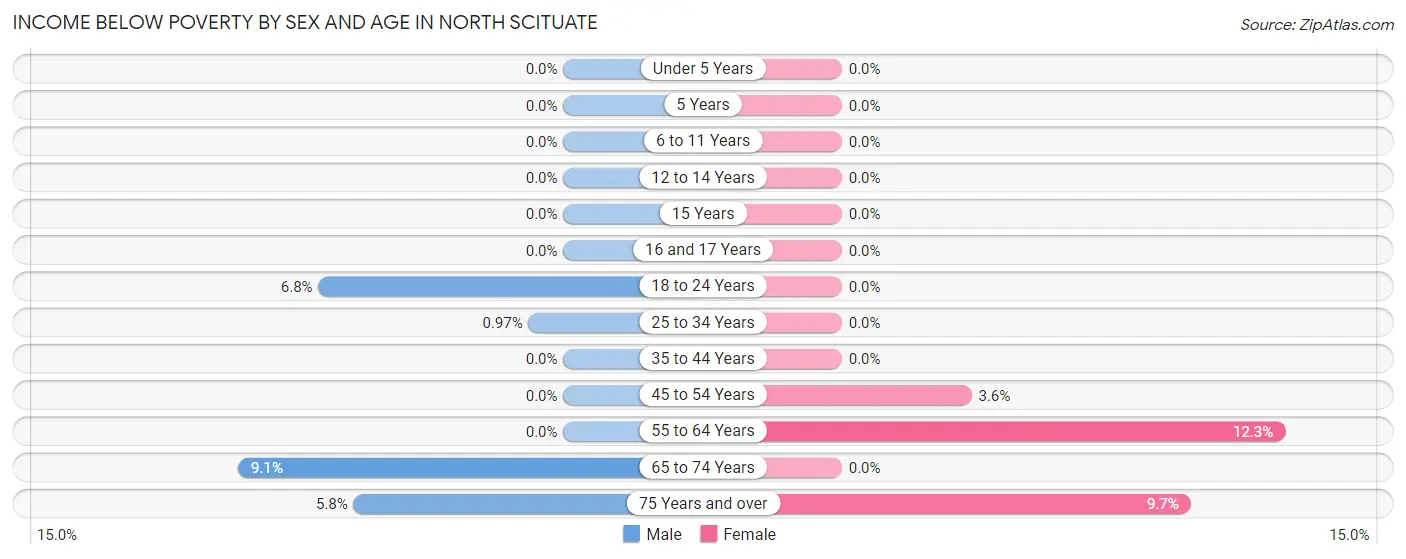
| Age Bracket | Male | Female |
| Under 5 Years | 0 (0.0%) | 0 (0.0%) |
| 5 Years | 0 (0.0%) | 0 (0.0%) |
| 6 to 11 Years | 0 (0.0%) | 0 (0.0%) |
| 12 to 14 Years | 0 (0.0%) | 0 (0.0%) |
| 15 Years | 0 (0.0%) | 0 (0.0%) |
| 16 and 17 Years | 0 (0.0%) | 0 (0.0%) |
| 18 to 24 Years | 24 (6.8%) | 0 (0.0%) |
| 25 to 34 Years | 3 (1.0%) | 0 (0.0%) |
| 35 to 44 Years | 0 (0.0%) | 0 (0.0%) |
| 45 to 54 Years | 0 (0.0%) | 16 (3.6%) |
| 55 to 64 Years | 0 (0.0%) | 48 (12.3%) |
| 65 to 74 Years | 23 (9.1%) | 0 (0.0%) |
| 75 Years and over | 8 (5.8%) | 27 (9.7%) |
| Total | 58 (2.1%) | 91 (3.2%) |
Income Above Poverty by Sex and Age in North Scituate
According to the poverty statistics in North Scituate, males aged under 5 years and females aged under 5 years are the age groups that are most secure financially, with 100.0% of males and 100.0% of females in these age groups living above the poverty line.
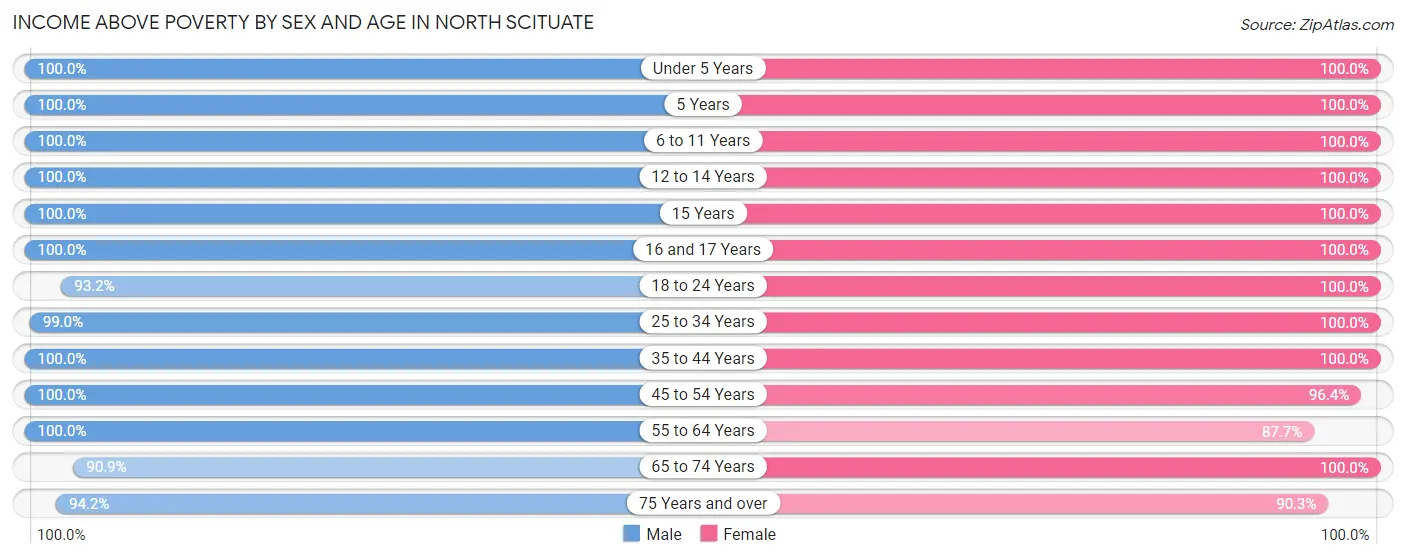
| Age Bracket | Male | Female |
| Under 5 Years | 152 (100.0%) | 106 (100.0%) |
| 5 Years | 16 (100.0%) | 31 (100.0%) |
| 6 to 11 Years | 157 (100.0%) | 258 (100.0%) |
| 12 to 14 Years | 123 (100.0%) | 179 (100.0%) |
| 15 Years | 13 (100.0%) | 40 (100.0%) |
| 16 and 17 Years | 95 (100.0%) | 45 (100.0%) |
| 18 to 24 Years | 328 (93.2%) | 217 (100.0%) |
| 25 to 34 Years | 307 (99.0%) | 296 (100.0%) |
| 35 to 44 Years | 173 (100.0%) | 267 (100.0%) |
| 45 to 54 Years | 563 (100.0%) | 427 (96.4%) |
| 55 to 64 Years | 487 (100.0%) | 341 (87.7%) |
| 65 to 74 Years | 231 (90.9%) | 275 (100.0%) |
| 75 Years and over | 129 (94.2%) | 251 (90.3%) |
| Total | 2,774 (98.0%) | 2,733 (96.8%) |
Income Below Poverty Among Married-Couple Families in North Scituate
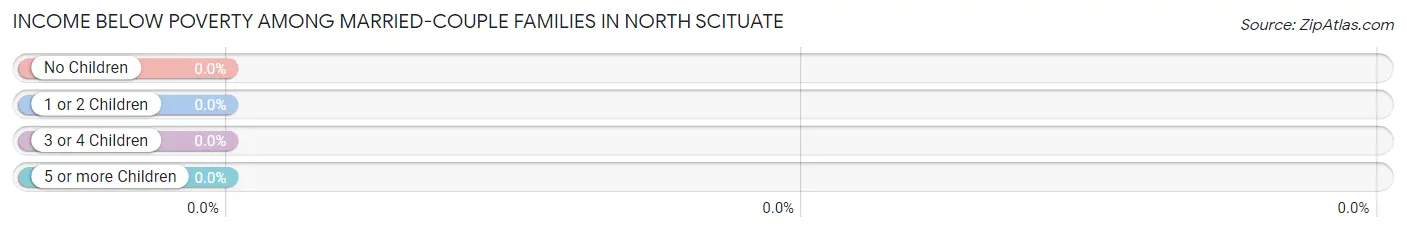
| Children | Above Poverty | Below Poverty |
| No Children | 654 (100.0%) | 0 (0.0%) |
| 1 or 2 Children | 449 (100.0%) | 0 (0.0%) |
| 3 or 4 Children | 76 (100.0%) | 0 (0.0%) |
| 5 or more Children | 0 (0.0%) | 0 (0.0%) |
| Total | 1,179 (100.0%) | 0 (0.0%) |
Income Below Poverty Among Single-Parent Households in North Scituate
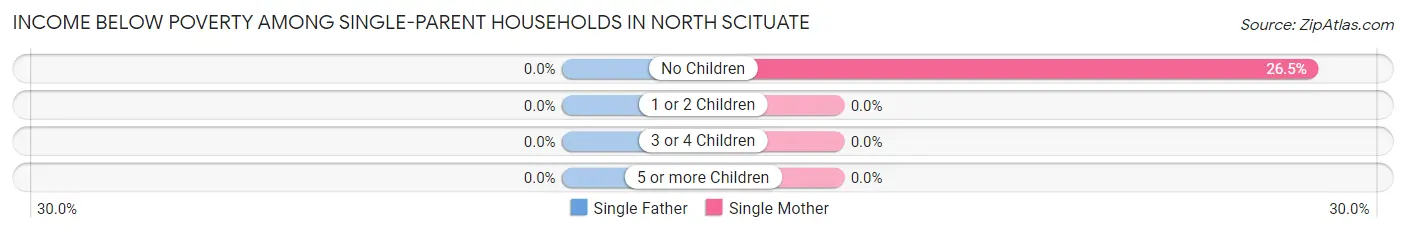
| Children | Single Father | Single Mother |
| No Children | 0 (0.0%) | 26 (26.5%) |
| 1 or 2 Children | 0 (0.0%) | 0 (0.0%) |
| 3 or 4 Children | 0 (0.0%) | 0 (0.0%) |
| 5 or more Children | 0 (0.0%) | 0 (0.0%) |
| Total | 0 (0.0%) | 26 (17.1%) |
Income Below Poverty Among Married-Couple vs Single-Parent Households in North Scituate
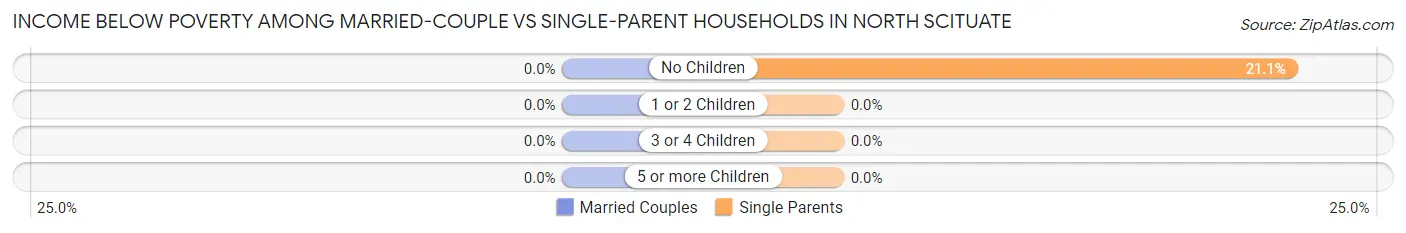
| Children | Married-Couple Families | Single-Parent Households |
| No Children | 0 (0.0%) | 26 (21.1%) |
| 1 or 2 Children | 0 (0.0%) | 0 (0.0%) |
| 3 or 4 Children | 0 (0.0%) | 0 (0.0%) |
| 5 or more Children | 0 (0.0%) | 0 (0.0%) |
| Total | 0 (0.0%) | 26 (8.7%) |
Race in North Scituate
The most populous races in North Scituate are White / Caucasian (5,319 | 93.7%), Asian (320 | 5.6%), and Two or more Races (36 | 0.6%).
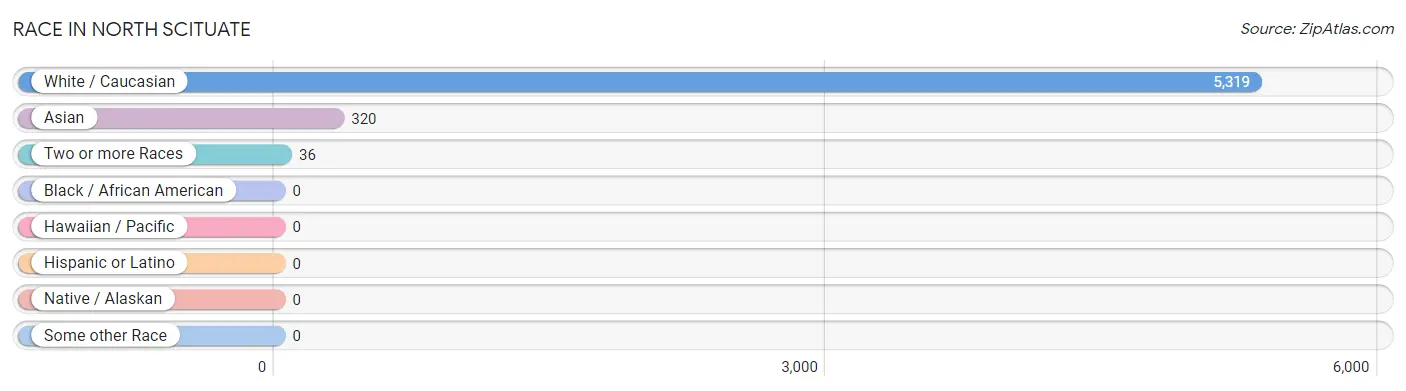
| Race | # Population | % Population |
| Asian | 320 | 5.6% |
| Black / African American | 0 | 0.0% |
| Hawaiian / Pacific | 0 | 0.0% |
| Hispanic or Latino | 0 | 0.0% |
| Native / Alaskan | 0 | 0.0% |
| White / Caucasian | 5,319 | 93.7% |
| Two or more Races | 36 | 0.6% |
| Some other Race | 0 | 0.0% |
| Total | 5,675 | 100.0% |
Ancestry in North Scituate
The most populous ancestries reported in North Scituate are Irish (2,420 | 42.6%), Italian (1,325 | 23.4%), English (777 | 13.7%), German (337 | 5.9%), and Thai (271 | 4.8%), together accounting for 90.4% of all North Scituate residents.
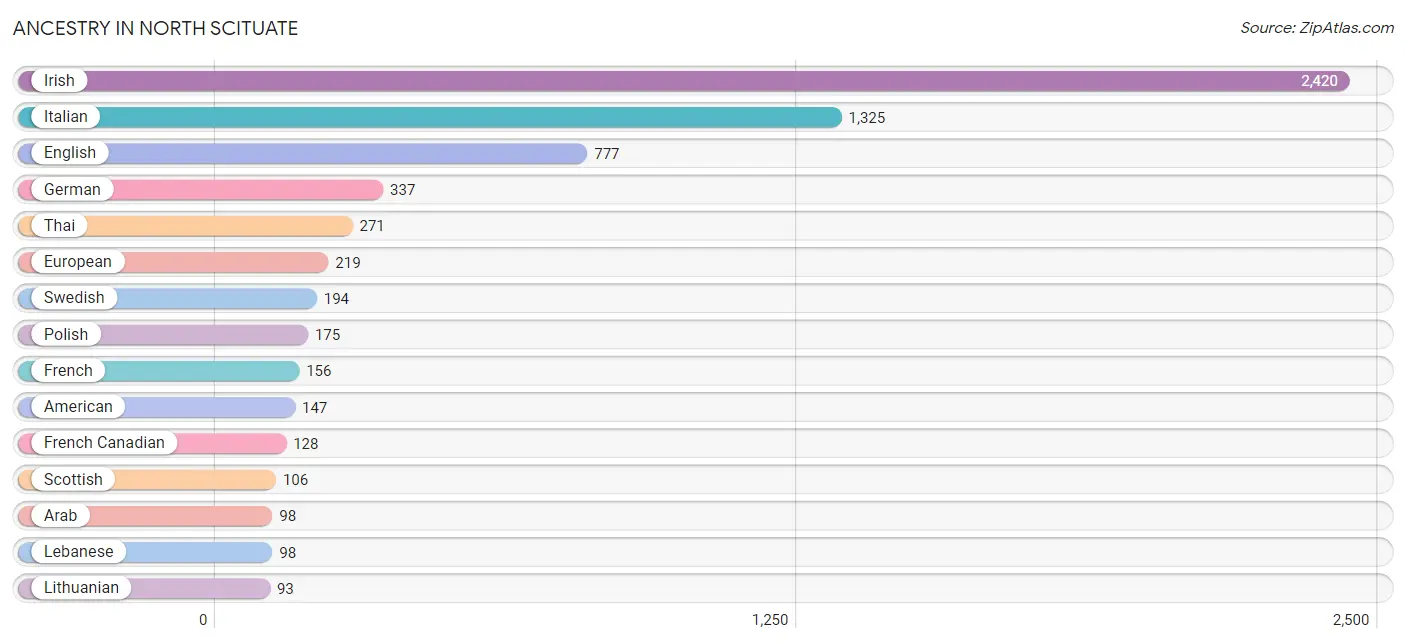
| Ancestry | # Population | % Population |
| American | 147 | 2.6% |
| Arab | 98 | 1.7% |
| Austrian | 52 | 0.9% |
| Canadian | 69 | 1.2% |
| Croatian | 29 | 0.5% |
| Czech | 36 | 0.6% |
| Danish | 5 | 0.1% |
| Dutch | 10 | 0.2% |
| English | 777 | 13.7% |
| European | 219 | 3.9% |
| Finnish | 91 | 1.6% |
| French | 156 | 2.8% |
| French Canadian | 128 | 2.3% |
| German | 337 | 5.9% |
| Guyanese | 19 | 0.3% |
| Hungarian | 7 | 0.1% |
| Indian (Asian) | 17 | 0.3% |
| Irish | 2,420 | 42.6% |
| Italian | 1,325 | 23.4% |
| Korean | 17 | 0.3% |
| Lebanese | 98 | 1.7% |
| Lithuanian | 93 | 1.6% |
| Norwegian | 32 | 0.6% |
| Polish | 175 | 3.1% |
| Portuguese | 47 | 0.8% |
| Russian | 9 | 0.2% |
| Scotch-Irish | 29 | 0.5% |
| Scottish | 106 | 1.9% |
| Slovak | 30 | 0.5% |
| Sri Lankan | 32 | 0.6% |
| Swedish | 194 | 3.4% |
| Swiss | 22 | 0.4% |
| Thai | 271 | 4.8% |
| Ukrainian | 22 | 0.4% |
| Welsh | 22 | 0.4% | View All 35 Rows |
Immigrants in North Scituate
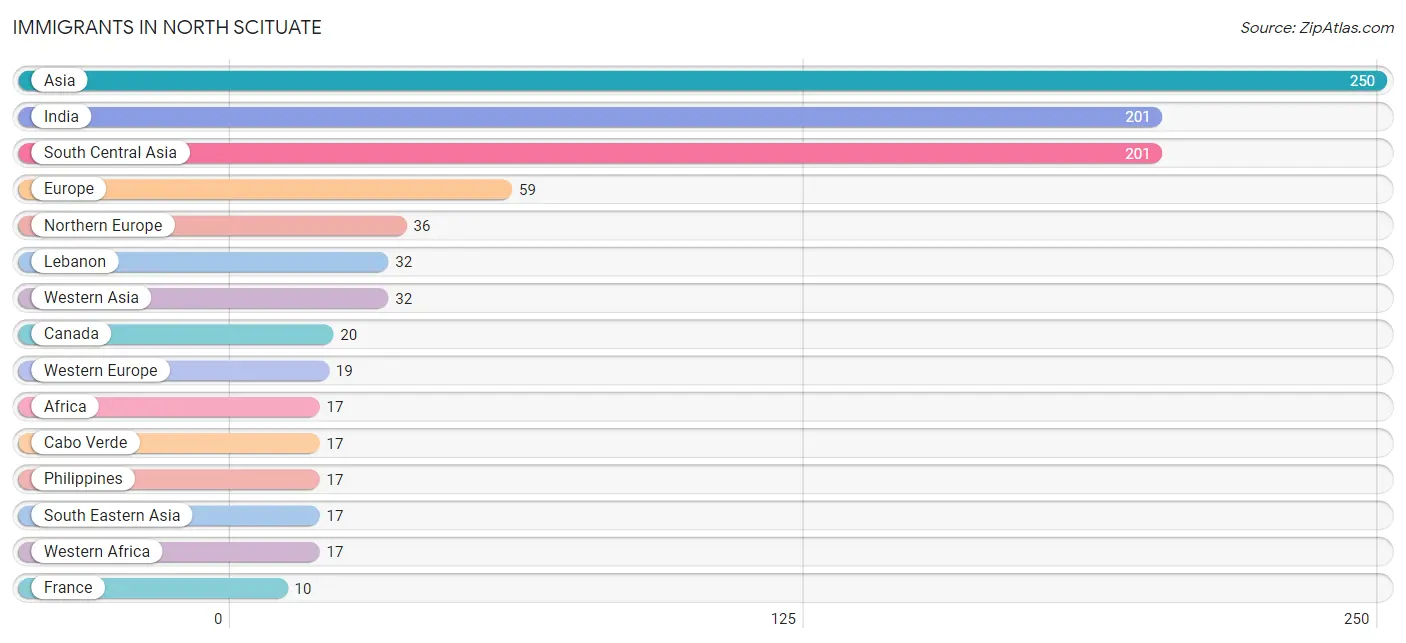
The most numerous immigrant groups reported in North Scituate came from Asia (250 | 4.4%), India (201 | 3.5%), South Central Asia (201 | 3.5%), Europe (59 | 1.0%), and Northern Europe (36 | 0.6%), together accounting for 13.2% of all North Scituate residents.
| Immigration Origin | # Population | % Population |
| Africa | 17 | 0.3% |
| Asia | 250 | 4.4% |
| Azores | 4 | 0.1% |
| Cabo Verde | 17 | 0.3% |
| Canada | 20 | 0.4% |
| Europe | 59 | 1.0% |
| France | 10 | 0.2% |
| Germany | 9 | 0.2% |
| India | 201 | 3.5% |
| Ireland | 9 | 0.2% |
| Lebanon | 32 | 0.6% |
| Northern Europe | 36 | 0.6% |
| Philippines | 17 | 0.3% |
| Portugal | 4 | 0.1% |
| South Central Asia | 201 | 3.5% |
| South Eastern Asia | 17 | 0.3% |
| Southern Europe | 4 | 0.1% |
| Western Africa | 17 | 0.3% |
| Western Asia | 32 | 0.6% |
| Western Europe | 19 | 0.3% | View All 20 Rows |
Sex and Age in North Scituate
Sex and Age in North Scituate
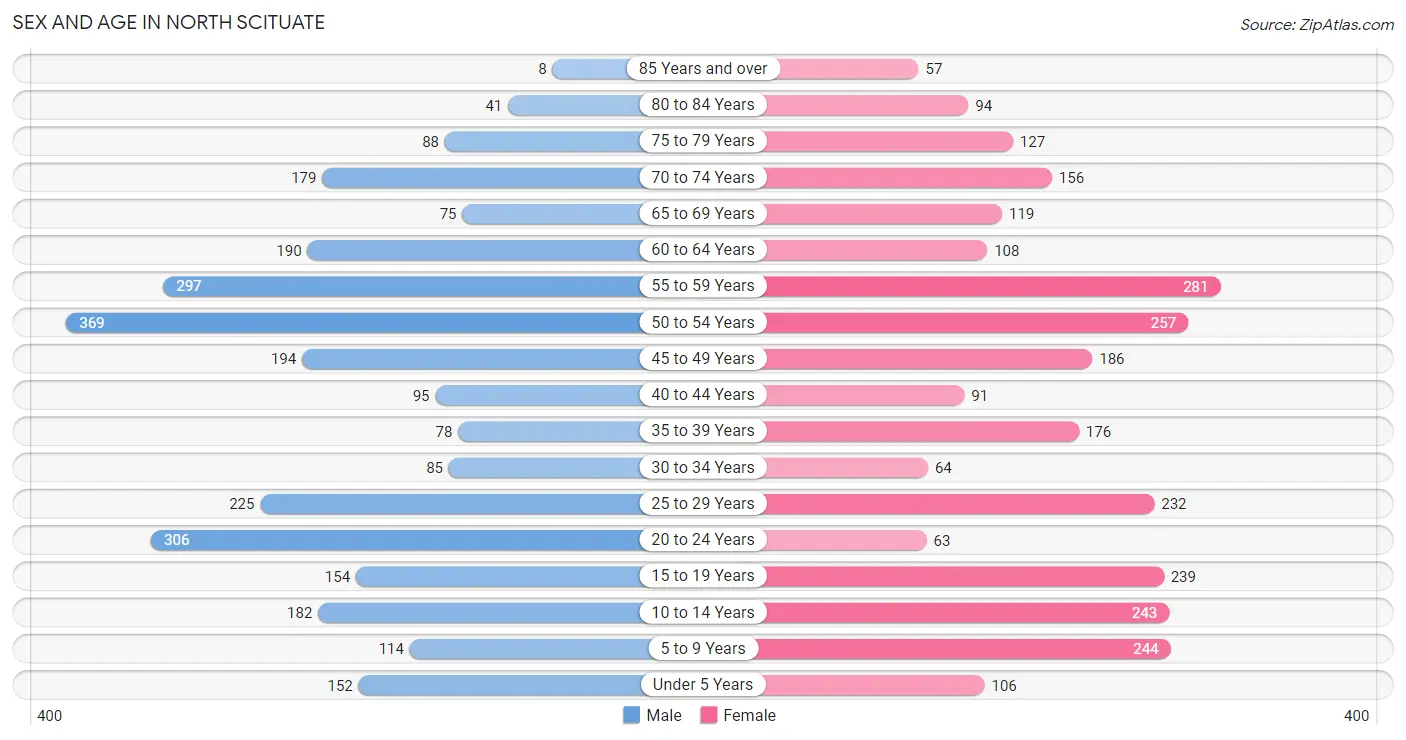
The most populous age groups in North Scituate are 50 to 54 Years (369 | 13.0%) for men and 55 to 59 Years (281 | 9.9%) for women.
| Age Bracket | Male | Female |
| Under 5 Years | 152 (5.4%) | 106 (3.7%) |
| 5 to 9 Years | 114 (4.0%) | 244 (8.6%) |
| 10 to 14 Years | 182 (6.4%) | 243 (8.6%) |
| 15 to 19 Years | 154 (5.4%) | 239 (8.4%) |
| 20 to 24 Years | 306 (10.8%) | 63 (2.2%) |
| 25 to 29 Years | 225 (7.9%) | 232 (8.2%) |
| 30 to 34 Years | 85 (3.0%) | 64 (2.2%) |
| 35 to 39 Years | 78 (2.8%) | 176 (6.2%) |
| 40 to 44 Years | 95 (3.4%) | 91 (3.2%) |
| 45 to 49 Years | 194 (6.9%) | 186 (6.5%) |
| 50 to 54 Years | 369 (13.0%) | 257 (9.0%) |
| 55 to 59 Years | 297 (10.5%) | 281 (9.9%) |
| 60 to 64 Years | 190 (6.7%) | 108 (3.8%) |
| 65 to 69 Years | 75 (2.6%) | 119 (4.2%) |
| 70 to 74 Years | 179 (6.3%) | 156 (5.5%) |
| 75 to 79 Years | 88 (3.1%) | 127 (4.5%) |
| 80 to 84 Years | 41 (1.5%) | 94 (3.3%) |
| 85 Years and over | 8 (0.3%) | 57 (2.0%) |
| Total | 2,832 (100.0%) | 2,843 (100.0%) |
Families and Households in North Scituate
Median Family Size in North Scituate
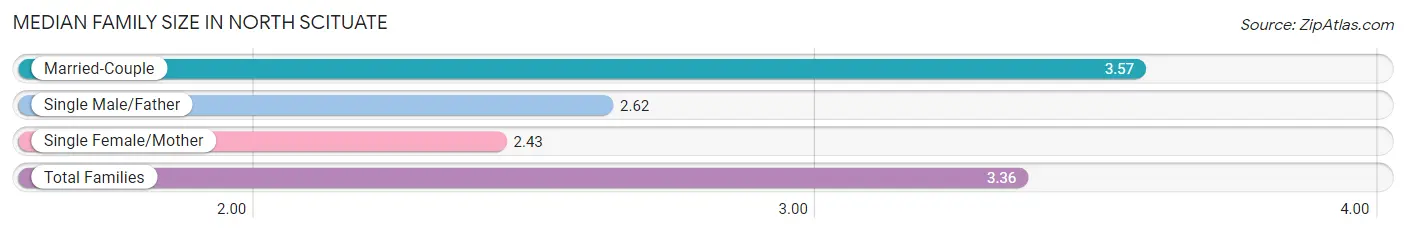
The median family size in North Scituate is 3.36 persons per family, with married-couple families (1,179 | 79.8%) accounting for the largest median family size of 3.57 persons per family. On the other hand, single female/mother families (152 | 10.3%) represent the smallest median family size with 2.43 persons per family.
| Family Type | # Families | Family Size |
| Married-Couple | 1,179 (79.8%) | 3.57 |
| Single Male/Father | 146 (9.9%) | 2.62 |
| Single Female/Mother | 152 (10.3%) | 2.43 |
| Total Families | 1,477 (100.0%) | 3.36 |
Median Household Size in North Scituate
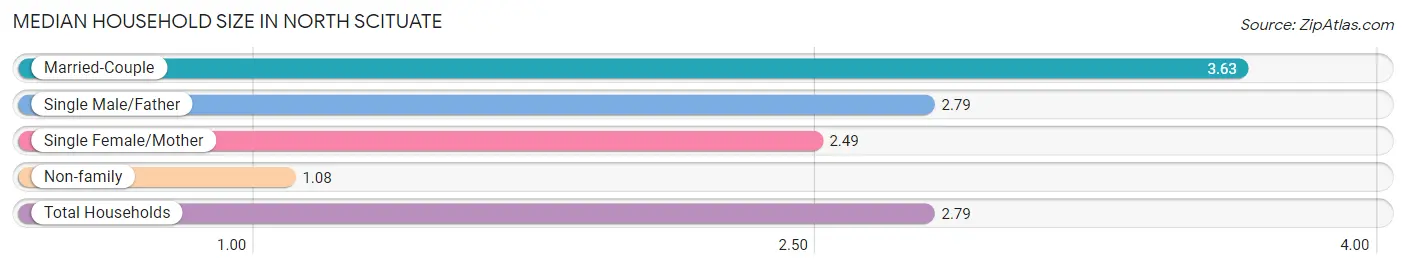
The median household size in North Scituate is 2.79 persons per household, with married-couple households (1,179 | 58.1%) accounting for the largest median household size of 3.63 persons per household. non-family households (551 | 27.2%) represent the smallest median household size with 1.08 persons per household.
| Household Type | # Households | Household Size |
| Married-Couple | 1,179 (58.1%) | 3.63 |
| Single Male/Father | 146 (7.2%) | 2.79 |
| Single Female/Mother | 152 (7.5%) | 2.49 |
| Non-family | 551 (27.2%) | 1.08 |
| Total Households | 2,028 (100.0%) | 2.79 |
Household Size by Marriage Status in North Scituate
Out of a total of 2,028 households in North Scituate, 1,477 (72.8%) are family households, while 551 (27.2%) are nonfamily households. The most numerous type of family households are 2-person households, comprising 488, and the most common type of nonfamily households are 1-person households, comprising 509.
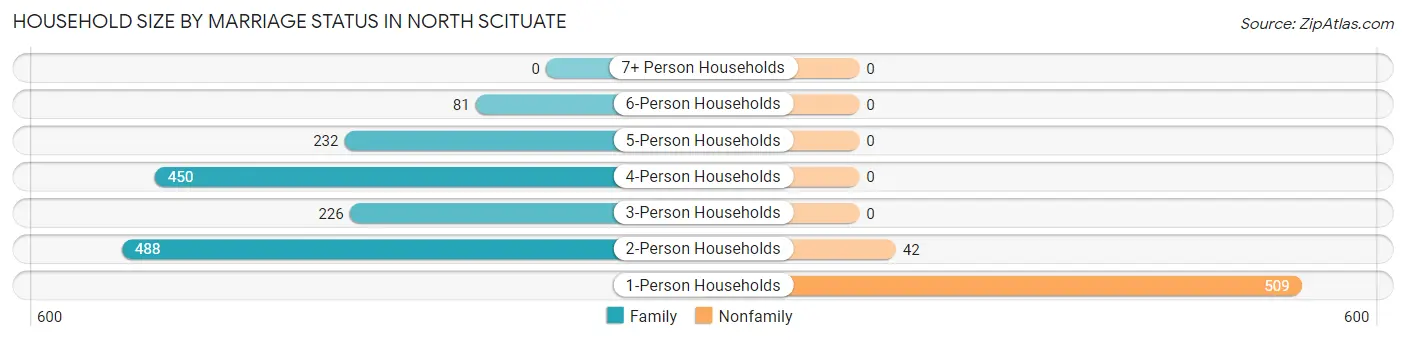
| Household Size | Family Households | Nonfamily Households |
| 1-Person Households | - | 509 (25.1%) |
| 2-Person Households | 488 (24.1%) | 42 (2.1%) |
| 3-Person Households | 226 (11.1%) | 0 (0.0%) |
| 4-Person Households | 450 (22.2%) | 0 (0.0%) |
| 5-Person Households | 232 (11.4%) | 0 (0.0%) |
| 6-Person Households | 81 (4.0%) | 0 (0.0%) |
| 7+ Person Households | 0 (0.0%) | 0 (0.0%) |
| Total | 1,477 (72.8%) | 551 (27.2%) |
Female Fertility in North Scituate
Fertility by Age in North Scituate
Average fertility rate in North Scituate is 32.0 births per 1,000 women. Women in the age bracket of 35 to 50 years have the highest fertility rate with 63.0 births per 1,000 women. Women in the age bracket of 35 to 50 years acount for 85.3% of all women with births.
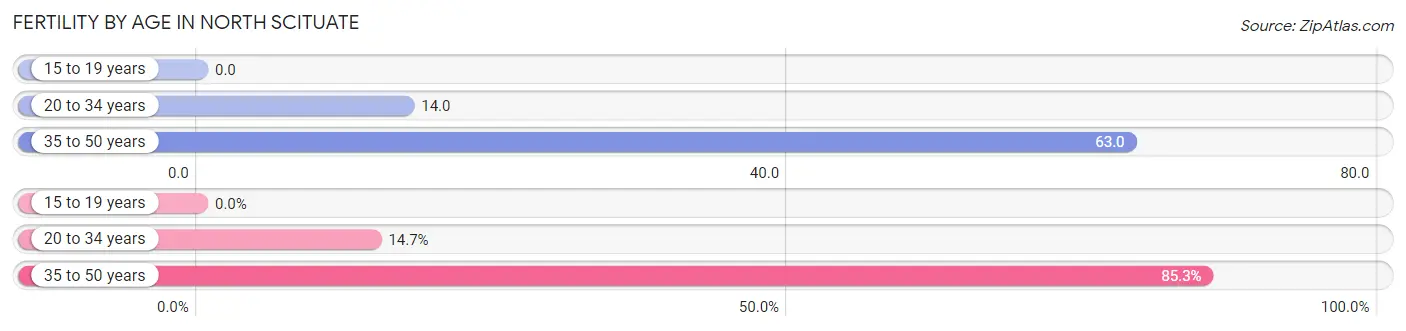
| Age Bracket | Women with Births | Births / 1,000 Women |
| 15 to 19 years | 0 (0.0%) | 0.0 |
| 20 to 34 years | 5 (14.7%) | 14.0 |
| 35 to 50 years | 29 (85.3%) | 63.0 |
| Total | 34 (100.0%) | 32.0 |
Fertility by Age by Marriage Status in North Scituate
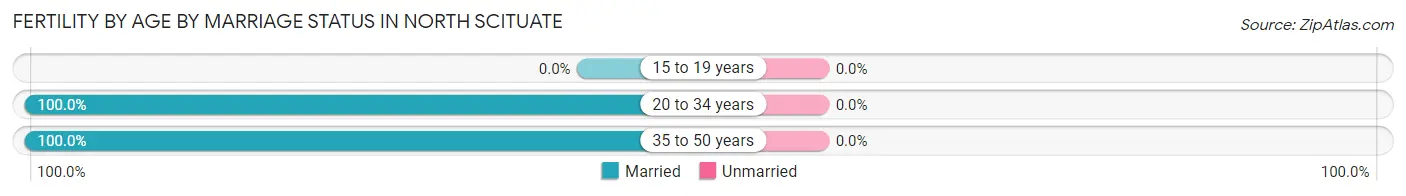
| Age Bracket | Married | Unmarried |
| 15 to 19 years | 0 (0.0%) | 0 (0.0%) |
| 20 to 34 years | 5 (100.0%) | 0 (0.0%) |
| 35 to 50 years | 29 (100.0%) | 0 (0.0%) |
| Total | 34 (100.0%) | 0 (0.0%) |
Fertility by Education in North Scituate
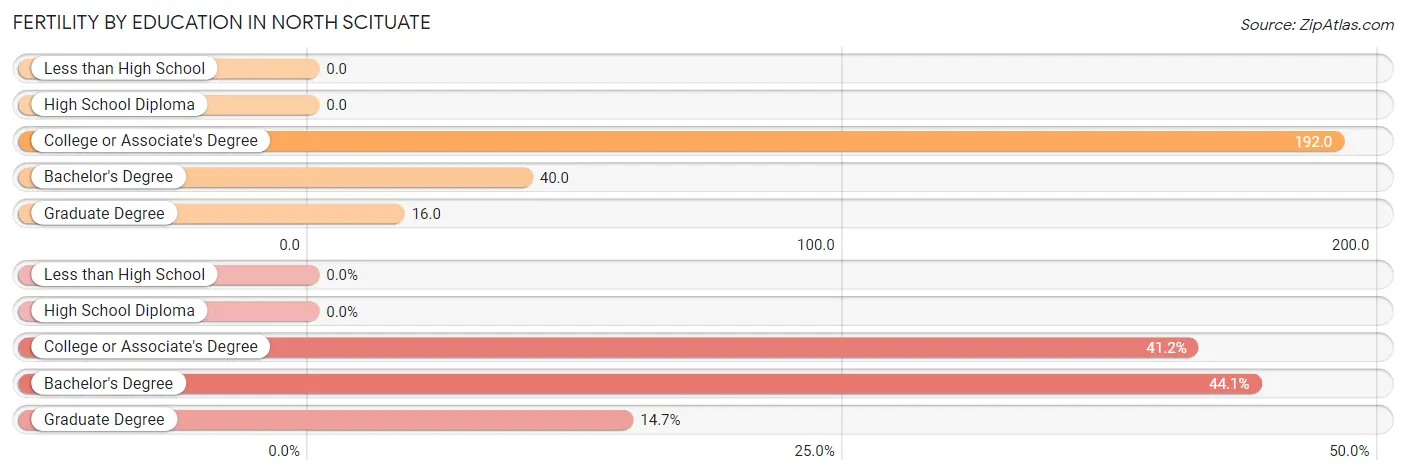
| Educational Attainment | Women with Births | Births / 1,000 Women |
| Less than High School | 0 (0.0%) | 0.0 |
| High School Diploma | 0 (0.0%) | 0.0 |
| College or Associate's Degree | 14 (41.2%) | 192.0 |
| Bachelor's Degree | 15 (44.1%) | 40.0 |
| Graduate Degree | 5 (14.7%) | 16.0 |
| Total | 34 (100.0%) | 32.0 |
Fertility by Education by Marriage Status in North Scituate
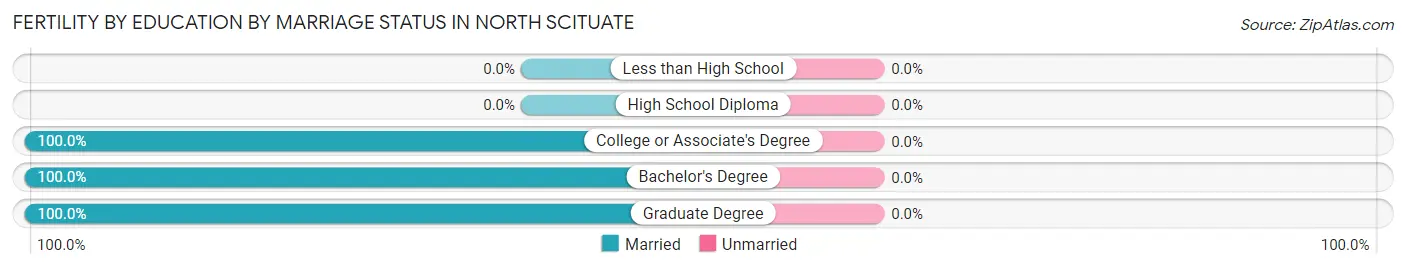
| Educational Attainment | Married | Unmarried |
| Less than High School | 0 (0.0%) | 0 (0.0%) |
| High School Diploma | 0 (0.0%) | 0 (0.0%) |
| College or Associate's Degree | 14 (100.0%) | 0 (0.0%) |
| Bachelor's Degree | 15 (100.0%) | 0 (0.0%) |
| Graduate Degree | 5 (100.0%) | 0 (0.0%) |
| Total | 34 (100.0%) | 0 (0.0%) |
Employment Characteristics in North Scituate
Employment by Class of Employer in North Scituate
Among the 2,968 employed individuals in North Scituate, private company employees (2,009 | 67.7%), local government employees (327 | 11.0%), and not-for-profit organizations (220 | 7.4%) make up the most common classes of employment.
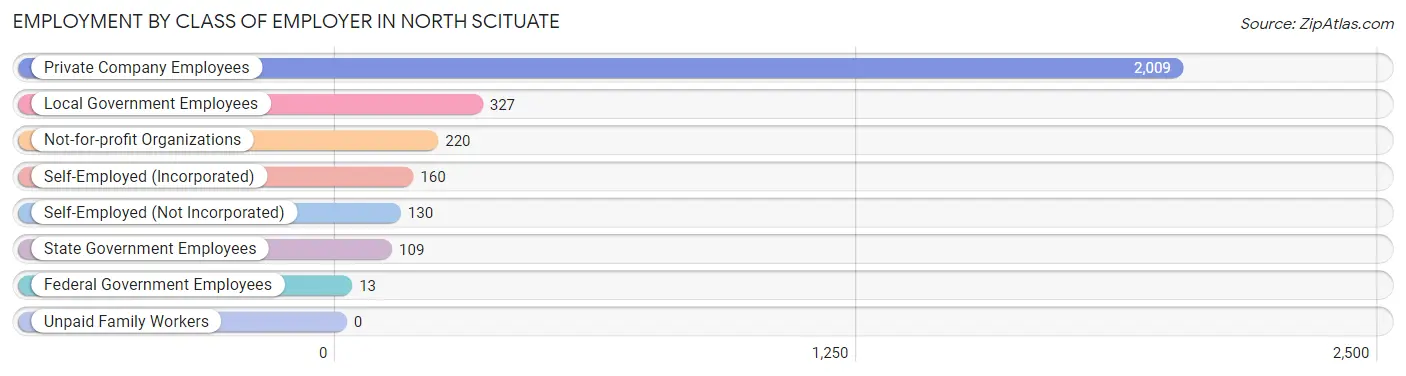
| Employer Class | # Employees | % Employees |
| Private Company Employees | 2,009 | 67.7% |
| Self-Employed (Incorporated) | 160 | 5.4% |
| Self-Employed (Not Incorporated) | 130 | 4.4% |
| Not-for-profit Organizations | 220 | 7.4% |
| Local Government Employees | 327 | 11.0% |
| State Government Employees | 109 | 3.7% |
| Federal Government Employees | 13 | 0.4% |
| Unpaid Family Workers | 0 | 0.0% |
| Total | 2,968 | 100.0% |
Employment Status by Age in North Scituate
According to the labor force statistics for North Scituate, out of the total population over 16 years of age (4,581), 69.0% or 3,161 individuals are in the labor force, with 5.6% or 177 of them unemployed. The age group with the highest labor force participation rate is 25 to 29 years, with 92.8% or 424 individuals in the labor force. Within the labor force, the 25 to 29 years age range has the highest percentage of unemployed individuals, with 14.4% or 61 of them being unemployed.
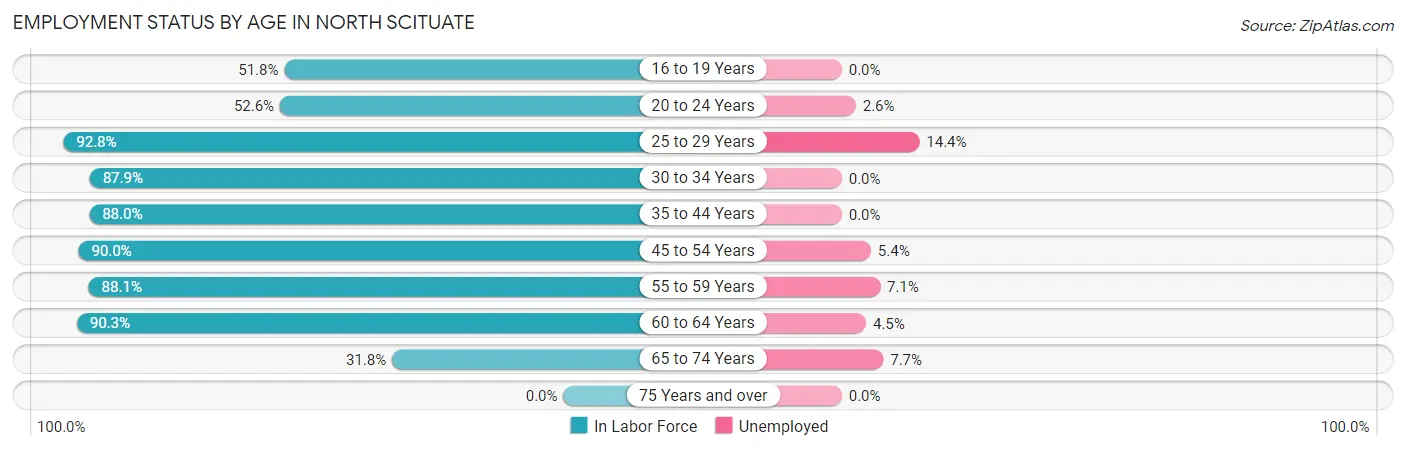
| Age Bracket | In Labor Force | Unemployed |
| 16 to 19 Years | 176 (51.8%) | 0 (0.0%) |
| 20 to 24 Years | 194 (52.6%) | 5 (2.6%) |
| 25 to 29 Years | 424 (92.8%) | 61 (14.4%) |
| 30 to 34 Years | 131 (87.9%) | 0 (0.0%) |
| 35 to 44 Years | 387 (88.0%) | 0 (0.0%) |
| 45 to 54 Years | 905 (90.0%) | 49 (5.4%) |
| 55 to 59 Years | 509 (88.1%) | 36 (7.1%) |
| 60 to 64 Years | 269 (90.3%) | 12 (4.5%) |
| 65 to 74 Years | 168 (31.8%) | 13 (7.7%) |
| 75 Years and over | 0 (0.0%) | 0 (0.0%) |
| Total | 3,161 (69.0%) | 177 (5.6%) |
Employment Status by Educational Attainment in North Scituate
According to labor force statistics for North Scituate, 89.7% of individuals (2,626) out of the total population between 25 and 64 years of age (2,928) are in the labor force, with 6.0% or 158 of them being unemployed. The group with the highest labor force participation rate are those with the educational attainment of high school diploma, with 94.2% or 178 individuals in the labor force. Within the labor force, individuals with college / associate degree education have the highest percentage of unemployment, with 14.0% or 40 of them being unemployed.
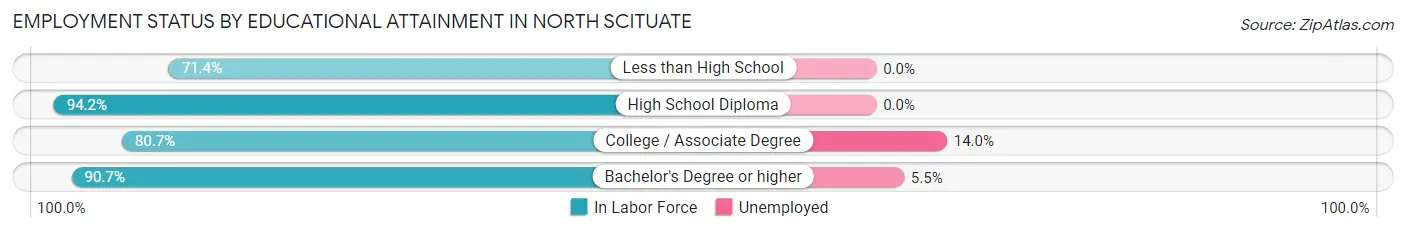
| Educational Attainment | In Labor Force | Unemployed |
| Less than High School | 10 (71.4%) | 0 (0.0%) |
| High School Diploma | 178 (94.2%) | 0 (0.0%) |
| College / Associate Degree | 285 (80.7%) | 49 (14.0%) |
| Bachelor's Degree or higher | 2,151 (90.7%) | 130 (5.5%) |
| Total | 2,626 (89.7%) | 176 (6.0%) |
Employment Occupations by Sex in North Scituate
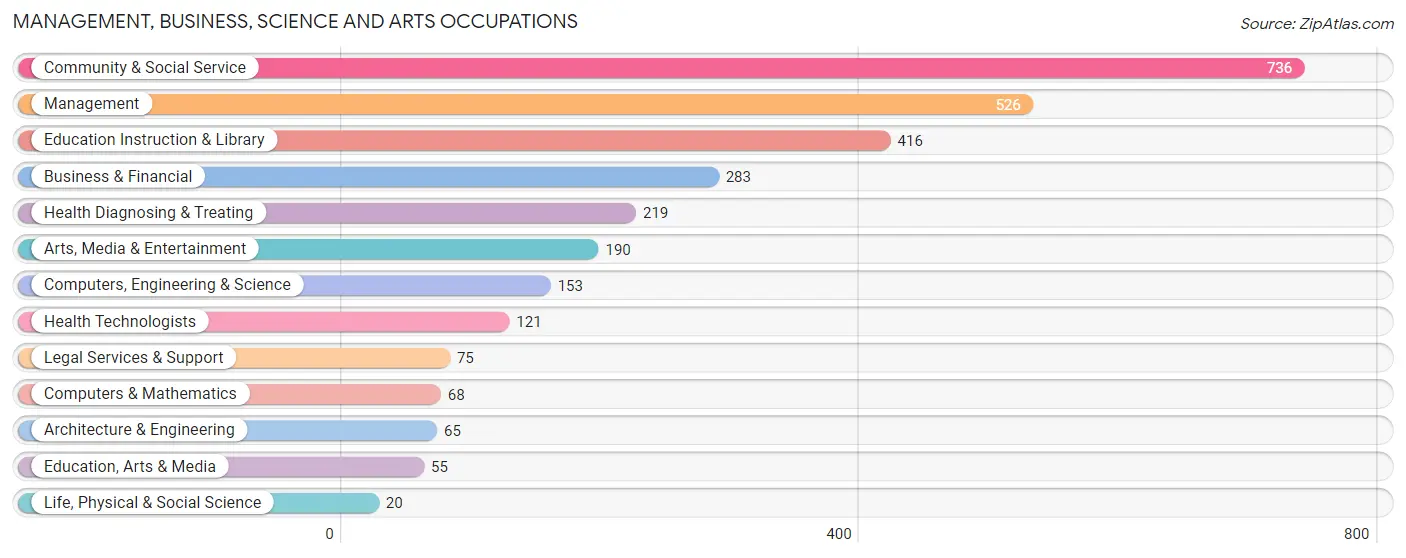
Management, Business, Science and Arts Occupations
The most common Management, Business, Science and Arts occupations in North Scituate are Community & Social Service (736 | 24.6%), Management (526 | 17.6%), Education Instruction & Library (416 | 13.9%), Business & Financial (283 | 9.5%), and Health Diagnosing & Treating (219 | 7.3%).
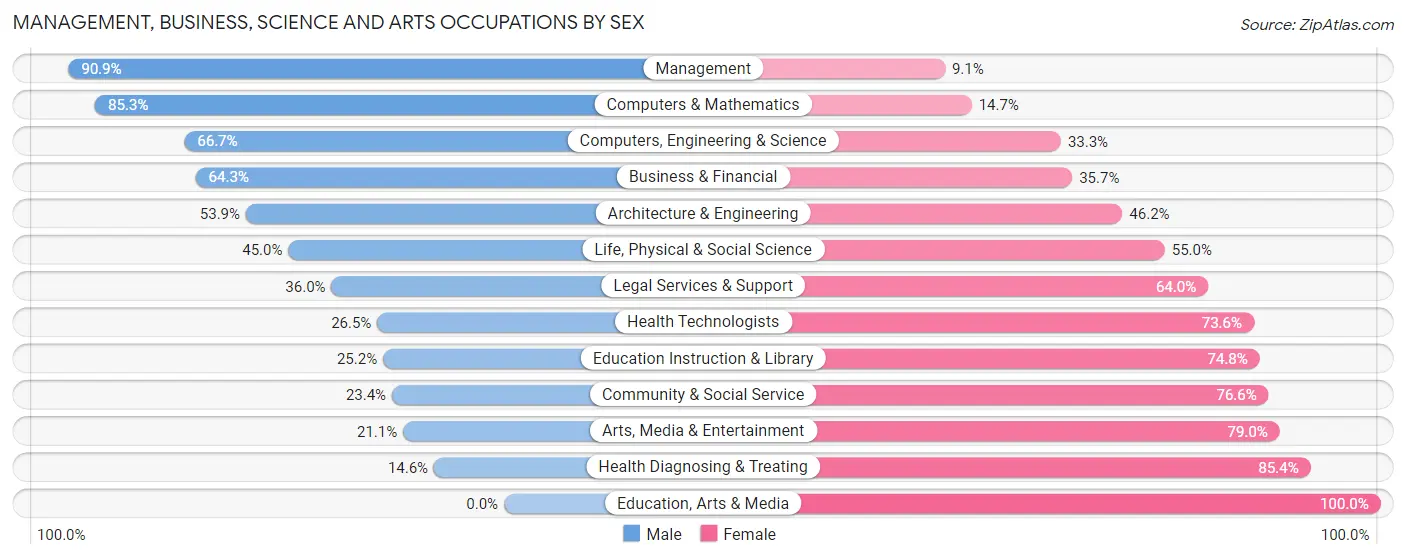
Management, Business, Science and Arts Occupations by Sex
Within the Management, Business, Science and Arts occupations in North Scituate, the most male-oriented occupations are Management (90.9%), Computers & Mathematics (85.3%), and Computers, Engineering & Science (66.7%), while the most female-oriented occupations are Education, Arts & Media (100.0%), Health Diagnosing & Treating (85.4%), and Arts, Media & Entertainment (78.9%).
| Occupation | Male | Female |
| Management | 478 (90.9%) | 48 (9.1%) |
| Business & Financial | 182 (64.3%) | 101 (35.7%) |
| Computers, Engineering & Science | 102 (66.7%) | 51 (33.3%) |
| Computers & Mathematics | 58 (85.3%) | 10 (14.7%) |
| Architecture & Engineering | 35 (53.8%) | 30 (46.2%) |
| Life, Physical & Social Science | 9 (45.0%) | 11 (55.0%) |
| Community & Social Service | 172 (23.4%) | 564 (76.6%) |
| Education, Arts & Media | 0 (0.0%) | 55 (100.0%) |
| Legal Services & Support | 27 (36.0%) | 48 (64.0%) |
| Education Instruction & Library | 105 (25.2%) | 311 (74.8%) |
| Arts, Media & Entertainment | 40 (21.0%) | 150 (78.9%) |
| Health Diagnosing & Treating | 32 (14.6%) | 187 (85.4%) |
| Health Technologists | 32 (26.5%) | 89 (73.6%) |
| Total (Category) | 966 (50.4%) | 951 (49.6%) |
| Total (Overall) | 1,635 (54.7%) | 1,352 (45.3%) |
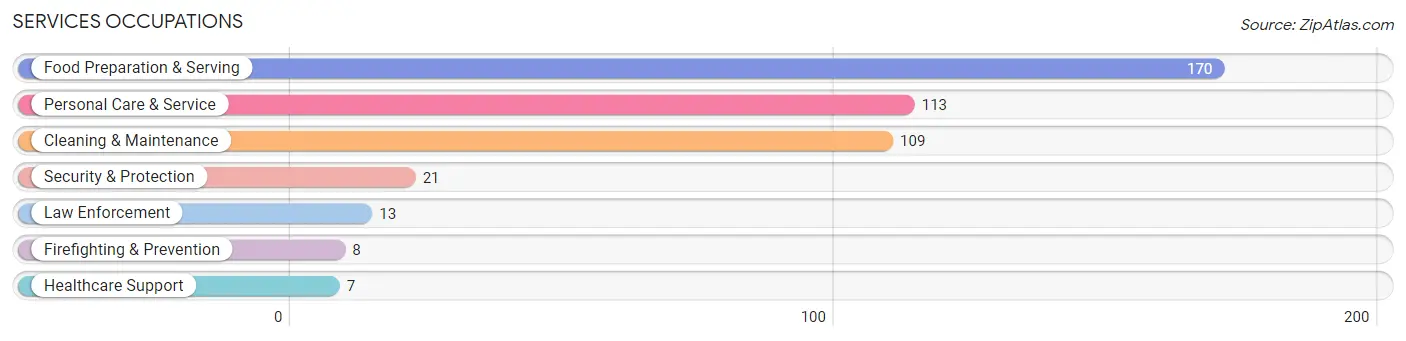
Services Occupations
The most common Services occupations in North Scituate are Food Preparation & Serving (170 | 5.7%), Personal Care & Service (113 | 3.8%), Cleaning & Maintenance (109 | 3.6%), Security & Protection (21 | 0.7%), and Law Enforcement (13 | 0.4%).
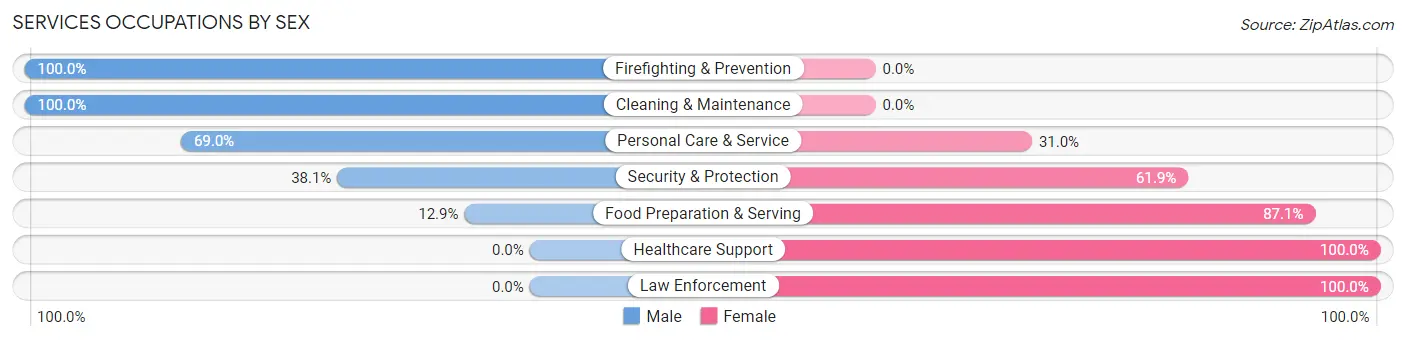
Services Occupations by Sex
Within the Services occupations in North Scituate, the most male-oriented occupations are Firefighting & Prevention (100.0%), Cleaning & Maintenance (100.0%), and Personal Care & Service (69.0%), while the most female-oriented occupations are Healthcare Support (100.0%), Law Enforcement (100.0%), and Food Preparation & Serving (87.1%).
| Occupation | Male | Female |
| Healthcare Support | 0 (0.0%) | 7 (100.0%) |
| Security & Protection | 8 (38.1%) | 13 (61.9%) |
| Firefighting & Prevention | 8 (100.0%) | 0 (0.0%) |
| Law Enforcement | 0 (0.0%) | 13 (100.0%) |
| Food Preparation & Serving | 22 (12.9%) | 148 (87.1%) |
| Cleaning & Maintenance | 109 (100.0%) | 0 (0.0%) |
| Personal Care & Service | 78 (69.0%) | 35 (31.0%) |
| Total (Category) | 217 (51.7%) | 203 (48.3%) |
| Total (Overall) | 1,635 (54.7%) | 1,352 (45.3%) |
Sales and Office Occupations
The most common Sales and Office occupations in North Scituate are Sales & Related (208 | 7.0%), and Office & Administration (156 | 5.2%).
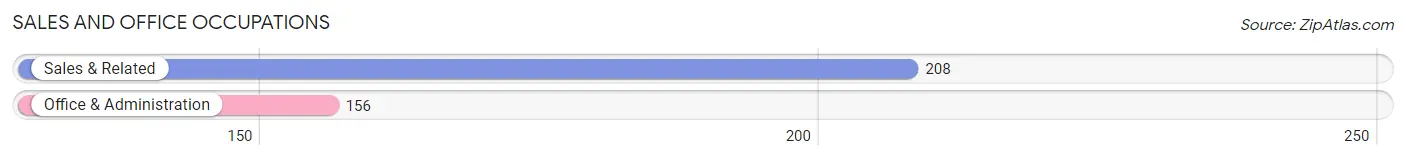
Sales and Office Occupations by Sex
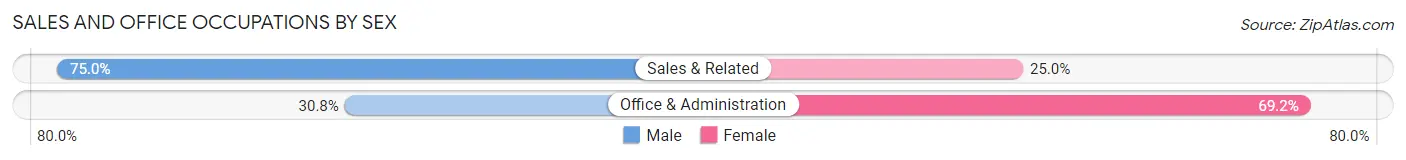
| Occupation | Male | Female |
| Sales & Related | 156 (75.0%) | 52 (25.0%) |
| Office & Administration | 48 (30.8%) | 108 (69.2%) |
| Total (Category) | 204 (56.0%) | 160 (44.0%) |
| Total (Overall) | 1,635 (54.7%) | 1,352 (45.3%) |
Natural Resources, Construction and Maintenance Occupations
The most common Natural Resources, Construction and Maintenance occupations in North Scituate are Construction & Extraction (180 | 6.0%), Installation, Maintenance & Repair (11 | 0.4%), and Farming, Fishing & Forestry (5 | 0.2%).
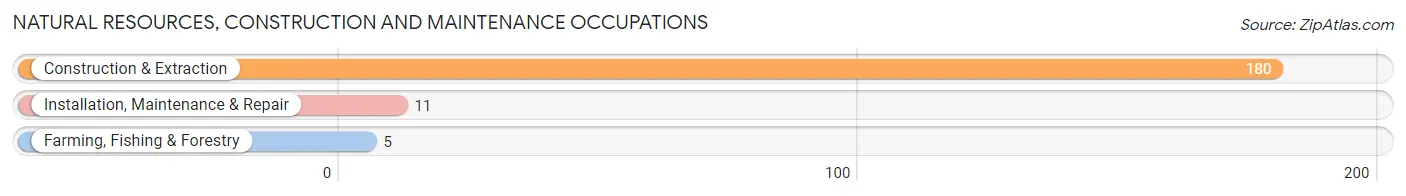
Natural Resources, Construction and Maintenance Occupations by Sex
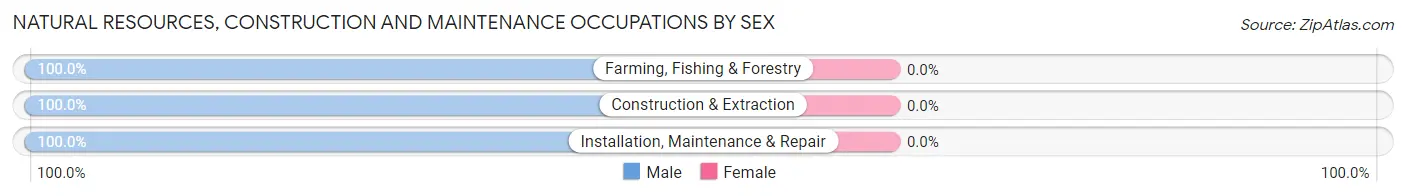
| Occupation | Male | Female |
| Farming, Fishing & Forestry | 5 (100.0%) | 0 (0.0%) |
| Construction & Extraction | 180 (100.0%) | 0 (0.0%) |
| Installation, Maintenance & Repair | 11 (100.0%) | 0 (0.0%) |
| Total (Category) | 196 (100.0%) | 0 (0.0%) |
| Total (Overall) | 1,635 (54.7%) | 1,352 (45.3%) |
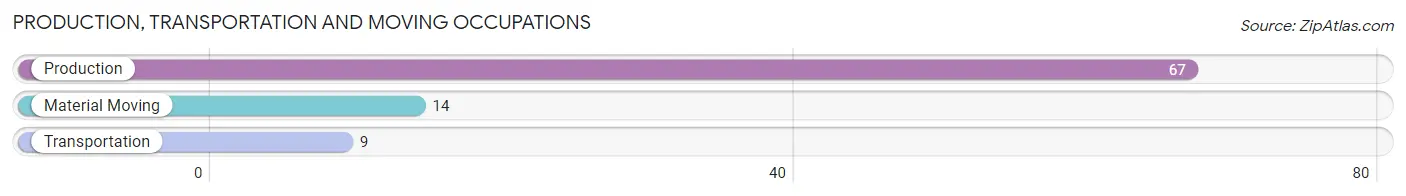
Production, Transportation and Moving Occupations
The most common Production, Transportation and Moving occupations in North Scituate are Production (67 | 2.2%), Material Moving (14 | 0.5%), and Transportation (9 | 0.3%).
Production, Transportation and Moving Occupations by Sex
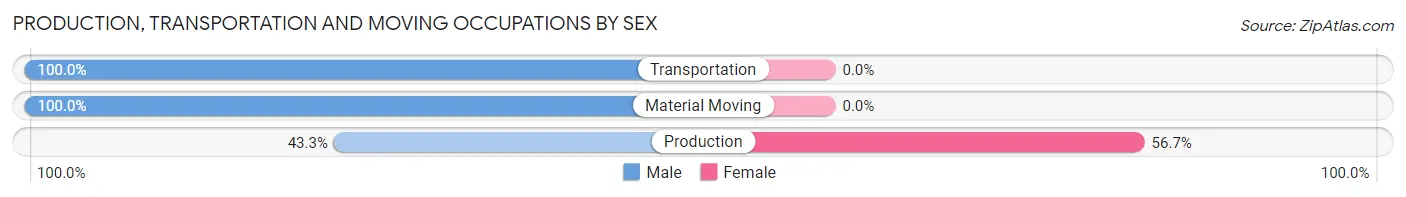
| Occupation | Male | Female |
| Production | 29 (43.3%) | 38 (56.7%) |
| Transportation | 9 (100.0%) | 0 (0.0%) |
| Material Moving | 14 (100.0%) | 0 (0.0%) |
| Total (Category) | 52 (57.8%) | 38 (42.2%) |
| Total (Overall) | 1,635 (54.7%) | 1,352 (45.3%) |
Employment Industries by Sex in North Scituate
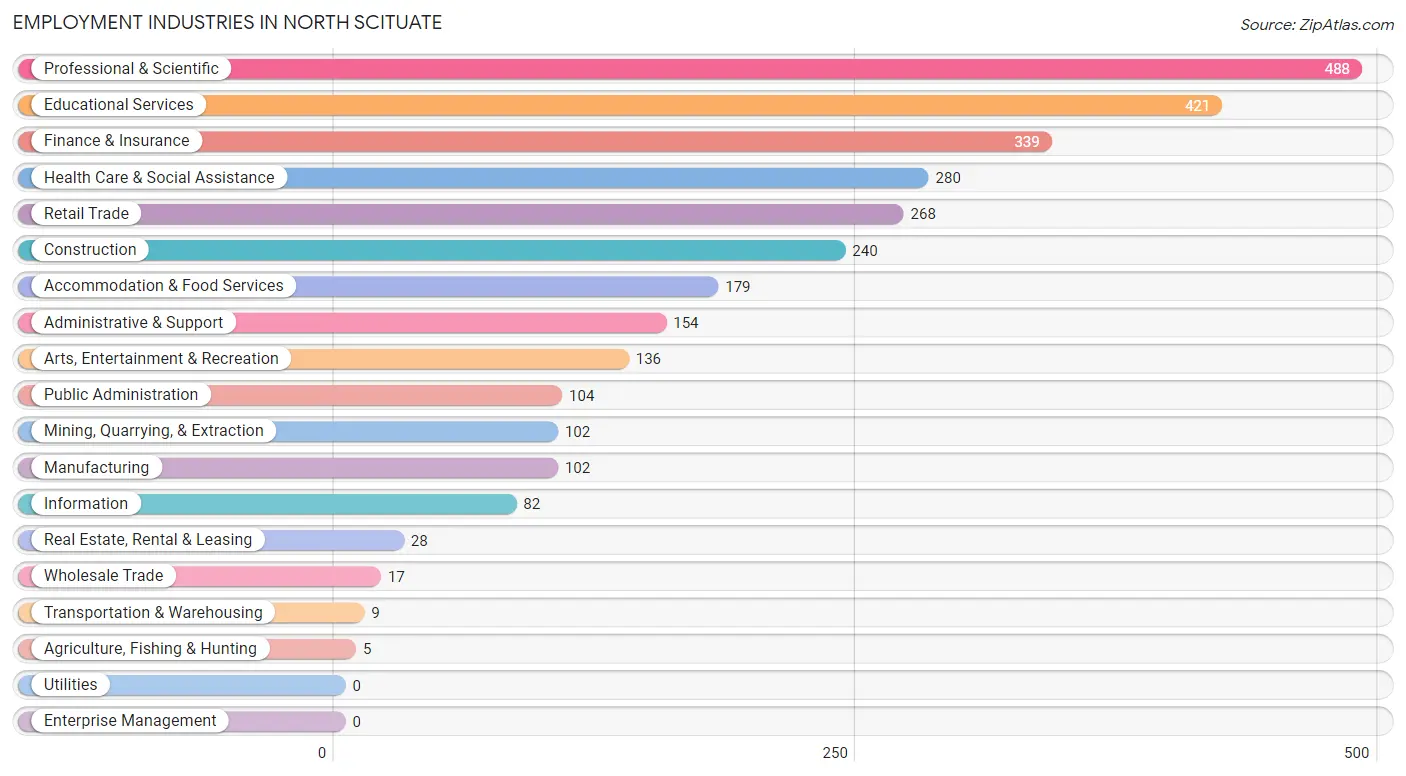
Employment Industries in North Scituate
The major employment industries in North Scituate include Professional & Scientific (488 | 16.3%), Educational Services (421 | 14.1%), Finance & Insurance (339 | 11.4%), Health Care & Social Assistance (280 | 9.4%), and Retail Trade (268 | 9.0%).
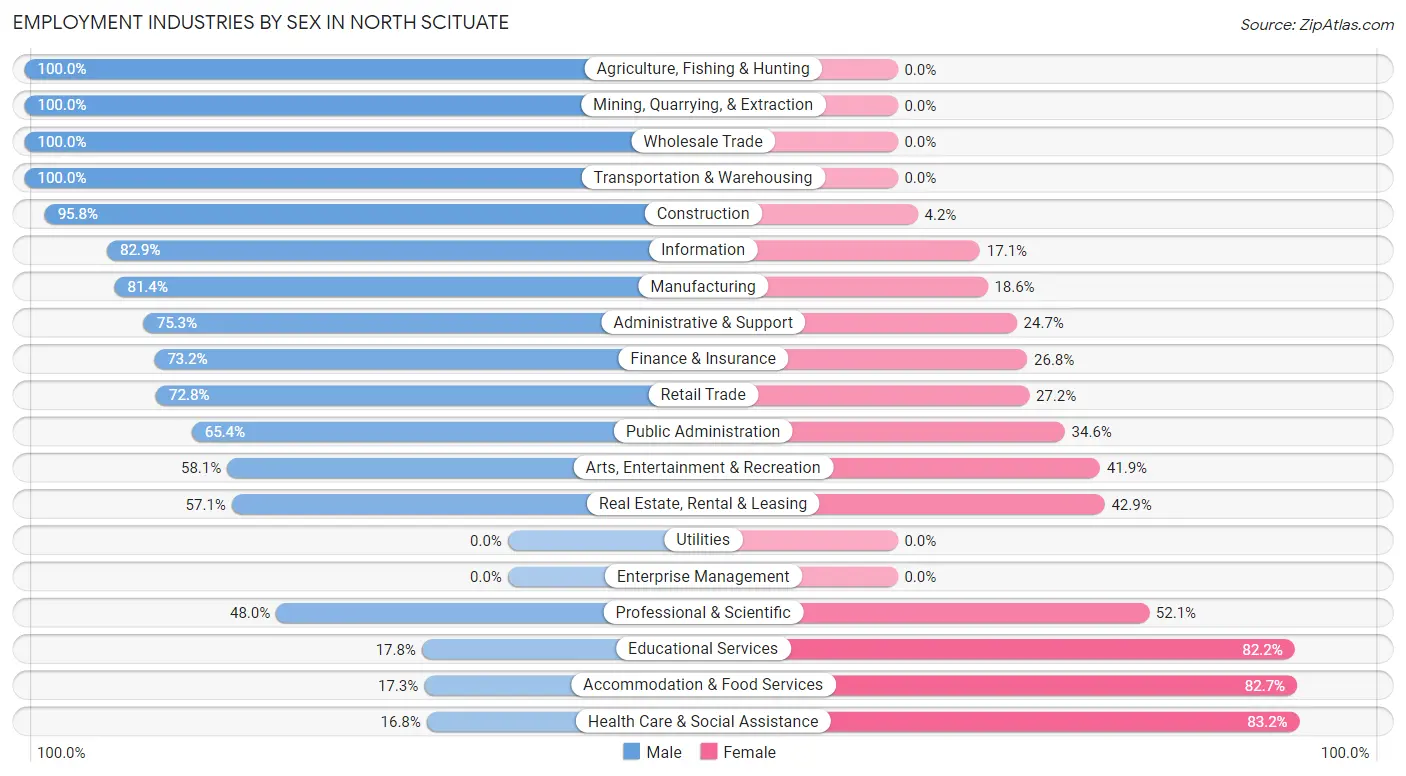
Employment Industries by Sex in North Scituate
The North Scituate industries that see more men than women are Agriculture, Fishing & Hunting (100.0%), Mining, Quarrying, & Extraction (100.0%), and Wholesale Trade (100.0%), whereas the industries that tend to have a higher number of women are Health Care & Social Assistance (83.2%), Accommodation & Food Services (82.7%), and Educational Services (82.2%).
| Industry | Male | Female |
| Agriculture, Fishing & Hunting | 5 (100.0%) | 0 (0.0%) |
| Mining, Quarrying, & Extraction | 102 (100.0%) | 0 (0.0%) |
| Construction | 230 (95.8%) | 10 (4.2%) |
| Manufacturing | 83 (81.4%) | 19 (18.6%) |
| Wholesale Trade | 17 (100.0%) | 0 (0.0%) |
| Retail Trade | 195 (72.8%) | 73 (27.2%) |
| Transportation & Warehousing | 9 (100.0%) | 0 (0.0%) |
| Utilities | 0 (0.0%) | 0 (0.0%) |
| Information | 68 (82.9%) | 14 (17.1%) |
| Finance & Insurance | 248 (73.2%) | 91 (26.8%) |
| Real Estate, Rental & Leasing | 16 (57.1%) | 12 (42.9%) |
| Professional & Scientific | 234 (47.9%) | 254 (52.0%) |
| Enterprise Management | 0 (0.0%) | 0 (0.0%) |
| Administrative & Support | 116 (75.3%) | 38 (24.7%) |
| Educational Services | 75 (17.8%) | 346 (82.2%) |
| Health Care & Social Assistance | 47 (16.8%) | 233 (83.2%) |
| Arts, Entertainment & Recreation | 79 (58.1%) | 57 (41.9%) |
| Accommodation & Food Services | 31 (17.3%) | 148 (82.7%) |
| Public Administration | 68 (65.4%) | 36 (34.6%) |
| Total | 1,635 (54.7%) | 1,352 (45.3%) |
Education in North Scituate
School Enrollment in North Scituate
The most common levels of schooling among the 1,596 students in North Scituate are college / undergraduate (500 | 31.3%), middle school (345 | 21.6%), and high school (306 | 19.2%).
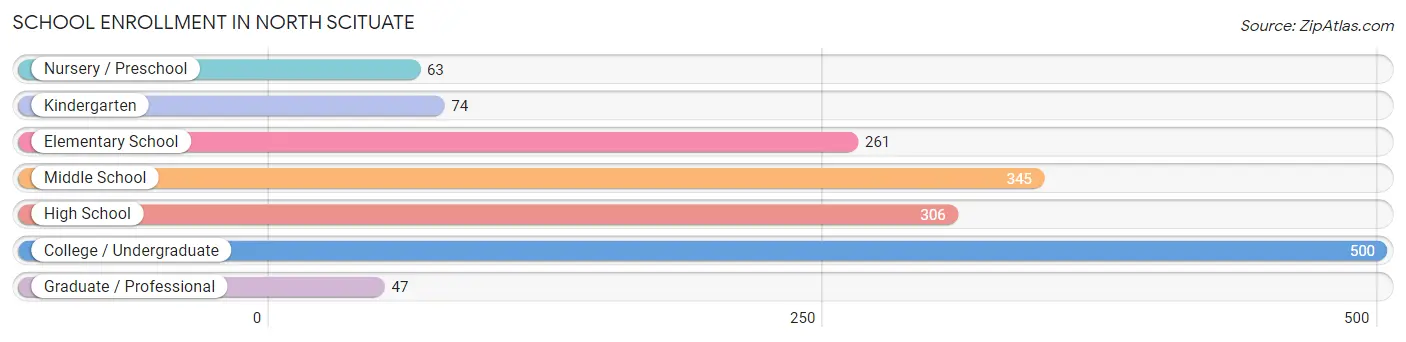
| School Level | # Students | % Students |
| Nursery / Preschool | 63 | 4.0% |
| Kindergarten | 74 | 4.6% |
| Elementary School | 261 | 16.4% |
| Middle School | 345 | 21.6% |
| High School | 306 | 19.2% |
| College / Undergraduate | 500 | 31.3% |
| Graduate / Professional | 47 | 2.9% |
| Total | 1,596 | 100.0% |
School Enrollment by Age by Funding Source in North Scituate
Out of a total of 1,596 students who are enrolled in schools in North Scituate, 332 (20.8%) attend a private institution, while the remaining 1,264 (79.2%) are enrolled in public schools. The age group of 3 to 4 year olds has the highest likelihood of being enrolled in private schools, with 40 (100.0% in the age bracket) enrolled. Conversely, the age group of 10 to 14 year olds has the lowest likelihood of being enrolled in a private school, with 425 (100.0% in the age bracket) attending a public institution.
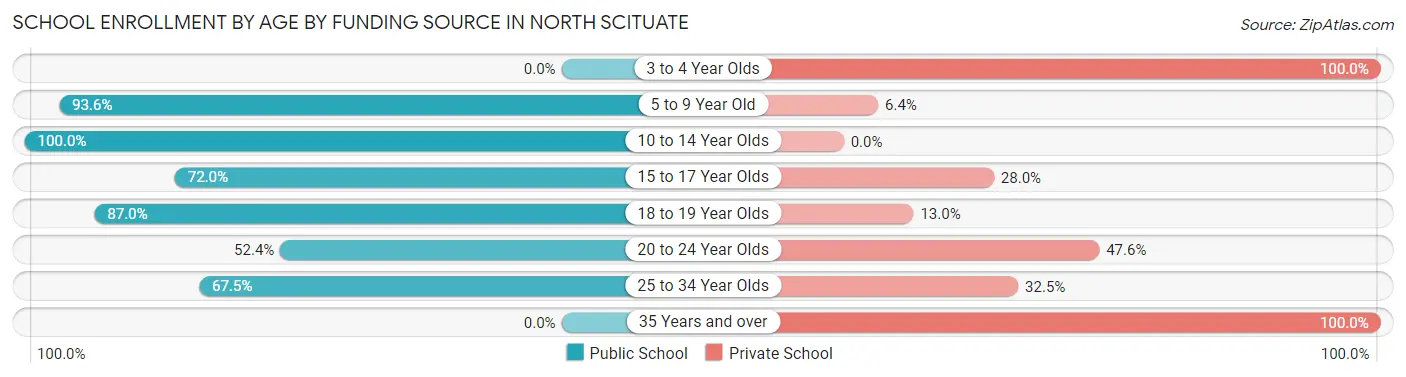
| Age Bracket | Public School | Private School |
| 3 to 4 Year Olds | 0 (0.0%) | 40 (100.0%) |
| 5 to 9 Year Old | 335 (93.6%) | 23 (6.4%) |
| 10 to 14 Year Olds | 425 (100.0%) | 0 (0.0%) |
| 15 to 17 Year Olds | 139 (72.0%) | 54 (28.0%) |
| 18 to 19 Year Olds | 174 (87.0%) | 26 (13.0%) |
| 20 to 24 Year Olds | 164 (52.4%) | 149 (47.6%) |
| 25 to 34 Year Olds | 27 (67.5%) | 13 (32.5%) |
| 35 Years and over | 0 (0.0%) | 27 (100.0%) |
| Total | 1,264 (79.2%) | 332 (20.8%) |
Educational Attainment by Field of Study in North Scituate
Business (636 | 20.2%), education (356 | 11.3%), engineering (353 | 11.2%), social sciences (349 | 11.1%), and visual & performing arts (272 | 8.6%) are the most common fields of study among 3,155 individuals in North Scituate who have obtained a bachelor's degree or higher.
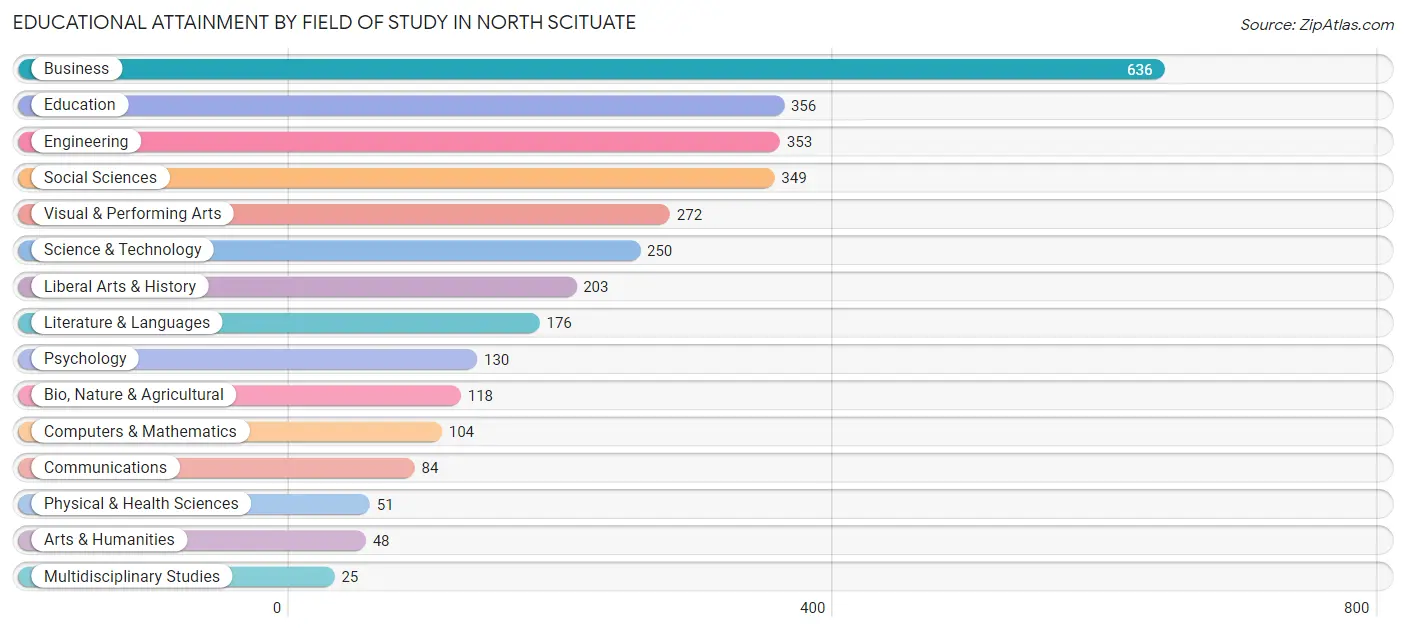
| Field of Study | # Graduates | % Graduates |
| Computers & Mathematics | 104 | 3.3% |
| Bio, Nature & Agricultural | 118 | 3.7% |
| Physical & Health Sciences | 51 | 1.6% |
| Psychology | 130 | 4.1% |
| Social Sciences | 349 | 11.1% |
| Engineering | 353 | 11.2% |
| Multidisciplinary Studies | 25 | 0.8% |
| Science & Technology | 250 | 7.9% |
| Business | 636 | 20.2% |
| Education | 356 | 11.3% |
| Literature & Languages | 176 | 5.6% |
| Liberal Arts & History | 203 | 6.4% |
| Visual & Performing Arts | 272 | 8.6% |
| Communications | 84 | 2.7% |
| Arts & Humanities | 48 | 1.5% |
| Total | 3,155 | 100.0% |
Transportation & Commute in North Scituate
Vehicle Availability by Sex in North Scituate
The most prevalent vehicle ownership categories in North Scituate are males with 2 vehicles (741, accounting for 45.3%) and females with 2 vehicles (407, making up 55.6%).
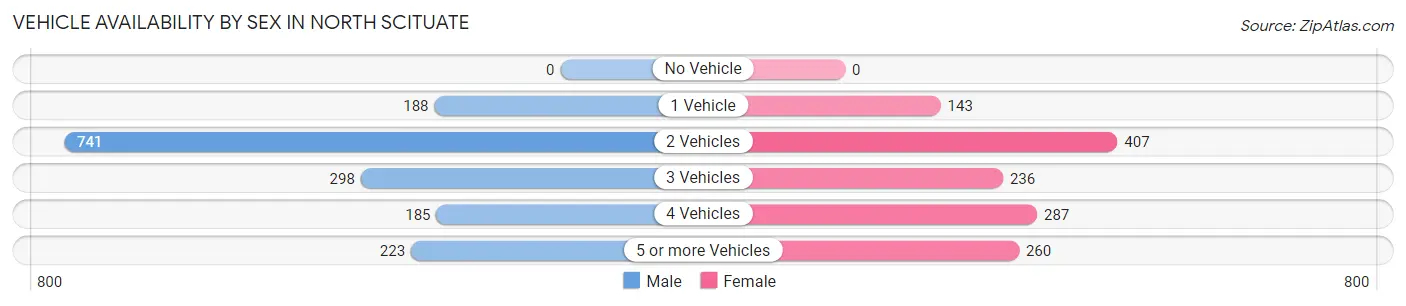
| Vehicles Available | Male | Female |
| No Vehicle | 0 (0.0%) | 0 (0.0%) |
| 1 Vehicle | 188 (11.5%) | 143 (10.7%) |
| 2 Vehicles | 741 (45.3%) | 407 (30.5%) |
| 3 Vehicles | 298 (18.2%) | 236 (17.7%) |
| 4 Vehicles | 185 (11.3%) | 287 (21.5%) |
| 5 or more Vehicles | 223 (13.6%) | 260 (19.5%) |
| Total | 1,635 (100.0%) | 1,333 (100.0%) |
Commute Time in North Scituate
The most frequently occuring commute durations in North Scituate are 60 to 89 minutes (391 commuters, 17.8%), 10 to 14 minutes (328 commuters, 15.0%), and 25 to 29 minutes (311 commuters, 14.2%).
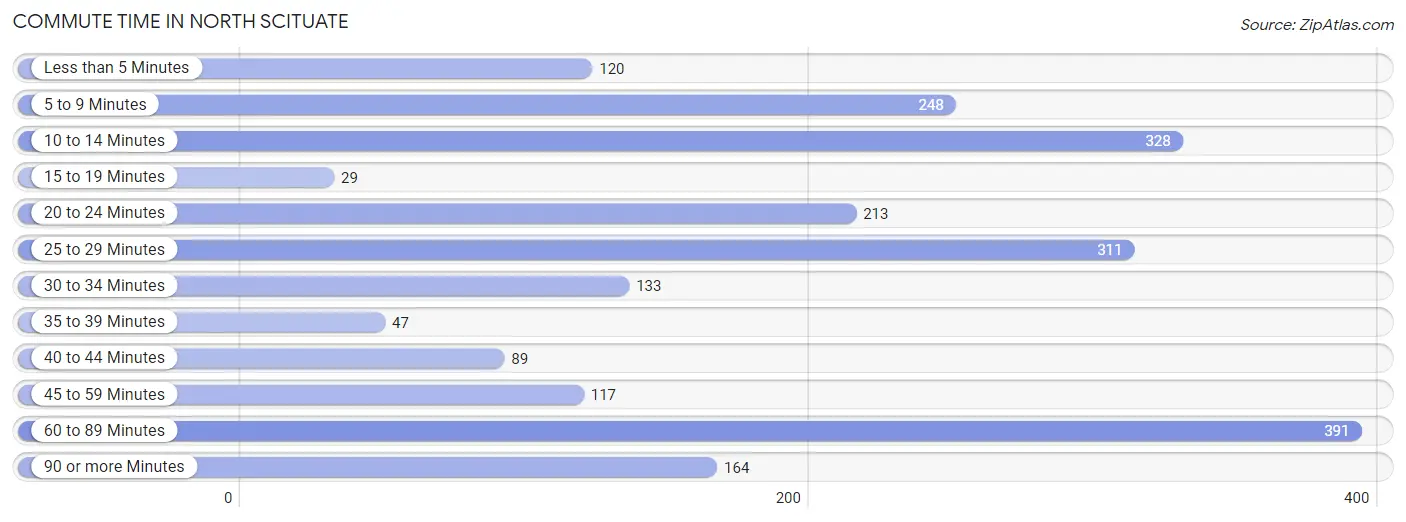
| Commute Time | # Commuters | % Commuters |
| Less than 5 Minutes | 120 | 5.5% |
| 5 to 9 Minutes | 248 | 11.3% |
| 10 to 14 Minutes | 328 | 15.0% |
| 15 to 19 Minutes | 29 | 1.3% |
| 20 to 24 Minutes | 213 | 9.7% |
| 25 to 29 Minutes | 311 | 14.2% |
| 30 to 34 Minutes | 133 | 6.1% |
| 35 to 39 Minutes | 47 | 2.1% |
| 40 to 44 Minutes | 89 | 4.1% |
| 45 to 59 Minutes | 117 | 5.3% |
| 60 to 89 Minutes | 391 | 17.8% |
| 90 or more Minutes | 164 | 7.5% |
Commute Time by Sex in North Scituate
The most common commute times in North Scituate are 60 to 89 minutes (200 commuters, 17.2%) for males and 60 to 89 minutes (191 commuters, 18.6%) for females.
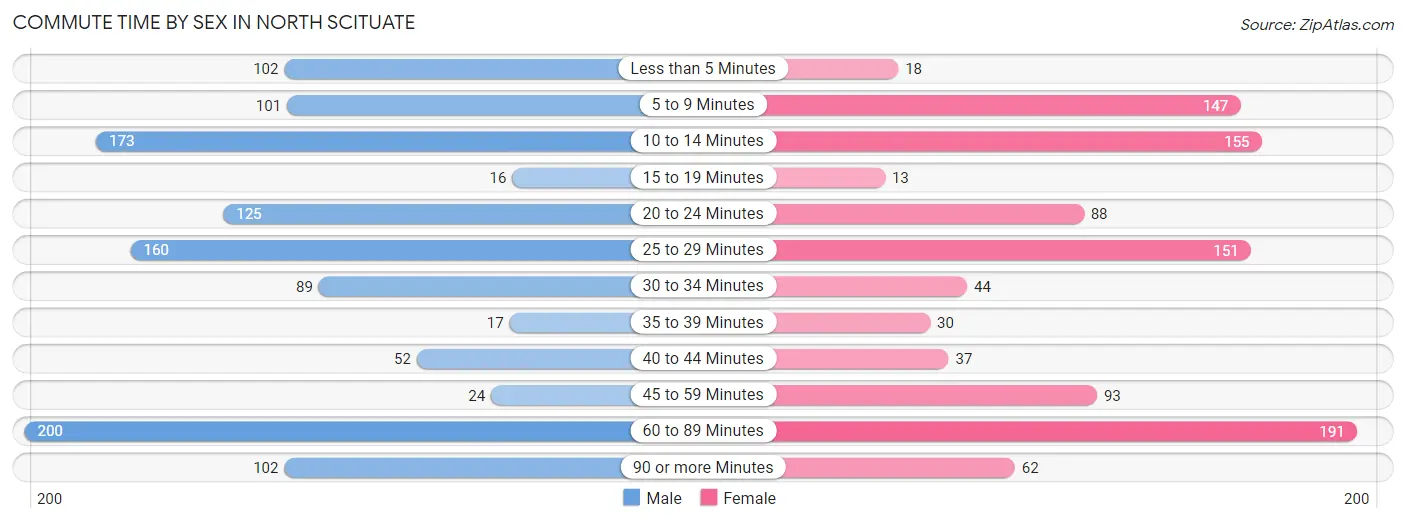
| Commute Time | Male | Female |
| Less than 5 Minutes | 102 (8.8%) | 18 (1.8%) |
| 5 to 9 Minutes | 101 (8.7%) | 147 (14.3%) |
| 10 to 14 Minutes | 173 (14.9%) | 155 (15.1%) |
| 15 to 19 Minutes | 16 (1.4%) | 13 (1.3%) |
| 20 to 24 Minutes | 125 (10.8%) | 88 (8.6%) |
| 25 to 29 Minutes | 160 (13.8%) | 151 (14.7%) |
| 30 to 34 Minutes | 89 (7.7%) | 44 (4.3%) |
| 35 to 39 Minutes | 17 (1.5%) | 30 (2.9%) |
| 40 to 44 Minutes | 52 (4.5%) | 37 (3.6%) |
| 45 to 59 Minutes | 24 (2.1%) | 93 (9.0%) |
| 60 to 89 Minutes | 200 (17.2%) | 191 (18.6%) |
| 90 or more Minutes | 102 (8.8%) | 62 (6.0%) |
Time of Departure to Work by Sex in North Scituate
The most frequent times of departure to work in North Scituate are 7:00 AM to 7:29 AM (327, 28.2%) for males and 7:00 AM to 7:29 AM (320, 31.1%) for females.
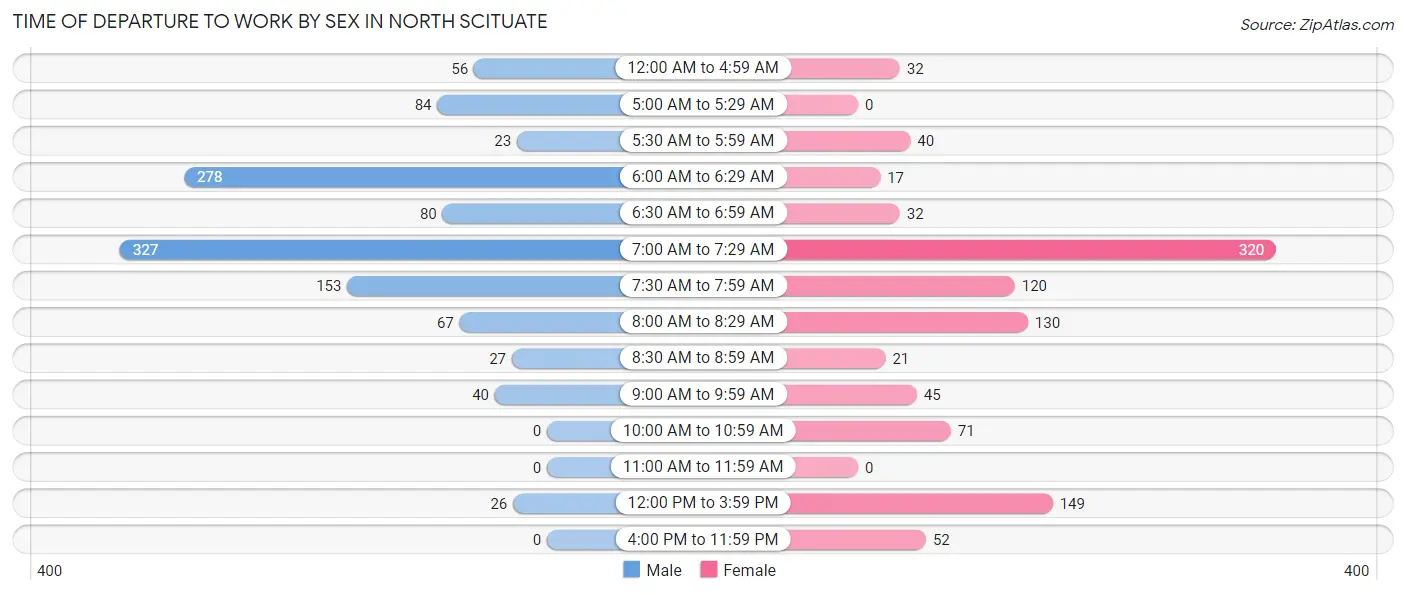
| Time of Departure | Male | Female |
| 12:00 AM to 4:59 AM | 56 (4.8%) | 32 (3.1%) |
| 5:00 AM to 5:29 AM | 84 (7.2%) | 0 (0.0%) |
| 5:30 AM to 5:59 AM | 23 (2.0%) | 40 (3.9%) |
| 6:00 AM to 6:29 AM | 278 (23.9%) | 17 (1.7%) |
| 6:30 AM to 6:59 AM | 80 (6.9%) | 32 (3.1%) |
| 7:00 AM to 7:29 AM | 327 (28.2%) | 320 (31.1%) |
| 7:30 AM to 7:59 AM | 153 (13.2%) | 120 (11.7%) |
| 8:00 AM to 8:29 AM | 67 (5.8%) | 130 (12.6%) |
| 8:30 AM to 8:59 AM | 27 (2.3%) | 21 (2.0%) |
| 9:00 AM to 9:59 AM | 40 (3.5%) | 45 (4.4%) |
| 10:00 AM to 10:59 AM | 0 (0.0%) | 71 (6.9%) |
| 11:00 AM to 11:59 AM | 0 (0.0%) | 0 (0.0%) |
| 12:00 PM to 3:59 PM | 26 (2.2%) | 149 (14.5%) |
| 4:00 PM to 11:59 PM | 0 (0.0%) | 52 (5.1%) |
| Total | 1,161 (100.0%) | 1,029 (100.0%) |
Housing Occupancy in North Scituate
Occupancy by Ownership in North Scituate
Of the total 2,028 dwellings in North Scituate, owner-occupied units account for 1,797 (88.6%), while renter-occupied units make up 231 (11.4%).
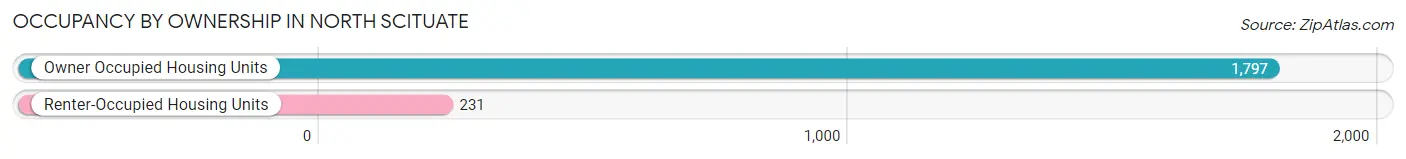
| Occupancy | # Housing Units | % Housing Units |
| Owner Occupied Housing Units | 1,797 | 88.6% |
| Renter-Occupied Housing Units | 231 | 11.4% |
| Total Occupied Housing Units | 2,028 | 100.0% |
Occupancy by Household Size in North Scituate
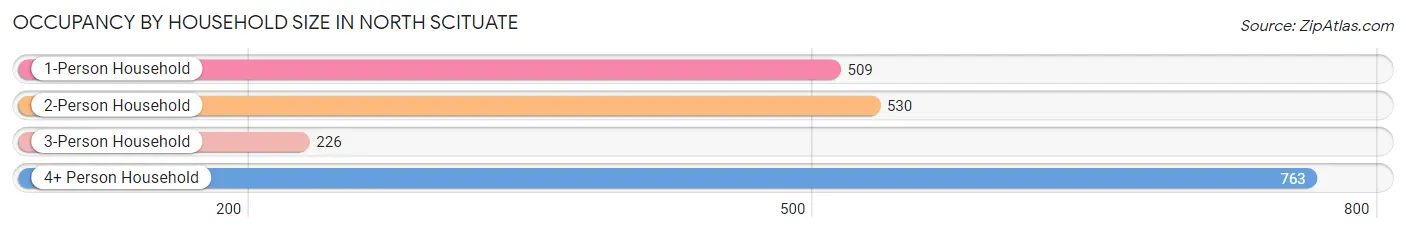
| Household Size | # Housing Units | % Housing Units |
| 1-Person Household | 509 | 25.1% |
| 2-Person Household | 530 | 26.1% |
| 3-Person Household | 226 | 11.1% |
| 4+ Person Household | 763 | 37.6% |
| Total Housing Units | 2,028 | 100.0% |
Occupancy by Ownership by Household Size in North Scituate
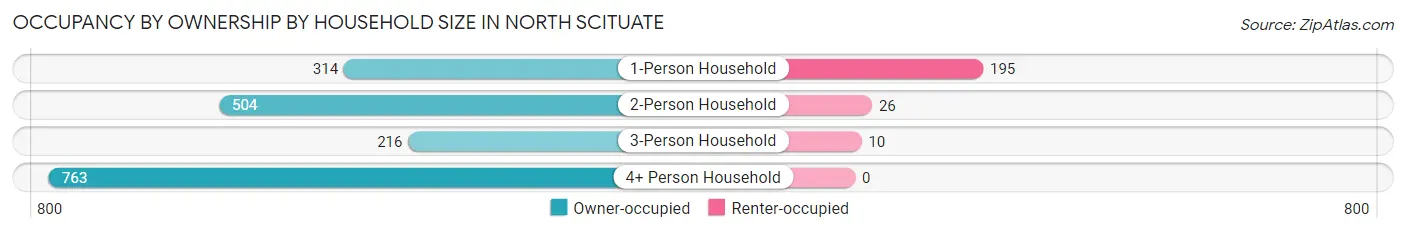
| Household Size | Owner-occupied | Renter-occupied |
| 1-Person Household | 314 (61.7%) | 195 (38.3%) |
| 2-Person Household | 504 (95.1%) | 26 (4.9%) |
| 3-Person Household | 216 (95.6%) | 10 (4.4%) |
| 4+ Person Household | 763 (100.0%) | 0 (0.0%) |
| Total Housing Units | 1,797 (88.6%) | 231 (11.4%) |
Occupancy by Educational Attainment in North Scituate
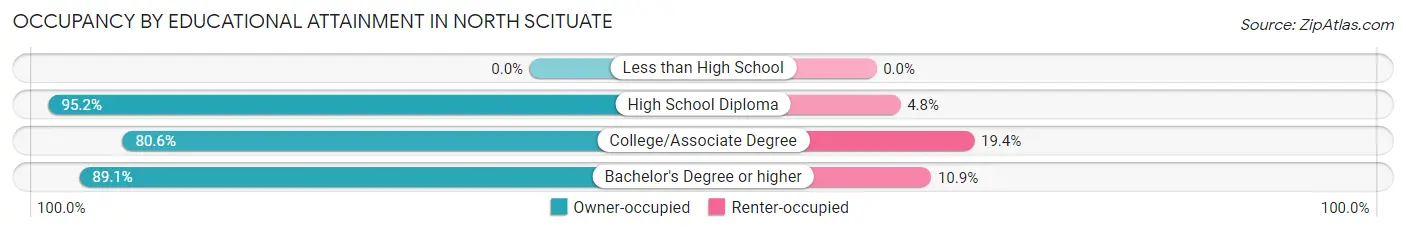
| Household Size | Owner-occupied | Renter-occupied |
| Less than High School | 0 (0.0%) | 0 (0.0%) |
| High School Diploma | 200 (95.2%) | 10 (4.8%) |
| College/Associate Degree | 220 (80.6%) | 53 (19.4%) |
| Bachelor's Degree or higher | 1,377 (89.1%) | 168 (10.9%) |
Occupancy by Age of Householder in North Scituate
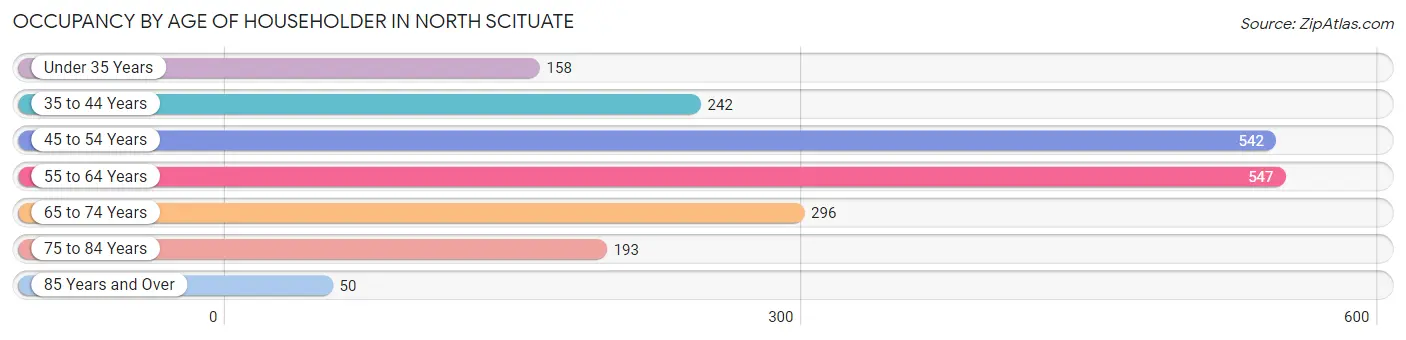
| Age Bracket | # Households | % Households |
| Under 35 Years | 158 | 7.8% |
| 35 to 44 Years | 242 | 11.9% |
| 45 to 54 Years | 542 | 26.7% |
| 55 to 64 Years | 547 | 27.0% |
| 65 to 74 Years | 296 | 14.6% |
| 75 to 84 Years | 193 | 9.5% |
| 85 Years and Over | 50 | 2.5% |
| Total | 2,028 | 100.0% |
Housing Finances in North Scituate
Median Income by Occupancy in North Scituate
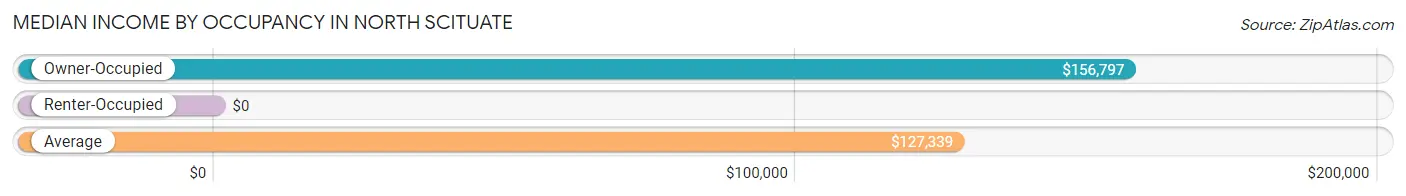
| Occupancy Type | # Households | Median Income |
| Owner-Occupied | 1,797 (88.6%) | $156,797 |
| Renter-Occupied | 231 (11.4%) | $0 |
| Average | 2,028 (100.0%) | $127,339 |
Occupancy by Householder Income Bracket in North Scituate
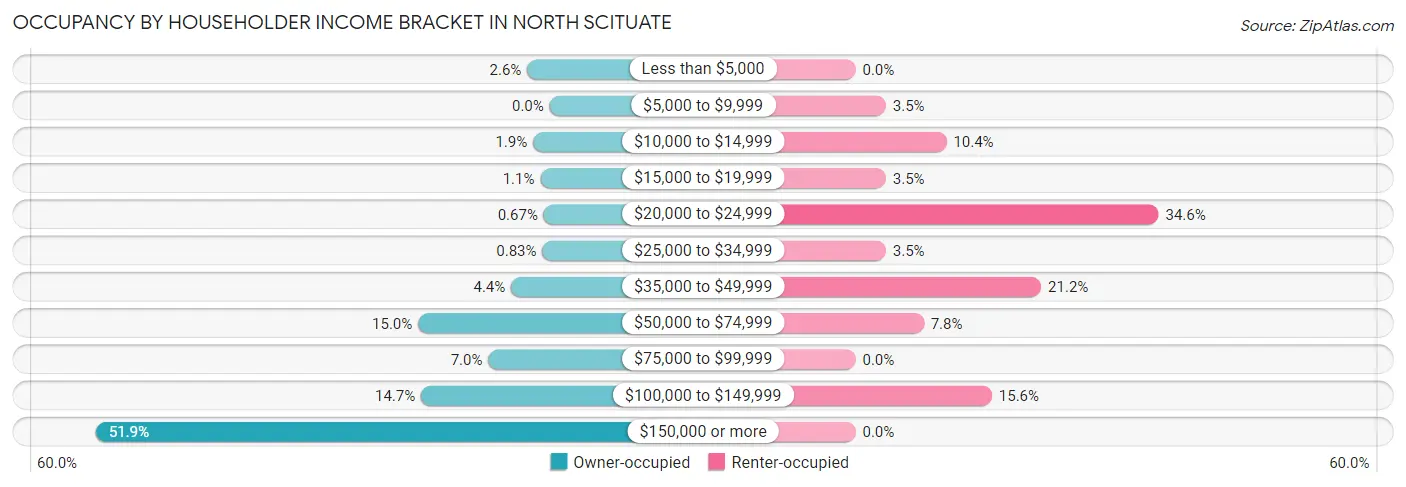
| Income Bracket | Owner-occupied | Renter-occupied |
| Less than $5,000 | 46 (2.6%) | 0 (0.0%) |
| $5,000 to $9,999 | 0 (0.0%) | 8 (3.5%) |
| $10,000 to $14,999 | 34 (1.9%) | 24 (10.4%) |
| $15,000 to $19,999 | 19 (1.1%) | 8 (3.5%) |
| $20,000 to $24,999 | 12 (0.7%) | 80 (34.6%) |
| $25,000 to $34,999 | 15 (0.8%) | 8 (3.5%) |
| $35,000 to $49,999 | 79 (4.4%) | 49 (21.2%) |
| $50,000 to $74,999 | 270 (15.0%) | 18 (7.8%) |
| $75,000 to $99,999 | 126 (7.0%) | 0 (0.0%) |
| $100,000 to $149,999 | 264 (14.7%) | 36 (15.6%) |
| $150,000 or more | 932 (51.9%) | 0 (0.0%) |
| Total | 1,797 (100.0%) | 231 (100.0%) |
Monthly Housing Cost Tiers in North Scituate
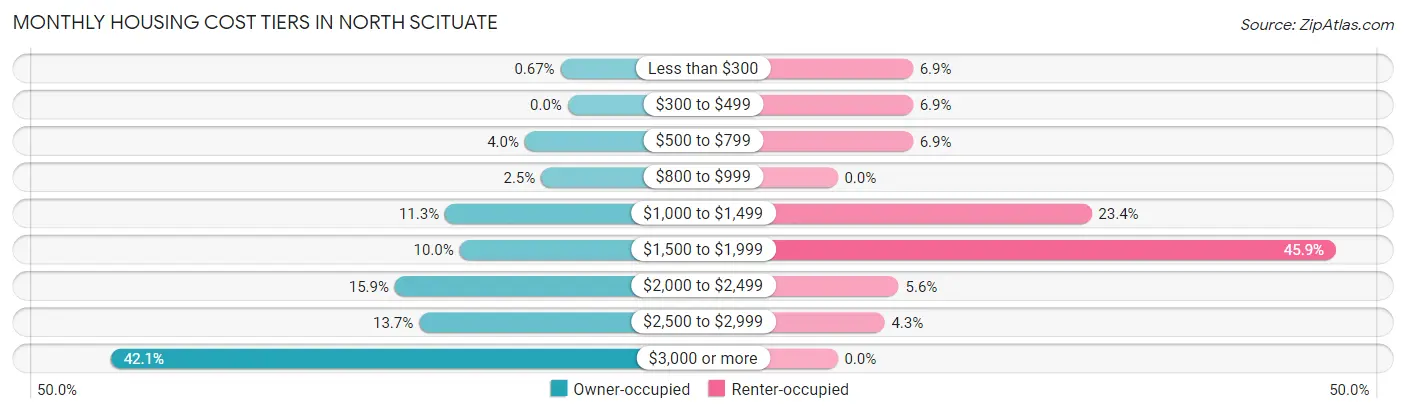
| Monthly Cost | Owner-occupied | Renter-occupied |
| Less than $300 | 12 (0.7%) | 16 (6.9%) |
| $300 to $499 | 0 (0.0%) | 16 (6.9%) |
| $500 to $799 | 71 (4.0%) | 16 (6.9%) |
| $800 to $999 | 44 (2.5%) | 0 (0.0%) |
| $1,000 to $1,499 | 203 (11.3%) | 54 (23.4%) |
| $1,500 to $1,999 | 179 (10.0%) | 106 (45.9%) |
| $2,000 to $2,499 | 286 (15.9%) | 13 (5.6%) |
| $2,500 to $2,999 | 246 (13.7%) | 10 (4.3%) |
| $3,000 or more | 756 (42.1%) | 0 (0.0%) |
| Total | 1,797 (100.0%) | 231 (100.0%) |
Physical Housing Characteristics in North Scituate
Housing Structures in North Scituate
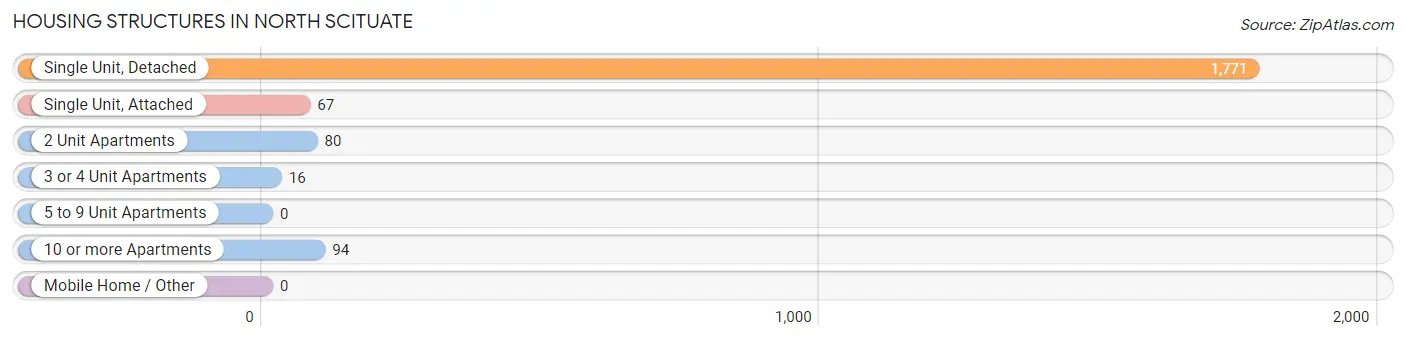
| Structure Type | # Housing Units | % Housing Units |
| Single Unit, Detached | 1,771 | 87.3% |
| Single Unit, Attached | 67 | 3.3% |
| 2 Unit Apartments | 80 | 3.9% |
| 3 or 4 Unit Apartments | 16 | 0.8% |
| 5 to 9 Unit Apartments | 0 | 0.0% |
| 10 or more Apartments | 94 | 4.6% |
| Mobile Home / Other | 0 | 0.0% |
| Total | 2,028 | 100.0% |
Housing Structures by Occupancy in North Scituate
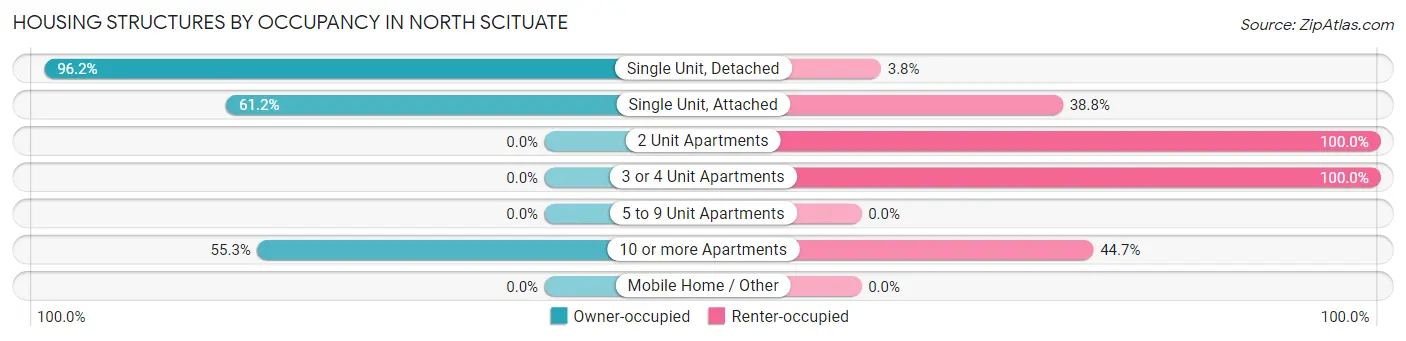
| Structure Type | Owner-occupied | Renter-occupied |
| Single Unit, Detached | 1,704 (96.2%) | 67 (3.8%) |
| Single Unit, Attached | 41 (61.2%) | 26 (38.8%) |
| 2 Unit Apartments | 0 (0.0%) | 80 (100.0%) |
| 3 or 4 Unit Apartments | 0 (0.0%) | 16 (100.0%) |
| 5 to 9 Unit Apartments | 0 (0.0%) | 0 (0.0%) |
| 10 or more Apartments | 52 (55.3%) | 42 (44.7%) |
| Mobile Home / Other | 0 (0.0%) | 0 (0.0%) |
| Total | 1,797 (88.6%) | 231 (11.4%) |
Housing Structures by Number of Rooms in North Scituate
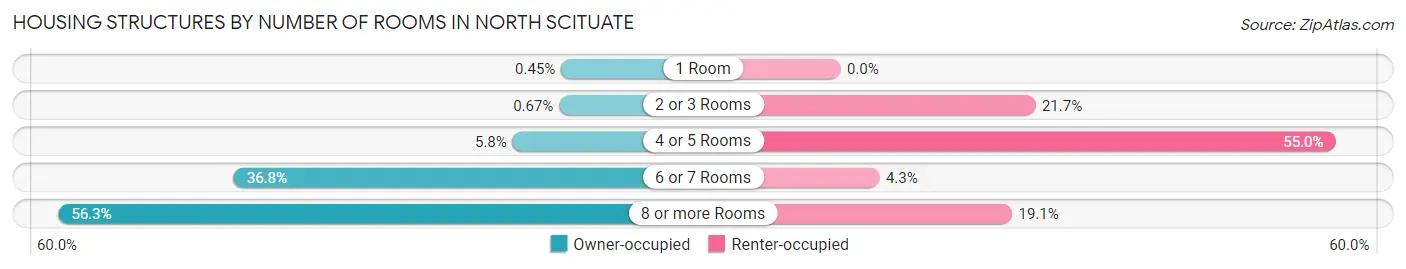
| Number of Rooms | Owner-occupied | Renter-occupied |
| 1 Room | 8 (0.4%) | 0 (0.0%) |
| 2 or 3 Rooms | 12 (0.7%) | 50 (21.6%) |
| 4 or 5 Rooms | 105 (5.8%) | 127 (55.0%) |
| 6 or 7 Rooms | 661 (36.8%) | 10 (4.3%) |
| 8 or more Rooms | 1,011 (56.3%) | 44 (19.1%) |
| Total | 1,797 (100.0%) | 231 (100.0%) |
Housing Structure by Heating Type in North Scituate
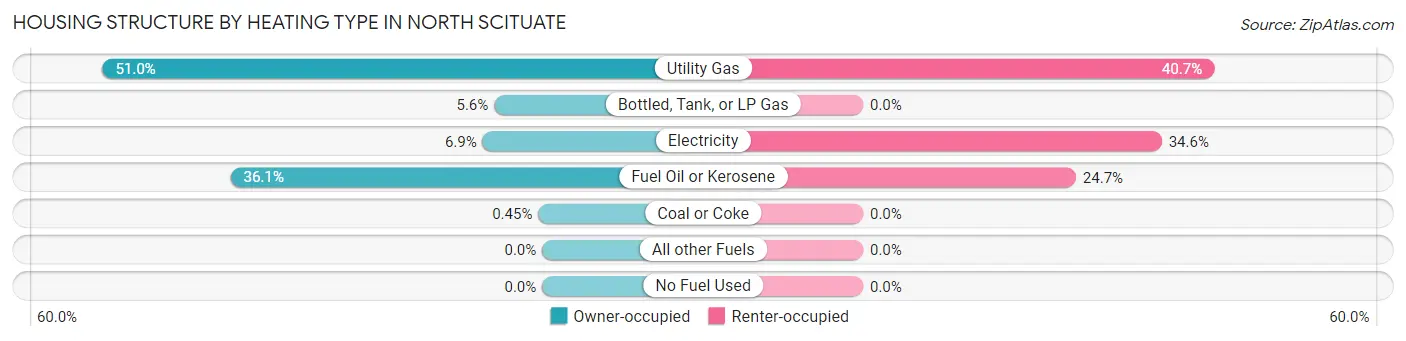
| Heating Type | Owner-occupied | Renter-occupied |
| Utility Gas | 916 (51.0%) | 94 (40.7%) |
| Bottled, Tank, or LP Gas | 100 (5.6%) | 0 (0.0%) |
| Electricity | 124 (6.9%) | 80 (34.6%) |
| Fuel Oil or Kerosene | 649 (36.1%) | 57 (24.7%) |
| Coal or Coke | 8 (0.4%) | 0 (0.0%) |
| All other Fuels | 0 (0.0%) | 0 (0.0%) |
| No Fuel Used | 0 (0.0%) | 0 (0.0%) |
| Total | 1,797 (100.0%) | 231 (100.0%) |
Household Vehicle Usage in North Scituate
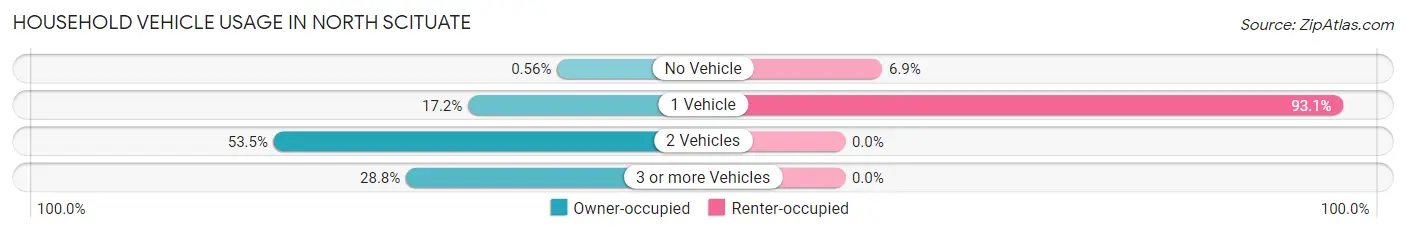
| Vehicles per Household | Owner-occupied | Renter-occupied |
| No Vehicle | 10 (0.6%) | 16 (6.9%) |
| 1 Vehicle | 309 (17.2%) | 215 (93.1%) |
| 2 Vehicles | 961 (53.5%) | 0 (0.0%) |
| 3 or more Vehicles | 517 (28.8%) | 0 (0.0%) |
| Total | 1,797 (100.0%) | 231 (100.0%) |
Real Estate & Mortgages in North Scituate
Real Estate and Mortgage Overview in North Scituate
| Characteristic | Without Mortgage | With Mortgage |
| Housing Units | 511 | 1,286 |
| Median Property Value | $700,800 | $752,200 |
| Median Household Income | $95,481 | $746 |
| Monthly Housing Costs | $1,293 | $756 |
| Real Estate Taxes | $7,847 | $0 |
Property Value by Mortgage Status in North Scituate
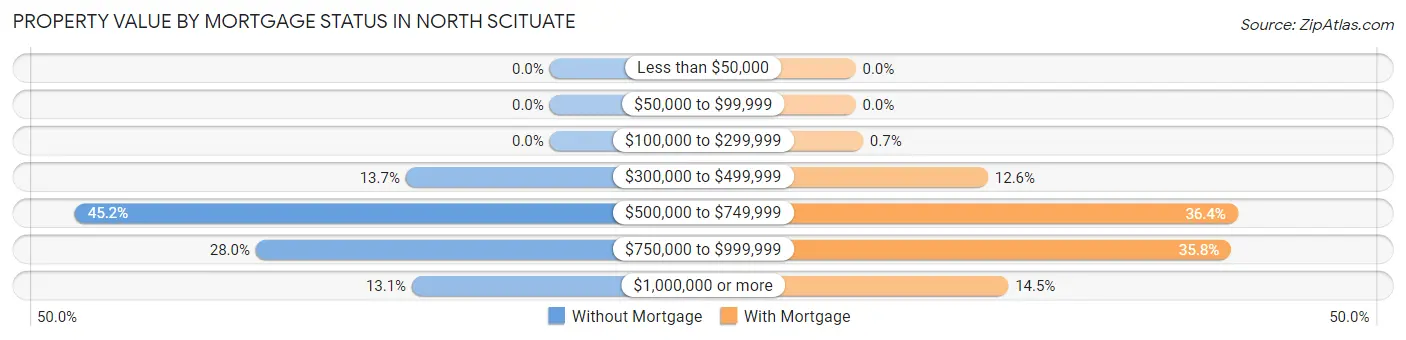
| Property Value | Without Mortgage | With Mortgage |
| Less than $50,000 | 0 (0.0%) | 0 (0.0%) |
| $50,000 to $99,999 | 0 (0.0%) | 0 (0.0%) |
| $100,000 to $299,999 | 0 (0.0%) | 9 (0.7%) |
| $300,000 to $499,999 | 70 (13.7%) | 162 (12.6%) |
| $500,000 to $749,999 | 231 (45.2%) | 468 (36.4%) |
| $750,000 to $999,999 | 143 (28.0%) | 460 (35.8%) |
| $1,000,000 or more | 67 (13.1%) | 187 (14.5%) |
| Total | 511 (100.0%) | 1,286 (100.0%) |
Household Income by Mortgage Status in North Scituate
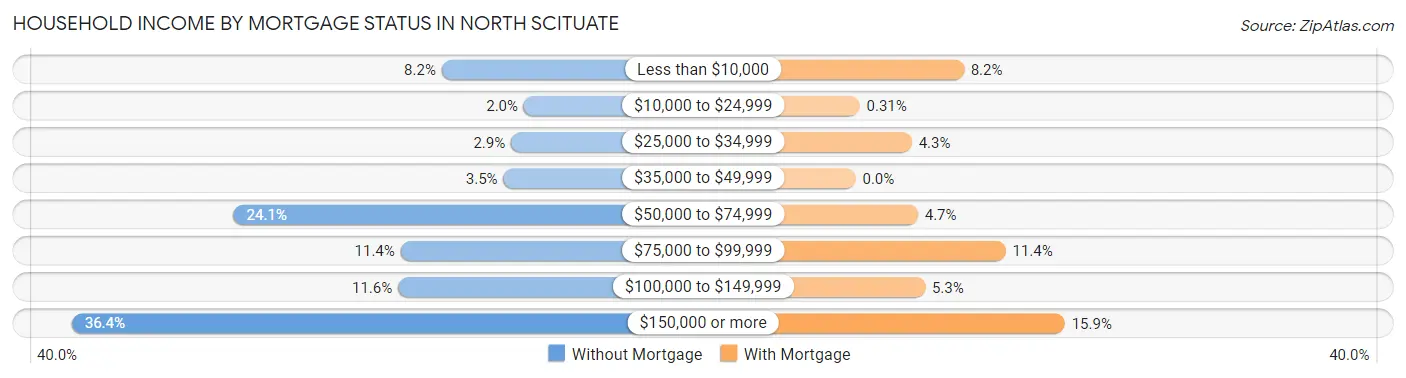
| Household Income | Without Mortgage | With Mortgage |
| Less than $10,000 | 42 (8.2%) | 106 (8.2%) |
| $10,000 to $24,999 | 10 (2.0%) | 4 (0.3%) |
| $25,000 to $34,999 | 15 (2.9%) | 55 (4.3%) |
| $35,000 to $49,999 | 18 (3.5%) | 0 (0.0%) |
| $50,000 to $74,999 | 123 (24.1%) | 61 (4.7%) |
| $75,000 to $99,999 | 58 (11.4%) | 147 (11.4%) |
| $100,000 to $149,999 | 59 (11.6%) | 68 (5.3%) |
| $150,000 or more | 186 (36.4%) | 205 (15.9%) |
| Total | 511 (100.0%) | 1,286 (100.0%) |
Property Value to Household Income Ratio in North Scituate
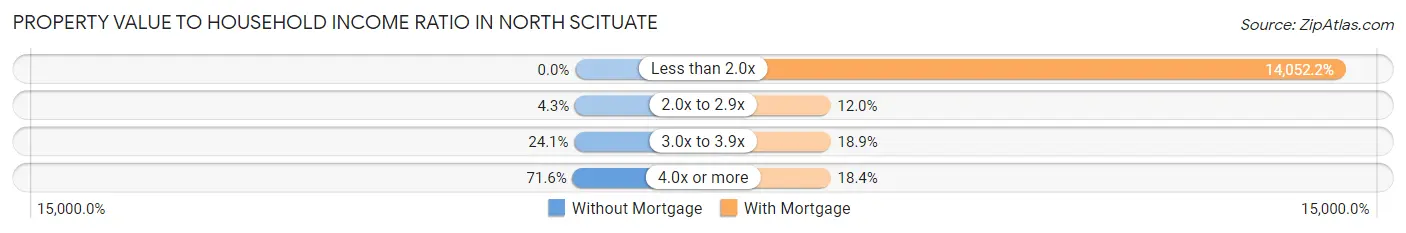
| Value-to-Income Ratio | Without Mortgage | With Mortgage |
| Less than 2.0x | 0 (0.0%) | 180,711 (14,052.2%) |
| 2.0x to 2.9x | 22 (4.3%) | 154 (12.0%) |
| 3.0x to 3.9x | 123 (24.1%) | 243 (18.9%) |
| 4.0x or more | 366 (71.6%) | 236 (18.3%) |
| Total | 511 (100.0%) | 1,286 (100.0%) |
Real Estate Taxes by Mortgage Status in North Scituate
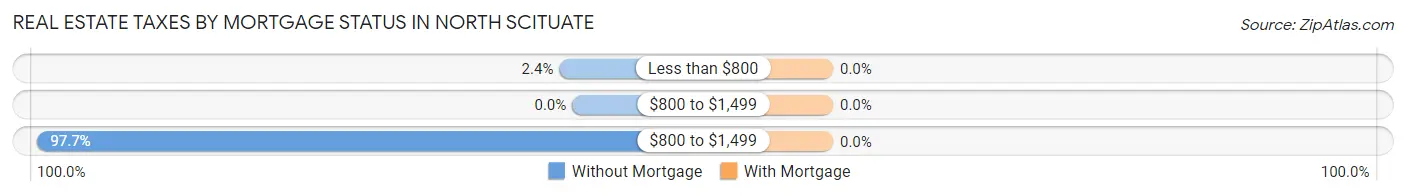
| Property Taxes | Without Mortgage | With Mortgage |
| Less than $800 | 12 (2.4%) | 0 (0.0%) |
| $800 to $1,499 | 0 (0.0%) | 0 (0.0%) |
| $800 to $1,499 | 499 (97.7%) | 0 (0.0%) |
| Total | 511 (100.0%) | 1,286 (100.0%) |
Health & Disability in North Scituate
Health Insurance Coverage by Age in North Scituate
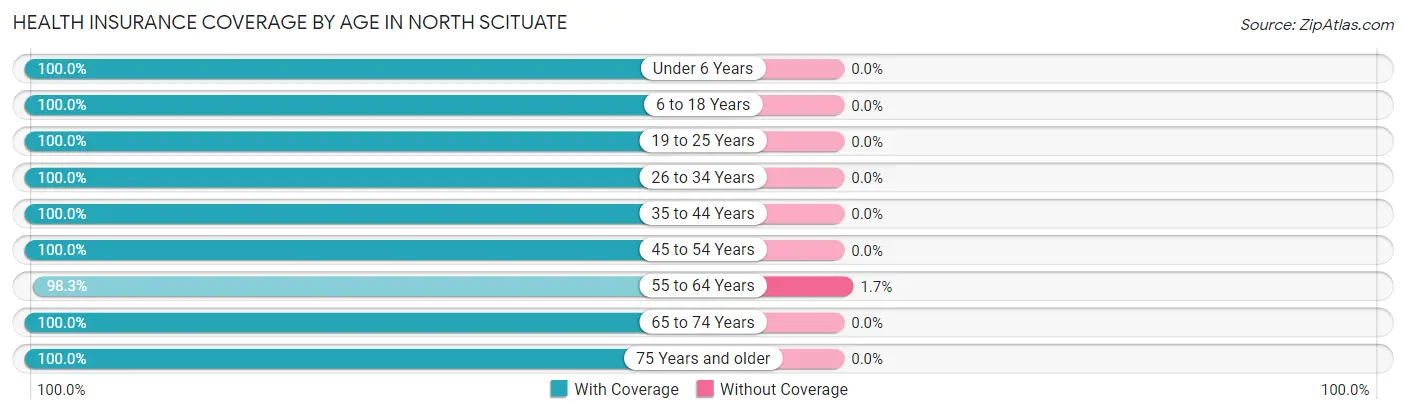
| Age Bracket | With Coverage | Without Coverage |
| Under 6 Years | 305 (100.0%) | 0 (0.0%) |
| 6 to 18 Years | 1,081 (100.0%) | 0 (0.0%) |
| 19 to 25 Years | 565 (100.0%) | 0 (0.0%) |
| 26 to 34 Years | 458 (100.0%) | 0 (0.0%) |
| 35 to 44 Years | 440 (100.0%) | 0 (0.0%) |
| 45 to 54 Years | 1,006 (100.0%) | 0 (0.0%) |
| 55 to 64 Years | 861 (98.3%) | 15 (1.7%) |
| 65 to 74 Years | 529 (100.0%) | 0 (0.0%) |
| 75 Years and older | 415 (100.0%) | 0 (0.0%) |
| Total | 5,660 (99.7%) | 15 (0.3%) |
Health Insurance Coverage by Citizenship Status in North Scituate
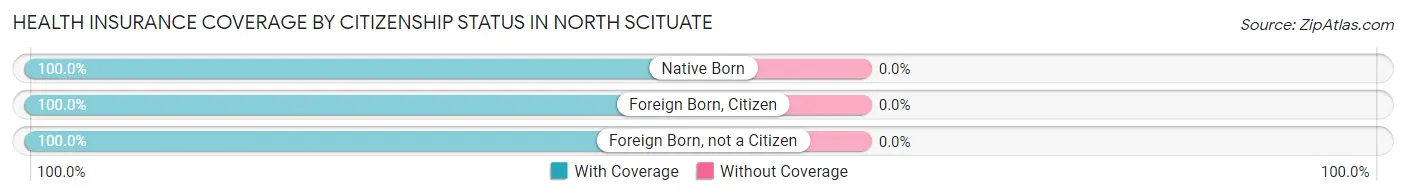
| Citizenship Status | With Coverage | Without Coverage |
| Native Born | 305 (100.0%) | 0 (0.0%) |
| Foreign Born, Citizen | 1,081 (100.0%) | 0 (0.0%) |
| Foreign Born, not a Citizen | 565 (100.0%) | 0 (0.0%) |
Health Insurance Coverage by Household Income in North Scituate
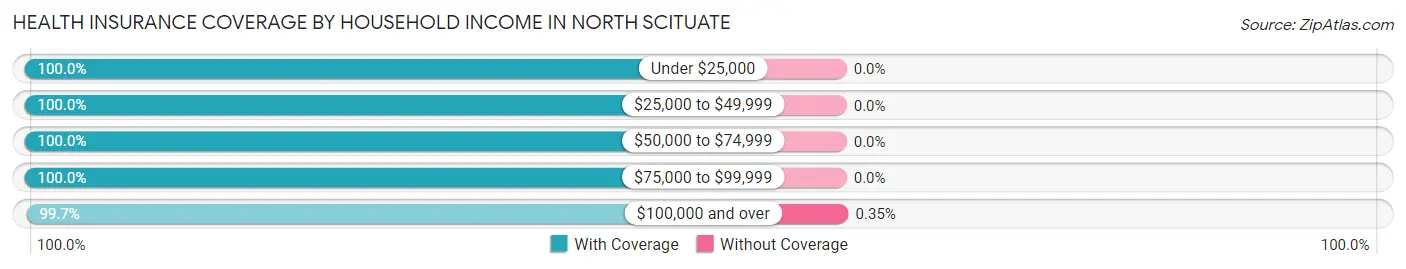
| Household Income | With Coverage | Without Coverage |
| Under $25,000 | 274 (100.0%) | 0 (0.0%) |
| $25,000 to $49,999 | 344 (100.0%) | 0 (0.0%) |
| $50,000 to $74,999 | 435 (100.0%) | 0 (0.0%) |
| $75,000 to $99,999 | 301 (100.0%) | 0 (0.0%) |
| $100,000 and over | 4,290 (99.7%) | 15 (0.4%) |
Public vs Private Health Insurance Coverage by Age in North Scituate
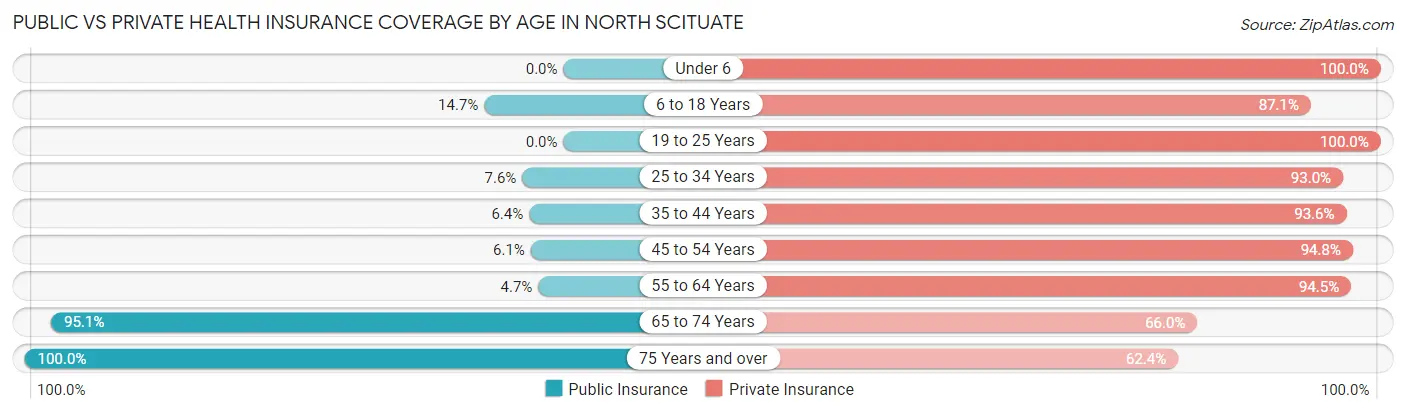
| Age Bracket | Public Insurance | Private Insurance |
| Under 6 | 0 (0.0%) | 305 (100.0%) |
| 6 to 18 Years | 159 (14.7%) | 941 (87.1%) |
| 19 to 25 Years | 0 (0.0%) | 565 (100.0%) |
| 25 to 34 Years | 35 (7.6%) | 426 (93.0%) |
| 35 to 44 Years | 28 (6.4%) | 412 (93.6%) |
| 45 to 54 Years | 61 (6.1%) | 954 (94.8%) |
| 55 to 64 Years | 41 (4.7%) | 828 (94.5%) |
| 65 to 74 Years | 503 (95.1%) | 349 (66.0%) |
| 75 Years and over | 415 (100.0%) | 259 (62.4%) |
| Total | 1,242 (21.9%) | 5,039 (88.8%) |
Disability Status by Sex by Age in North Scituate
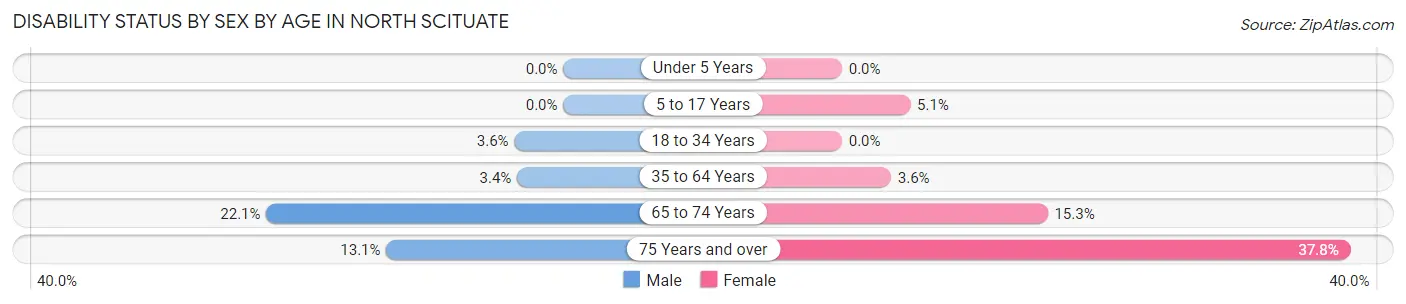
| Age Bracket | Male | Female |
| Under 5 Years | 0 (0.0%) | 0 (0.0%) |
| 5 to 17 Years | 0 (0.0%) | 29 (5.1%) |
| 18 to 34 Years | 24 (3.6%) | 0 (0.0%) |
| 35 to 64 Years | 42 (3.4%) | 40 (3.6%) |
| 65 to 74 Years | 56 (22.1%) | 42 (15.3%) |
| 75 Years and over | 18 (13.1%) | 105 (37.8%) |
Disability Class by Sex by Age in North Scituate
Disability Class: Hearing Difficulty
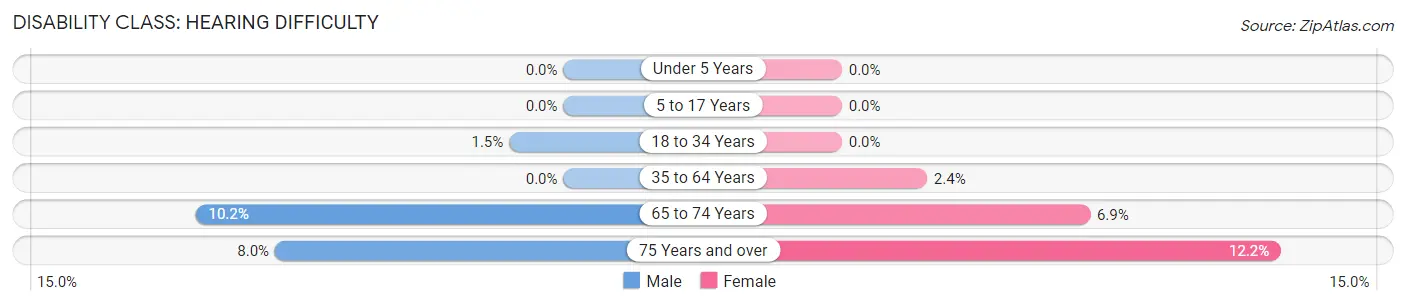
| Age Bracket | Male | Female |
| Under 5 Years | 0 (0.0%) | 0 (0.0%) |
| 5 to 17 Years | 0 (0.0%) | 0 (0.0%) |
| 18 to 34 Years | 10 (1.5%) | 0 (0.0%) |
| 35 to 64 Years | 0 (0.0%) | 26 (2.4%) |
| 65 to 74 Years | 26 (10.2%) | 19 (6.9%) |
| 75 Years and over | 11 (8.0%) | 34 (12.2%) |
Disability Class: Vision Difficulty
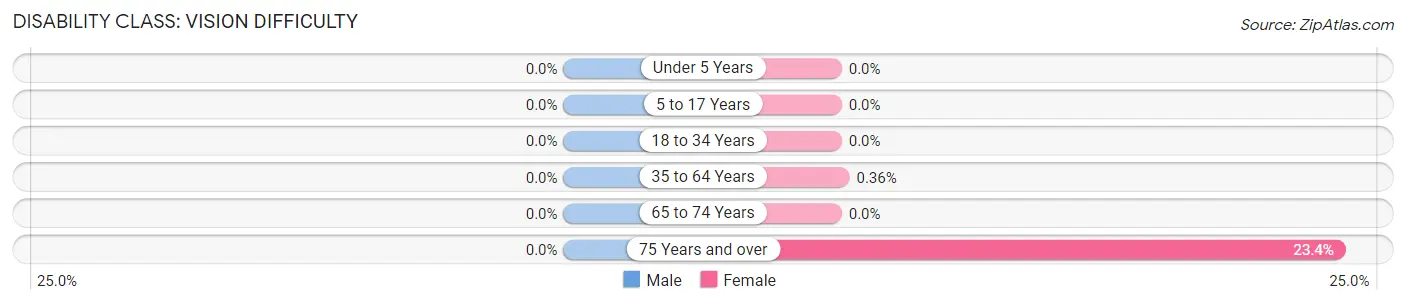
| Age Bracket | Male | Female |
| Under 5 Years | 0 (0.0%) | 0 (0.0%) |
| 5 to 17 Years | 0 (0.0%) | 0 (0.0%) |
| 18 to 34 Years | 0 (0.0%) | 0 (0.0%) |
| 35 to 64 Years | 0 (0.0%) | 4 (0.4%) |
| 65 to 74 Years | 0 (0.0%) | 0 (0.0%) |
| 75 Years and over | 0 (0.0%) | 65 (23.4%) |
Disability Class: Cognitive Difficulty
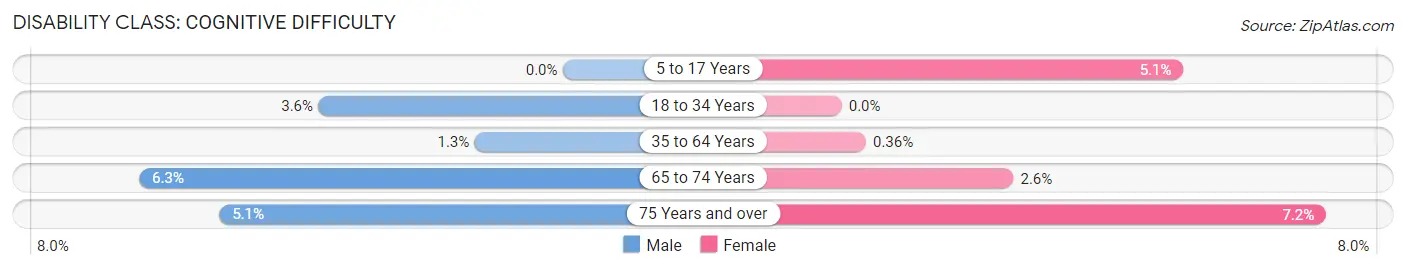
| Age Bracket | Male | Female |
| 5 to 17 Years | 0 (0.0%) | 29 (5.1%) |
| 18 to 34 Years | 24 (3.6%) | 0 (0.0%) |
| 35 to 64 Years | 16 (1.3%) | 4 (0.4%) |
| 65 to 74 Years | 16 (6.3%) | 7 (2.5%) |
| 75 Years and over | 7 (5.1%) | 20 (7.2%) |
Disability Class: Ambulatory Difficulty
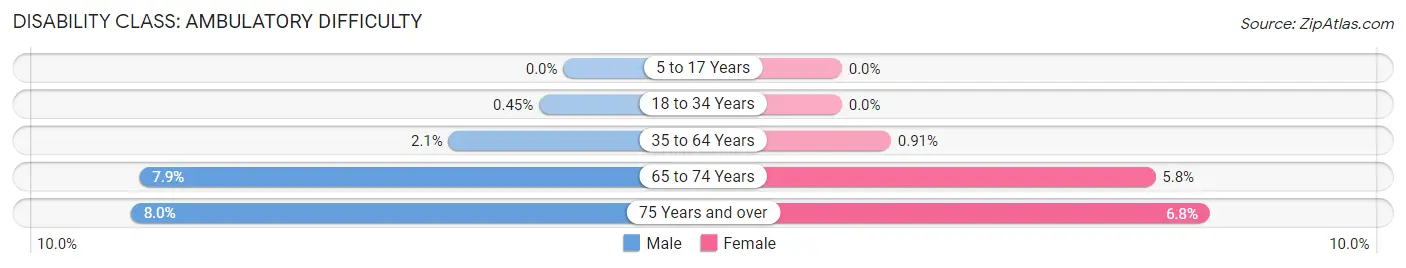
| Age Bracket | Male | Female |
| 5 to 17 Years | 0 (0.0%) | 0 (0.0%) |
| 18 to 34 Years | 3 (0.4%) | 0 (0.0%) |
| 35 to 64 Years | 26 (2.1%) | 10 (0.9%) |
| 65 to 74 Years | 20 (7.9%) | 16 (5.8%) |
| 75 Years and over | 11 (8.0%) | 19 (6.8%) |
Disability Class: Self-Care Difficulty
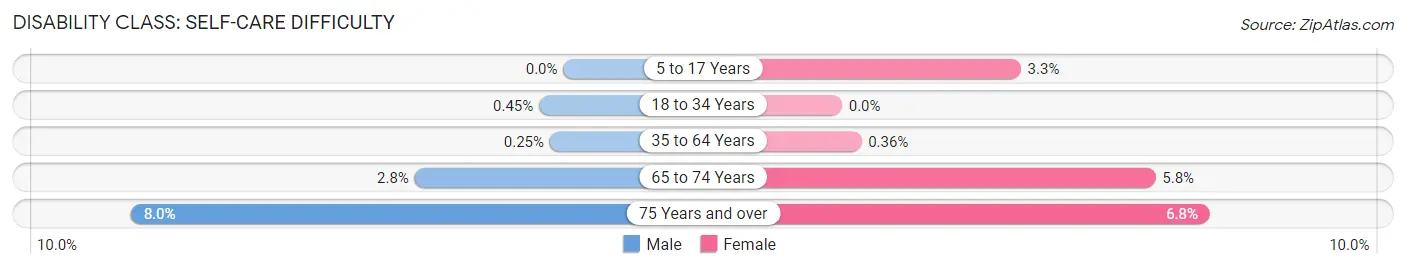
| Age Bracket | Male | Female |
| 5 to 17 Years | 0 (0.0%) | 19 (3.3%) |
| 18 to 34 Years | 3 (0.4%) | 0 (0.0%) |
| 35 to 64 Years | 3 (0.3%) | 4 (0.4%) |
| 65 to 74 Years | 7 (2.8%) | 16 (5.8%) |
| 75 Years and over | 11 (8.0%) | 19 (6.8%) |
Technology Access in North Scituate
Computing Device Access in North Scituate
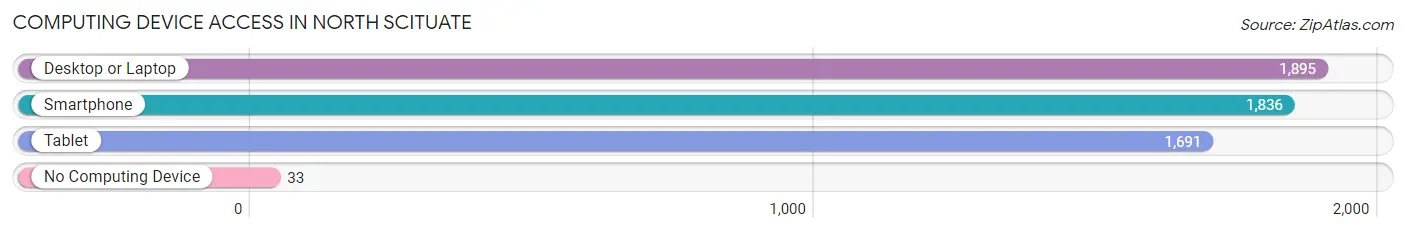
| Device Type | # Households | % Households |
| Desktop or Laptop | 1,895 | 93.4% |
| Smartphone | 1,836 | 90.5% |
| Tablet | 1,691 | 83.4% |
| No Computing Device | 33 | 1.6% |
| Total | 2,028 | 100.0% |
Internet Access in North Scituate
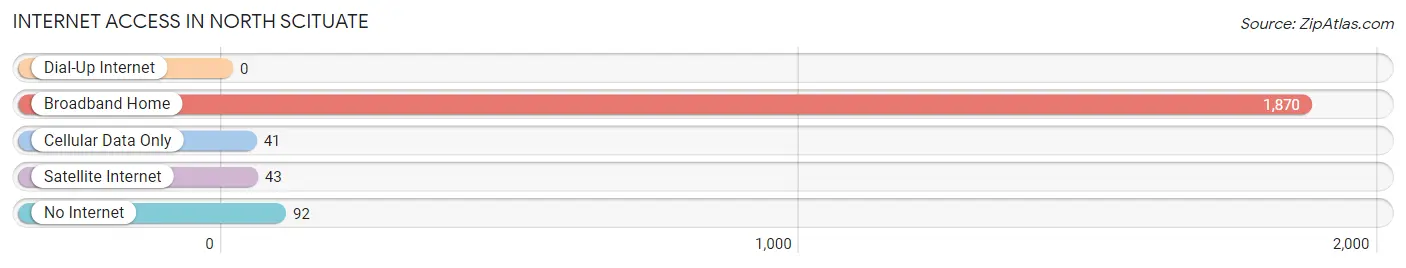
| Internet Type | # Households | % Households |
| Dial-Up Internet | 0 | 0.0% |
| Broadband Home | 1,870 | 92.2% |
| Cellular Data Only | 41 | 2.0% |
| Satellite Internet | 43 | 2.1% |
| No Internet | 92 | 4.5% |
| Total | 2,028 | 100.0% |
North Scituate Summary
North Scituate is a small town located in Plymouth County, Massachusetts. It is situated on the north side of the Scituate Harbor, which is part of the larger Plymouth Bay. The town is bordered by Marshfield to the east, Norwell to the west, and Cohasset to the south. North Scituate is a rural community with a population of approximately 5,000 people.
History
North Scituate was first settled in 1627 by a group of English settlers from Plymouth. The town was originally part of the larger town of Scituate, which was incorporated in 1636. In 1710, the town of North Scituate was officially incorporated as a separate town.
The town was primarily an agricultural community for much of its history. The town was also home to several mills, including a grist mill, a saw mill, and a fulling mill. The town also had a shipbuilding industry, which was active until the mid-19th century.
Geography
North Scituate is located in Plymouth County, Massachusetts. It is situated on the north side of the Scituate Harbor, which is part of the larger Plymouth Bay. The town is bordered by Marshfield to the east, Norwell to the west, and Cohasset to the south.
The town is primarily rural, with a few small villages scattered throughout. The largest village is North Scituate Village, which is located at the intersection of Route 3A and Route 123. The village is home to several small businesses, including a post office, a library, and a few restaurants.
The town is home to several parks and conservation areas, including the North Scituate Conservation Area, the North Scituate Wildlife Management Area, and the North Scituate State Forest.
Economy
North Scituate is a primarily residential community, with a few small businesses located in the village. The town is home to several small businesses, including a post office, a library, and a few restaurants.
The town is also home to several small manufacturing companies, including a plastics manufacturer and a metal fabrication company. The town is also home to a few small farms, which produce a variety of fruits and vegetables.
Demographics
As of the 2010 census, North Scituate had a population of 5,068 people. The racial makeup of the town was 94.3% White, 1.2% African American, 0.3% Native American, 1.2% Asian, 0.1% Pacific Islander, 1.2% from other races, and 1.7% from two or more races. Hispanic or Latino of any race were 2.7% of the population.
The median household income in North Scituate was $87,917, and the median family income was $103,917. The per capita income for the town was $41,917. About 4.3% of families and 5.7% of the population were below the poverty line, including 6.3% of those under age 18 and 4.3% of those age 65 or over.
Common Questions
What is Per Capita Income in North Scituate?
Per Capita income in North Scituate is $65,395.
What is the Median Family Income in North Scituate?
Median Family Income in North Scituate is $180,453.
What is the Median Household income in North Scituate?
Median Household Income in North Scituate is $127,339.
What is Income or Wage Gap in North Scituate?
Income or Wage Gap in North Scituate is 24.6%.
Women in North Scituate earn 75.4 cents for every dollar earned by a man.
What is Inequality or Gini Index in North Scituate?
Inequality or Gini Index in North Scituate is 0.47.
What is the Total Population of North Scituate?
Total Population of North Scituate is 5,675.
What is the Total Male Population of North Scituate?
Total Male Population of North Scituate is 2,832.
What is the Total Female Population of North Scituate?
Total Female Population of North Scituate is 2,843.
What is the Ratio of Males per 100 Females in North Scituate?
There are 99.61 Males per 100 Females in North Scituate.
What is the Ratio of Females per 100 Males in North Scituate?
There are 100.39 Females per 100 Males in North Scituate.
What is the Median Population Age in North Scituate?
Median Population Age in North Scituate is 44.6 Years.
What is the Average Family Size in North Scituate
Average Family Size in North Scituate is 3.4 People.
What is the Average Household Size in North Scituate
Average Household Size in North Scituate is 2.8 People.
How Large is the Labor Force in North Scituate?
There are 3,161 People in the Labor Forcein in North Scituate.
What is the Percentage of People in the Labor Force in North Scituate?
69.0% of People are in the Labor Force in North Scituate.
What is the Unemployment Rate in North Scituate?
Unemployment Rate in North Scituate is 5.6%.