Cities with the Lowest Male Poverty Level in Massachusetts
RELATED REPORTS & OPTIONS
Lowest Poverty | Male
Massachusetts
Compare Cities
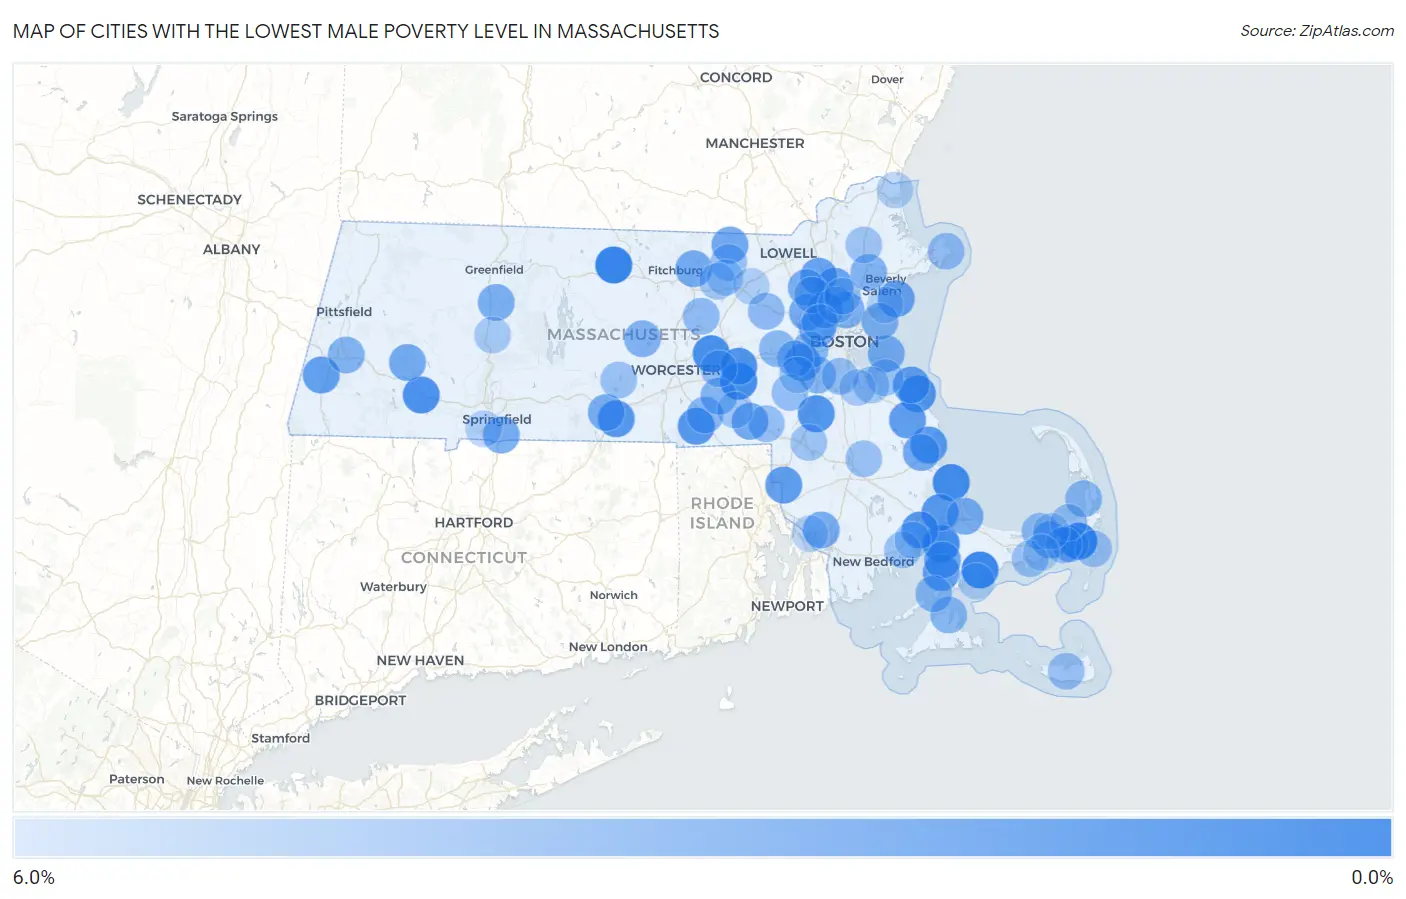
Map of Cities with the Lowest Male Poverty Level in Massachusetts
6.0%
0.0%
Cities with the Lowest Male Poverty Level in Massachusetts
| City | Male Poverty | vs State | vs National | |
| 1. | Baldwinville | 0.15% | 9.0%(-8.88)#1 | 11.3%(-11.2)#18 |
| 2. | East Harwich | 0.19% | 9.0%(-8.83)#2 | 11.3%(-11.1)#29 |
| 3. | Mashpee Neck | 0.33% | 9.0%(-8.69)#3 | 11.3%(-11.0)#63 |
| 4. | The Pinehills | 0.60% | 9.0%(-8.42)#4 | 11.3%(-10.7)#199 |
| 5. | Pocasset | 0.66% | 9.0%(-8.36)#5 | 11.3%(-10.7)#238 |
| 6. | Hopkinton | 0.72% | 9.0%(-8.30)#6 | 11.3%(-10.6)#277 |
| 7. | Northborough | 0.90% | 9.0%(-8.13)#7 | 11.3%(-10.4)#412 |
| 8. | Blandford | 1.1% | 9.0%(-7.94)#8 | 11.3%(-10.3)#547 |
| 9. | Cordaville | 1.2% | 9.0%(-7.82)#9 | 11.3%(-10.1)#671 |
| 10. | Sharon | 1.3% | 9.0%(-7.72)#10 | 11.3%(-10.0)#769 |
| 11. | Scituate | 1.4% | 9.0%(-7.63)#11 | 11.3%(-9.95)#847 |
| 12. | Sturbridge | 1.5% | 9.0%(-7.51)#12 | 11.3%(-9.83)#946 |
| 13. | White Island Shores | 1.5% | 9.0%(-7.51)#13 | 11.3%(-9.82)#954 |
| 14. | Weweantic | 1.5% | 9.0%(-7.50)#14 | 11.3%(-9.82)#960 |
| 15. | East Douglas | 1.6% | 9.0%(-7.48)#15 | 11.3%(-9.79)#984 |
| 16. | South Duxbury | 1.7% | 9.0%(-7.29)#16 | 11.3%(-9.60)#1,184 |
| 17. | West Falmouth | 1.9% | 9.0%(-7.17)#17 | 11.3%(-9.49)#1,322 |
| 18. | North Seekonk | 1.9% | 9.0%(-7.17)#18 | 11.3%(-9.49)#1,324 |
| 19. | North Pembroke | 1.9% | 9.0%(-7.13)#19 | 11.3%(-9.45)#1,364 |
| 20. | Housatonic | 2.0% | 9.0%(-7.02)#20 | 11.3%(-9.33)#1,492 |
| 21. | North Scituate | 2.0% | 9.0%(-6.98)#21 | 11.3%(-9.29)#1,536 |
| 22. | Needham | 2.1% | 9.0%(-6.93)#22 | 11.3%(-9.25)#1,594 |
| 23. | Cedar Crest | 2.2% | 9.0%(-6.84)#23 | 11.3%(-9.16)#1,710 |
| 24. | Marblehead | 2.2% | 9.0%(-6.83)#24 | 11.3%(-9.14)#1,734 |
| 25. | Reading | 2.2% | 9.0%(-6.78)#25 | 11.3%(-9.10)#1,788 |
| 26. | Wilmington | 2.3% | 9.0%(-6.73)#26 | 11.3%(-9.04)#1,859 |
| 27. | North Falmouth | 2.5% | 9.0%(-6.55)#27 | 11.3%(-8.86)#2,097 |
| 28. | Belmont | 2.5% | 9.0%(-6.51)#28 | 11.3%(-8.82)#2,158 |
| 29. | Bellingham | 2.6% | 9.0%(-6.44)#29 | 11.3%(-8.75)#2,247 |
| 30. | East Pepperell | 2.7% | 9.0%(-6.37)#30 | 11.3%(-8.68)#2,342 |
| 31. | Chester | 2.7% | 9.0%(-6.32)#31 | 11.3%(-8.64)#2,391 |
| 32. | Kingston | 2.8% | 9.0%(-6.26)#32 | 11.3%(-8.58)#2,466 |
| 33. | Lunenburg | 2.8% | 9.0%(-6.21)#33 | 11.3%(-8.53)#2,533 |
| 34. | Lexington | 2.8% | 9.0%(-6.19)#34 | 11.3%(-8.50)#2,570 |
| 35. | South Dennis | 2.9% | 9.0%(-6.10)#35 | 11.3%(-8.42)#2,679 |
| 36. | Hull | 2.9% | 9.0%(-6.10)#36 | 11.3%(-8.41)#2,682 |
| 37. | Green Harbor | 2.9% | 9.0%(-6.09)#37 | 11.3%(-8.41)#2,688 |
| 38. | Longmeadow | 2.9% | 9.0%(-6.09)#38 | 11.3%(-8.40)#2,701 |
| 39. | Fiskdale | 3.0% | 9.0%(-6.04)#39 | 11.3%(-8.35)#2,779 |
| 40. | Somerset | 3.0% | 9.0%(-6.02)#40 | 11.3%(-8.33)#2,808 |
| 41. | Sagamore | 3.0% | 9.0%(-5.99)#41 | 11.3%(-8.31)#2,855 |
| 42. | Pinehurst | 3.0% | 9.0%(-5.98)#42 | 11.3%(-8.30)#2,867 |
| 43. | South Deerfield | 3.1% | 9.0%(-5.94)#43 | 11.3%(-8.26)#2,920 |
| 44. | Melrose | 3.2% | 9.0%(-5.80)#44 | 11.3%(-8.11)#3,120 |
| 45. | Winchester | 3.3% | 9.0%(-5.77)#45 | 11.3%(-8.09)#3,154 |
| 46. | Harwich Center | 3.4% | 9.0%(-5.67)#46 | 11.3%(-7.98)#3,315 |
| 47. | Nahant | 3.4% | 9.0%(-5.63)#47 | 11.3%(-7.95)#3,382 |
| 48. | Rutland | 3.4% | 9.0%(-5.62)#48 | 11.3%(-7.94)#3,389 |
| 49. | Danvers | 3.5% | 9.0%(-5.53)#49 | 11.3%(-7.84)#3,535 |
| 50. | Whitinsville | 3.5% | 9.0%(-5.52)#50 | 11.3%(-7.84)#3,540 |
| 51. | Lee | 3.5% | 9.0%(-5.51)#51 | 11.3%(-7.83)#3,553 |
| 52. | Upton | 3.5% | 9.0%(-5.48)#52 | 11.3%(-7.79)#3,606 |
| 53. | Dedham | 3.6% | 9.0%(-5.44)#53 | 11.3%(-7.75)#3,663 |
| 54. | Vineyard Haven | 3.7% | 9.0%(-5.32)#54 | 11.3%(-7.64)#3,819 |
| 55. | Cochituate | 3.7% | 9.0%(-5.29)#55 | 11.3%(-7.61)#3,881 |
| 56. | Newton | 3.8% | 9.0%(-5.27)#56 | 11.3%(-7.59)#3,912 |
| 57. | Woods Hole | 3.8% | 9.0%(-5.23)#57 | 11.3%(-7.55)#3,958 |
| 58. | North Eastham | 3.8% | 9.0%(-5.20)#58 | 11.3%(-7.52)#4,004 |
| 59. | West Concord | 3.9% | 9.0%(-5.10)#59 | 11.3%(-7.42)#4,175 |
| 60. | South Lancaster | 4.0% | 9.0%(-5.03)#60 | 11.3%(-7.35)#4,277 |
| 61. | Burlington | 4.0% | 9.0%(-5.02)#61 | 11.3%(-7.34)#4,302 |
| 62. | Wellesley | 4.0% | 9.0%(-5.01)#62 | 11.3%(-7.33)#4,311 |
| 63. | Milton | 4.1% | 9.0%(-4.93)#63 | 11.3%(-7.25)#4,432 |
| 64. | Dennis | 4.1% | 9.0%(-4.88)#64 | 11.3%(-7.19)#4,508 |
| 65. | Medfield | 4.2% | 9.0%(-4.88)#65 | 11.3%(-7.19)#4,509 |
| 66. | Rockport | 4.2% | 9.0%(-4.82)#66 | 11.3%(-7.14)#4,613 |
| 67. | Westborough | 4.2% | 9.0%(-4.80)#67 | 11.3%(-7.12)#4,630 |
| 68. | Brewster | 4.3% | 9.0%(-4.75)#68 | 11.3%(-7.06)#4,703 |
| 69. | Franklin Town | 4.3% | 9.0%(-4.72)#69 | 11.3%(-7.03)#4,757 |
| 70. | Nantucket | 4.3% | 9.0%(-4.68)#70 | 11.3%(-6.99)#4,824 |
| 71. | Mattapoisett Center | 4.4% | 9.0%(-4.60)#71 | 11.3%(-6.92)#4,937 |
| 72. | Bridgewater Town | 4.4% | 9.0%(-4.60)#72 | 11.3%(-6.92)#4,939 |
| 73. | West Yarmouth | 4.5% | 9.0%(-4.54)#73 | 11.3%(-6.86)#5,028 |
| 74. | Hingham | 4.5% | 9.0%(-4.53)#74 | 11.3%(-6.85)#5,036 |
| 75. | Groton | 4.5% | 9.0%(-4.53)#75 | 11.3%(-6.84)#5,041 |
| 76. | East Brookfield | 4.5% | 9.0%(-4.52)#76 | 11.3%(-6.84)#5,048 |
| 77. | Stoneham | 4.5% | 9.0%(-4.52)#77 | 11.3%(-6.84)#5,053 |
| 78. | Mansfield Center | 4.5% | 9.0%(-4.51)#78 | 11.3%(-6.82)#5,065 |
| 79. | Wakefield | 4.5% | 9.0%(-4.48)#79 | 11.3%(-6.80)#5,096 |
| 80. | Chatham | 4.6% | 9.0%(-4.46)#80 | 11.3%(-6.77)#5,153 |
| 81. | Boxford | 4.6% | 9.0%(-4.39)#81 | 11.3%(-6.70)#5,271 |
| 82. | Devens | 4.7% | 9.0%(-4.37)#82 | 11.3%(-6.69)#5,299 |
| 83. | Weymouth Town | 4.7% | 9.0%(-4.33)#83 | 11.3%(-6.64)#5,358 |
| 84. | Northwest Harwich | 4.7% | 9.0%(-4.31)#84 | 11.3%(-6.62)#5,401 |
| 85. | Hopedale | 4.9% | 9.0%(-4.13)#85 | 11.3%(-6.45)#5,653 |
| 86. | Arlington | 4.9% | 9.0%(-4.11)#86 | 11.3%(-6.43)#5,678 |
| 87. | Marion Center | 4.9% | 9.0%(-4.09)#87 | 11.3%(-6.40)#5,713 |
| 88. | Hatfield | 5.1% | 9.0%(-3.98)#88 | 11.3%(-6.29)#5,876 |
| 89. | Braintree Town | 5.1% | 9.0%(-3.94)#89 | 11.3%(-6.25)#5,934 |
| 90. | Dover | 5.2% | 9.0%(-3.85)#90 | 11.3%(-6.17)#6,064 |
| 91. | Ayer | 5.2% | 9.0%(-3.83)#91 | 11.3%(-6.14)#6,114 |
| 92. | Littleton Common | 5.3% | 9.0%(-3.73)#92 | 11.3%(-6.05)#6,232 |
| 93. | North Attleborough | 5.3% | 9.0%(-3.73)#93 | 11.3%(-6.05)#6,239 |
| 94. | Ocean Grove | 5.4% | 9.0%(-3.67)#94 | 11.3%(-5.98)#6,335 |
| 95. | East Dennis | 5.4% | 9.0%(-3.62)#95 | 11.3%(-5.94)#6,395 |
| 96. | Agawam Town | 5.4% | 9.0%(-3.60)#96 | 11.3%(-5.92)#6,431 |
| 97. | Salisbury | 5.4% | 9.0%(-3.60)#97 | 11.3%(-5.91)#6,440 |
| 98. | New Seabury | 5.6% | 9.0%(-3.46)#98 | 11.3%(-5.77)#6,663 |
| 99. | South Yarmouth | 5.6% | 9.0%(-3.42)#99 | 11.3%(-5.74)#6,717 |
| 100. | Swampscott | 5.7% | 9.0%(-3.36)#100 | 11.3%(-5.68)#6,798 |
Common Questions
What are the Top 10 Cities with the Lowest Male Poverty Level in Massachusetts?
Top 10 Cities with the Lowest Male Poverty Level in Massachusetts are:
#1
0.15%
#2
0.19%
#3
0.33%
#4
0.60%
#5
0.66%
#6
0.72%
#7
0.90%
#8
1.1%
#9
1.2%
#10
1.3%
What city has the Lowest Male Poverty Level in Massachusetts?
Baldwinville has the Lowest Male Poverty Level in Massachusetts with 0.15%.
What is the Poverty Level Among Males in the State of Massachusetts?
Poverty Level Among Males in Massachusetts is 9.0%.
What is the Poverty Level Among Males in the United States?
Poverty Level Among Males in the United States is 11.3%.