Cities with the Most Immigrants from Poland in Massachusetts
RELATED REPORTS & OPTIONS
Poland
Massachusetts
Compare Cities
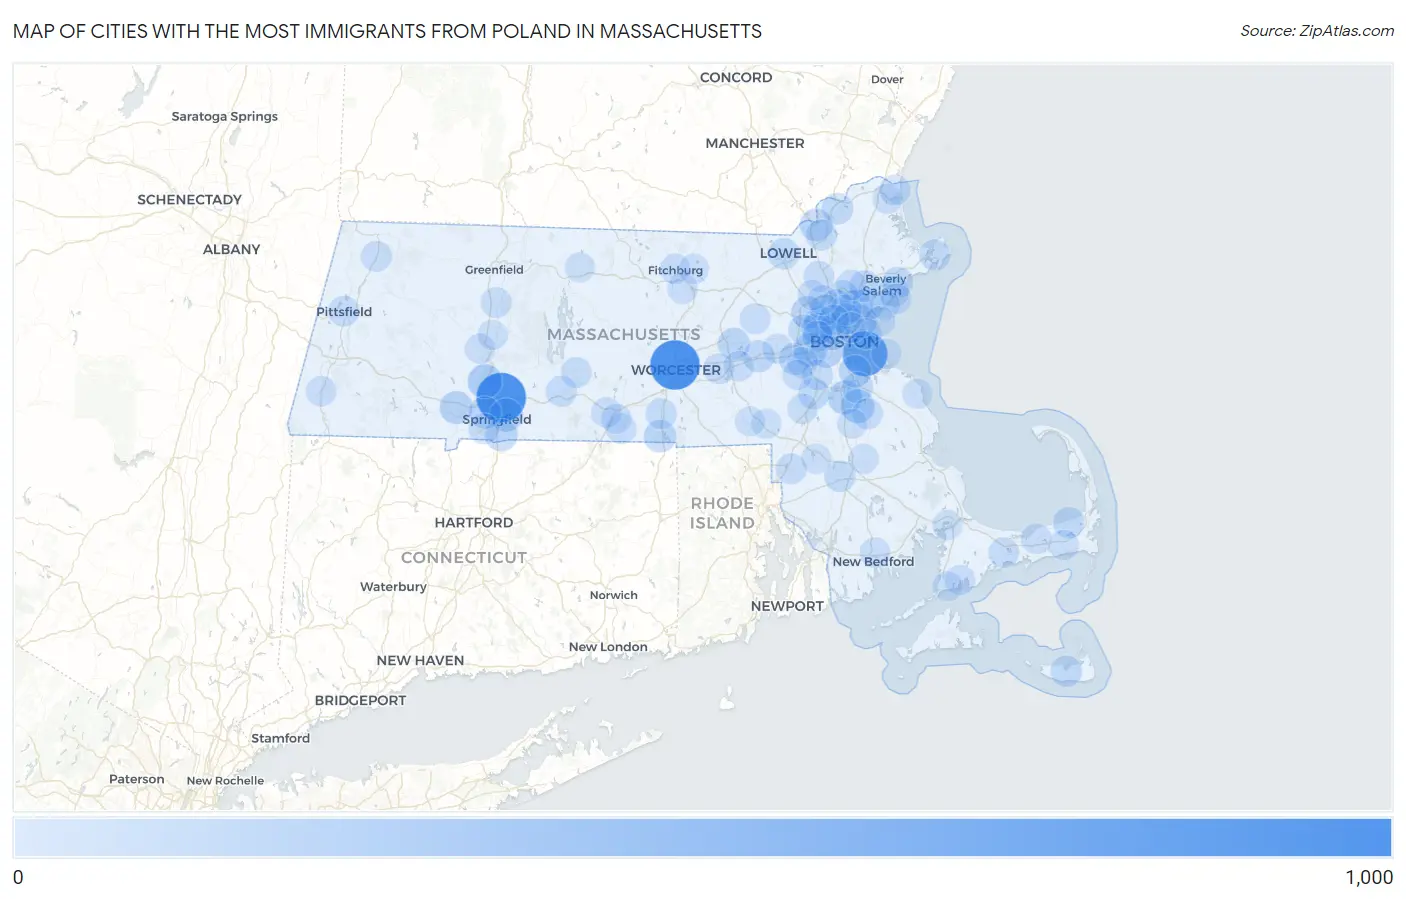
Map of Cities with the Most Immigrants from Poland in Massachusetts
0
1,000
Cities with the Most Immigrants from Poland in Massachusetts
| City | Poland | vs State | vs National | |
| 1. | Chicopee | 995 | 10,915(9.12%)#1 | 408,899(0.24%)#43 |
| 2. | Worcester | 994 | 10,915(9.11%)#2 | 408,899(0.24%)#44 |
| 3. | Boston | 760 | 10,915(6.96%)#3 | 408,899(0.19%)#58 |
| 4. | Holyoke | 209 | 10,915(1.91%)#4 | 408,899(0.05%)#238 |
| 5. | Randolph Town | 186 | 10,915(1.70%)#5 | 408,899(0.05%)#269 |
| 6. | Holbrook | 179 | 10,915(1.64%)#6 | 408,899(0.04%)#280 |
| 7. | Springfield | 164 | 10,915(1.50%)#7 | 408,899(0.04%)#304 |
| 8. | Newton | 159 | 10,915(1.46%)#8 | 408,899(0.04%)#310 |
| 9. | Revere | 151 | 10,915(1.38%)#9 | 408,899(0.04%)#327 |
| 10. | Westfield | 144 | 10,915(1.32%)#10 | 408,899(0.04%)#349 |
| 11. | Saugus | 143 | 10,915(1.31%)#11 | 408,899(0.03%)#352 |
| 12. | Brookline | 139 | 10,915(1.27%)#12 | 408,899(0.03%)#363 |
| 13. | Cambridge | 136 | 10,915(1.25%)#13 | 408,899(0.03%)#374 |
| 14. | Methuen Town | 126 | 10,915(1.15%)#14 | 408,899(0.03%)#417 |
| 15. | Lexington | 126 | 10,915(1.15%)#15 | 408,899(0.03%)#418 |
| 16. | Longmeadow | 117 | 10,915(1.07%)#16 | 408,899(0.03%)#447 |
| 17. | Webster | 111 | 10,915(1.02%)#17 | 408,899(0.03%)#473 |
| 18. | Quincy | 108 | 10,915(0.99%)#18 | 408,899(0.03%)#488 |
| 19. | West Springfield Town | 107 | 10,915(0.98%)#19 | 408,899(0.03%)#496 |
| 20. | Arlington | 105 | 10,915(0.96%)#20 | 408,899(0.03%)#502 |
| 21. | Belmont | 99 | 10,915(0.91%)#21 | 408,899(0.02%)#538 |
| 22. | Marlborough | 97 | 10,915(0.89%)#22 | 408,899(0.02%)#553 |
| 23. | Wellesley | 95 | 10,915(0.87%)#23 | 408,899(0.02%)#563 |
| 24. | Somerville | 92 | 10,915(0.84%)#24 | 408,899(0.02%)#578 |
| 25. | Framingham | 90 | 10,915(0.82%)#25 | 408,899(0.02%)#591 |
| 26. | Wakefield | 89 | 10,915(0.82%)#26 | 408,899(0.02%)#601 |
| 27. | Lynn | 81 | 10,915(0.74%)#27 | 408,899(0.02%)#654 |
| 28. | Peabody | 80 | 10,915(0.73%)#28 | 408,899(0.02%)#660 |
| 29. | Haverhill | 69 | 10,915(0.63%)#29 | 408,899(0.02%)#760 |
| 30. | Norwood | 68 | 10,915(0.62%)#30 | 408,899(0.02%)#770 |
| 31. | Lowell | 66 | 10,915(0.60%)#31 | 408,899(0.02%)#784 |
| 32. | Taunton | 66 | 10,915(0.60%)#32 | 408,899(0.02%)#788 |
| 33. | Stoneham | 66 | 10,915(0.60%)#33 | 408,899(0.02%)#791 |
| 34. | Amherst | 63 | 10,915(0.58%)#34 | 408,899(0.02%)#811 |
| 35. | Nantucket | 62 | 10,915(0.57%)#35 | 408,899(0.02%)#817 |
| 36. | Beverly | 61 | 10,915(0.56%)#36 | 408,899(0.01%)#823 |
| 37. | Brewster | 60 | 10,915(0.55%)#37 | 408,899(0.01%)#842 |
| 38. | Braintree Town | 56 | 10,915(0.51%)#38 | 408,899(0.01%)#880 |
| 39. | Winthrop Town | 52 | 10,915(0.48%)#39 | 408,899(0.01%)#939 |
| 40. | Gloucester | 49 | 10,915(0.45%)#40 | 408,899(0.01%)#984 |
| 41. | Winchester | 49 | 10,915(0.45%)#41 | 408,899(0.01%)#986 |
| 42. | Lawrence | 48 | 10,915(0.44%)#42 | 408,899(0.01%)#1,001 |
| 43. | Palmer Town | 48 | 10,915(0.44%)#43 | 408,899(0.01%)#1,012 |
| 44. | Waltham | 47 | 10,915(0.43%)#44 | 408,899(0.01%)#1,022 |
| 45. | Oxford | 47 | 10,915(0.43%)#45 | 408,899(0.01%)#1,030 |
| 46. | Malden | 45 | 10,915(0.41%)#46 | 408,899(0.01%)#1,049 |
| 47. | Attleboro | 41 | 10,915(0.38%)#47 | 408,899(0.01%)#1,126 |
| 48. | Melrose | 41 | 10,915(0.38%)#48 | 408,899(0.01%)#1,130 |
| 49. | Agawam Town | 41 | 10,915(0.38%)#49 | 408,899(0.01%)#1,131 |
| 50. | North Attleborough | 39 | 10,915(0.36%)#50 | 408,899(0.01%)#1,175 |
| 51. | Ware | 39 | 10,915(0.36%)#51 | 408,899(0.01%)#1,189 |
| 52. | Medford | 38 | 10,915(0.35%)#52 | 408,899(0.01%)#1,200 |
| 53. | South Deerfield | 37 | 10,915(0.34%)#53 | 408,899(0.01%)#1,233 |
| 54. | Pittsfield | 36 | 10,915(0.33%)#54 | 408,899(0.01%)#1,238 |
| 55. | Watertown Town | 34 | 10,915(0.31%)#55 | 408,899(0.01%)#1,291 |
| 56. | Dedham | 34 | 10,915(0.31%)#56 | 408,899(0.01%)#1,293 |
| 57. | Salisbury | 33 | 10,915(0.30%)#57 | 408,899(0.01%)#1,329 |
| 58. | Adams | 32 | 10,915(0.29%)#58 | 408,899(0.01%)#1,359 |
| 59. | Needham | 31 | 10,915(0.28%)#59 | 408,899(0.01%)#1,371 |
| 60. | Abington | 31 | 10,915(0.28%)#60 | 408,899(0.01%)#1,374 |
| 61. | Maynard | 31 | 10,915(0.28%)#61 | 408,899(0.01%)#1,380 |
| 62. | Barnstable Town | 30 | 10,915(0.27%)#62 | 408,899(0.01%)#1,402 |
| 63. | Chelsea | 27 | 10,915(0.25%)#63 | 408,899(0.01%)#1,494 |
| 64. | Westborough | 27 | 10,915(0.25%)#64 | 408,899(0.01%)#1,518 |
| 65. | Wilmington | 26 | 10,915(0.24%)#65 | 408,899(0.01%)#1,536 |
| 66. | Salem | 25 | 10,915(0.23%)#66 | 408,899(0.01%)#1,574 |
| 67. | Great Barrington | 23 | 10,915(0.21%)#67 | 408,899(0.01%)#1,684 |
| 68. | Southbridge Town | 22 | 10,915(0.20%)#68 | 408,899(0.01%)#1,708 |
| 69. | Lynnfield | 22 | 10,915(0.20%)#69 | 408,899(0.01%)#1,713 |
| 70. | Cordaville | 22 | 10,915(0.20%)#70 | 408,899(0.01%)#1,730 |
| 71. | Leominster | 19 | 10,915(0.17%)#71 | 408,899(0.00%)#1,844 |
| 72. | New Bedford | 17 | 10,915(0.16%)#72 | 408,899(0.00%)#1,947 |
| 73. | Fitchburg | 13 | 10,915(0.12%)#73 | 408,899(0.00%)#2,217 |
| 74. | Fiskdale | 13 | 10,915(0.12%)#74 | 408,899(0.00%)#2,261 |
| 75. | Sturbridge | 12 | 10,915(0.11%)#75 | 408,899(0.00%)#2,313 |
| 76. | Northampton | 11 | 10,915(0.10%)#76 | 408,899(0.00%)#2,345 |
| 77. | Burlington | 10 | 10,915(0.09%)#77 | 408,899(0.00%)#2,438 |
| 78. | Walpole | 10 | 10,915(0.09%)#78 | 408,899(0.00%)#2,477 |
| 79. | Yarmouth Port | 10 | 10,915(0.09%)#79 | 408,899(0.00%)#2,478 |
| 80. | Marblehead | 9 | 10,915(0.08%)#80 | 408,899(0.00%)#2,533 |
| 81. | East Falmouth | 9 | 10,915(0.08%)#81 | 408,899(0.00%)#2,576 |
| 82. | Dover | 9 | 10,915(0.08%)#82 | 408,899(0.00%)#2,597 |
| 83. | Bridgewater Town | 8 | 10,915(0.07%)#83 | 408,899(0.00%)#2,635 |
| 84. | Athol | 8 | 10,915(0.07%)#84 | 408,899(0.00%)#2,660 |
| 85. | Falmouth | 8 | 10,915(0.07%)#85 | 408,899(0.00%)#2,676 |
| 86. | Lunenburg | 8 | 10,915(0.07%)#86 | 408,899(0.00%)#2,692 |
| 87. | Hull | 7 | 10,915(0.06%)#87 | 408,899(0.00%)#2,742 |
| 88. | Northwest Harwich | 7 | 10,915(0.06%)#88 | 408,899(0.00%)#2,759 |
| 89. | Norton Center | 7 | 10,915(0.06%)#89 | 408,899(0.00%)#2,767 |
| 90. | Hatfield | 7 | 10,915(0.06%)#90 | 408,899(0.00%)#2,784 |
| 91. | Woburn | 6 | 10,915(0.05%)#91 | 408,899(0.00%)#2,807 |
| 92. | Franklin Town | 6 | 10,915(0.05%)#92 | 408,899(0.00%)#2,809 |
| 93. | Cochituate | 6 | 10,915(0.05%)#93 | 408,899(0.00%)#2,826 |
| 94. | Newburyport | 5 | 10,915(0.05%)#94 | 408,899(0.00%)#2,899 |
| 95. | Swampscott | 5 | 10,915(0.05%)#95 | 408,899(0.00%)#2,904 |
| 96. | Brockton | 1 | 10,915(0.01%)#96 | 408,899(0.00%)#3,215 |
| 97. | Scituate | 1 | 10,915(0.01%)#97 | 408,899(0.00%)#3,245 |
| 98. | Bellingham | 1 | 10,915(0.01%)#98 | 408,899(0.00%)#3,251 |
| 99. | Nahant | 1 | 10,915(0.01%)#99 | 408,899(0.00%)#3,254 |
| 100. | Buzzards Bay | 1 | 10,915(0.01%)#100 | 408,899(0.00%)#3,256 |
Common Questions
What are the Top 10 Cities with the Most Immigrants from Poland in Massachusetts?
Top 10 Cities with the Most Immigrants from Poland in Massachusetts are:
#1
995
#2
994
#3
760
#4
209
#5
186
#6
179
#7
164
#8
159
#9
151
#10
144
What city has the Most Immigrants from Poland in Massachusetts?
Chicopee has the Most Immigrants from Poland in Massachusetts with 995.
What is the Total Immigrants from Poland in the State of Massachusetts?
Total Immigrants from Poland in Massachusetts is 10,915.
What is the Total Immigrants from Poland in the United States?
Total Immigrants from Poland in the United States is 408,899.