Athol, MA Map & Demographics
Athol Map
Athol Overview
$27,774
PER CAPITA INCOME
$75,536
AVG FAMILY INCOME
$62,962
AVG HOUSEHOLD INCOME
18.7%
WAGE / INCOME GAP [ % ]
81.3¢/ $1
WAGE / INCOME GAP [ $ ]
$6,885
FAMILY INCOME DEFICIT
0.41
INEQUALITY / GINI INDEX
9,148
TOTAL POPULATION
4,608
MALE POPULATION
4,540
FEMALE POPULATION
101.50
MALES / 100 FEMALES
98.52
FEMALES / 100 MALES
38.0
MEDIAN AGE
3.2
AVG FAMILY SIZE
2.6
AVG HOUSEHOLD SIZE
4,633
LABOR FORCE [ PEOPLE ]
64.1%
PERCENT IN LABOR FORCE
8.1%
UNEMPLOYMENT RATE
Athol Zip Codes
Athol Area Codes
Income in Athol
Income Overview in Athol
Per Capita Income in Athol is $27,774, while median incomes of families and households are $75,536 and $62,962 respectively.
| Characteristic | Number | Measure |
| Per Capita Income | 9,148 | $27,774 |
| Median Family Income | 2,159 | $75,536 |
| Mean Family Income | 2,159 | $81,258 |
| Median Household Income | 3,538 | $62,962 |
| Mean Household Income | 3,538 | $71,451 |
| Income Deficit | 2,159 | $6,885 |
| Wage / Income Gap (%) | 9,148 | 18.67% |
| Wage / Income Gap ($) | 9,148 | 81.33¢ per $1 |
| Gini / Inequality Index | 9,148 | 0.41 |
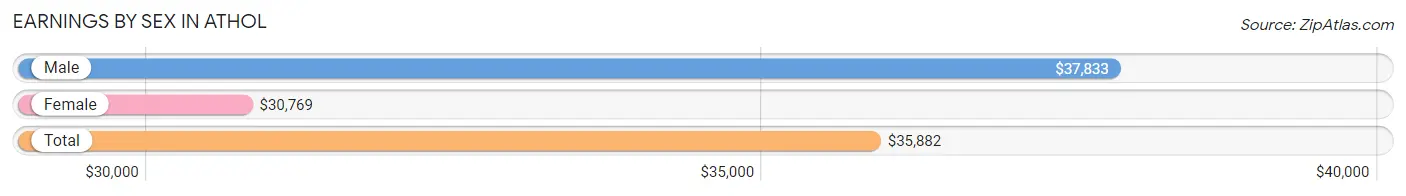
Earnings by Sex in Athol
Average Earnings in Athol are $35,882, $37,833 for men and $30,769 for women, a difference of 18.7%.
| Sex | Number | Average Earnings |
| Male | 2,352 (50.1%) | $37,833 |
| Female | 2,340 (49.9%) | $30,769 |
| Total | 4,692 (100.0%) | $35,882 |
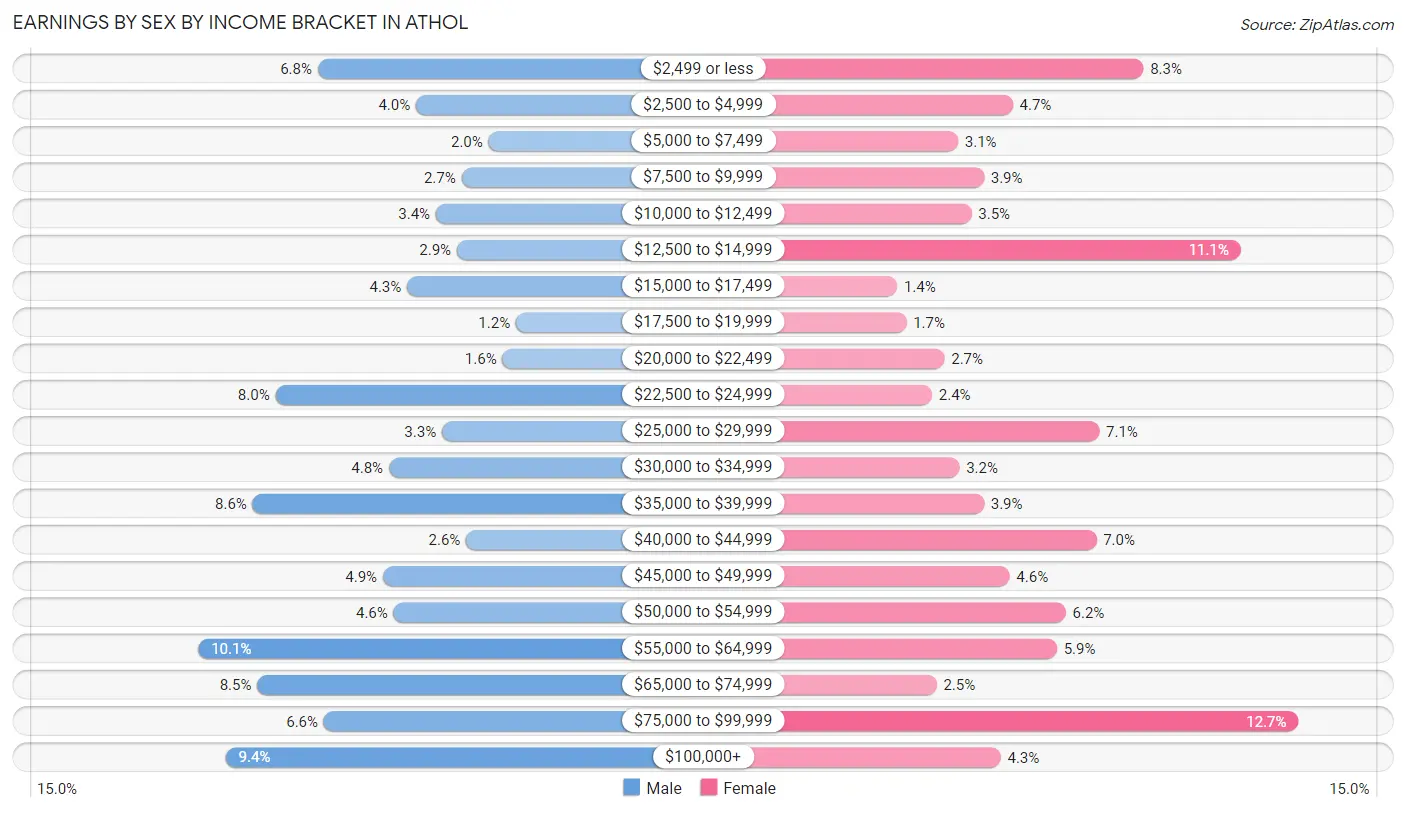
Earnings by Sex by Income Bracket in Athol
The most common earnings brackets in Athol are $55,000 to $64,999 for men (238 | 10.1%) and $75,000 to $99,999 for women (297 | 12.7%).
| Income | Male | Female |
| $2,499 or less | 159 (6.8%) | 195 (8.3%) |
| $2,500 to $4,999 | 94 (4.0%) | 109 (4.7%) |
| $5,000 to $7,499 | 46 (2.0%) | 73 (3.1%) |
| $7,500 to $9,999 | 64 (2.7%) | 90 (3.8%) |
| $10,000 to $12,499 | 81 (3.4%) | 82 (3.5%) |
| $12,500 to $14,999 | 67 (2.9%) | 259 (11.1%) |
| $15,000 to $17,499 | 100 (4.3%) | 33 (1.4%) |
| $17,500 to $19,999 | 28 (1.2%) | 39 (1.7%) |
| $20,000 to $22,499 | 37 (1.6%) | 64 (2.7%) |
| $22,500 to $24,999 | 187 (8.0%) | 56 (2.4%) |
| $25,000 to $29,999 | 77 (3.3%) | 166 (7.1%) |
| $30,000 to $34,999 | 112 (4.8%) | 74 (3.2%) |
| $35,000 to $39,999 | 202 (8.6%) | 90 (3.8%) |
| $40,000 to $44,999 | 61 (2.6%) | 164 (7.0%) |
| $45,000 to $49,999 | 116 (4.9%) | 107 (4.6%) |
| $50,000 to $54,999 | 109 (4.6%) | 144 (6.1%) |
| $55,000 to $64,999 | 238 (10.1%) | 138 (5.9%) |
| $65,000 to $74,999 | 199 (8.5%) | 59 (2.5%) |
| $75,000 to $99,999 | 155 (6.6%) | 297 (12.7%) |
| $100,000+ | 220 (9.3%) | 101 (4.3%) |
| Total | 2,352 (100.0%) | 2,340 (100.0%) |
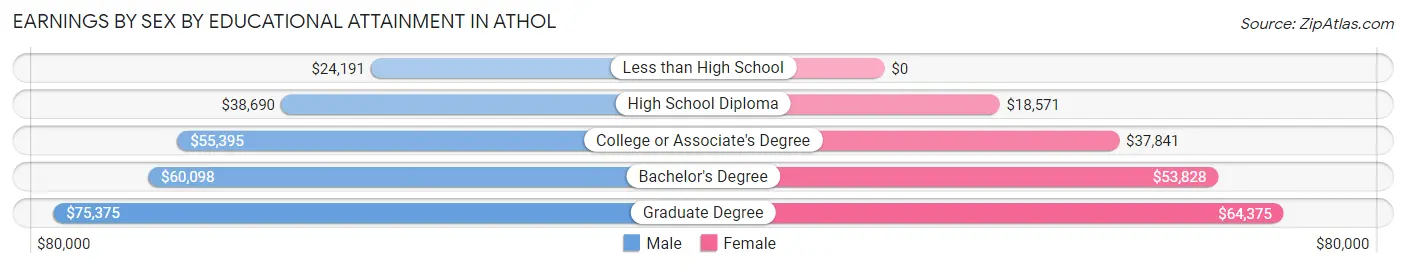
Earnings by Sex by Educational Attainment in Athol
Average earnings in Athol are $46,531 for men and $38,418 for women, a difference of 17.4%. Men with an educational attainment of graduate degree enjoy the highest average annual earnings of $75,375, while those with less than high school education earn the least with $24,191. Women with an educational attainment of graduate degree earn the most with the average annual earnings of $64,375, while those with high school diploma education have the smallest earnings of $18,571.
| Educational Attainment | Male Income | Female Income |
| Less than High School | $24,191 | $0 |
| High School Diploma | $38,690 | $18,571 |
| College or Associate's Degree | $55,395 | $37,841 |
| Bachelor's Degree | $60,098 | $53,828 |
| Graduate Degree | $75,375 | $64,375 |
| Total | $46,531 | $38,418 |
Family Income in Athol
Family Income Brackets in Athol
According to the Athol family income data, there are 568 families falling into the $75,000 to $99,999 income range, which is the most common income bracket and makes up 26.3% of all families. Conversely, the less than $10,000 income bracket is the least frequent group with only 71 families (3.3%) belonging to this category.
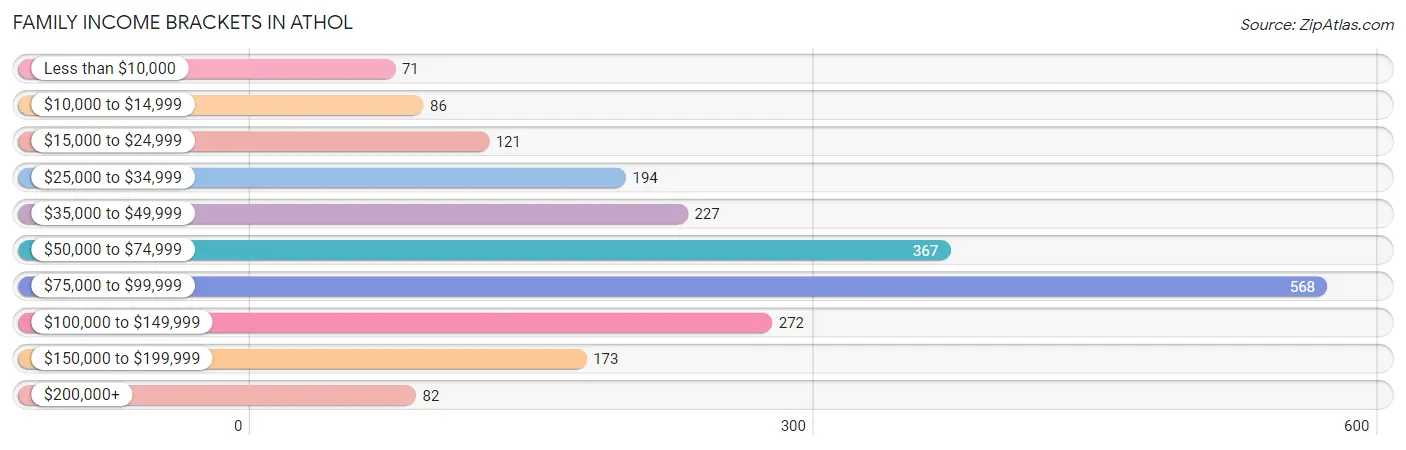
| Income Bracket | # Families | % Families |
| Less than $10,000 | 71 | 3.3% |
| $10,000 to $14,999 | 86 | 4.0% |
| $15,000 to $24,999 | 121 | 5.6% |
| $25,000 to $34,999 | 194 | 9.0% |
| $35,000 to $49,999 | 227 | 10.5% |
| $50,000 to $74,999 | 367 | 17.0% |
| $75,000 to $99,999 | 568 | 26.3% |
| $100,000 to $149,999 | 272 | 12.6% |
| $150,000 to $199,999 | 173 | 8.0% |
| $200,000+ | 82 | 3.8% |
Family Income by Famaliy Size in Athol
7+ person families (45 | 2.1%) account for the highest median family income in Athol with $150,703 per family, while 3-person families (569 | 26.4%) have the highest median income of $25,549 per family member.
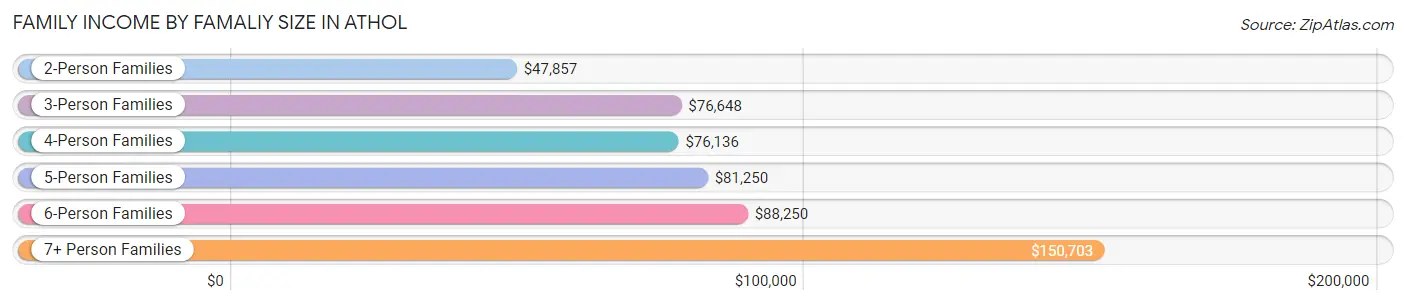
| Income Bracket | # Families | Median Income |
| 2-Person Families | 948 (43.9%) | $47,857 |
| 3-Person Families | 569 (26.4%) | $76,648 |
| 4-Person Families | 284 (13.2%) | $76,136 |
| 5-Person Families | 218 (10.1%) | $81,250 |
| 6-Person Families | 95 (4.4%) | $88,250 |
| 7+ Person Families | 45 (2.1%) | $150,703 |
| Total | 2,159 (100.0%) | $75,536 |
Family Income by Number of Earners in Athol
The median family income in Athol is $75,536, with families comprising 3+ earners (255) having the highest median family income of $97,344, while families with no earners (339) have the lowest median family income of $25,083, accounting for 11.8% and 15.7% of families, respectively.
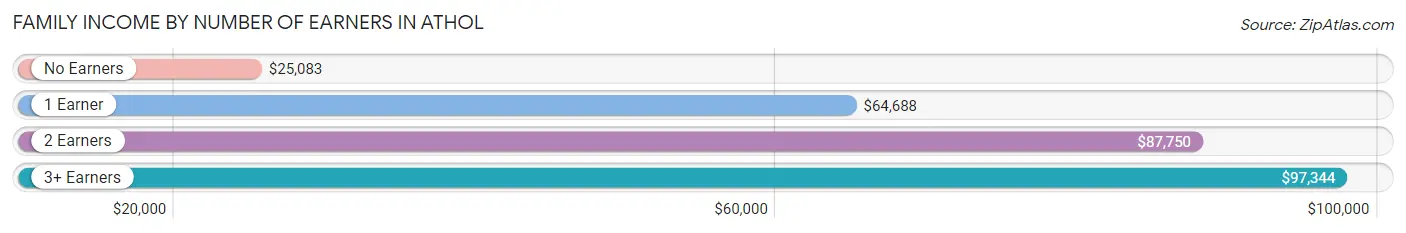
| Number of Earners | # Families | Median Income |
| No Earners | 339 (15.7%) | $25,083 |
| 1 Earner | 762 (35.3%) | $64,688 |
| 2 Earners | 803 (37.2%) | $87,750 |
| 3+ Earners | 255 (11.8%) | $97,344 |
| Total | 2,159 (100.0%) | $75,536 |
Household Income in Athol
Household Income Brackets in Athol
With 743 households falling in the category, the $75,000 to $99,999 income range is the most frequent in Athol, accounting for 21.0% of all households. In contrast, only 96 households (2.7%) fall into the $200,000+ income bracket, making it the least populous group.
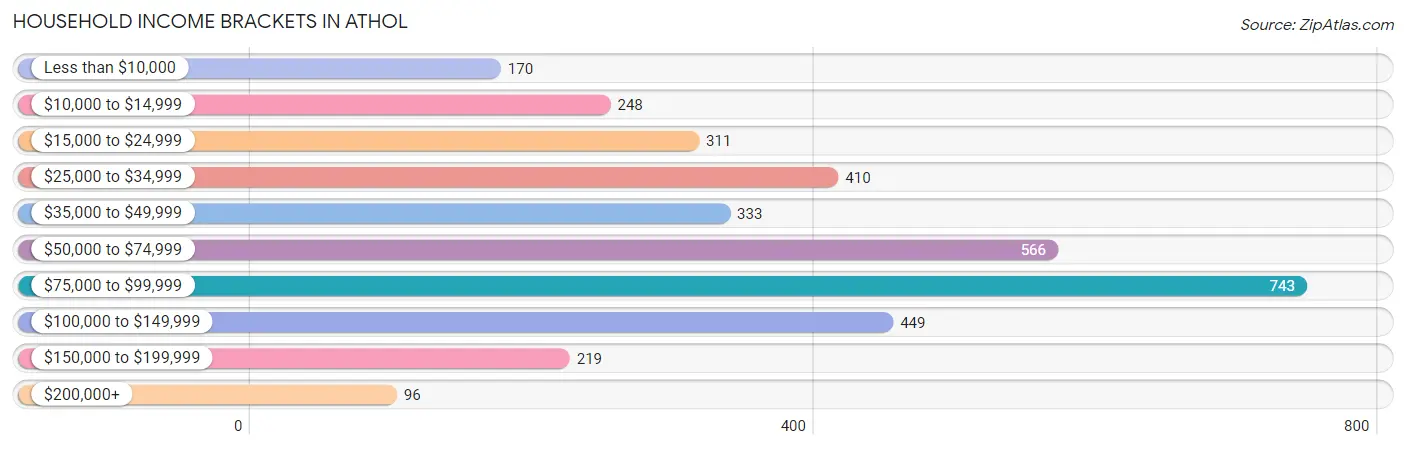
| Income Bracket | # Households | % Households |
| Less than $10,000 | 170 | 4.8% |
| $10,000 to $14,999 | 248 | 7.0% |
| $15,000 to $24,999 | 311 | 8.8% |
| $25,000 to $34,999 | 410 | 11.6% |
| $35,000 to $49,999 | 333 | 9.4% |
| $50,000 to $74,999 | 566 | 16.0% |
| $75,000 to $99,999 | 743 | 21.0% |
| $100,000 to $149,999 | 449 | 12.7% |
| $150,000 to $199,999 | 219 | 6.2% |
| $200,000+ | 96 | 2.7% |
Household Income by Householder Age in Athol
The median household income in Athol is $62,962, with the highest median household income of $79,918 found in the 45 to 64 years age bracket for the primary householder. A total of 1,448 households (40.9%) fall into this category. Meanwhile, the 65+ years age bracket for the primary householder has the lowest median household income of $36,875, with 800 households (22.6%) in this group.
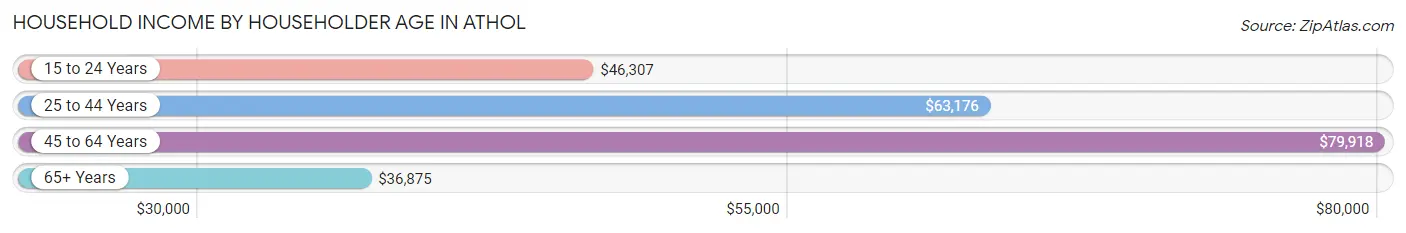
| Income Bracket | # Households | Median Income |
| 15 to 24 Years | 62 (1.8%) | $46,307 |
| 25 to 44 Years | 1,228 (34.7%) | $63,176 |
| 45 to 64 Years | 1,448 (40.9%) | $79,918 |
| 65+ Years | 800 (22.6%) | $36,875 |
| Total | 3,538 (100.0%) | $62,962 |
Poverty in Athol
Income Below Poverty by Sex and Age in Athol
With 12.9% poverty level for males and 13.8% for females among the residents of Athol, 35 to 44 year old males and under 5 year old females are the most vulnerable to poverty, with 145 males (24.1%) and 69 females (29.0%) in their respective age groups living below the poverty level.
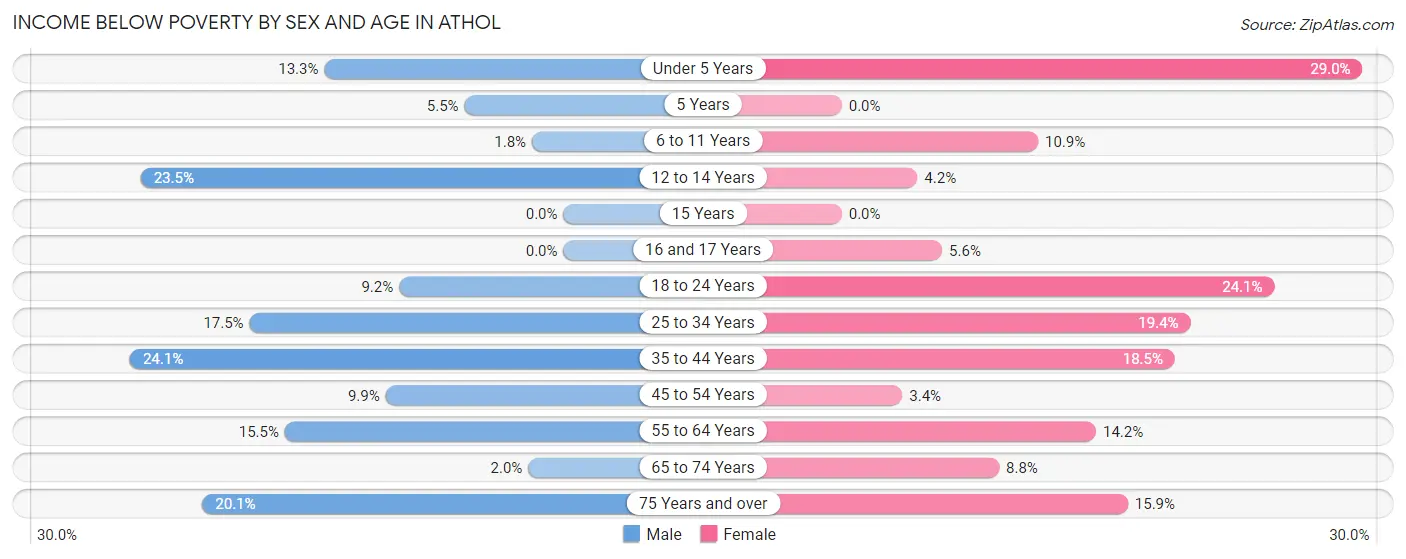
| Age Bracket | Male | Female |
| Under 5 Years | 39 (13.3%) | 69 (29.0%) |
| 5 Years | 7 (5.5%) | 0 (0.0%) |
| 6 to 11 Years | 7 (1.8%) | 20 (10.9%) |
| 12 to 14 Years | 36 (23.5%) | 11 (4.2%) |
| 15 Years | 0 (0.0%) | 0 (0.0%) |
| 16 and 17 Years | 0 (0.0%) | 10 (5.6%) |
| 18 to 24 Years | 41 (9.1%) | 92 (24.1%) |
| 25 to 34 Years | 107 (17.5%) | 125 (19.4%) |
| 35 to 44 Years | 145 (24.1%) | 99 (18.5%) |
| 45 to 54 Years | 60 (9.9%) | 20 (3.4%) |
| 55 to 64 Years | 94 (15.5%) | 96 (14.2%) |
| 65 to 74 Years | 8 (2.0%) | 34 (8.8%) |
| 75 Years and over | 41 (20.1%) | 47 (15.9%) |
| Total | 585 (12.9%) | 623 (13.8%) |
Income Above Poverty by Sex and Age in Athol
According to the poverty statistics in Athol, males aged 15 years and females aged 5 years are the age groups that are most secure financially, with 100.0% of males and 100.0% of females in these age groups living above the poverty line.
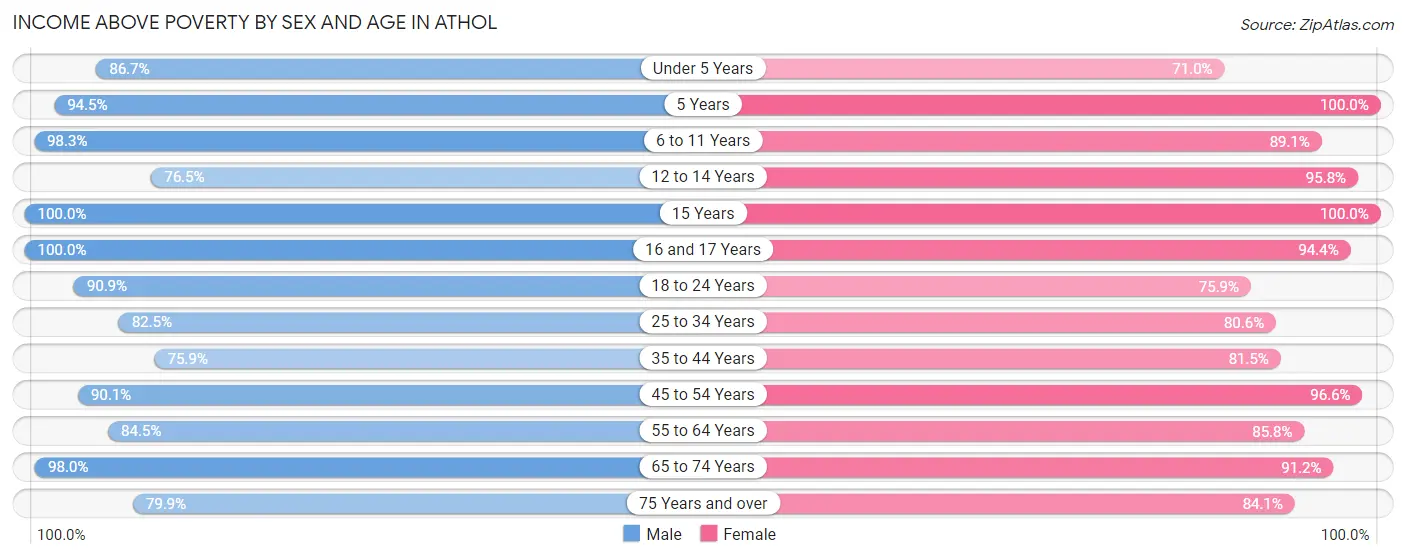
| Age Bracket | Male | Female |
| Under 5 Years | 254 (86.7%) | 169 (71.0%) |
| 5 Years | 120 (94.5%) | 93 (100.0%) |
| 6 to 11 Years | 393 (98.3%) | 163 (89.1%) |
| 12 to 14 Years | 117 (76.5%) | 250 (95.8%) |
| 15 Years | 44 (100.0%) | 54 (100.0%) |
| 16 and 17 Years | 48 (100.0%) | 169 (94.4%) |
| 18 to 24 Years | 407 (90.8%) | 290 (75.9%) |
| 25 to 34 Years | 505 (82.5%) | 519 (80.6%) |
| 35 to 44 Years | 456 (75.9%) | 435 (81.5%) |
| 45 to 54 Years | 546 (90.1%) | 573 (96.6%) |
| 55 to 64 Years | 512 (84.5%) | 582 (85.8%) |
| 65 to 74 Years | 401 (98.0%) | 354 (91.2%) |
| 75 Years and over | 163 (79.9%) | 248 (84.1%) |
| Total | 3,966 (87.2%) | 3,899 (86.2%) |
Income Below Poverty Among Married-Couple Families in Athol
The poverty statistics for married-couple families in Athol show that 6.4% or 86 of the total 1,343 families live below the poverty line. Families with no children have the highest poverty rate of 10.1%, comprising of 76 families. On the other hand, families with 1 or 2 children have the lowest poverty rate of 0.0%, which includes 0 families.
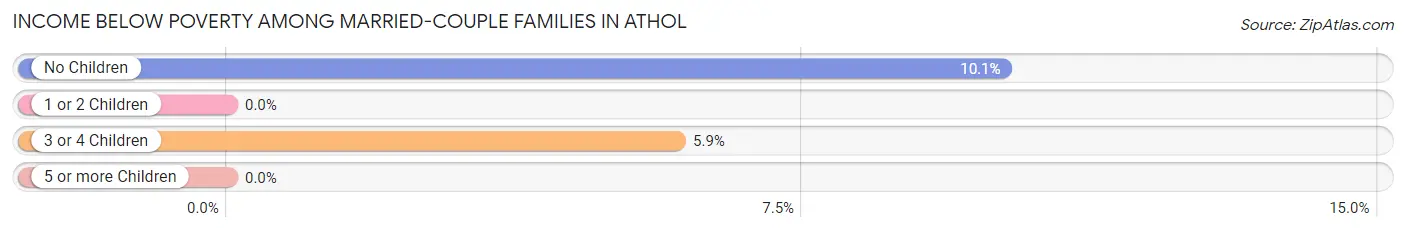
| Children | Above Poverty | Below Poverty |
| No Children | 676 (89.9%) | 76 (10.1%) |
| 1 or 2 Children | 412 (100.0%) | 0 (0.0%) |
| 3 or 4 Children | 161 (94.2%) | 10 (5.9%) |
| 5 or more Children | 8 (100.0%) | 0 (0.0%) |
| Total | 1,257 (93.6%) | 86 (6.4%) |
Income Below Poverty Among Single-Parent Households in Athol
According to the poverty data in Athol, 30.3% or 108 single-father households and 19.1% or 88 single-mother households are living below the poverty line. Among single-father households, those with 1 or 2 children have the highest poverty rate, with 82 households (40.2%) experiencing poverty. Likewise, among single-mother households, those with 1 or 2 children have the highest poverty rate, with 80 households (27.4%) falling below the poverty line.
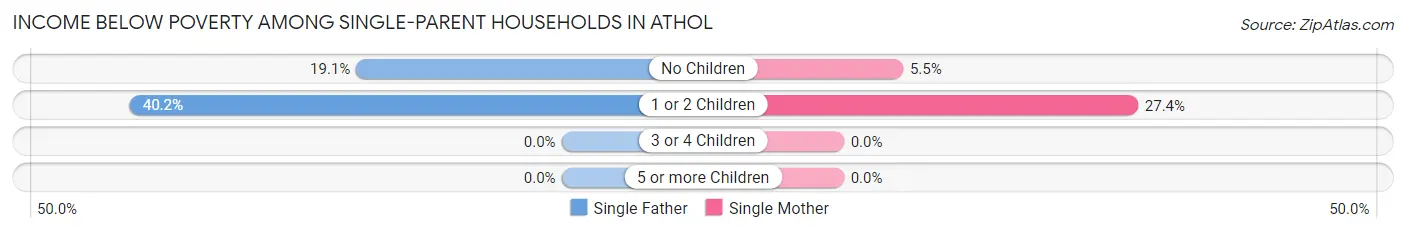
| Children | Single Father | Single Mother |
| No Children | 26 (19.1%) | 8 (5.5%) |
| 1 or 2 Children | 82 (40.2%) | 80 (27.4%) |
| 3 or 4 Children | 0 (0.0%) | 0 (0.0%) |
| 5 or more Children | 0 (0.0%) | 0 (0.0%) |
| Total | 108 (30.3%) | 88 (19.1%) |
Income Below Poverty Among Married-Couple vs Single-Parent Households in Athol
The poverty data for Athol shows that 86 of the married-couple family households (6.4%) and 196 of the single-parent households (24.0%) are living below the poverty level. Within the married-couple family households, those with no children have the highest poverty rate, with 76 households (10.1%) falling below the poverty line. Among the single-parent households, those with 1 or 2 children have the highest poverty rate, with 162 household (32.7%) living below poverty.
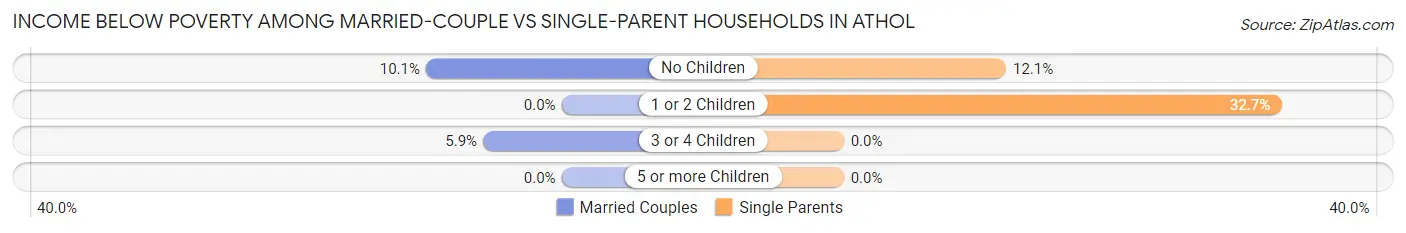
| Children | Married-Couple Families | Single-Parent Households |
| No Children | 76 (10.1%) | 34 (12.1%) |
| 1 or 2 Children | 0 (0.0%) | 162 (32.7%) |
| 3 or 4 Children | 10 (5.9%) | 0 (0.0%) |
| 5 or more Children | 0 (0.0%) | 0 (0.0%) |
| Total | 86 (6.4%) | 196 (24.0%) |
Race in Athol
The most populous races in Athol are White / Caucasian (8,385 | 91.7%), Hispanic or Latino (730 | 8.0%), and Two or more Races (347 | 3.8%).
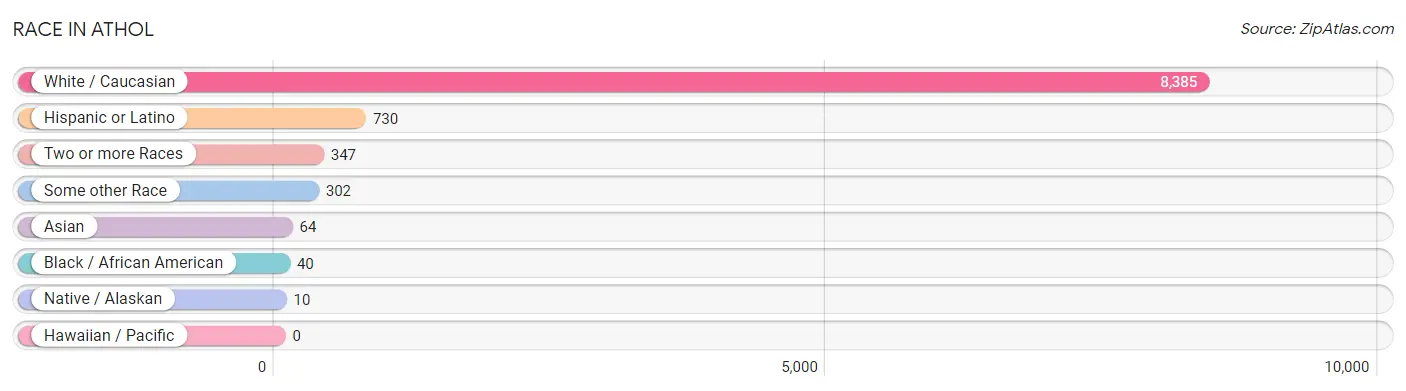
| Race | # Population | % Population |
| Asian | 64 | 0.7% |
| Black / African American | 40 | 0.4% |
| Hawaiian / Pacific | 0 | 0.0% |
| Hispanic or Latino | 730 | 8.0% |
| Native / Alaskan | 10 | 0.1% |
| White / Caucasian | 8,385 | 91.7% |
| Two or more Races | 347 | 3.8% |
| Some other Race | 302 | 3.3% |
| Total | 9,148 | 100.0% |
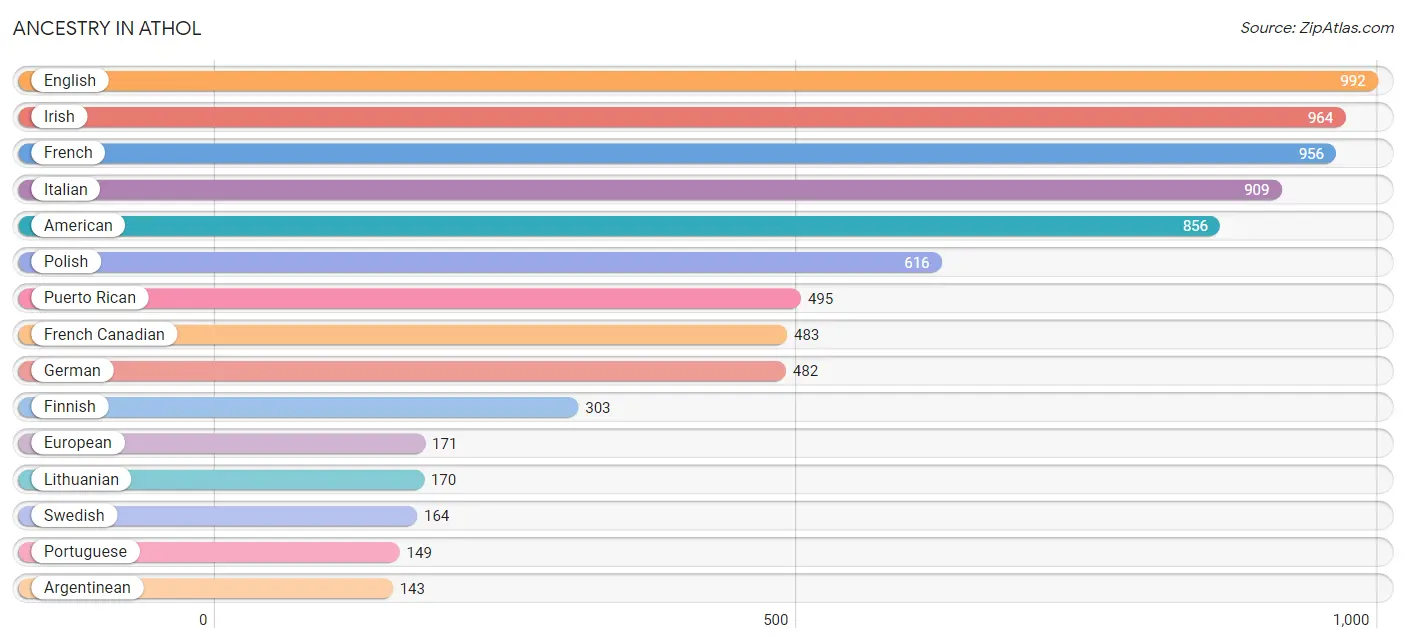
Ancestry in Athol
The most populous ancestries reported in Athol are English (992 | 10.8%), Irish (964 | 10.5%), French (956 | 10.4%), Italian (909 | 9.9%), and American (856 | 9.4%), together accounting for 51.1% of all Athol residents.
| Ancestry | # Population | % Population |
| Alaska Native | 34 | 0.4% |
| Albanian | 10 | 0.1% |
| American | 856 | 9.4% |
| Apache | 9 | 0.1% |
| Arab | 9 | 0.1% |
| Argentinean | 143 | 1.6% |
| Armenian | 45 | 0.5% |
| Austrian | 13 | 0.1% |
| Canadian | 104 | 1.1% |
| Cape Verdean | 79 | 0.9% |
| Celtic | 17 | 0.2% |
| Central American | 40 | 0.4% |
| Cuban | 17 | 0.2% |
| Danish | 25 | 0.3% |
| Dutch | 28 | 0.3% |
| Eastern European | 20 | 0.2% |
| English | 992 | 10.8% |
| European | 171 | 1.9% |
| Finnish | 303 | 3.3% |
| French | 956 | 10.4% |
| French Canadian | 483 | 5.3% |
| German | 482 | 5.3% |
| Greek | 28 | 0.3% |
| Hungarian | 16 | 0.2% |
| Indian (Asian) | 39 | 0.4% |
| Irish | 964 | 10.5% |
| Iroquois | 11 | 0.1% |
| Italian | 909 | 9.9% |
| Jamaican | 18 | 0.2% |
| Lebanese | 9 | 0.1% |
| Lithuanian | 170 | 1.9% |
| Mexican | 35 | 0.4% |
| Norwegian | 38 | 0.4% |
| Pakistani | 60 | 0.7% |
| Polish | 616 | 6.7% |
| Portuguese | 149 | 1.6% |
| Puerto Rican | 495 | 5.4% |
| Russian | 9 | 0.1% |
| Salvadoran | 40 | 0.4% |
| Scandinavian | 37 | 0.4% |
| Scotch-Irish | 37 | 0.4% |
| Scottish | 135 | 1.5% |
| South American | 143 | 1.6% |
| Sri Lankan | 16 | 0.2% |
| Subsaharan African | 79 | 0.9% |
| Swedish | 164 | 1.8% |
| Thai | 27 | 0.3% |
| Ukrainian | 16 | 0.2% |
| Welsh | 13 | 0.1% |
| Yugoslavian | 6 | 0.1% | View All 50 Rows |
Immigrants in Athol
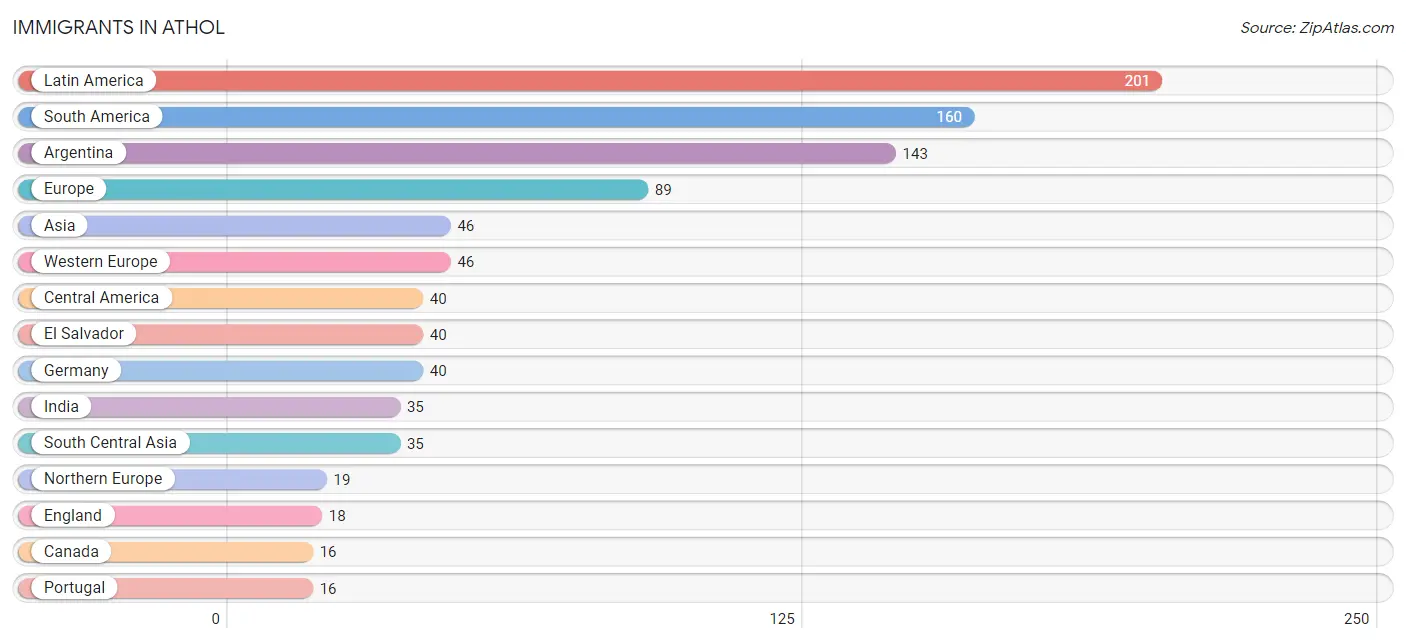
The most numerous immigrant groups reported in Athol came from Latin America (201 | 2.2%), South America (160 | 1.8%), Argentina (143 | 1.6%), Europe (89 | 1.0%), and Asia (46 | 0.5%), together accounting for 7.0% of all Athol residents.
| Immigration Origin | # Population | % Population |
| Argentina | 143 | 1.6% |
| Asia | 46 | 0.5% |
| Austria | 6 | 0.1% |
| Brazil | 9 | 0.1% |
| Canada | 16 | 0.2% |
| Caribbean | 1 | 0.0% |
| Central America | 40 | 0.4% |
| Eastern Europe | 8 | 0.1% |
| El Salvador | 40 | 0.4% |
| England | 18 | 0.2% |
| Europe | 89 | 1.0% |
| Germany | 40 | 0.4% |
| India | 35 | 0.4% |
| Indonesia | 11 | 0.1% |
| Jamaica | 1 | 0.0% |
| Latin America | 201 | 2.2% |
| Northern Europe | 19 | 0.2% |
| Poland | 8 | 0.1% |
| Portugal | 16 | 0.2% |
| South America | 160 | 1.8% |
| South Central Asia | 35 | 0.4% |
| South Eastern Asia | 11 | 0.1% |
| Southern Europe | 16 | 0.2% |
| Western Europe | 46 | 0.5% | View All 24 Rows |
Sex and Age in Athol
Sex and Age in Athol
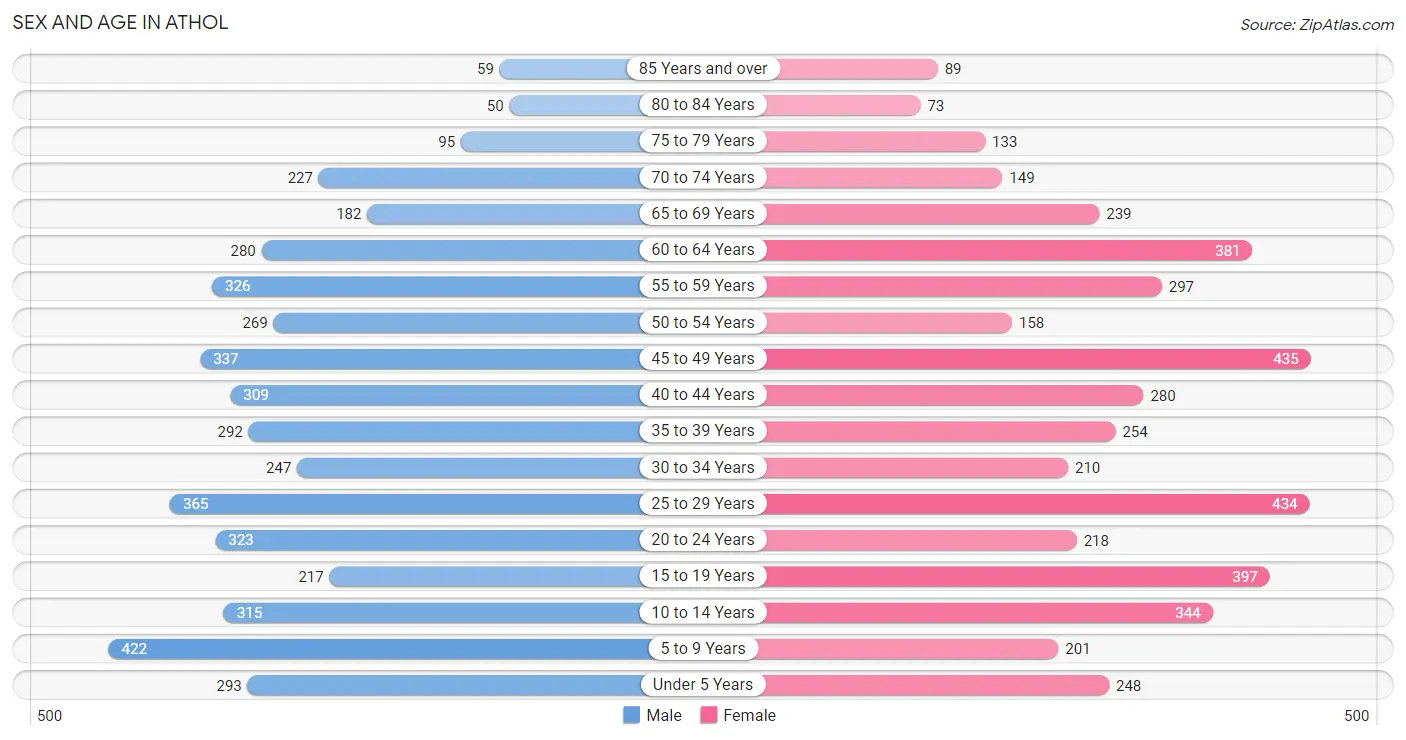
The most populous age groups in Athol are 5 to 9 Years (422 | 9.2%) for men and 45 to 49 Years (435 | 9.6%) for women.
| Age Bracket | Male | Female |
| Under 5 Years | 293 (6.4%) | 248 (5.5%) |
| 5 to 9 Years | 422 (9.2%) | 201 (4.4%) |
| 10 to 14 Years | 315 (6.8%) | 344 (7.6%) |
| 15 to 19 Years | 217 (4.7%) | 397 (8.7%) |
| 20 to 24 Years | 323 (7.0%) | 218 (4.8%) |
| 25 to 29 Years | 365 (7.9%) | 434 (9.6%) |
| 30 to 34 Years | 247 (5.4%) | 210 (4.6%) |
| 35 to 39 Years | 292 (6.3%) | 254 (5.6%) |
| 40 to 44 Years | 309 (6.7%) | 280 (6.2%) |
| 45 to 49 Years | 337 (7.3%) | 435 (9.6%) |
| 50 to 54 Years | 269 (5.8%) | 158 (3.5%) |
| 55 to 59 Years | 326 (7.1%) | 297 (6.5%) |
| 60 to 64 Years | 280 (6.1%) | 381 (8.4%) |
| 65 to 69 Years | 182 (4.0%) | 239 (5.3%) |
| 70 to 74 Years | 227 (4.9%) | 149 (3.3%) |
| 75 to 79 Years | 95 (2.1%) | 133 (2.9%) |
| 80 to 84 Years | 50 (1.1%) | 73 (1.6%) |
| 85 Years and over | 59 (1.3%) | 89 (2.0%) |
| Total | 4,608 (100.0%) | 4,540 (100.0%) |
Families and Households in Athol
Median Family Size in Athol
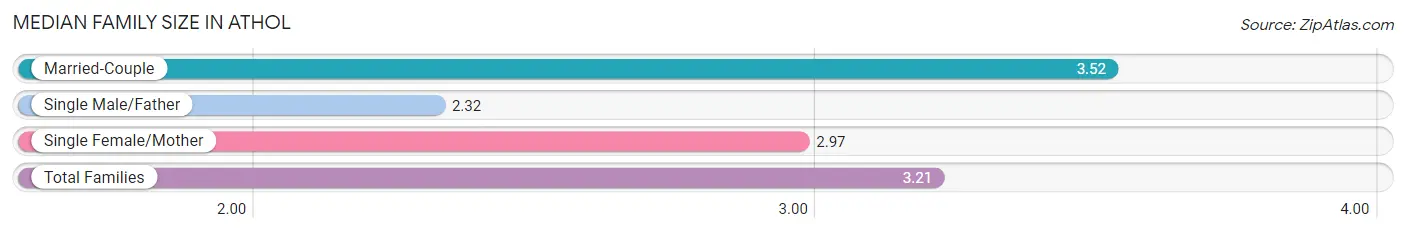
The median family size in Athol is 3.21 persons per family, with married-couple families (1,343 | 62.2%) accounting for the largest median family size of 3.52 persons per family. On the other hand, single male/father families (356 | 16.5%) represent the smallest median family size with 2.32 persons per family.
| Family Type | # Families | Family Size |
| Married-Couple | 1,343 (62.2%) | 3.52 |
| Single Male/Father | 356 (16.5%) | 2.32 |
| Single Female/Mother | 460 (21.3%) | 2.97 |
| Total Families | 2,159 (100.0%) | 3.21 |
Median Household Size in Athol
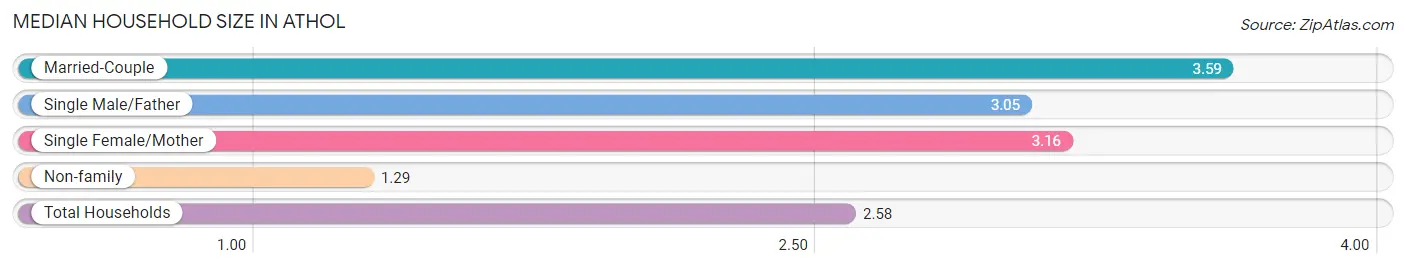
The median household size in Athol is 2.58 persons per household, with married-couple households (1,343 | 38.0%) accounting for the largest median household size of 3.59 persons per household. non-family households (1,379 | 39.0%) represent the smallest median household size with 1.29 persons per household.
| Household Type | # Households | Household Size |
| Married-Couple | 1,343 (38.0%) | 3.59 |
| Single Male/Father | 356 (10.1%) | 3.05 |
| Single Female/Mother | 460 (13.0%) | 3.16 |
| Non-family | 1,379 (39.0%) | 1.29 |
| Total Households | 3,538 (100.0%) | 2.58 |
Household Size by Marriage Status in Athol
Out of a total of 3,538 households in Athol, 2,159 (61.0%) are family households, while 1,379 (39.0%) are nonfamily households. The most numerous type of family households are 2-person households, comprising 735, and the most common type of nonfamily households are 1-person households, comprising 1,072.
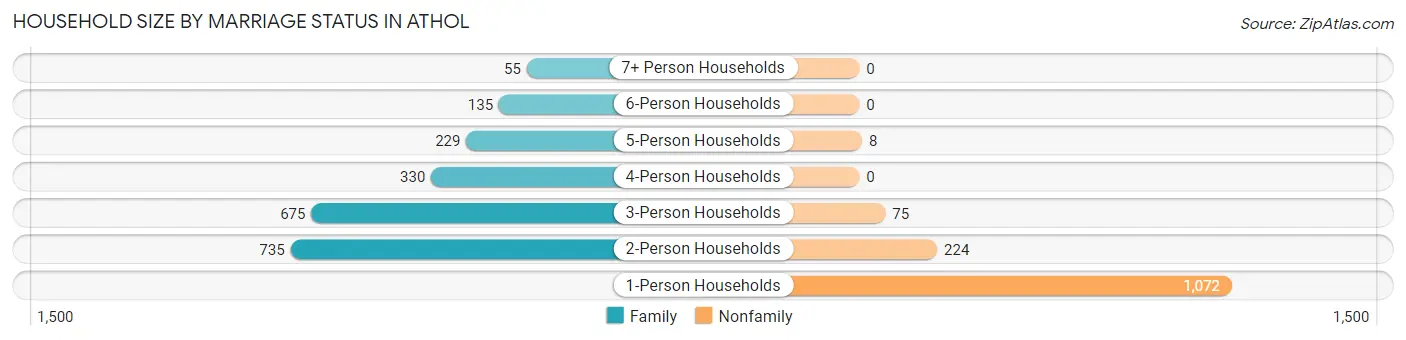
| Household Size | Family Households | Nonfamily Households |
| 1-Person Households | - | 1,072 (30.3%) |
| 2-Person Households | 735 (20.8%) | 224 (6.3%) |
| 3-Person Households | 675 (19.1%) | 75 (2.1%) |
| 4-Person Households | 330 (9.3%) | 0 (0.0%) |
| 5-Person Households | 229 (6.5%) | 8 (0.2%) |
| 6-Person Households | 135 (3.8%) | 0 (0.0%) |
| 7+ Person Households | 55 (1.5%) | 0 (0.0%) |
| Total | 2,159 (61.0%) | 1,379 (39.0%) |
Female Fertility in Athol
Fertility by Age in Athol
Average fertility rate in Athol is 47.0 births per 1,000 women. Women in the age bracket of 20 to 34 years have the highest fertility rate with 110.0 births per 1,000 women. Women in the age bracket of 20 to 34 years acount for 89.6% of all women with births.
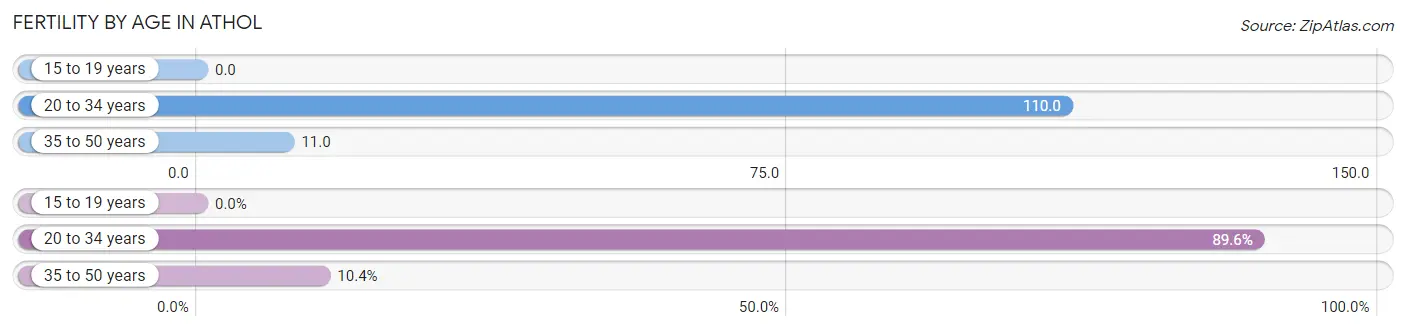
| Age Bracket | Women with Births | Births / 1,000 Women |
| 15 to 19 years | 0 (0.0%) | 0.0 |
| 20 to 34 years | 95 (89.6%) | 110.0 |
| 35 to 50 years | 11 (10.4%) | 11.0 |
| Total | 106 (100.0%) | 47.0 |
Fertility by Age by Marriage Status in Athol
87.7% of women with births (106) in Athol are married. The highest percentage of unmarried women with births falls into 20 to 34 years age bracket with 13.7% of them unmarried at the time of birth, while the lowest percentage of unmarried women with births belong to 35 to 50 years age bracket with 0.0% of them unmarried.
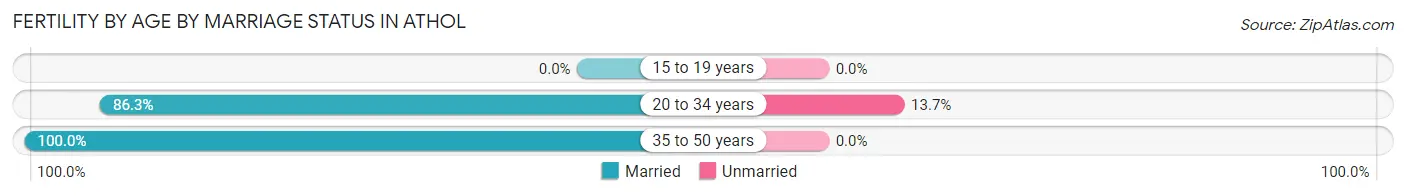
| Age Bracket | Married | Unmarried |
| 15 to 19 years | 0 (0.0%) | 0 (0.0%) |
| 20 to 34 years | 82 (86.3%) | 13 (13.7%) |
| 35 to 50 years | 11 (100.0%) | 0 (0.0%) |
| Total | 93 (87.7%) | 13 (12.3%) |
Fertility by Education in Athol
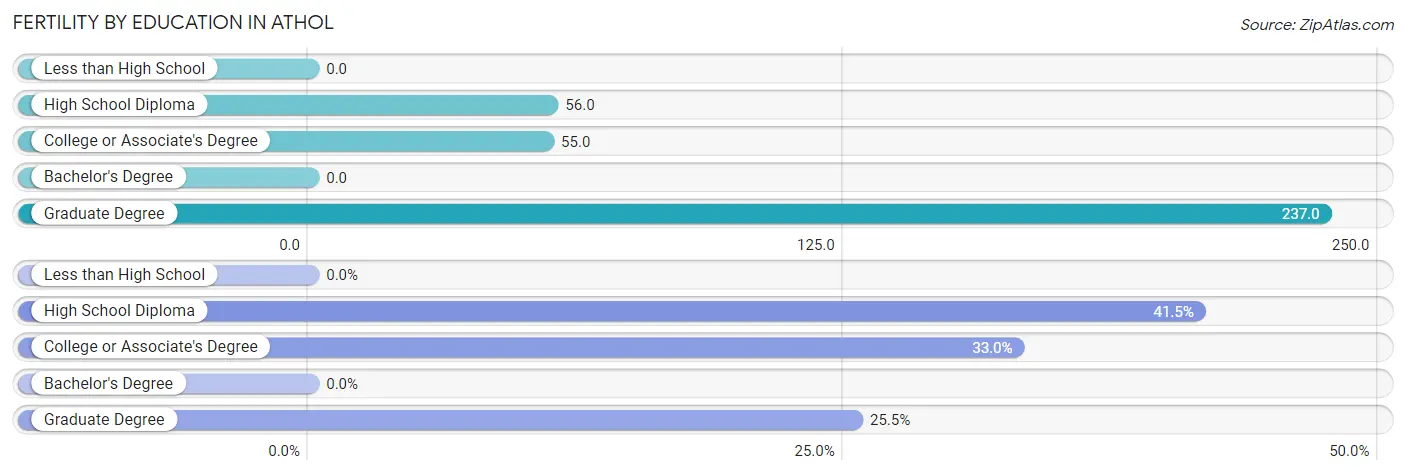
| Educational Attainment | Women with Births | Births / 1,000 Women |
| Less than High School | 0 (0.0%) | 0.0 |
| High School Diploma | 44 (41.5%) | 56.0 |
| College or Associate's Degree | 35 (33.0%) | 55.0 |
| Bachelor's Degree | 0 (0.0%) | 0.0 |
| Graduate Degree | 27 (25.5%) | 237.0 |
| Total | 106 (100.0%) | 47.0 |
Fertility by Education by Marriage Status in Athol
12.3% of women with births in Athol are unmarried. Women with the educational attainment of college or associate's degree are most likely to be married with 100.0% of them married at childbirth, while women with the educational attainment of high school diploma are least likely to be married with 29.5% of them unmarried at childbirth.
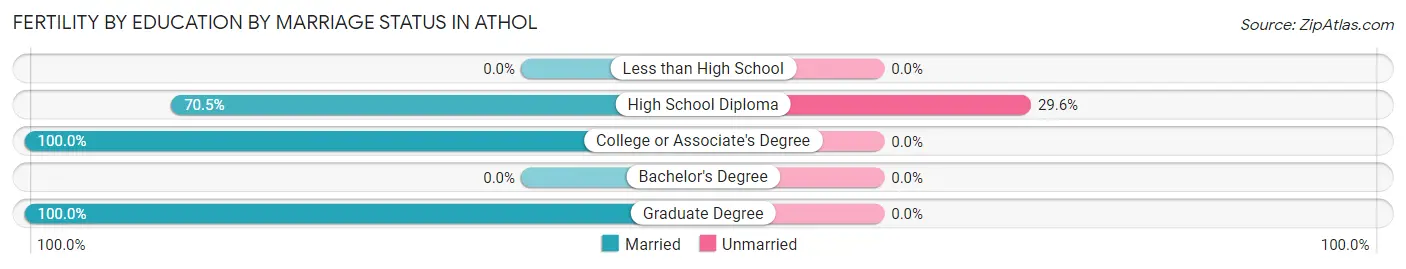
| Educational Attainment | Married | Unmarried |
| Less than High School | 0 (0.0%) | 0 (0.0%) |
| High School Diploma | 31 (70.5%) | 13 (29.5%) |
| College or Associate's Degree | 35 (100.0%) | 0 (0.0%) |
| Bachelor's Degree | 0 (0.0%) | 0 (0.0%) |
| Graduate Degree | 27 (100.0%) | 0 (0.0%) |
| Total | 93 (87.7%) | 13 (12.3%) |
Employment Characteristics in Athol
Employment by Class of Employer in Athol
Among the 4,133 employed individuals in Athol, private company employees (2,815 | 68.1%), not-for-profit organizations (441 | 10.7%), and local government employees (344 | 8.3%) make up the most common classes of employment.
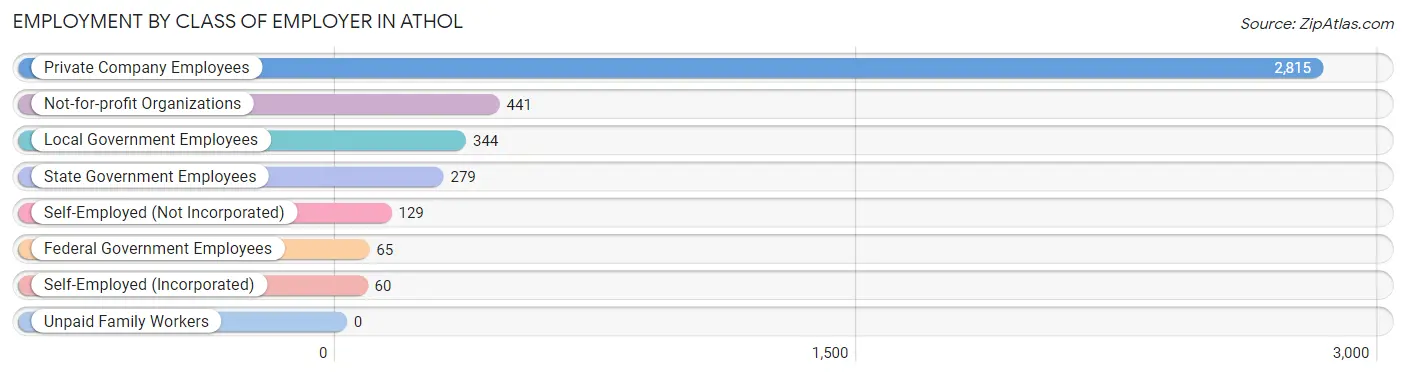
| Employer Class | # Employees | % Employees |
| Private Company Employees | 2,815 | 68.1% |
| Self-Employed (Incorporated) | 60 | 1.5% |
| Self-Employed (Not Incorporated) | 129 | 3.1% |
| Not-for-profit Organizations | 441 | 10.7% |
| Local Government Employees | 344 | 8.3% |
| State Government Employees | 279 | 6.8% |
| Federal Government Employees | 65 | 1.6% |
| Unpaid Family Workers | 0 | 0.0% |
| Total | 4,133 | 100.0% |
Employment Status by Age in Athol
According to the labor force statistics for Athol, out of the total population over 16 years of age (7,227), 64.1% or 4,633 individuals are in the labor force, with 8.1% or 375 of them unemployed. The age group with the highest labor force participation rate is 30 to 34 years, with 88.8% or 406 individuals in the labor force. Within the labor force, the 16 to 19 years age range has the highest percentage of unemployed individuals, with 22.5% or 68 of them being unemployed.
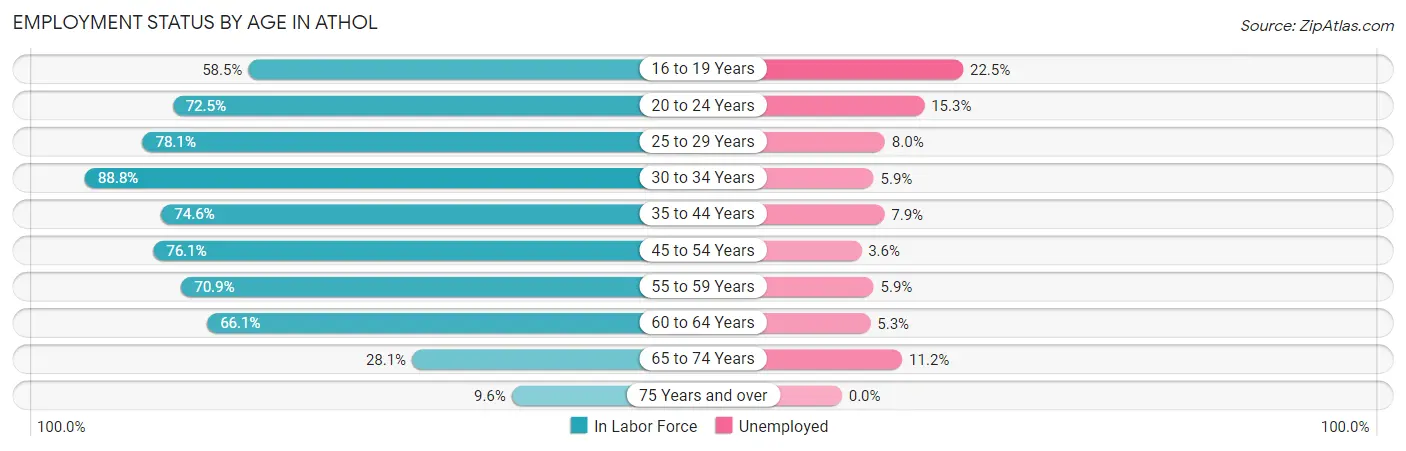
| Age Bracket | In Labor Force | Unemployed |
| 16 to 19 Years | 302 (58.5%) | 68 (22.5%) |
| 20 to 24 Years | 392 (72.5%) | 60 (15.3%) |
| 25 to 29 Years | 624 (78.1%) | 50 (8.0%) |
| 30 to 34 Years | 406 (88.8%) | 24 (5.9%) |
| 35 to 44 Years | 847 (74.6%) | 67 (7.9%) |
| 45 to 54 Years | 912 (76.1%) | 33 (3.6%) |
| 55 to 59 Years | 442 (70.9%) | 26 (5.9%) |
| 60 to 64 Years | 437 (66.1%) | 23 (5.3%) |
| 65 to 74 Years | 224 (28.1%) | 25 (11.2%) |
| 75 Years and over | 48 (9.6%) | 0 (0.0%) |
| Total | 4,633 (64.1%) | 375 (8.1%) |
Employment Status by Educational Attainment in Athol
According to labor force statistics for Athol, 75.3% of individuals (3,670) out of the total population between 25 and 64 years of age (4,874) are in the labor force, with 6.1% or 224 of them being unemployed. The group with the highest labor force participation rate are those with the educational attainment of bachelor's degree or higher, with 83.5% or 868 individuals in the labor force. Within the labor force, individuals with high school diploma education have the highest percentage of unemployment, with 11.7% or 180 of them being unemployed.
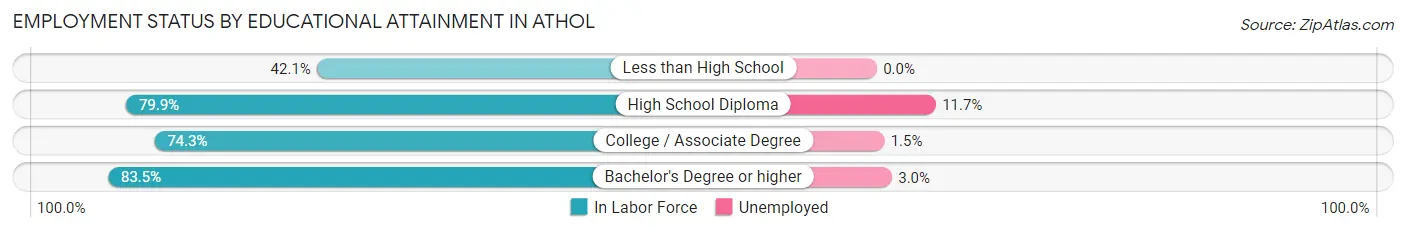
| Educational Attainment | In Labor Force | Unemployed |
| Less than High School | 205 (42.1%) | 0 (0.0%) |
| High School Diploma | 1,542 (79.9%) | 226 (11.7%) |
| College / Associate Degree | 1,053 (74.3%) | 21 (1.5%) |
| Bachelor's Degree or higher | 868 (83.5%) | 31 (3.0%) |
| Total | 3,670 (75.3%) | 297 (6.1%) |
Employment Occupations by Sex in Athol
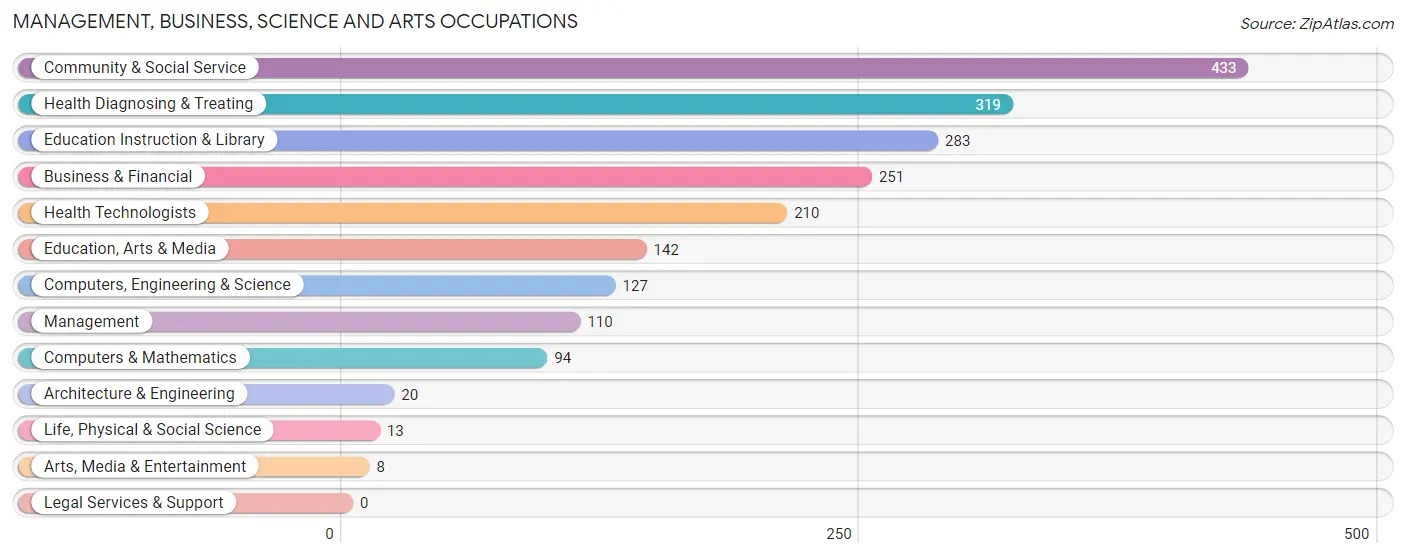
Management, Business, Science and Arts Occupations
The most common Management, Business, Science and Arts occupations in Athol are Community & Social Service (433 | 10.2%), Health Diagnosing & Treating (319 | 7.5%), Education Instruction & Library (283 | 6.7%), Business & Financial (251 | 5.9%), and Health Technologists (210 | 4.9%).
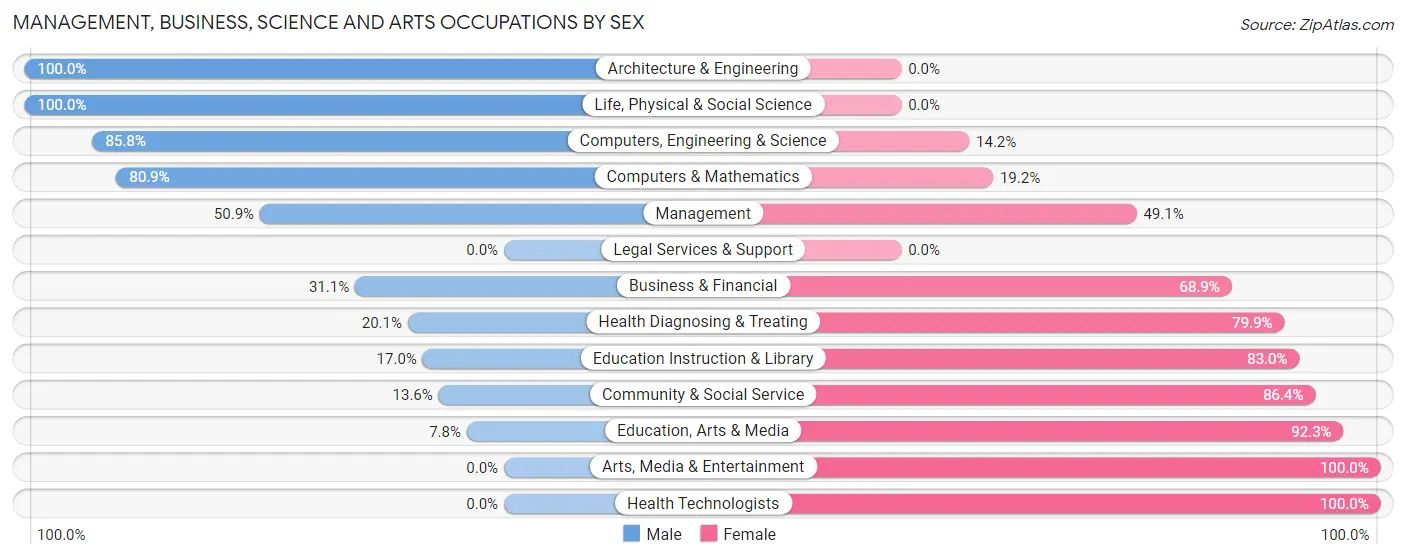
Management, Business, Science and Arts Occupations by Sex
Within the Management, Business, Science and Arts occupations in Athol, the most male-oriented occupations are Architecture & Engineering (100.0%), Life, Physical & Social Science (100.0%), and Computers, Engineering & Science (85.8%), while the most female-oriented occupations are Arts, Media & Entertainment (100.0%), Health Technologists (100.0%), and Education, Arts & Media (92.2%).
| Occupation | Male | Female |
| Management | 56 (50.9%) | 54 (49.1%) |
| Business & Financial | 78 (31.1%) | 173 (68.9%) |
| Computers, Engineering & Science | 109 (85.8%) | 18 (14.2%) |
| Computers & Mathematics | 76 (80.8%) | 18 (19.2%) |
| Architecture & Engineering | 20 (100.0%) | 0 (0.0%) |
| Life, Physical & Social Science | 13 (100.0%) | 0 (0.0%) |
| Community & Social Service | 59 (13.6%) | 374 (86.4%) |
| Education, Arts & Media | 11 (7.7%) | 131 (92.2%) |
| Legal Services & Support | 0 (0.0%) | 0 (0.0%) |
| Education Instruction & Library | 48 (17.0%) | 235 (83.0%) |
| Arts, Media & Entertainment | 0 (0.0%) | 8 (100.0%) |
| Health Diagnosing & Treating | 64 (20.1%) | 255 (79.9%) |
| Health Technologists | 0 (0.0%) | 210 (100.0%) |
| Total (Category) | 366 (29.5%) | 874 (70.5%) |
| Total (Overall) | 2,043 (48.0%) | 2,215 (52.0%) |
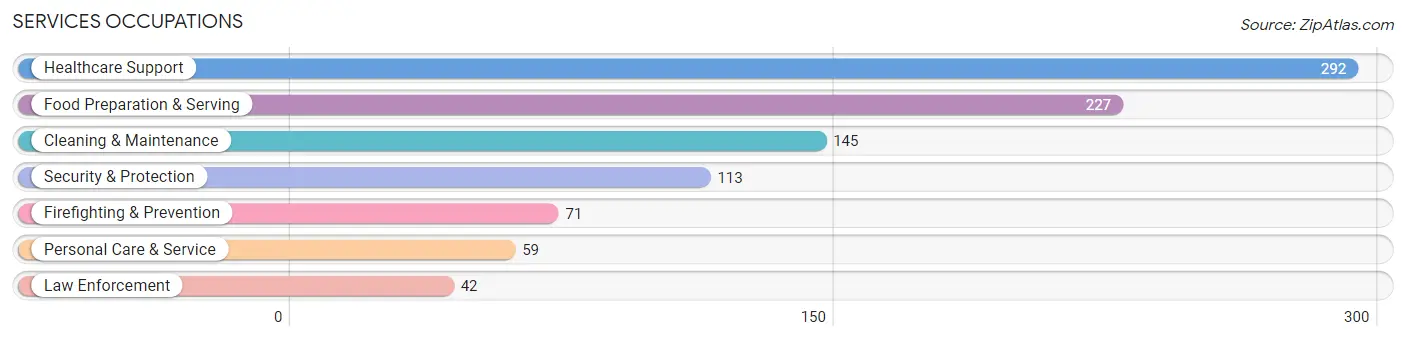
Services Occupations
The most common Services occupations in Athol are Healthcare Support (292 | 6.9%), Food Preparation & Serving (227 | 5.3%), Cleaning & Maintenance (145 | 3.4%), Security & Protection (113 | 2.6%), and Firefighting & Prevention (71 | 1.7%).
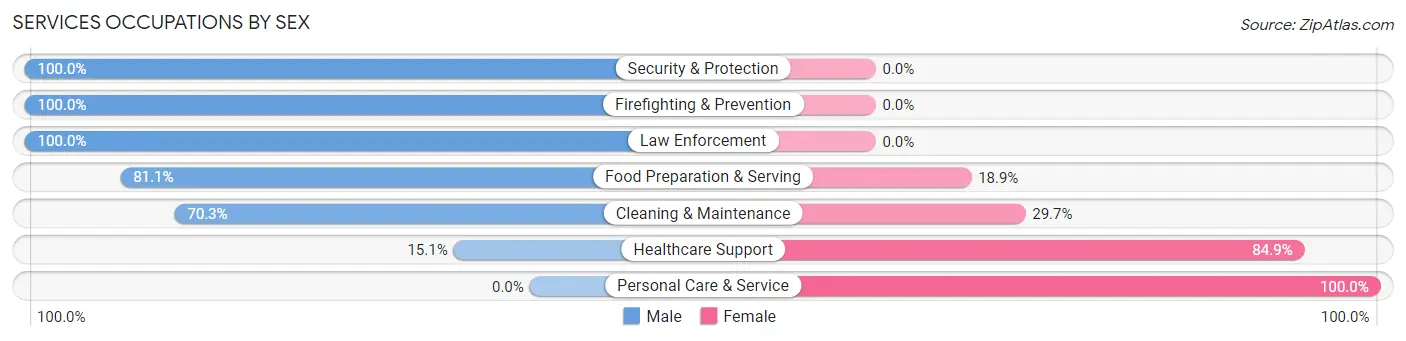
Services Occupations by Sex
Within the Services occupations in Athol, the most male-oriented occupations are Security & Protection (100.0%), Firefighting & Prevention (100.0%), and Law Enforcement (100.0%), while the most female-oriented occupations are Personal Care & Service (100.0%), Healthcare Support (84.9%), and Cleaning & Maintenance (29.7%).
| Occupation | Male | Female |
| Healthcare Support | 44 (15.1%) | 248 (84.9%) |
| Security & Protection | 113 (100.0%) | 0 (0.0%) |
| Firefighting & Prevention | 71 (100.0%) | 0 (0.0%) |
| Law Enforcement | 42 (100.0%) | 0 (0.0%) |
| Food Preparation & Serving | 184 (81.1%) | 43 (18.9%) |
| Cleaning & Maintenance | 102 (70.3%) | 43 (29.7%) |
| Personal Care & Service | 0 (0.0%) | 59 (100.0%) |
| Total (Category) | 443 (53.0%) | 393 (47.0%) |
| Total (Overall) | 2,043 (48.0%) | 2,215 (52.0%) |
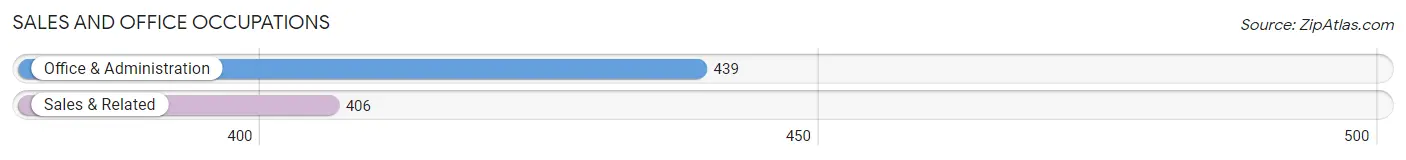
Sales and Office Occupations
The most common Sales and Office occupations in Athol are Office & Administration (439 | 10.3%), and Sales & Related (406 | 9.5%).
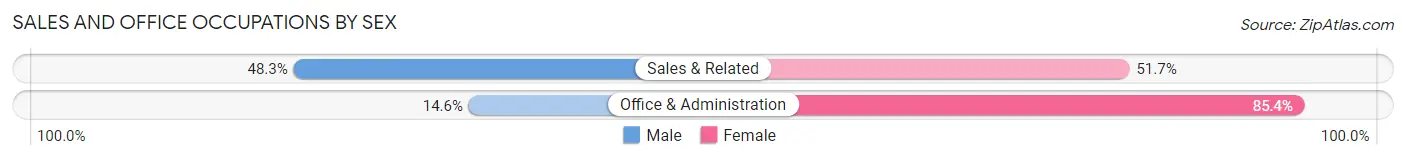
Sales and Office Occupations by Sex
| Occupation | Male | Female |
| Sales & Related | 196 (48.3%) | 210 (51.7%) |
| Office & Administration | 64 (14.6%) | 375 (85.4%) |
| Total (Category) | 260 (30.8%) | 585 (69.2%) |
| Total (Overall) | 2,043 (48.0%) | 2,215 (52.0%) |
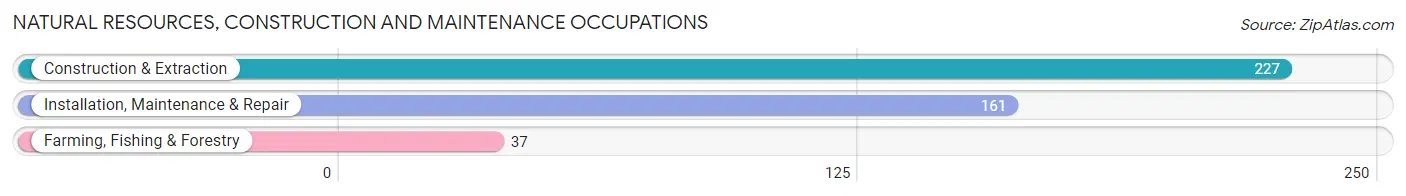
Natural Resources, Construction and Maintenance Occupations
The most common Natural Resources, Construction and Maintenance occupations in Athol are Construction & Extraction (227 | 5.3%), Installation, Maintenance & Repair (161 | 3.8%), and Farming, Fishing & Forestry (37 | 0.9%).
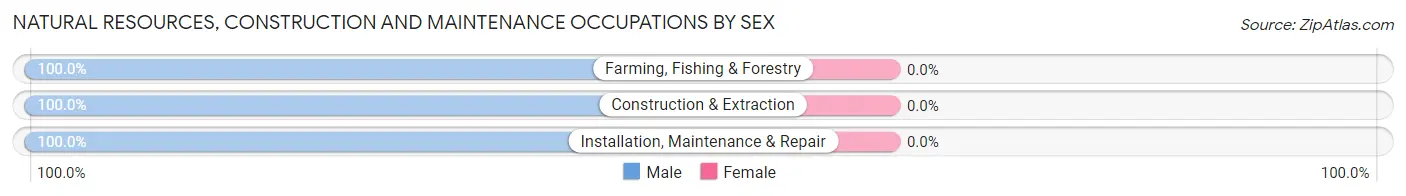
Natural Resources, Construction and Maintenance Occupations by Sex
| Occupation | Male | Female |
| Farming, Fishing & Forestry | 37 (100.0%) | 0 (0.0%) |
| Construction & Extraction | 227 (100.0%) | 0 (0.0%) |
| Installation, Maintenance & Repair | 161 (100.0%) | 0 (0.0%) |
| Total (Category) | 425 (100.0%) | 0 (0.0%) |
| Total (Overall) | 2,043 (48.0%) | 2,215 (52.0%) |
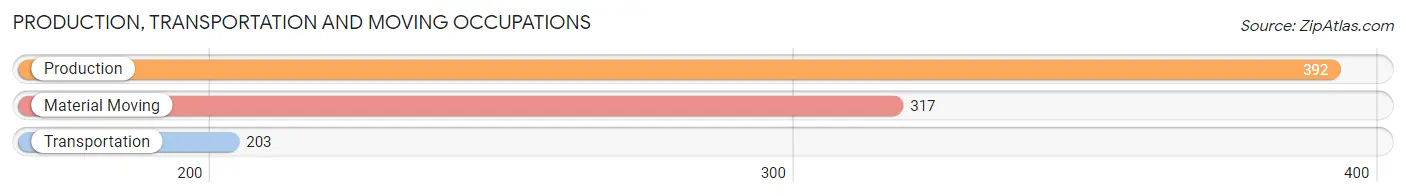
Production, Transportation and Moving Occupations
The most common Production, Transportation and Moving occupations in Athol are Production (392 | 9.2%), Material Moving (317 | 7.4%), and Transportation (203 | 4.8%).
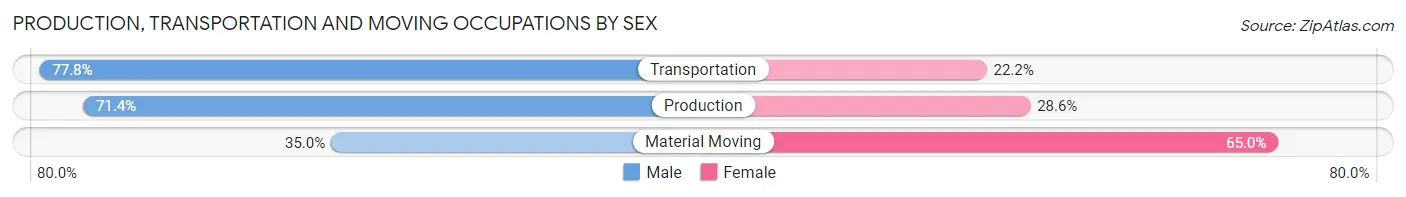
Production, Transportation and Moving Occupations by Sex
| Occupation | Male | Female |
| Production | 280 (71.4%) | 112 (28.6%) |
| Transportation | 158 (77.8%) | 45 (22.2%) |
| Material Moving | 111 (35.0%) | 206 (65.0%) |
| Total (Category) | 549 (60.2%) | 363 (39.8%) |
| Total (Overall) | 2,043 (48.0%) | 2,215 (52.0%) |
Employment Industries by Sex in Athol
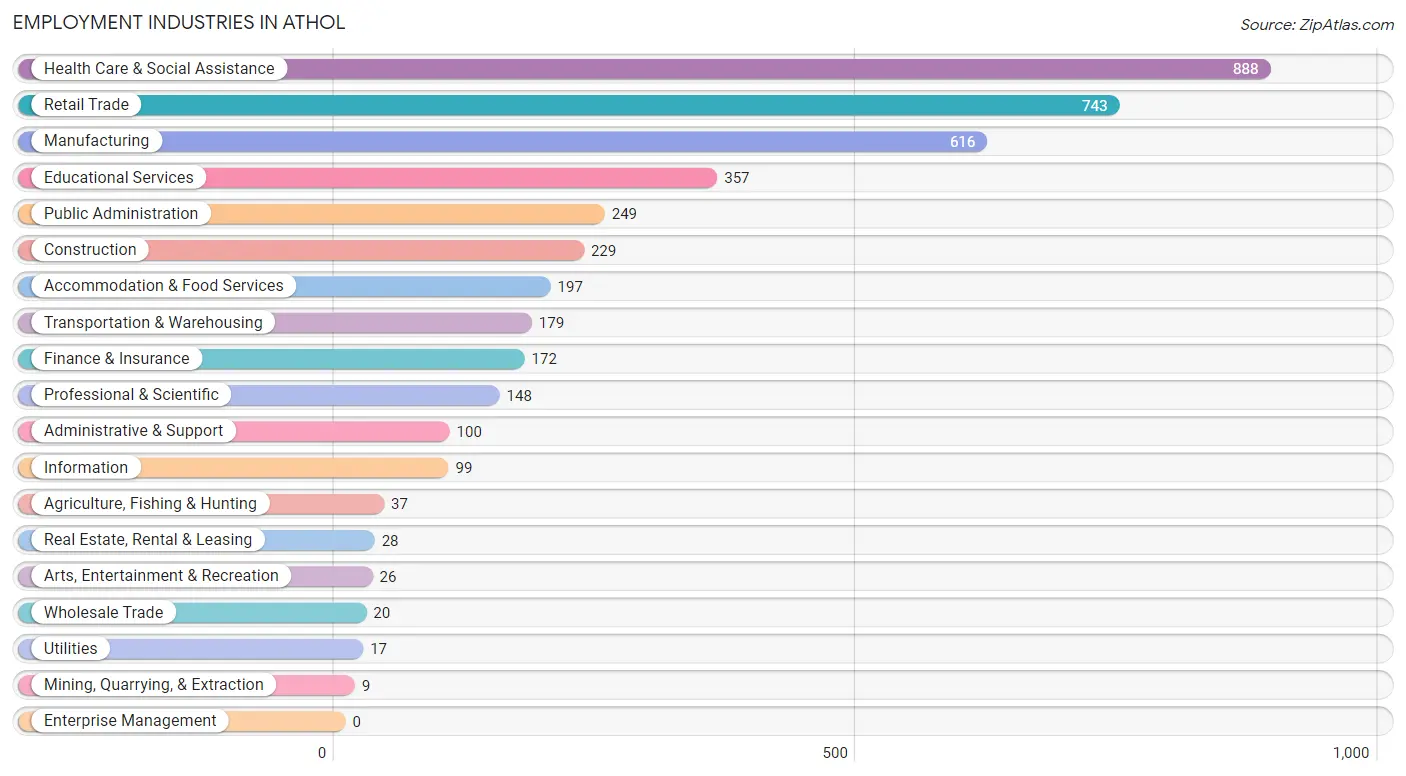
Employment Industries in Athol
The major employment industries in Athol include Health Care & Social Assistance (888 | 20.8%), Retail Trade (743 | 17.4%), Manufacturing (616 | 14.5%), Educational Services (357 | 8.4%), and Public Administration (249 | 5.9%).
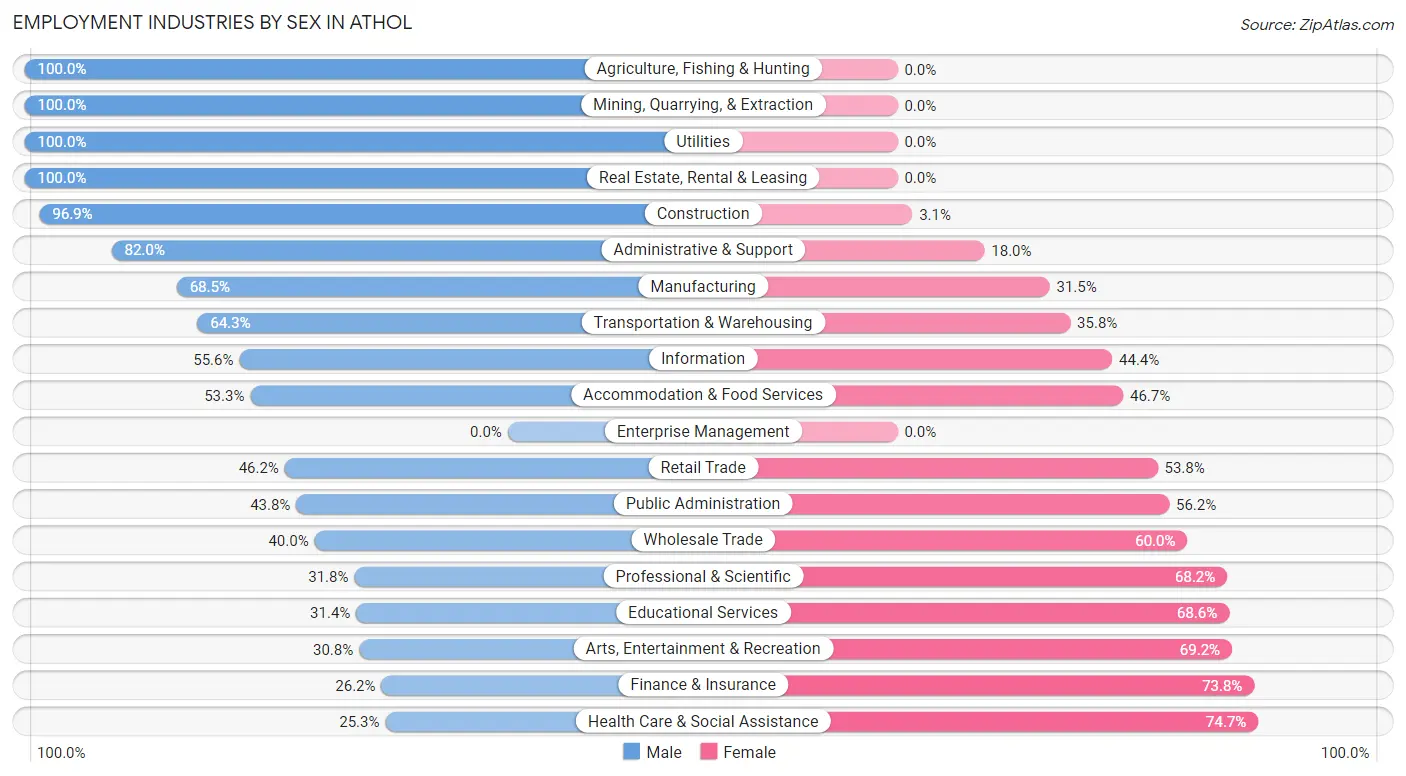
Employment Industries by Sex in Athol
The Athol industries that see more men than women are Agriculture, Fishing & Hunting (100.0%), Mining, Quarrying, & Extraction (100.0%), and Utilities (100.0%), whereas the industries that tend to have a higher number of women are Health Care & Social Assistance (74.7%), Finance & Insurance (73.8%), and Arts, Entertainment & Recreation (69.2%).
| Industry | Male | Female |
| Agriculture, Fishing & Hunting | 37 (100.0%) | 0 (0.0%) |
| Mining, Quarrying, & Extraction | 9 (100.0%) | 0 (0.0%) |
| Construction | 222 (96.9%) | 7 (3.1%) |
| Manufacturing | 422 (68.5%) | 194 (31.5%) |
| Wholesale Trade | 8 (40.0%) | 12 (60.0%) |
| Retail Trade | 343 (46.2%) | 400 (53.8%) |
| Transportation & Warehousing | 115 (64.2%) | 64 (35.7%) |
| Utilities | 17 (100.0%) | 0 (0.0%) |
| Information | 55 (55.6%) | 44 (44.4%) |
| Finance & Insurance | 45 (26.2%) | 127 (73.8%) |
| Real Estate, Rental & Leasing | 28 (100.0%) | 0 (0.0%) |
| Professional & Scientific | 47 (31.8%) | 101 (68.2%) |
| Enterprise Management | 0 (0.0%) | 0 (0.0%) |
| Administrative & Support | 82 (82.0%) | 18 (18.0%) |
| Educational Services | 112 (31.4%) | 245 (68.6%) |
| Health Care & Social Assistance | 225 (25.3%) | 663 (74.7%) |
| Arts, Entertainment & Recreation | 8 (30.8%) | 18 (69.2%) |
| Accommodation & Food Services | 105 (53.3%) | 92 (46.7%) |
| Public Administration | 109 (43.8%) | 140 (56.2%) |
| Total | 2,043 (48.0%) | 2,215 (52.0%) |
Education in Athol
School Enrollment in Athol
The most common levels of schooling among the 2,103 students in Athol are high school (566 | 26.9%), middle school (468 | 22.3%), and college / undergraduate (410 | 19.5%).
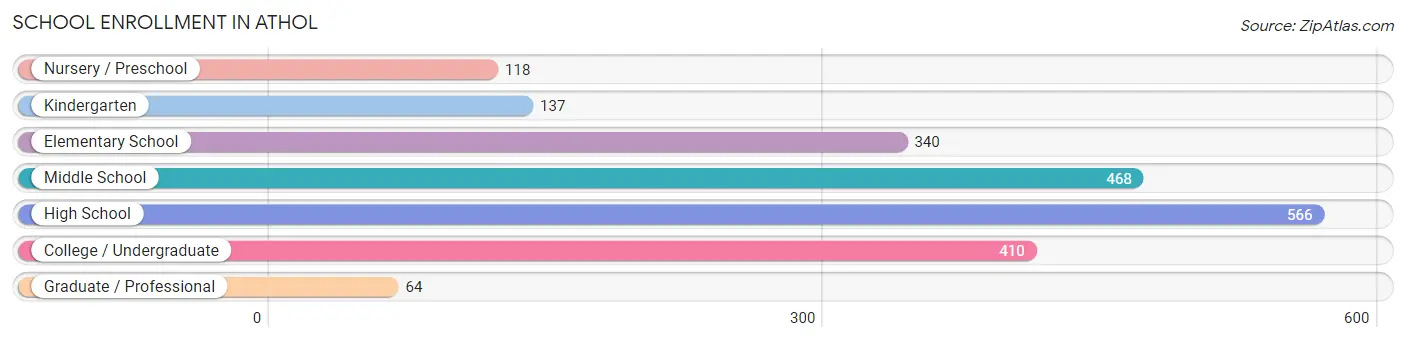
| School Level | # Students | % Students |
| Nursery / Preschool | 118 | 5.6% |
| Kindergarten | 137 | 6.5% |
| Elementary School | 340 | 16.2% |
| Middle School | 468 | 22.3% |
| High School | 566 | 26.9% |
| College / Undergraduate | 410 | 19.5% |
| Graduate / Professional | 64 | 3.0% |
| Total | 2,103 | 100.0% |
School Enrollment by Age by Funding Source in Athol
Out of a total of 2,103 students who are enrolled in schools in Athol, 318 (15.1%) attend a private institution, while the remaining 1,785 (84.9%) are enrolled in public schools. The age group of 20 to 24 year olds has the highest likelihood of being enrolled in private schools, with 70 (37.6% in the age bracket) enrolled. Conversely, the age group of 10 to 14 year olds has the lowest likelihood of being enrolled in a private school, with 591 (98.2% in the age bracket) attending a public institution.
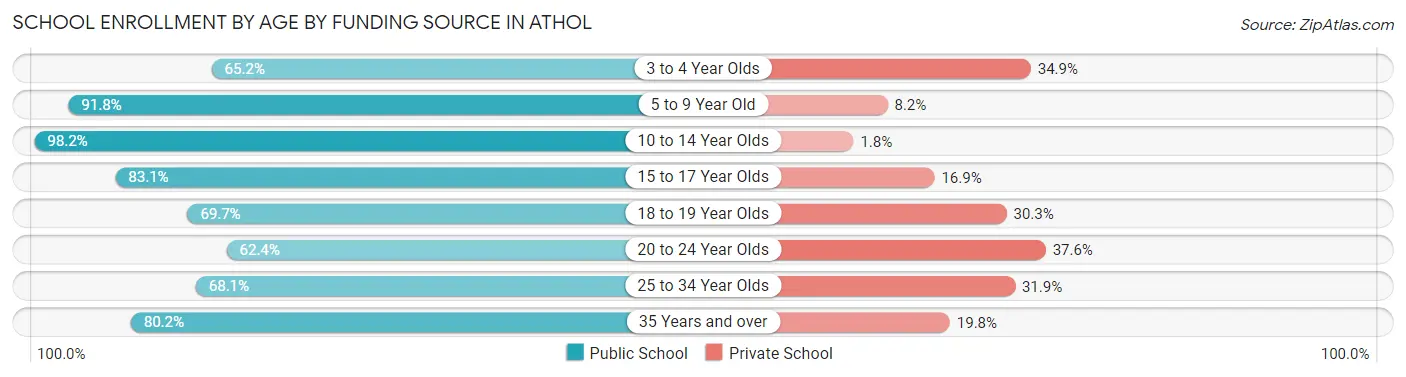
| Age Bracket | Public School | Private School |
| 3 to 4 Year Olds | 43 (65.1%) | 23 (34.8%) |
| 5 to 9 Year Old | 472 (91.8%) | 42 (8.2%) |
| 10 to 14 Year Olds | 591 (98.2%) | 11 (1.8%) |
| 15 to 17 Year Olds | 270 (83.1%) | 55 (16.9%) |
| 18 to 19 Year Olds | 124 (69.7%) | 54 (30.3%) |
| 20 to 24 Year Olds | 116 (62.4%) | 70 (37.6%) |
| 25 to 34 Year Olds | 96 (68.1%) | 45 (31.9%) |
| 35 Years and over | 73 (80.2%) | 18 (19.8%) |
| Total | 1,785 (84.9%) | 318 (15.1%) |
Educational Attainment by Field of Study in Athol
Business (308 | 23.1%), science & technology (247 | 18.5%), education (233 | 17.5%), arts & humanities (174 | 13.1%), and engineering (78 | 5.9%) are the most common fields of study among 1,332 individuals in Athol who have obtained a bachelor's degree or higher.
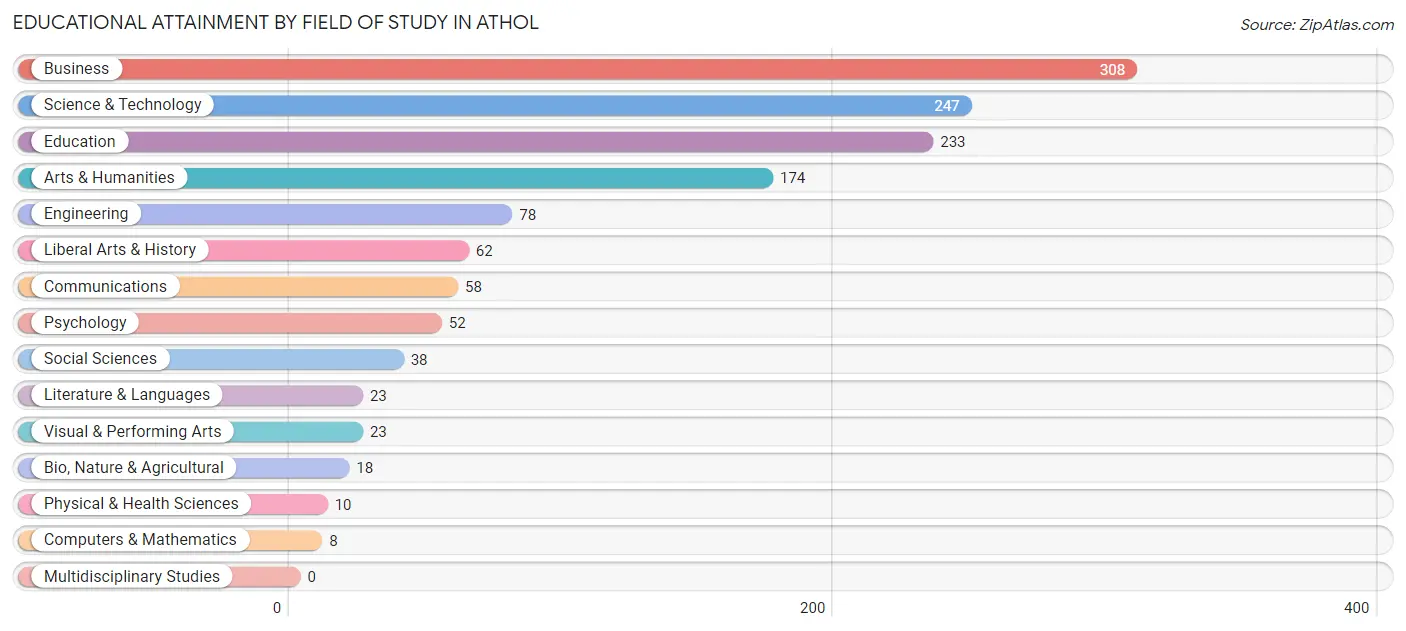
| Field of Study | # Graduates | % Graduates |
| Computers & Mathematics | 8 | 0.6% |
| Bio, Nature & Agricultural | 18 | 1.3% |
| Physical & Health Sciences | 10 | 0.7% |
| Psychology | 52 | 3.9% |
| Social Sciences | 38 | 2.9% |
| Engineering | 78 | 5.9% |
| Multidisciplinary Studies | 0 | 0.0% |
| Science & Technology | 247 | 18.5% |
| Business | 308 | 23.1% |
| Education | 233 | 17.5% |
| Literature & Languages | 23 | 1.7% |
| Liberal Arts & History | 62 | 4.6% |
| Visual & Performing Arts | 23 | 1.7% |
| Communications | 58 | 4.3% |
| Arts & Humanities | 174 | 13.1% |
| Total | 1,332 | 100.0% |
Transportation & Commute in Athol
Vehicle Availability by Sex in Athol
The most prevalent vehicle ownership categories in Athol are males with 2 vehicles (919, accounting for 46.9%) and females with 2 vehicles (843, making up 42.3%).
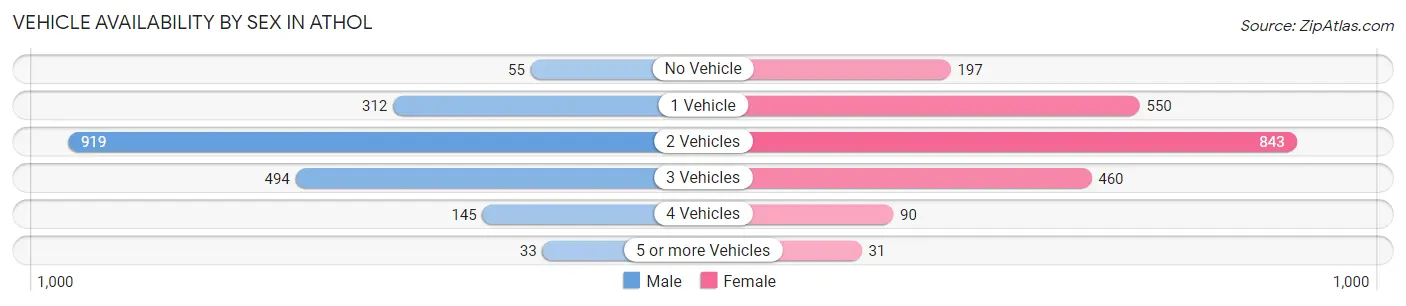
| Vehicles Available | Male | Female |
| No Vehicle | 55 (2.8%) | 197 (9.1%) |
| 1 Vehicle | 312 (15.9%) | 550 (25.3%) |
| 2 Vehicles | 919 (46.9%) | 843 (38.8%) |
| 3 Vehicles | 494 (25.2%) | 460 (21.2%) |
| 4 Vehicles | 145 (7.4%) | 90 (4.2%) |
| 5 or more Vehicles | 33 (1.7%) | 31 (1.4%) |
| Total | 1,958 (100.0%) | 2,171 (100.0%) |
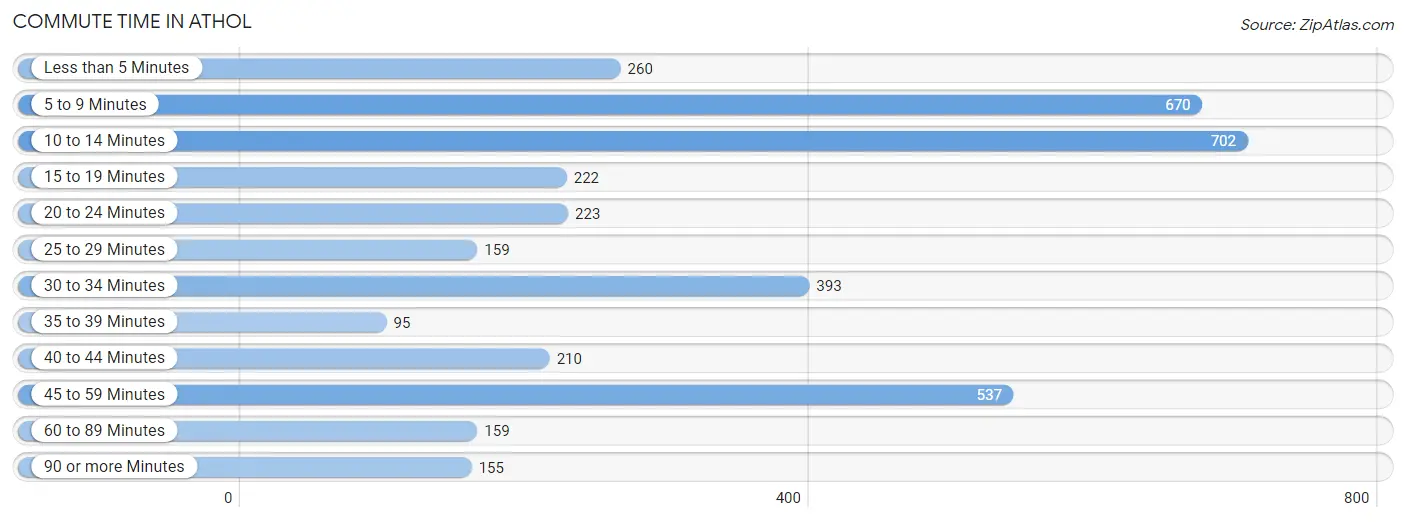
Commute Time in Athol
The most frequently occuring commute durations in Athol are 10 to 14 minutes (702 commuters, 18.5%), 5 to 9 minutes (670 commuters, 17.7%), and 45 to 59 minutes (537 commuters, 14.2%).
| Commute Time | # Commuters | % Commuters |
| Less than 5 Minutes | 260 | 6.9% |
| 5 to 9 Minutes | 670 | 17.7% |
| 10 to 14 Minutes | 702 | 18.5% |
| 15 to 19 Minutes | 222 | 5.9% |
| 20 to 24 Minutes | 223 | 5.9% |
| 25 to 29 Minutes | 159 | 4.2% |
| 30 to 34 Minutes | 393 | 10.4% |
| 35 to 39 Minutes | 95 | 2.5% |
| 40 to 44 Minutes | 210 | 5.6% |
| 45 to 59 Minutes | 537 | 14.2% |
| 60 to 89 Minutes | 159 | 4.2% |
| 90 or more Minutes | 155 | 4.1% |
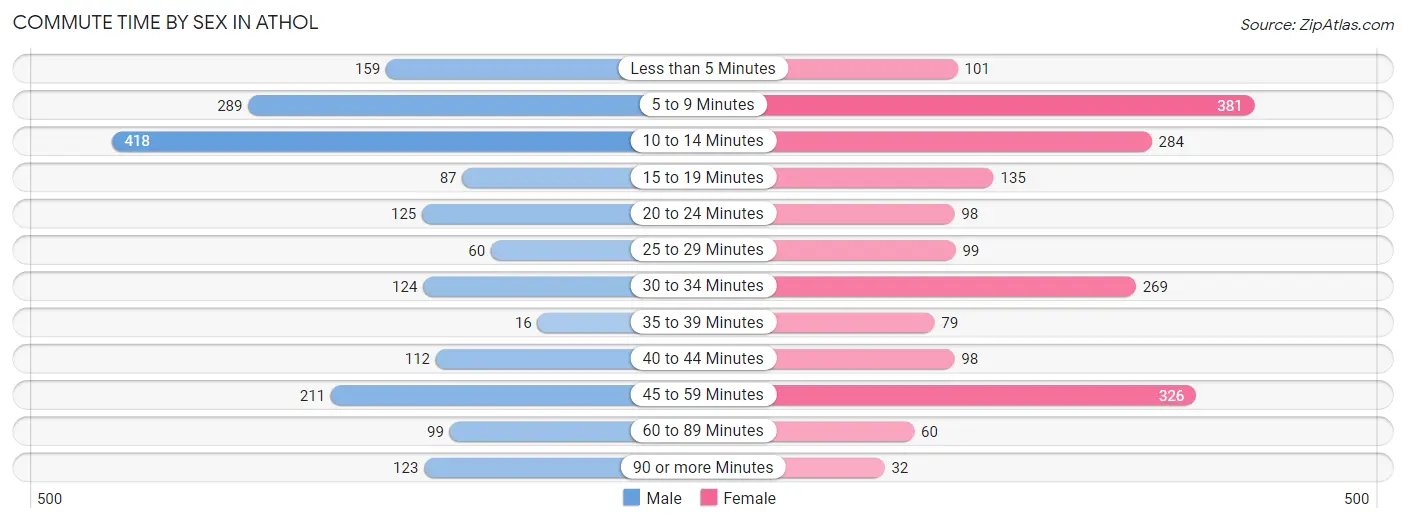
Commute Time by Sex in Athol
The most common commute times in Athol are 10 to 14 minutes (418 commuters, 22.9%) for males and 5 to 9 minutes (381 commuters, 19.4%) for females.
| Commute Time | Male | Female |
| Less than 5 Minutes | 159 (8.7%) | 101 (5.1%) |
| 5 to 9 Minutes | 289 (15.9%) | 381 (19.4%) |
| 10 to 14 Minutes | 418 (22.9%) | 284 (14.5%) |
| 15 to 19 Minutes | 87 (4.8%) | 135 (6.9%) |
| 20 to 24 Minutes | 125 (6.9%) | 98 (5.0%) |
| 25 to 29 Minutes | 60 (3.3%) | 99 (5.1%) |
| 30 to 34 Minutes | 124 (6.8%) | 269 (13.7%) |
| 35 to 39 Minutes | 16 (0.9%) | 79 (4.0%) |
| 40 to 44 Minutes | 112 (6.1%) | 98 (5.0%) |
| 45 to 59 Minutes | 211 (11.6%) | 326 (16.6%) |
| 60 to 89 Minutes | 99 (5.4%) | 60 (3.1%) |
| 90 or more Minutes | 123 (6.8%) | 32 (1.6%) |
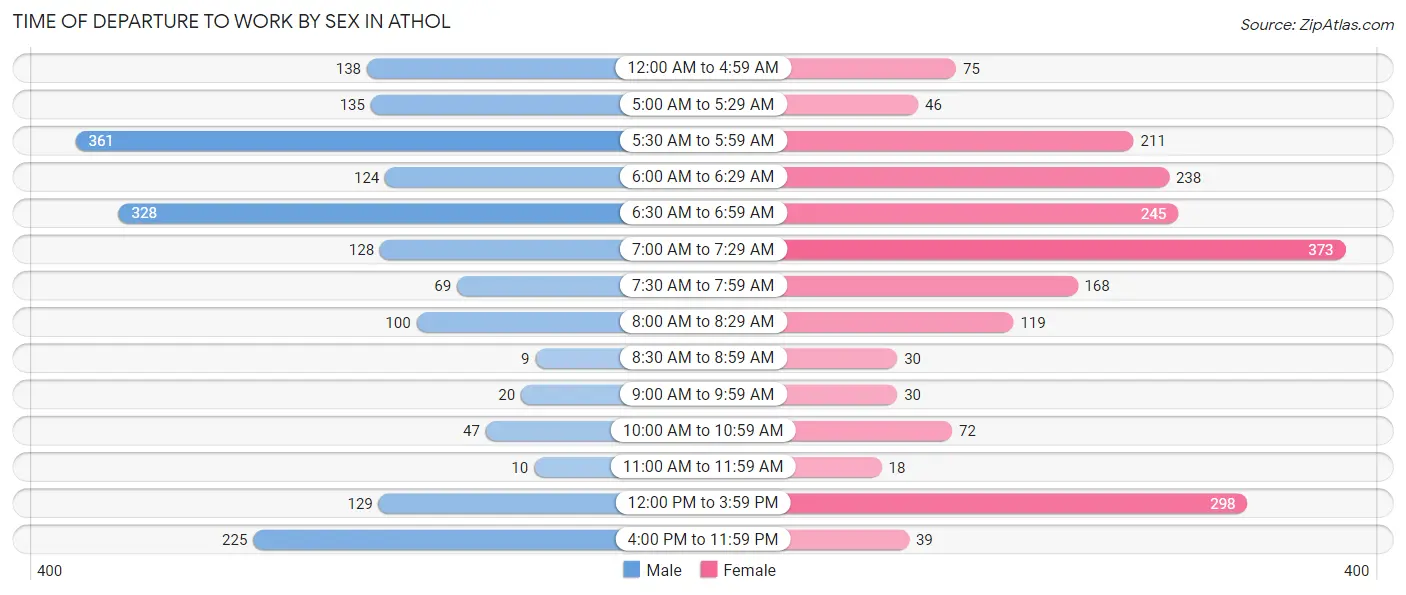
Time of Departure to Work by Sex in Athol
The most frequent times of departure to work in Athol are 5:30 AM to 5:59 AM (361, 19.8%) for males and 7:00 AM to 7:29 AM (373, 19.0%) for females.
| Time of Departure | Male | Female |
| 12:00 AM to 4:59 AM | 138 (7.6%) | 75 (3.8%) |
| 5:00 AM to 5:29 AM | 135 (7.4%) | 46 (2.3%) |
| 5:30 AM to 5:59 AM | 361 (19.8%) | 211 (10.7%) |
| 6:00 AM to 6:29 AM | 124 (6.8%) | 238 (12.1%) |
| 6:30 AM to 6:59 AM | 328 (18.0%) | 245 (12.5%) |
| 7:00 AM to 7:29 AM | 128 (7.0%) | 373 (19.0%) |
| 7:30 AM to 7:59 AM | 69 (3.8%) | 168 (8.6%) |
| 8:00 AM to 8:29 AM | 100 (5.5%) | 119 (6.1%) |
| 8:30 AM to 8:59 AM | 9 (0.5%) | 30 (1.5%) |
| 9:00 AM to 9:59 AM | 20 (1.1%) | 30 (1.5%) |
| 10:00 AM to 10:59 AM | 47 (2.6%) | 72 (3.7%) |
| 11:00 AM to 11:59 AM | 10 (0.5%) | 18 (0.9%) |
| 12:00 PM to 3:59 PM | 129 (7.1%) | 298 (15.2%) |
| 4:00 PM to 11:59 PM | 225 (12.3%) | 39 (2.0%) |
| Total | 1,823 (100.0%) | 1,962 (100.0%) |
Housing Occupancy in Athol
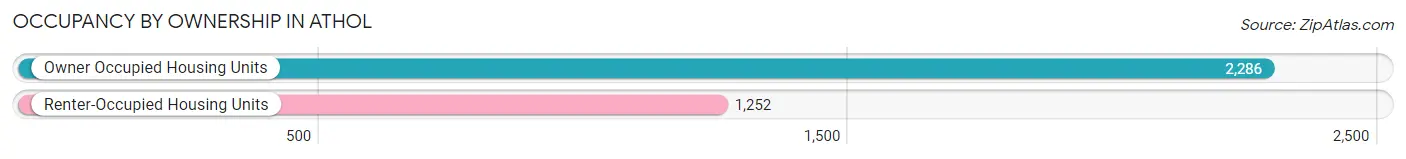
Occupancy by Ownership in Athol
Of the total 3,538 dwellings in Athol, owner-occupied units account for 2,286 (64.6%), while renter-occupied units make up 1,252 (35.4%).
| Occupancy | # Housing Units | % Housing Units |
| Owner Occupied Housing Units | 2,286 | 64.6% |
| Renter-Occupied Housing Units | 1,252 | 35.4% |
| Total Occupied Housing Units | 3,538 | 100.0% |
Occupancy by Household Size in Athol
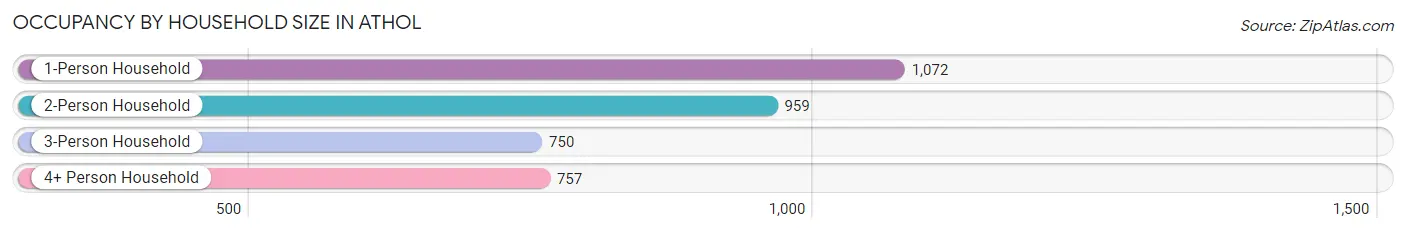
| Household Size | # Housing Units | % Housing Units |
| 1-Person Household | 1,072 | 30.3% |
| 2-Person Household | 959 | 27.1% |
| 3-Person Household | 750 | 21.2% |
| 4+ Person Household | 757 | 21.4% |
| Total Housing Units | 3,538 | 100.0% |
Occupancy by Ownership by Household Size in Athol
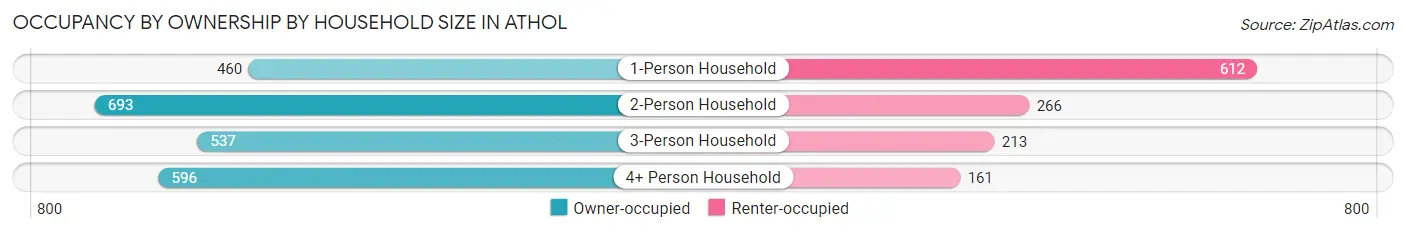
| Household Size | Owner-occupied | Renter-occupied |
| 1-Person Household | 460 (42.9%) | 612 (57.1%) |
| 2-Person Household | 693 (72.3%) | 266 (27.7%) |
| 3-Person Household | 537 (71.6%) | 213 (28.4%) |
| 4+ Person Household | 596 (78.7%) | 161 (21.3%) |
| Total Housing Units | 2,286 (64.6%) | 1,252 (35.4%) |
Occupancy by Educational Attainment in Athol
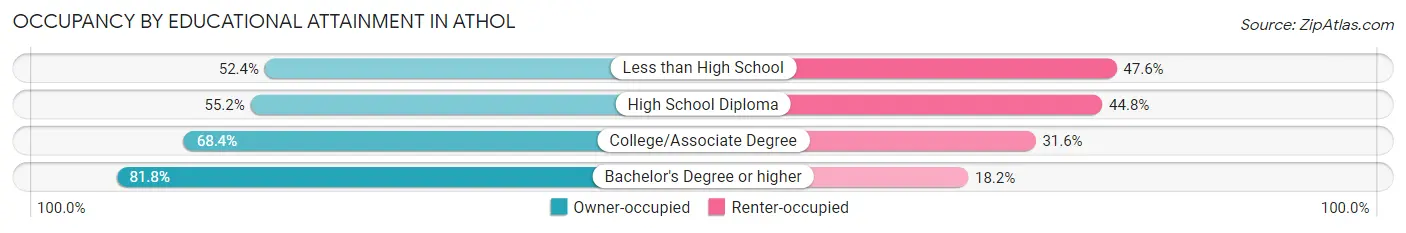
| Household Size | Owner-occupied | Renter-occupied |
| Less than High School | 177 (52.4%) | 161 (47.6%) |
| High School Diploma | 706 (55.2%) | 573 (44.8%) |
| College/Associate Degree | 860 (68.4%) | 397 (31.6%) |
| Bachelor's Degree or higher | 543 (81.8%) | 121 (18.2%) |
Occupancy by Age of Householder in Athol
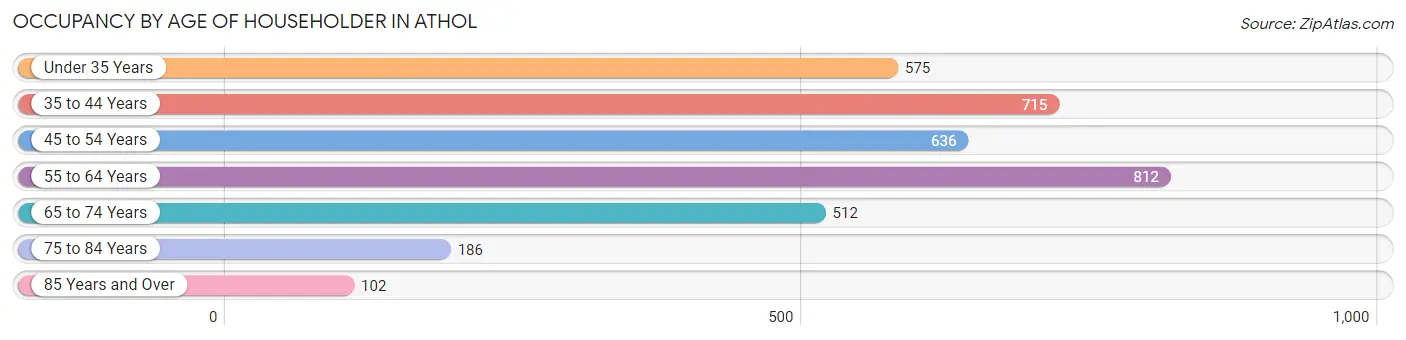
| Age Bracket | # Households | % Households |
| Under 35 Years | 575 | 16.3% |
| 35 to 44 Years | 715 | 20.2% |
| 45 to 54 Years | 636 | 18.0% |
| 55 to 64 Years | 812 | 23.0% |
| 65 to 74 Years | 512 | 14.5% |
| 75 to 84 Years | 186 | 5.3% |
| 85 Years and Over | 102 | 2.9% |
| Total | 3,538 | 100.0% |
Housing Finances in Athol
Median Income by Occupancy in Athol
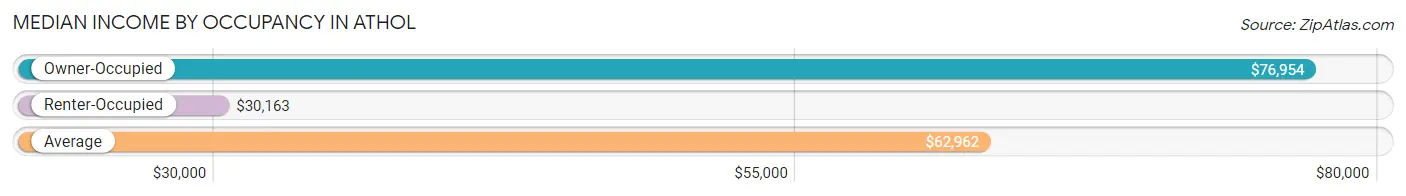
| Occupancy Type | # Households | Median Income |
| Owner-Occupied | 2,286 (64.6%) | $76,954 |
| Renter-Occupied | 1,252 (35.4%) | $30,163 |
| Average | 3,538 (100.0%) | $62,962 |
Occupancy by Householder Income Bracket in Athol
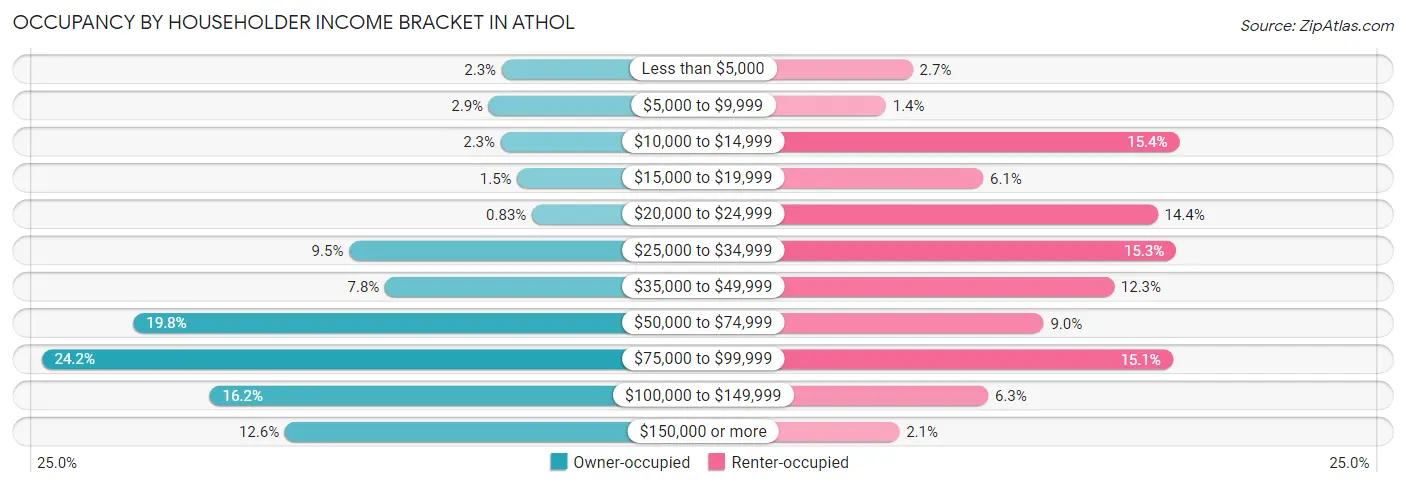
| Income Bracket | Owner-occupied | Renter-occupied |
| Less than $5,000 | 52 (2.3%) | 34 (2.7%) |
| $5,000 to $9,999 | 66 (2.9%) | 18 (1.4%) |
| $10,000 to $14,999 | 53 (2.3%) | 193 (15.4%) |
| $15,000 to $19,999 | 35 (1.5%) | 76 (6.1%) |
| $20,000 to $24,999 | 19 (0.8%) | 180 (14.4%) |
| $25,000 to $34,999 | 218 (9.5%) | 191 (15.3%) |
| $35,000 to $49,999 | 179 (7.8%) | 154 (12.3%) |
| $50,000 to $74,999 | 453 (19.8%) | 112 (8.9%) |
| $75,000 to $99,999 | 553 (24.2%) | 189 (15.1%) |
| $100,000 to $149,999 | 370 (16.2%) | 79 (6.3%) |
| $150,000 or more | 288 (12.6%) | 26 (2.1%) |
| Total | 2,286 (100.0%) | 1,252 (100.0%) |
Monthly Housing Cost Tiers in Athol
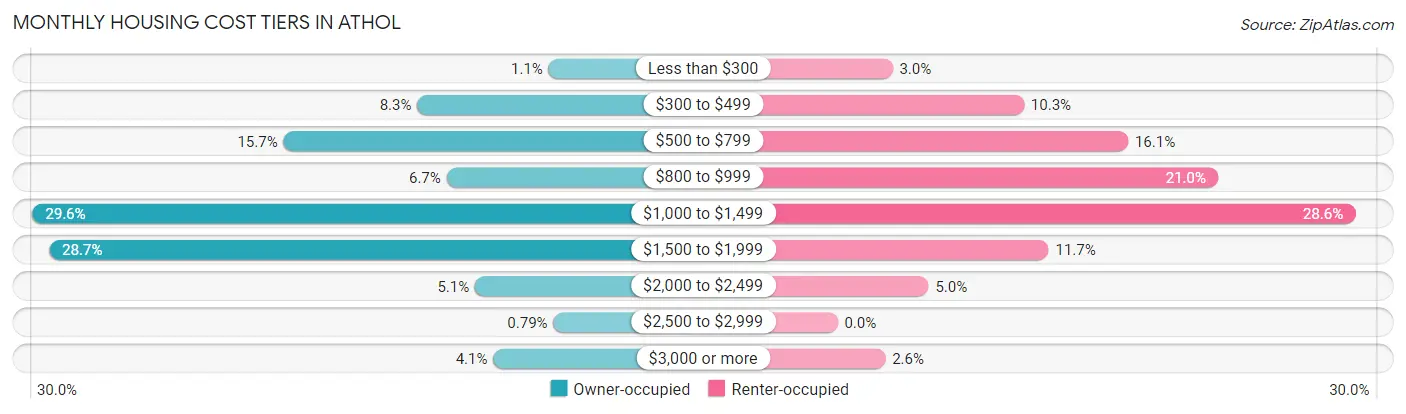
| Monthly Cost | Owner-occupied | Renter-occupied |
| Less than $300 | 24 (1.1%) | 38 (3.0%) |
| $300 to $499 | 190 (8.3%) | 129 (10.3%) |
| $500 to $799 | 359 (15.7%) | 201 (16.1%) |
| $800 to $999 | 153 (6.7%) | 263 (21.0%) |
| $1,000 to $1,499 | 676 (29.6%) | 358 (28.6%) |
| $1,500 to $1,999 | 655 (28.6%) | 146 (11.7%) |
| $2,000 to $2,499 | 117 (5.1%) | 63 (5.0%) |
| $2,500 to $2,999 | 18 (0.8%) | 0 (0.0%) |
| $3,000 or more | 94 (4.1%) | 33 (2.6%) |
| Total | 2,286 (100.0%) | 1,252 (100.0%) |
Physical Housing Characteristics in Athol
Housing Structures in Athol
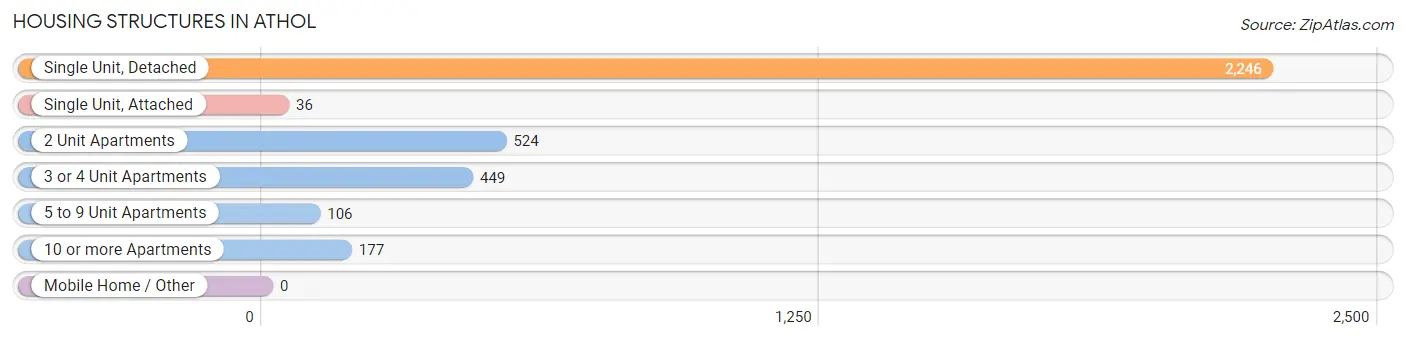
| Structure Type | # Housing Units | % Housing Units |
| Single Unit, Detached | 2,246 | 63.5% |
| Single Unit, Attached | 36 | 1.0% |
| 2 Unit Apartments | 524 | 14.8% |
| 3 or 4 Unit Apartments | 449 | 12.7% |
| 5 to 9 Unit Apartments | 106 | 3.0% |
| 10 or more Apartments | 177 | 5.0% |
| Mobile Home / Other | 0 | 0.0% |
| Total | 3,538 | 100.0% |
Housing Structures by Occupancy in Athol
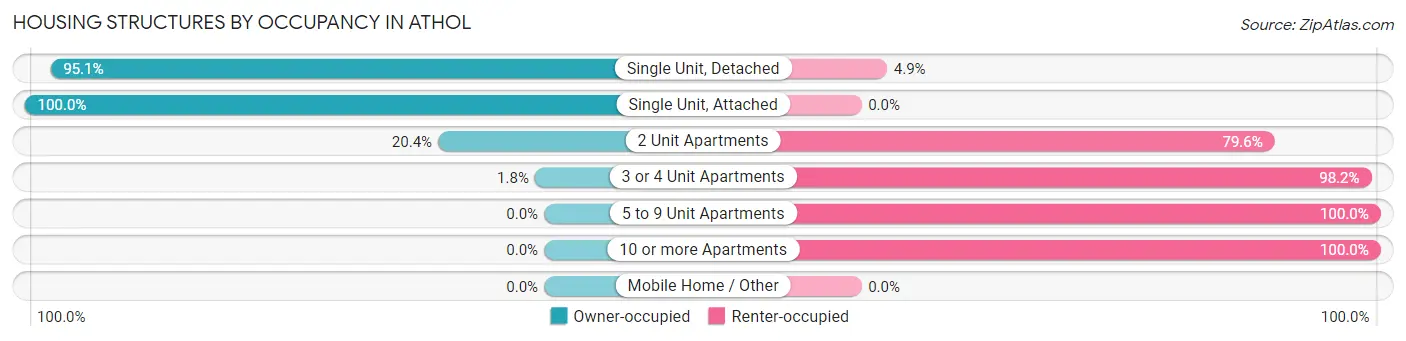
| Structure Type | Owner-occupied | Renter-occupied |
| Single Unit, Detached | 2,135 (95.1%) | 111 (4.9%) |
| Single Unit, Attached | 36 (100.0%) | 0 (0.0%) |
| 2 Unit Apartments | 107 (20.4%) | 417 (79.6%) |
| 3 or 4 Unit Apartments | 8 (1.8%) | 441 (98.2%) |
| 5 to 9 Unit Apartments | 0 (0.0%) | 106 (100.0%) |
| 10 or more Apartments | 0 (0.0%) | 177 (100.0%) |
| Mobile Home / Other | 0 (0.0%) | 0 (0.0%) |
| Total | 2,286 (64.6%) | 1,252 (35.4%) |
Housing Structures by Number of Rooms in Athol
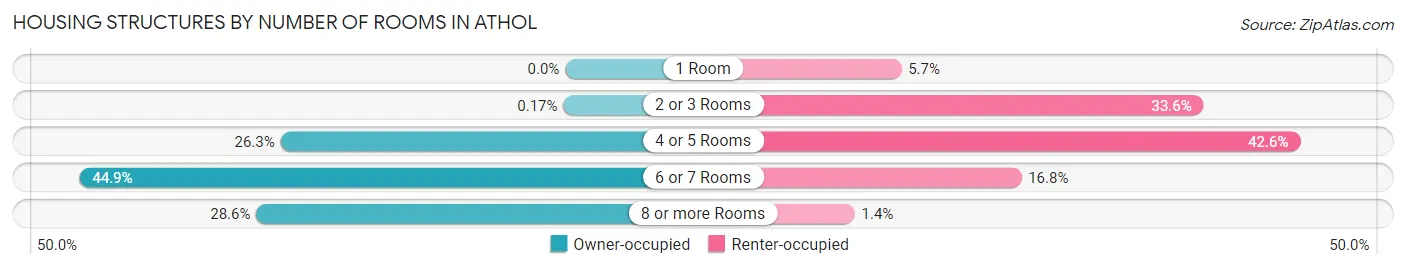
| Number of Rooms | Owner-occupied | Renter-occupied |
| 1 Room | 0 (0.0%) | 71 (5.7%) |
| 2 or 3 Rooms | 4 (0.2%) | 421 (33.6%) |
| 4 or 5 Rooms | 602 (26.3%) | 533 (42.6%) |
| 6 or 7 Rooms | 1,027 (44.9%) | 210 (16.8%) |
| 8 or more Rooms | 653 (28.6%) | 17 (1.4%) |
| Total | 2,286 (100.0%) | 1,252 (100.0%) |
Housing Structure by Heating Type in Athol
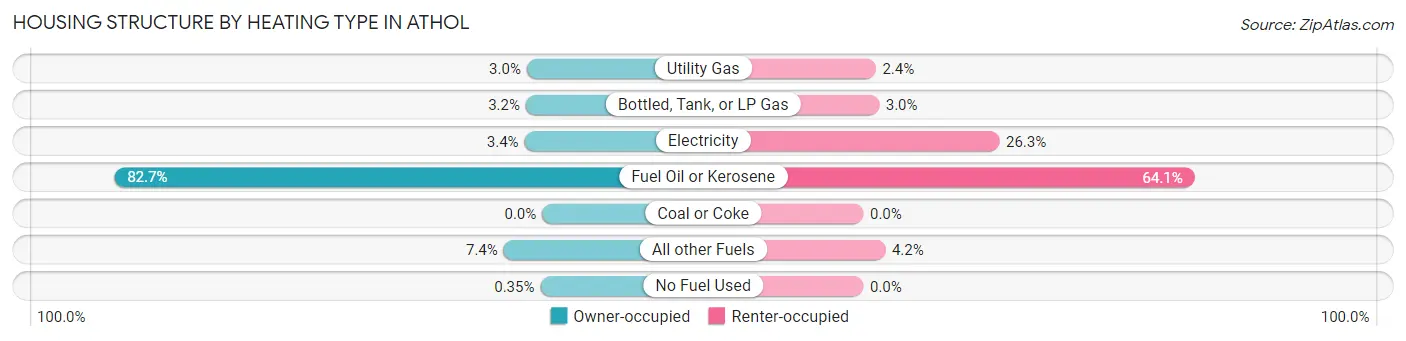
| Heating Type | Owner-occupied | Renter-occupied |
| Utility Gas | 68 (3.0%) | 30 (2.4%) |
| Bottled, Tank, or LP Gas | 72 (3.2%) | 38 (3.0%) |
| Electricity | 78 (3.4%) | 329 (26.3%) |
| Fuel Oil or Kerosene | 1,890 (82.7%) | 802 (64.1%) |
| Coal or Coke | 0 (0.0%) | 0 (0.0%) |
| All other Fuels | 170 (7.4%) | 53 (4.2%) |
| No Fuel Used | 8 (0.4%) | 0 (0.0%) |
| Total | 2,286 (100.0%) | 1,252 (100.0%) |
Household Vehicle Usage in Athol
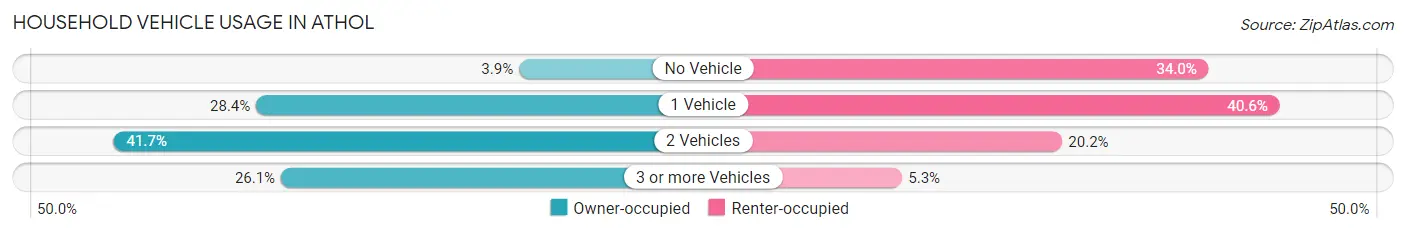
| Vehicles per Household | Owner-occupied | Renter-occupied |
| No Vehicle | 88 (3.8%) | 425 (34.0%) |
| 1 Vehicle | 649 (28.4%) | 508 (40.6%) |
| 2 Vehicles | 953 (41.7%) | 253 (20.2%) |
| 3 or more Vehicles | 596 (26.1%) | 66 (5.3%) |
| Total | 2,286 (100.0%) | 1,252 (100.0%) |
Real Estate & Mortgages in Athol
Real Estate and Mortgage Overview in Athol
| Characteristic | Without Mortgage | With Mortgage |
| Housing Units | 665 | 1,621 |
| Median Property Value | $192,600 | $214,700 |
| Median Household Income | $57,386 | $260 |
| Monthly Housing Costs | $597 | $94 |
| Real Estate Taxes | $2,753 | $0 |
Property Value by Mortgage Status in Athol
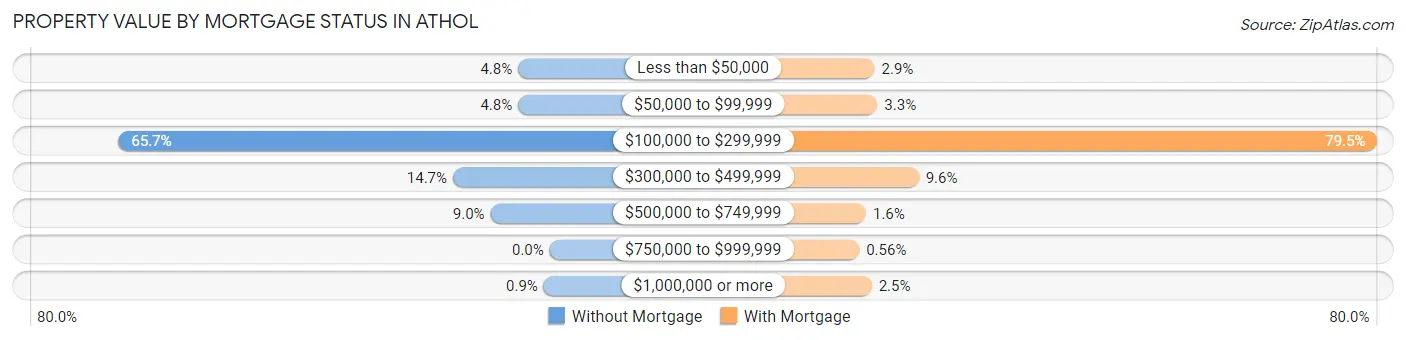
| Property Value | Without Mortgage | With Mortgage |
| Less than $50,000 | 32 (4.8%) | 47 (2.9%) |
| $50,000 to $99,999 | 32 (4.8%) | 54 (3.3%) |
| $100,000 to $299,999 | 437 (65.7%) | 1,289 (79.5%) |
| $300,000 to $499,999 | 98 (14.7%) | 156 (9.6%) |
| $500,000 to $749,999 | 60 (9.0%) | 26 (1.6%) |
| $750,000 to $999,999 | 0 (0.0%) | 9 (0.6%) |
| $1,000,000 or more | 6 (0.9%) | 40 (2.5%) |
| Total | 665 (100.0%) | 1,621 (100.0%) |
Household Income by Mortgage Status in Athol
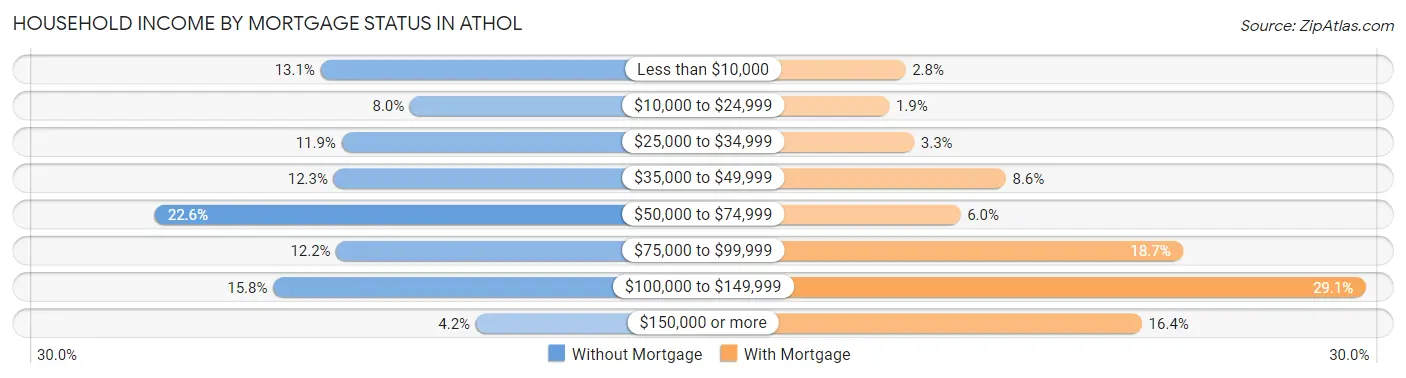
| Household Income | Without Mortgage | With Mortgage |
| Less than $10,000 | 87 (13.1%) | 46 (2.8%) |
| $10,000 to $24,999 | 53 (8.0%) | 31 (1.9%) |
| $25,000 to $34,999 | 79 (11.9%) | 54 (3.3%) |
| $35,000 to $49,999 | 82 (12.3%) | 139 (8.6%) |
| $50,000 to $74,999 | 150 (22.6%) | 97 (6.0%) |
| $75,000 to $99,999 | 81 (12.2%) | 303 (18.7%) |
| $100,000 to $149,999 | 105 (15.8%) | 472 (29.1%) |
| $150,000 or more | 28 (4.2%) | 265 (16.4%) |
| Total | 665 (100.0%) | 1,621 (100.0%) |
Property Value to Household Income Ratio in Athol
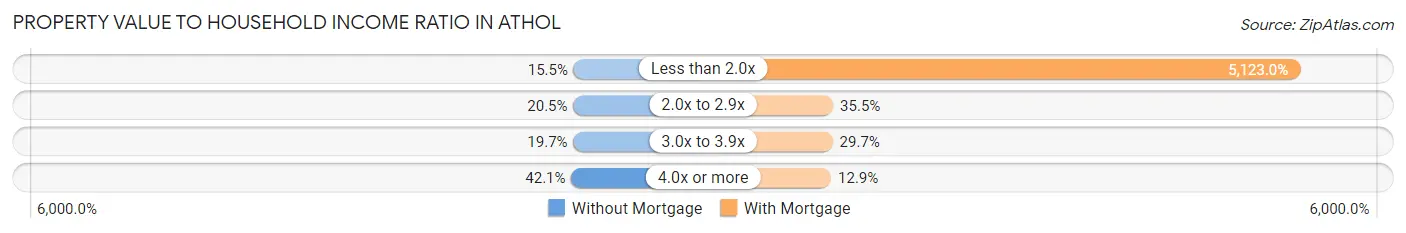
| Value-to-Income Ratio | Without Mortgage | With Mortgage |
| Less than 2.0x | 103 (15.5%) | 83,043 (5,123.0%) |
| 2.0x to 2.9x | 136 (20.4%) | 576 (35.5%) |
| 3.0x to 3.9x | 131 (19.7%) | 482 (29.7%) |
| 4.0x or more | 280 (42.1%) | 209 (12.9%) |
| Total | 665 (100.0%) | 1,621 (100.0%) |
Real Estate Taxes by Mortgage Status in Athol
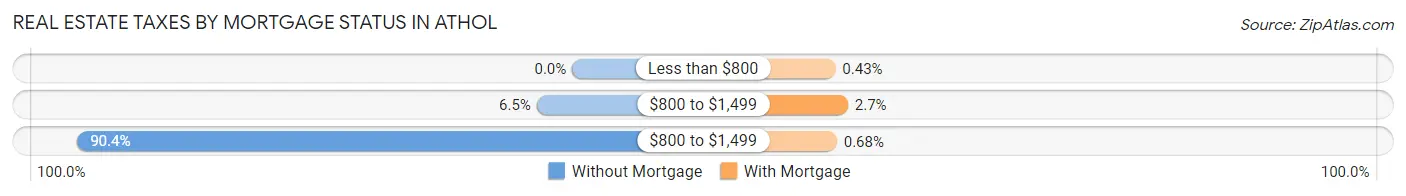
| Property Taxes | Without Mortgage | With Mortgage |
| Less than $800 | 0 (0.0%) | 7 (0.4%) |
| $800 to $1,499 | 43 (6.5%) | 44 (2.7%) |
| $800 to $1,499 | 601 (90.4%) | 11 (0.7%) |
| Total | 665 (100.0%) | 1,621 (100.0%) |
Health & Disability in Athol
Health Insurance Coverage by Age in Athol
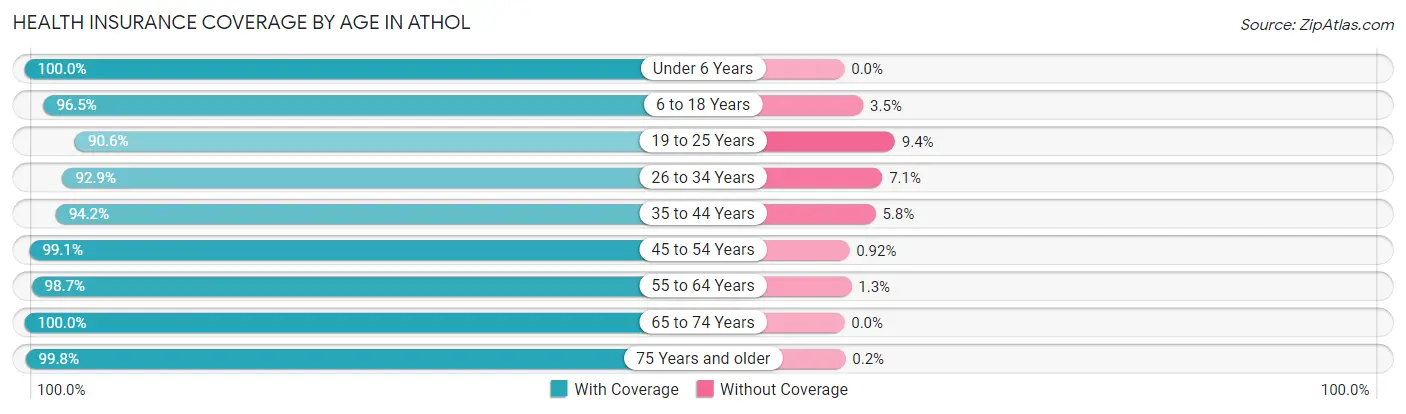
| Age Bracket | With Coverage | Without Coverage |
| Under 6 Years | 790 (100.0%) | 0 (0.0%) |
| 6 to 18 Years | 1,481 (96.5%) | 54 (3.5%) |
| 19 to 25 Years | 615 (90.6%) | 64 (9.4%) |
| 26 to 34 Years | 1,143 (92.9%) | 87 (7.1%) |
| 35 to 44 Years | 1,069 (94.2%) | 66 (5.8%) |
| 45 to 54 Years | 1,188 (99.1%) | 11 (0.9%) |
| 55 to 64 Years | 1,267 (98.7%) | 17 (1.3%) |
| 65 to 74 Years | 797 (100.0%) | 0 (0.0%) |
| 75 Years and older | 498 (99.8%) | 1 (0.2%) |
| Total | 8,848 (96.7%) | 300 (3.3%) |
Health Insurance Coverage by Citizenship Status in Athol
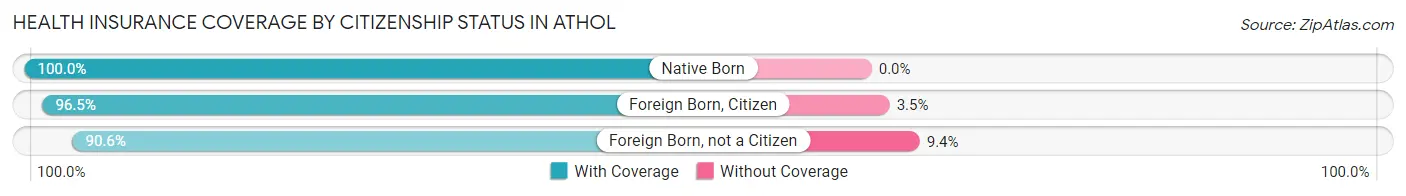
| Citizenship Status | With Coverage | Without Coverage |
| Native Born | 790 (100.0%) | 0 (0.0%) |
| Foreign Born, Citizen | 1,481 (96.5%) | 54 (3.5%) |
| Foreign Born, not a Citizen | 615 (90.6%) | 64 (9.4%) |
Health Insurance Coverage by Household Income in Athol
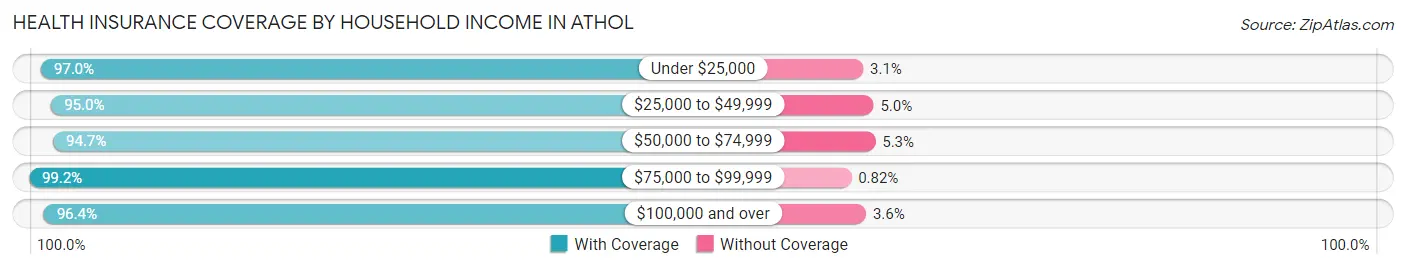
| Household Income | With Coverage | Without Coverage |
| Under $25,000 | 1,018 (97.0%) | 32 (3.0%) |
| $25,000 to $49,999 | 1,368 (95.0%) | 72 (5.0%) |
| $50,000 to $74,999 | 1,417 (94.7%) | 80 (5.3%) |
| $75,000 to $99,999 | 2,539 (99.2%) | 21 (0.8%) |
| $100,000 and over | 2,495 (96.4%) | 93 (3.6%) |
Public vs Private Health Insurance Coverage by Age in Athol
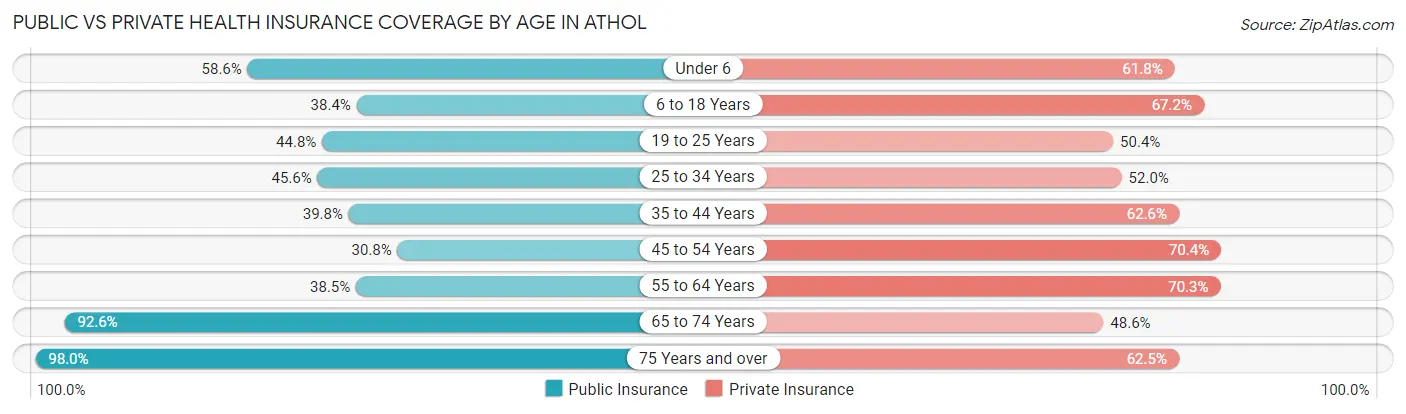
| Age Bracket | Public Insurance | Private Insurance |
| Under 6 | 463 (58.6%) | 488 (61.8%) |
| 6 to 18 Years | 589 (38.4%) | 1,031 (67.2%) |
| 19 to 25 Years | 304 (44.8%) | 342 (50.4%) |
| 25 to 34 Years | 561 (45.6%) | 639 (51.9%) |
| 35 to 44 Years | 452 (39.8%) | 710 (62.6%) |
| 45 to 54 Years | 369 (30.8%) | 844 (70.4%) |
| 55 to 64 Years | 494 (38.5%) | 902 (70.3%) |
| 65 to 74 Years | 738 (92.6%) | 387 (48.6%) |
| 75 Years and over | 489 (98.0%) | 312 (62.5%) |
| Total | 4,459 (48.7%) | 5,655 (61.8%) |
Disability Status by Sex by Age in Athol
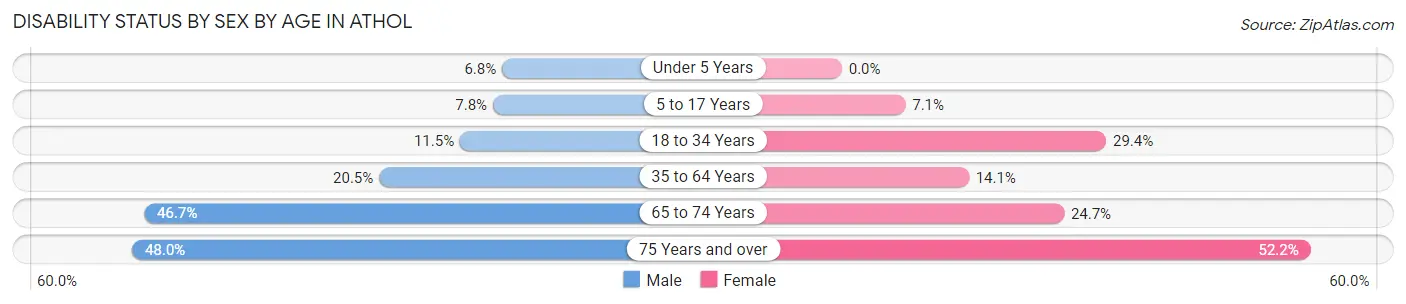
| Age Bracket | Male | Female |
| Under 5 Years | 20 (6.8%) | 0 (0.0%) |
| 5 to 17 Years | 65 (7.8%) | 55 (7.1%) |
| 18 to 34 Years | 122 (11.5%) | 302 (29.4%) |
| 35 to 64 Years | 372 (20.5%) | 255 (14.1%) |
| 65 to 74 Years | 191 (46.7%) | 96 (24.7%) |
| 75 Years and over | 98 (48.0%) | 154 (52.2%) |
Disability Class by Sex by Age in Athol
Disability Class: Hearing Difficulty
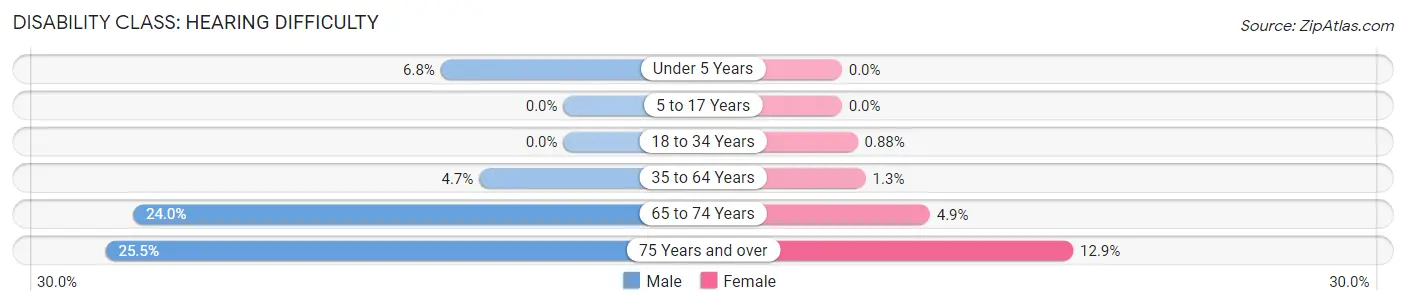
| Age Bracket | Male | Female |
| Under 5 Years | 20 (6.8%) | 0 (0.0%) |
| 5 to 17 Years | 0 (0.0%) | 0 (0.0%) |
| 18 to 34 Years | 0 (0.0%) | 9 (0.9%) |
| 35 to 64 Years | 85 (4.7%) | 24 (1.3%) |
| 65 to 74 Years | 98 (24.0%) | 19 (4.9%) |
| 75 Years and over | 52 (25.5%) | 38 (12.9%) |
Disability Class: Vision Difficulty
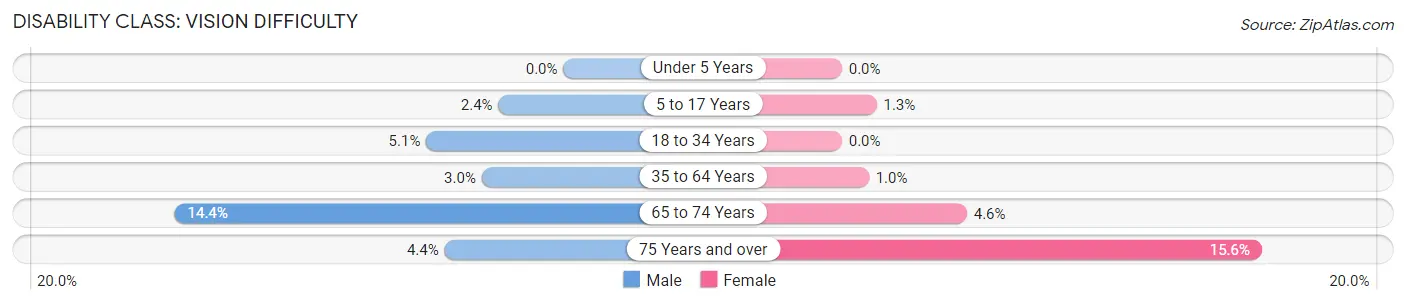
| Age Bracket | Male | Female |
| Under 5 Years | 0 (0.0%) | 0 (0.0%) |
| 5 to 17 Years | 20 (2.4%) | 10 (1.3%) |
| 18 to 34 Years | 54 (5.1%) | 0 (0.0%) |
| 35 to 64 Years | 55 (3.0%) | 18 (1.0%) |
| 65 to 74 Years | 59 (14.4%) | 18 (4.6%) |
| 75 Years and over | 9 (4.4%) | 46 (15.6%) |
Disability Class: Cognitive Difficulty
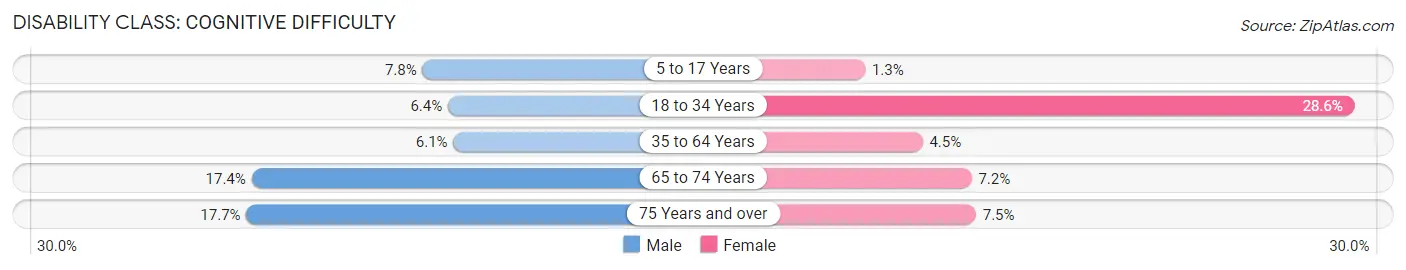
| Age Bracket | Male | Female |
| 5 to 17 Years | 65 (7.8%) | 10 (1.3%) |
| 18 to 34 Years | 68 (6.4%) | 293 (28.6%) |
| 35 to 64 Years | 111 (6.1%) | 81 (4.5%) |
| 65 to 74 Years | 71 (17.4%) | 28 (7.2%) |
| 75 Years and over | 36 (17.6%) | 22 (7.5%) |
Disability Class: Ambulatory Difficulty
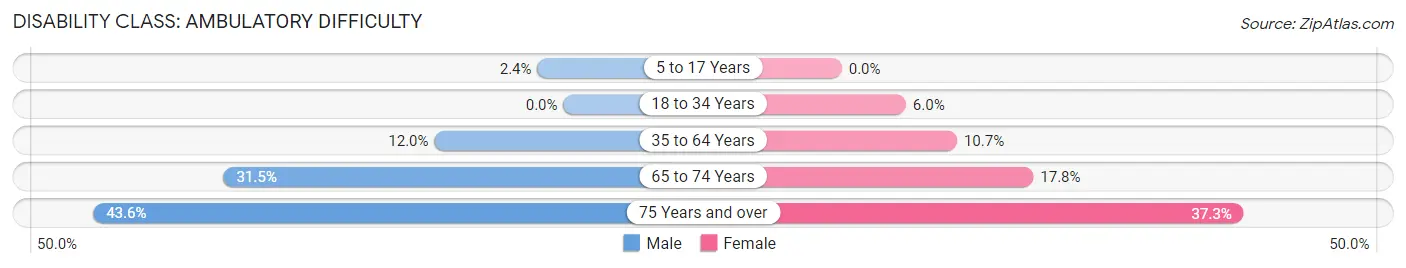
| Age Bracket | Male | Female |
| 5 to 17 Years | 20 (2.4%) | 0 (0.0%) |
| 18 to 34 Years | 0 (0.0%) | 61 (5.9%) |
| 35 to 64 Years | 217 (12.0%) | 193 (10.7%) |
| 65 to 74 Years | 129 (31.5%) | 69 (17.8%) |
| 75 Years and over | 89 (43.6%) | 110 (37.3%) |
Disability Class: Self-Care Difficulty
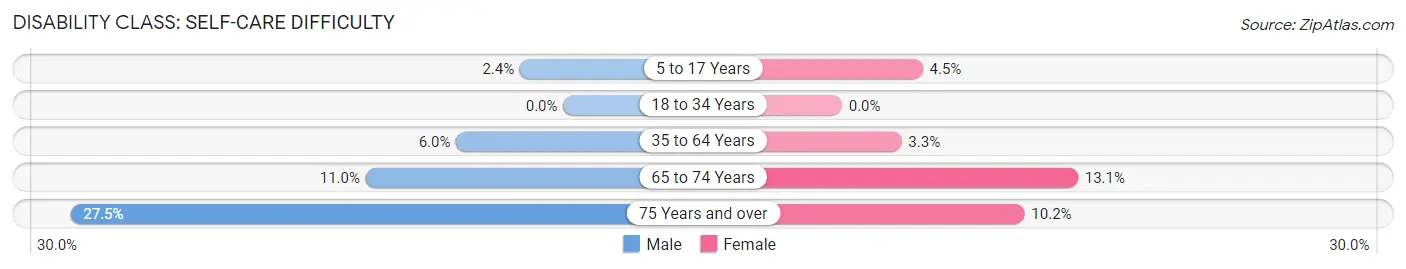
| Age Bracket | Male | Female |
| 5 to 17 Years | 20 (2.4%) | 35 (4.5%) |
| 18 to 34 Years | 0 (0.0%) | 0 (0.0%) |
| 35 to 64 Years | 108 (6.0%) | 60 (3.3%) |
| 65 to 74 Years | 45 (11.0%) | 51 (13.1%) |
| 75 Years and over | 56 (27.5%) | 30 (10.2%) |
Technology Access in Athol
Computing Device Access in Athol
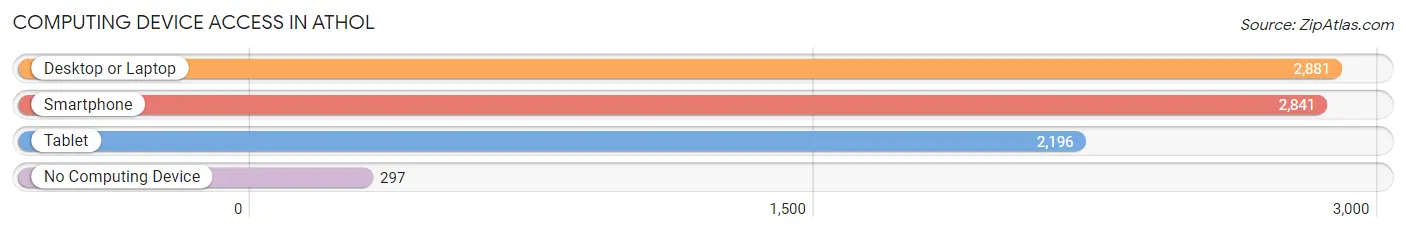
| Device Type | # Households | % Households |
| Desktop or Laptop | 2,881 | 81.4% |
| Smartphone | 2,841 | 80.3% |
| Tablet | 2,196 | 62.1% |
| No Computing Device | 297 | 8.4% |
| Total | 3,538 | 100.0% |
Internet Access in Athol
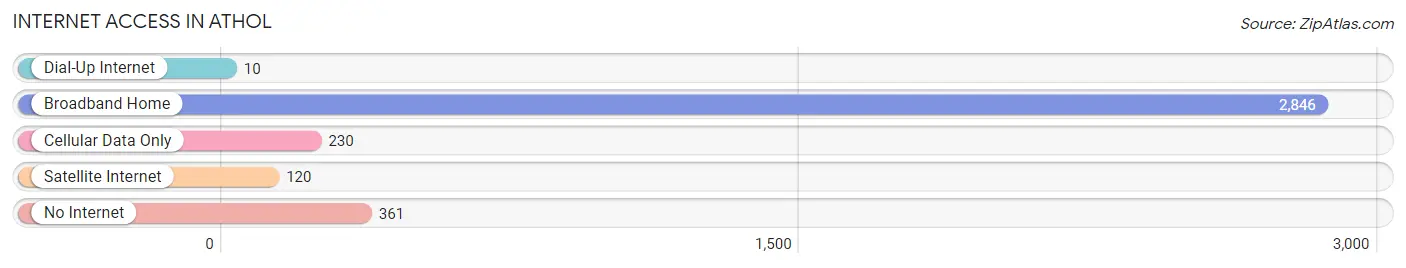
| Internet Type | # Households | % Households |
| Dial-Up Internet | 10 | 0.3% |
| Broadband Home | 2,846 | 80.4% |
| Cellular Data Only | 230 | 6.5% |
| Satellite Internet | 120 | 3.4% |
| No Internet | 361 | 10.2% |
| Total | 3,538 | 100.0% |
Athol Summary
Athol is a town located in Worcester County, Massachusetts, United States. It is situated in the north-central part of the state, about 25 miles northwest of Worcester and 40 miles west of Boston. The population was 11,584 at the 2010 census.
History
The area that is now Athol was originally inhabited by the Nipmuc people, who were part of the Algonquian language family. The area was first settled by Europeans in 1735, when the town of Orange was established. The town was incorporated in 1762 and was named after the Earl of Atholl, a Scottish nobleman.
In the 19th century, Athol was an important industrial center, with several mills and factories located along the Millers River. The town was also home to several quarries, which provided stone for many of the buildings in the area.
Geography
Athol is located at 42°34′N 72°14′W (42.567, -72.233). According to the United States Census Bureau, the town has a total area of 24.2 square miles (62.7 km2), of which 23.9 square miles (61.8 km2) is land and 0.3 square miles (0.8 km2) (1.17%) is water.
The town is located in the north-central part of the state, about 25 miles northwest of Worcester and 40 miles west of Boston. It is bordered by the towns of Royalston to the north, Orange to the east, Petersham to the south, and Phillipston to the west.
Economy
Athol is a small town with a population of 11,584 as of the 2010 census. The town is home to several small businesses, including a few restaurants, a grocery store, and a few retail stores. The town is also home to several manufacturing companies, including a paper mill, a plastics manufacturer, and a machine shop.
The town is also home to several small farms, which produce a variety of fruits and vegetables. The town is also home to several wineries, which produce a variety of wines.
Demographics
As of the 2010 census, there were 11,584 people, 4,717 households, and 3,072 families residing in the town. The population density was 483.3 people per square mile (186.7/km2). There were 4,945 housing units at an average density of 206.7 per square mile (79.7/km2). The racial makeup of the town was 97.2% White, 0.6% African American, 0.2% Native American, 0.5% Asian, 0.1% Pacific Islander, 0.4% from other races, and 1.0% from two or more races. Hispanic or Latino of any race were 1.3% of the population.
There were 4,717 households, out of which 30.2% had children under the age of 18 living with them, 51.2% were married couples living together, 11.7% had a female householder with no husband present, and 32.3% were non-families. 26.2% of all households were made up of individuals, and 11.2% had someone living alone who was 65 years of age or older. The average household size was 2.45 and the average family size was 2.94.
In the town, the population was spread out, with 23.7% under the age of 18, 7.2% from 18 to 24, 28.2% from 25 to 44, 25.2% from 45 to 64, and 15.7% who were 65 years of age or older. The median age was 39 years. For every 100 females, there were 93.2 males. For every 100 females age 18 and over, there were 90.2 males.
The median income for a household in the town was $45,938, and the median income for a family was $54,917. Males had a median income of $41,890 versus $30,917 for females. The per capita income for the town was $21,945. About 5.2% of families and 7.3% of the population were below the poverty line, including 9.2% of those under age 18 and 8.2% of those age 65 or over.
Common Questions
What is Per Capita Income in Athol?
Per Capita income in Athol is $27,774.
What is the Median Family Income in Athol?
Median Family Income in Athol is $75,536.
What is the Median Household income in Athol?
Median Household Income in Athol is $62,962.
What is Income or Wage Gap in Athol?
Income or Wage Gap in Athol is 18.7%.
Women in Athol earn 81.3 cents for every dollar earned by a man.
What is Family Income Deficit in Athol?
Family Income Deficit in Athol is $6,885.
Families that are below poverty line in Athol earn $6,885 less on average than the poverty threshold level.
What is Inequality or Gini Index in Athol?
Inequality or Gini Index in Athol is 0.41.
What is the Total Population of Athol?
Total Population of Athol is 9,148.
What is the Total Male Population of Athol?
Total Male Population of Athol is 4,608.
What is the Total Female Population of Athol?
Total Female Population of Athol is 4,540.
What is the Ratio of Males per 100 Females in Athol?
There are 101.50 Males per 100 Females in Athol.
What is the Ratio of Females per 100 Males in Athol?
There are 98.52 Females per 100 Males in Athol.
What is the Median Population Age in Athol?
Median Population Age in Athol is 38.0 Years.
What is the Average Family Size in Athol
Average Family Size in Athol is 3.2 People.
What is the Average Household Size in Athol
Average Household Size in Athol is 2.6 People.
How Large is the Labor Force in Athol?
There are 4,633 People in the Labor Forcein in Athol.
What is the Percentage of People in the Labor Force in Athol?
64.1% of People are in the Labor Force in Athol.
What is the Unemployment Rate in Athol?
Unemployment Rate in Athol is 8.1%.