Marshfield, MA Map & Demographics
Marshfield Map
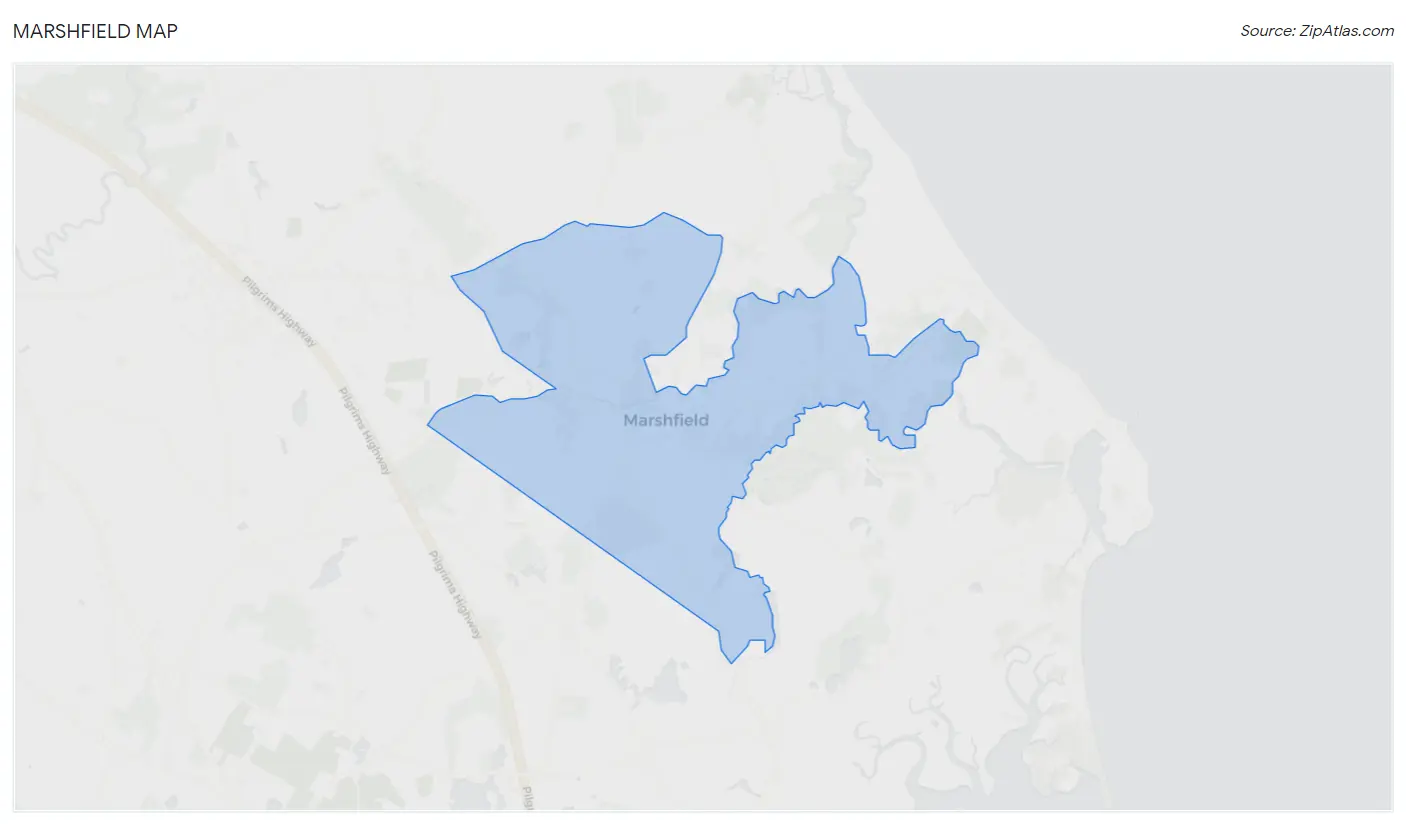
Marshfield Overview
$54,716
PER CAPITA INCOME
$132,045
AVG FAMILY INCOME
$93,491
AVG HOUSEHOLD INCOME
15.7%
WAGE / INCOME GAP [ % ]
84.3¢/ $1
WAGE / INCOME GAP [ $ ]
$16,003
FAMILY INCOME DEFICIT
0.52
INEQUALITY / GINI INDEX
4,868
TOTAL POPULATION
2,460
MALE POPULATION
2,408
FEMALE POPULATION
102.16
MALES / 100 FEMALES
97.89
FEMALES / 100 MALES
44.2
MEDIAN AGE
3.3
AVG FAMILY SIZE
2.6
AVG HOUSEHOLD SIZE
2,582
LABOR FORCE [ PEOPLE ]
69.4%
PERCENT IN LABOR FORCE
4.8%
UNEMPLOYMENT RATE
Marshfield Zip Codes
Income in Marshfield
Income Overview in Marshfield
Per Capita Income in Marshfield is $54,716, while median incomes of families and households are $132,045 and $93,491 respectively.
| Characteristic | Number | Measure |
| Per Capita Income | 4,868 | $54,716 |
| Median Family Income | 1,222 | $132,045 |
| Mean Family Income | 1,222 | $174,473 |
| Median Household Income | 1,896 | $93,491 |
| Mean Household Income | 1,896 | $140,580 |
| Income Deficit | 1,222 | $16,003 |
| Wage / Income Gap (%) | 4,868 | 15.69% |
| Wage / Income Gap ($) | 4,868 | 84.31¢ per $1 |
| Gini / Inequality Index | 4,868 | 0.52 |
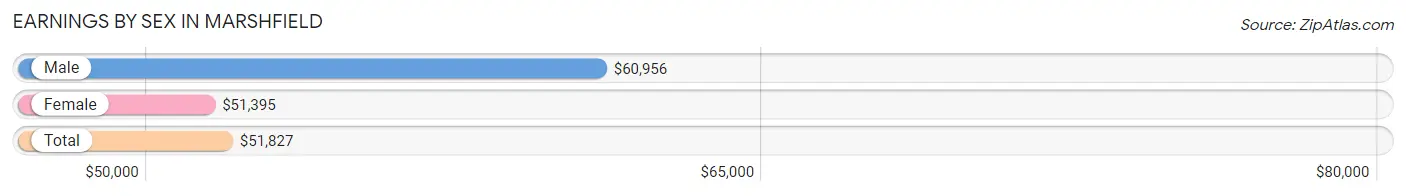
Earnings by Sex in Marshfield
Average Earnings in Marshfield are $51,827, $60,956 for men and $51,395 for women, a difference of 15.7%.
| Sex | Number | Average Earnings |
| Male | 1,433 (53.6%) | $60,956 |
| Female | 1,240 (46.4%) | $51,395 |
| Total | 2,673 (100.0%) | $51,827 |
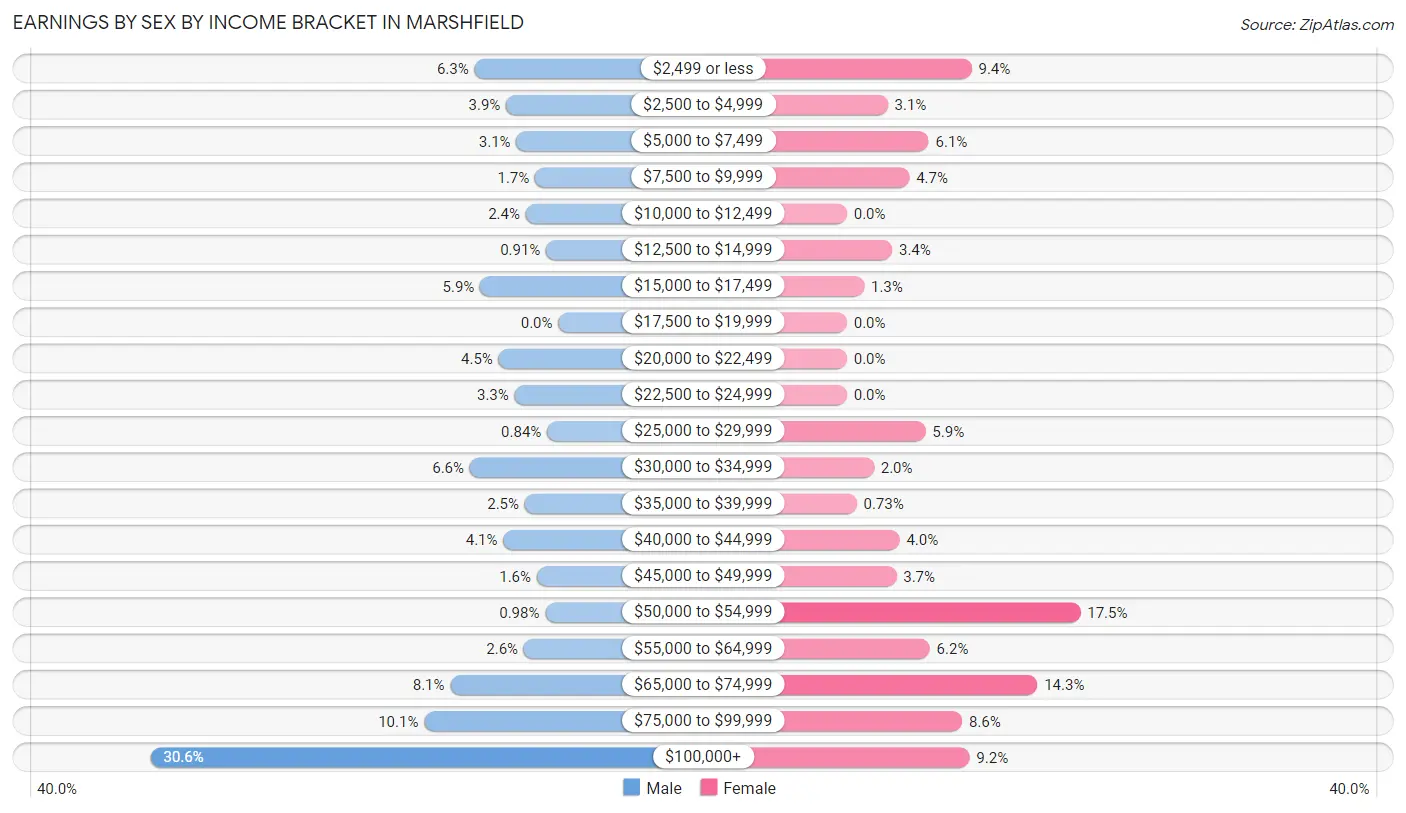
Earnings by Sex by Income Bracket in Marshfield
The most common earnings brackets in Marshfield are $100,000+ for men (438 | 30.6%) and $50,000 to $54,999 for women (217 | 17.5%).
| Income | Male | Female |
| $2,499 or less | 90 (6.3%) | 116 (9.3%) |
| $2,500 to $4,999 | 56 (3.9%) | 38 (3.1%) |
| $5,000 to $7,499 | 45 (3.1%) | 76 (6.1%) |
| $7,500 to $9,999 | 25 (1.7%) | 58 (4.7%) |
| $10,000 to $12,499 | 35 (2.4%) | 0 (0.0%) |
| $12,500 to $14,999 | 13 (0.9%) | 42 (3.4%) |
| $15,000 to $17,499 | 84 (5.9%) | 16 (1.3%) |
| $17,500 to $19,999 | 0 (0.0%) | 0 (0.0%) |
| $20,000 to $22,499 | 64 (4.5%) | 0 (0.0%) |
| $22,500 to $24,999 | 47 (3.3%) | 0 (0.0%) |
| $25,000 to $29,999 | 12 (0.8%) | 73 (5.9%) |
| $30,000 to $34,999 | 95 (6.6%) | 25 (2.0%) |
| $35,000 to $39,999 | 36 (2.5%) | 9 (0.7%) |
| $40,000 to $44,999 | 59 (4.1%) | 49 (4.0%) |
| $45,000 to $49,999 | 23 (1.6%) | 46 (3.7%) |
| $50,000 to $54,999 | 14 (1.0%) | 217 (17.5%) |
| $55,000 to $64,999 | 37 (2.6%) | 77 (6.2%) |
| $65,000 to $74,999 | 116 (8.1%) | 177 (14.3%) |
| $75,000 to $99,999 | 144 (10.1%) | 107 (8.6%) |
| $100,000+ | 438 (30.6%) | 114 (9.2%) |
| Total | 1,433 (100.0%) | 1,240 (100.0%) |
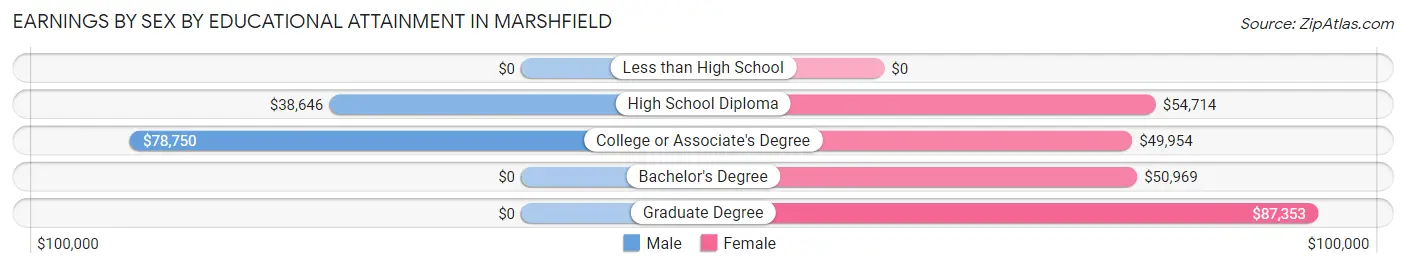
Earnings by Sex by Educational Attainment in Marshfield
Average earnings in Marshfield are $69,718 for men and $52,940 for women, a difference of 24.1%. Men with an educational attainment of college or associate's degree enjoy the highest average annual earnings of $78,750, while those with high school diploma education earn the least with $38,646. Women with an educational attainment of graduate degree earn the most with the average annual earnings of $87,353, while those with college or associate's degree education have the smallest earnings of $49,954.
| Educational Attainment | Male Income | Female Income |
| Less than High School | - | - |
| High School Diploma | $38,646 | $54,714 |
| College or Associate's Degree | $78,750 | $49,954 |
| Bachelor's Degree | - | - |
| Graduate Degree | - | - |
| Total | $69,718 | $52,940 |
Family Income in Marshfield
Family Income Brackets in Marshfield
According to the Marshfield family income data, there are 314 families falling into the $200,000+ income range, which is the most common income bracket and makes up 25.7% of all families.
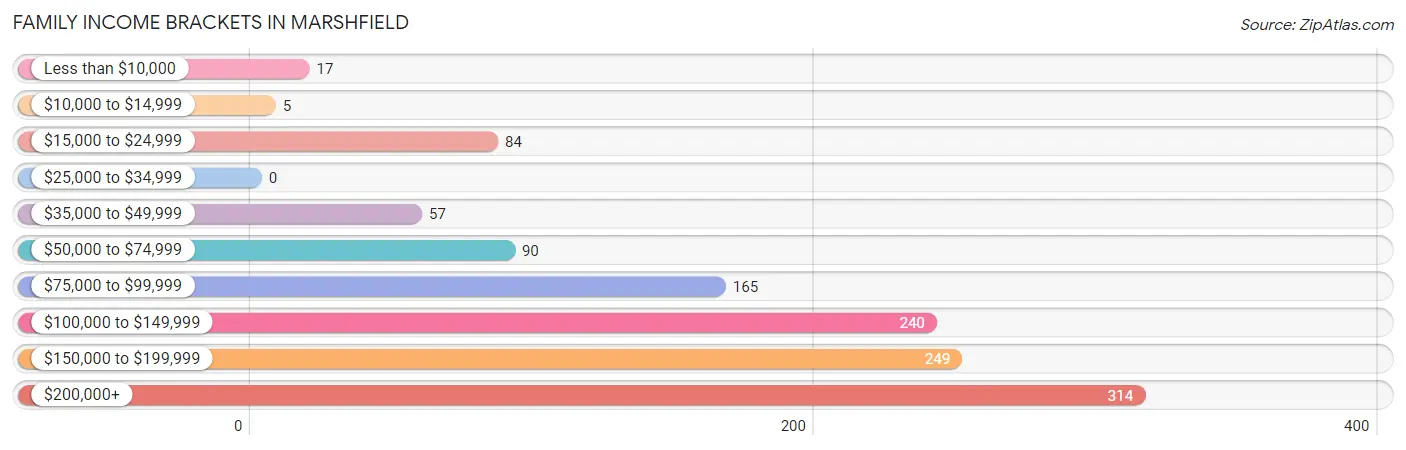
| Income Bracket | # Families | % Families |
| Less than $10,000 | 17 | 1.4% |
| $10,000 to $14,999 | 5 | 0.4% |
| $15,000 to $24,999 | 84 | 6.9% |
| $25,000 to $34,999 | 0 | 0.0% |
| $35,000 to $49,999 | 57 | 4.7% |
| $50,000 to $74,999 | 90 | 7.4% |
| $75,000 to $99,999 | 165 | 13.5% |
| $100,000 to $149,999 | 240 | 19.6% |
| $150,000 to $199,999 | 249 | 20.4% |
| $200,000+ | 314 | 25.7% |
Family Income by Famaliy Size in Marshfield
4-person families (262 | 21.4%) account for the highest median family income in Marshfield with $250,001 per family, while 2-person families (542 | 44.4%) have the highest median income of $63,390 per family member.
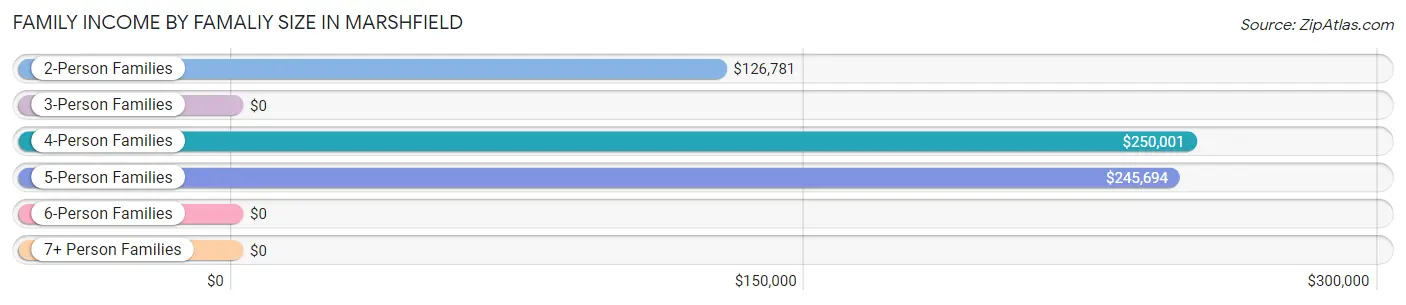
| Income Bracket | # Families | Median Income |
| 2-Person Families | 542 (44.4%) | $126,781 |
| 3-Person Families | 237 (19.4%) | $0 |
| 4-Person Families | 262 (21.4%) | $250,001 |
| 5-Person Families | 29 (2.4%) | $245,694 |
| 6-Person Families | 146 (11.9%) | $0 |
| 7+ Person Families | 6 (0.5%) | $0 |
| Total | 1,222 (100.0%) | $132,045 |
Family Income by Number of Earners in Marshfield
The median family income in Marshfield is $132,045, with families comprising 3+ earners (159) having the highest median family income of $161,736, while families with no earners (83) have the lowest median family income of $47,132, accounting for 13.0% and 6.8% of families, respectively.
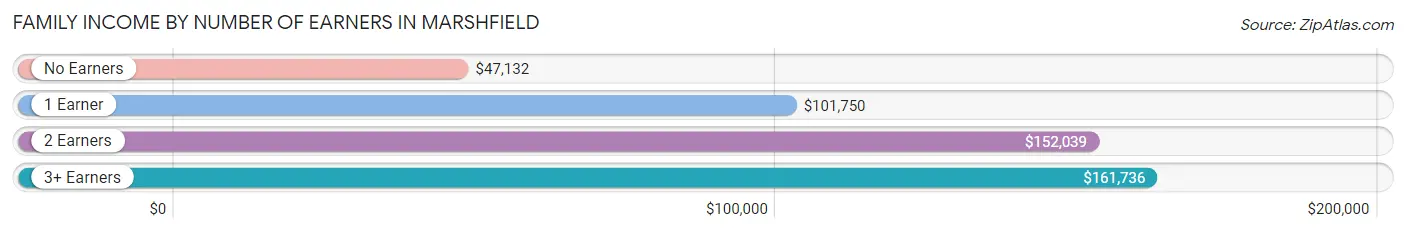
| Number of Earners | # Families | Median Income |
| No Earners | 83 (6.8%) | $47,132 |
| 1 Earner | 240 (19.6%) | $101,750 |
| 2 Earners | 740 (60.6%) | $152,039 |
| 3+ Earners | 159 (13.0%) | $161,736 |
| Total | 1,222 (100.0%) | $132,045 |
Household Income in Marshfield
Household Income Brackets in Marshfield
With 347 households falling in the category, the $200,000+ income range is the most frequent in Marshfield, accounting for 18.3% of all households. In contrast, only 51 households (2.7%) fall into the $10,000 to $14,999 income bracket, making it the least populous group.
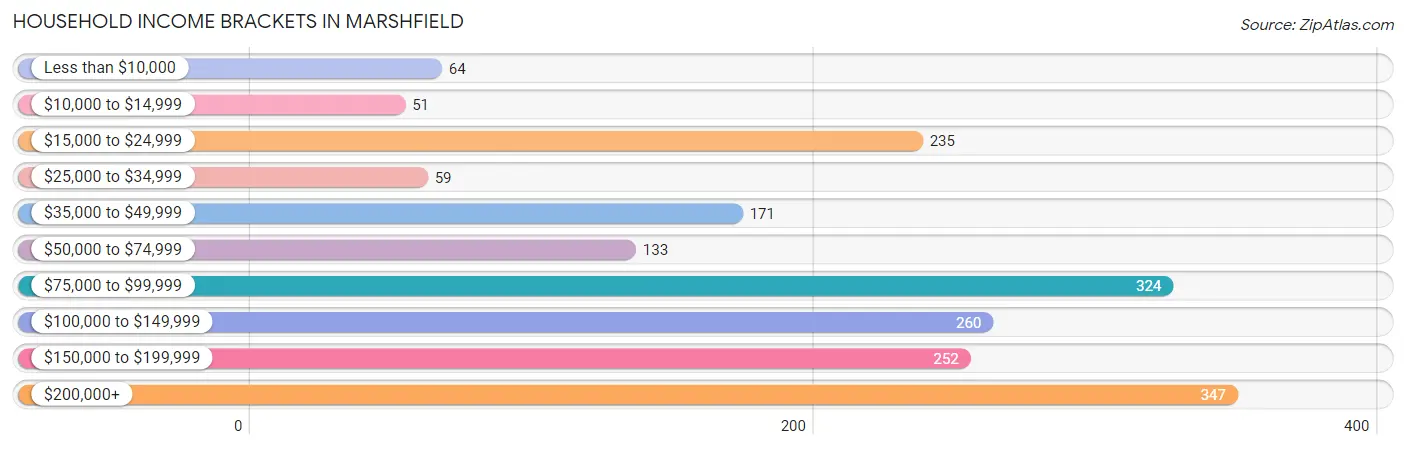
| Income Bracket | # Households | % Households |
| Less than $10,000 | 64 | 3.4% |
| $10,000 to $14,999 | 51 | 2.7% |
| $15,000 to $24,999 | 235 | 12.4% |
| $25,000 to $34,999 | 59 | 3.1% |
| $35,000 to $49,999 | 171 | 9.0% |
| $50,000 to $74,999 | 133 | 7.0% |
| $75,000 to $99,999 | 324 | 17.1% |
| $100,000 to $149,999 | 260 | 13.7% |
| $150,000 to $199,999 | 252 | 13.3% |
| $200,000+ | 347 | 18.3% |
Household Income by Householder Age in Marshfield
The median household income in Marshfield is $93,491, with the highest median household income of $172,738 found in the 25 to 44 years age bracket for the primary householder. A total of 412 households (21.7%) fall into this category. Meanwhile, the 15 to 24 years age bracket for the primary householder has the lowest median household income of $0, with 46 households (2.4%) in this group.
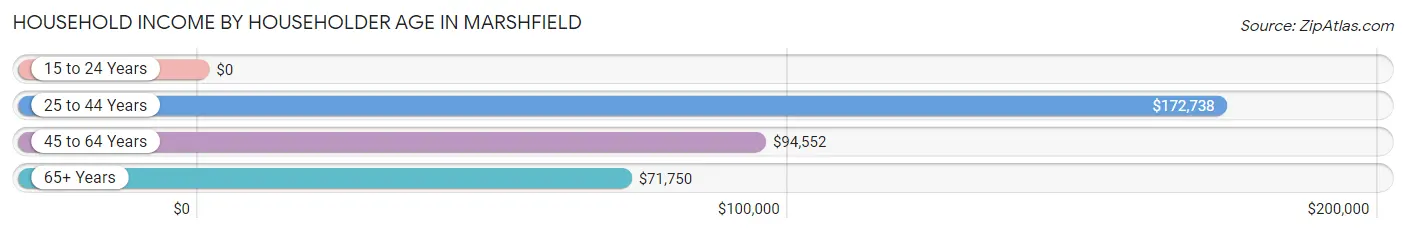
| Income Bracket | # Households | Median Income |
| 15 to 24 Years | 46 (2.4%) | $0 |
| 25 to 44 Years | 412 (21.7%) | $172,738 |
| 45 to 64 Years | 843 (44.5%) | $94,552 |
| 65+ Years | 595 (31.4%) | $71,750 |
| Total | 1,896 (100.0%) | $93,491 |
Poverty in Marshfield
Income Below Poverty by Sex and Age in Marshfield
With 13.1% poverty level for males and 22.0% for females among the residents of Marshfield, 45 to 54 year old males and 6 to 11 year old females are the most vulnerable to poverty, with 140 males (35.5%) and 198 females (69.2%) in their respective age groups living below the poverty level.
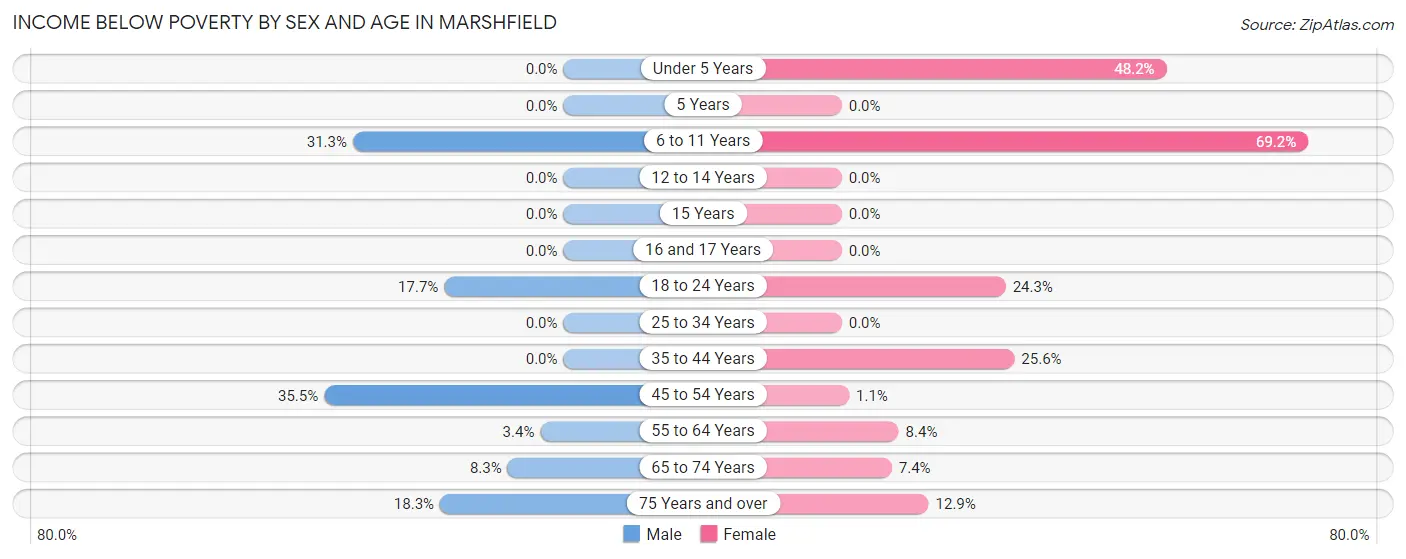
| Age Bracket | Male | Female |
| Under 5 Years | 0 (0.0%) | 107 (48.2%) |
| 5 Years | 0 (0.0%) | 0 (0.0%) |
| 6 to 11 Years | 86 (31.3%) | 198 (69.2%) |
| 12 to 14 Years | 0 (0.0%) | 0 (0.0%) |
| 15 Years | 0 (0.0%) | 0 (0.0%) |
| 16 and 17 Years | 0 (0.0%) | 0 (0.0%) |
| 18 to 24 Years | 40 (17.7%) | 46 (24.3%) |
| 25 to 34 Years | 0 (0.0%) | 0 (0.0%) |
| 35 to 44 Years | 0 (0.0%) | 101 (25.6%) |
| 45 to 54 Years | 140 (35.5%) | 4 (1.1%) |
| 55 to 64 Years | 16 (3.4%) | 27 (8.4%) |
| 65 to 74 Years | 18 (8.3%) | 13 (7.4%) |
| 75 Years and over | 22 (18.3%) | 33 (12.9%) |
| Total | 322 (13.1%) | 529 (22.0%) |
Income Above Poverty by Sex and Age in Marshfield
According to the poverty statistics in Marshfield, males aged under 5 years and females aged 12 to 14 years are the age groups that are most secure financially, with 100.0% of males and 100.0% of females in these age groups living above the poverty line.
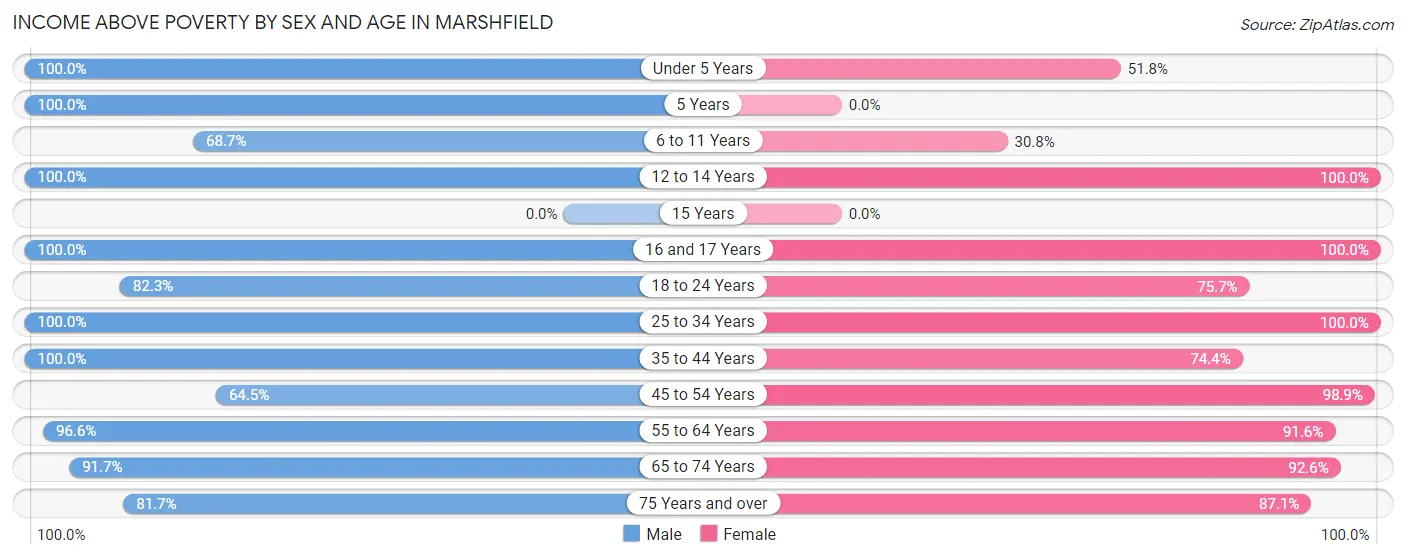
| Age Bracket | Male | Female |
| Under 5 Years | 206 (100.0%) | 115 (51.8%) |
| 5 Years | 13 (100.0%) | 0 (0.0%) |
| 6 to 11 Years | 189 (68.7%) | 88 (30.8%) |
| 12 to 14 Years | 101 (100.0%) | 45 (100.0%) |
| 15 Years | 0 (0.0%) | 0 (0.0%) |
| 16 and 17 Years | 58 (100.0%) | 26 (100.0%) |
| 18 to 24 Years | 186 (82.3%) | 143 (75.7%) |
| 25 to 34 Years | 62 (100.0%) | 126 (100.0%) |
| 35 to 44 Years | 322 (100.0%) | 293 (74.4%) |
| 45 to 54 Years | 254 (64.5%) | 365 (98.9%) |
| 55 to 64 Years | 450 (96.6%) | 293 (91.6%) |
| 65 to 74 Years | 199 (91.7%) | 162 (92.6%) |
| 75 Years and over | 98 (81.7%) | 223 (87.1%) |
| Total | 2,138 (86.9%) | 1,879 (78.0%) |
Income Below Poverty Among Married-Couple Families in Marshfield
The poverty statistics for married-couple families in Marshfield show that 10.0% or 106 of the total 1,056 families live below the poverty line. Families with 3 or 4 children have the highest poverty rate of 60.0%, comprising of 84 families. On the other hand, families with 1 or 2 children have the lowest poverty rate of 0.0%, which includes 0 families.
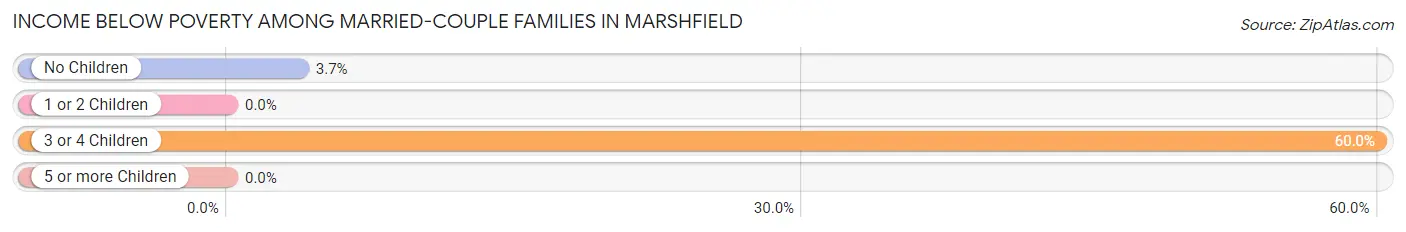
| Children | Above Poverty | Below Poverty |
| No Children | 572 (96.3%) | 22 (3.7%) |
| 1 or 2 Children | 322 (100.0%) | 0 (0.0%) |
| 3 or 4 Children | 56 (40.0%) | 84 (60.0%) |
| 5 or more Children | 0 (0.0%) | 0 (0.0%) |
| Total | 950 (90.0%) | 106 (10.0%) |
Income Below Poverty Among Single-Parent Households in Marshfield
| Children | Single Father | Single Mother |
| No Children | 0 (0.0%) | 0 (0.0%) |
| 1 or 2 Children | 0 (0.0%) | 0 (0.0%) |
| 3 or 4 Children | 0 (0.0%) | 0 (0.0%) |
| 5 or more Children | 0 (0.0%) | 0 (0.0%) |
| Total | 0 (0.0%) | 0 (0.0%) |
Income Below Poverty Among Married-Couple vs Single-Parent Households in Marshfield
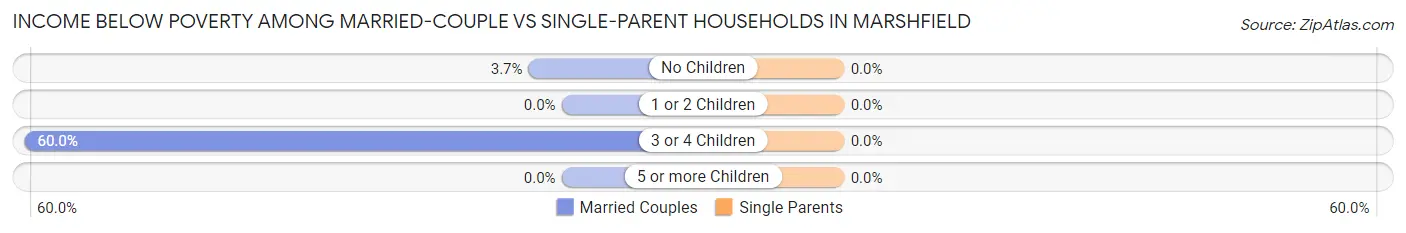
| Children | Married-Couple Families | Single-Parent Households |
| No Children | 22 (3.7%) | 0 (0.0%) |
| 1 or 2 Children | 0 (0.0%) | 0 (0.0%) |
| 3 or 4 Children | 84 (60.0%) | 0 (0.0%) |
| 5 or more Children | 0 (0.0%) | 0 (0.0%) |
| Total | 106 (10.0%) | 0 (0.0%) |
Race in Marshfield
The most populous races in Marshfield are White / Caucasian (4,728 | 97.1%), Hispanic or Latino (133 | 2.7%), and Two or more Races (60 | 1.2%).
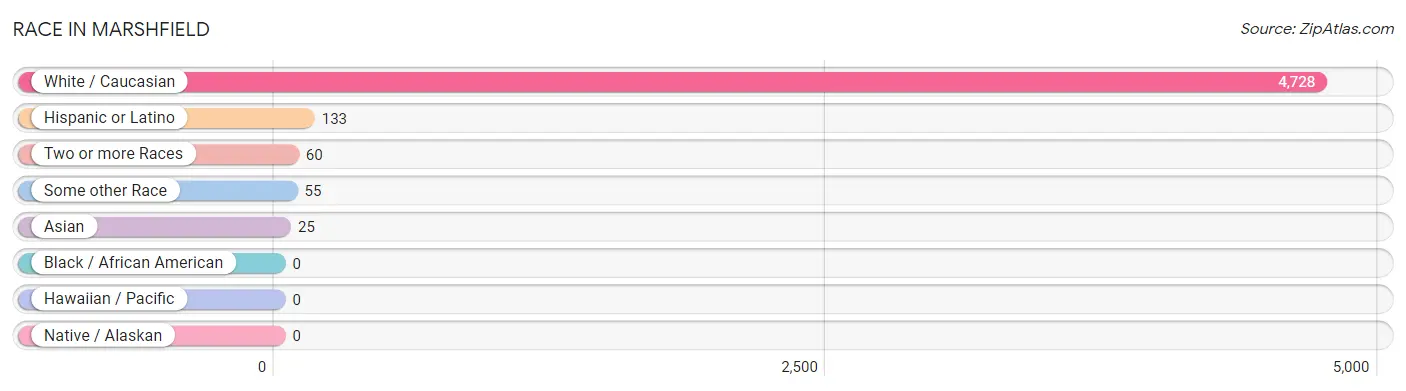
| Race | # Population | % Population |
| Asian | 25 | 0.5% |
| Black / African American | 0 | 0.0% |
| Hawaiian / Pacific | 0 | 0.0% |
| Hispanic or Latino | 133 | 2.7% |
| Native / Alaskan | 0 | 0.0% |
| White / Caucasian | 4,728 | 97.1% |
| Two or more Races | 60 | 1.2% |
| Some other Race | 55 | 1.1% |
| Total | 4,868 | 100.0% |
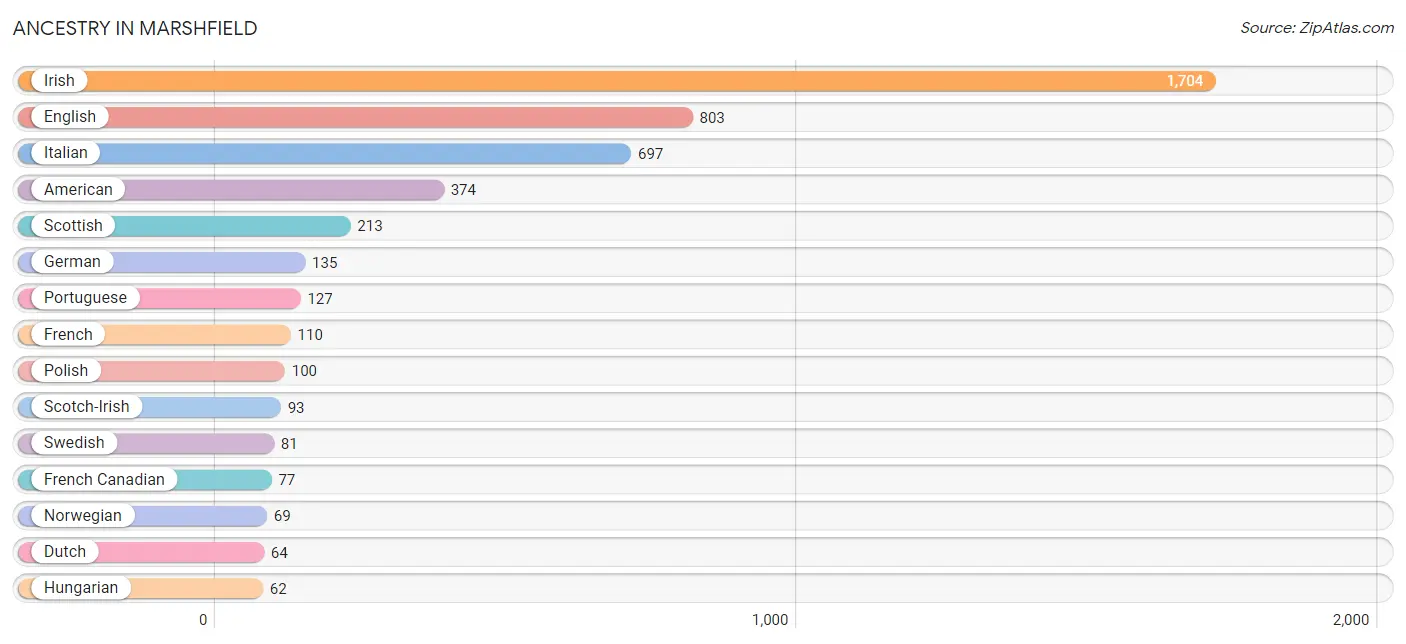
Ancestry in Marshfield
The most populous ancestries reported in Marshfield are Irish (1,704 | 35.0%), English (803 | 16.5%), Italian (697 | 14.3%), American (374 | 7.7%), and Scottish (213 | 4.4%), together accounting for 77.9% of all Marshfield residents.
| Ancestry | # Population | % Population |
| Albanian | 23 | 0.5% |
| American | 374 | 7.7% |
| Arab | 24 | 0.5% |
| Armenian | 33 | 0.7% |
| Belgian | 11 | 0.2% |
| British | 54 | 1.1% |
| Burmese | 1 | 0.0% |
| Canadian | 27 | 0.5% |
| Cape Verdean | 5 | 0.1% |
| Danish | 3 | 0.1% |
| Dutch | 64 | 1.3% |
| Ecuadorian | 36 | 0.7% |
| English | 803 | 16.5% |
| French | 110 | 2.3% |
| French Canadian | 77 | 1.6% |
| German | 135 | 2.8% |
| Greek | 49 | 1.0% |
| Hungarian | 62 | 1.3% |
| Indian (Asian) | 24 | 0.5% |
| Irish | 1,704 | 35.0% |
| Italian | 697 | 14.3% |
| Lebanese | 5 | 0.1% |
| Lithuanian | 25 | 0.5% |
| Mexican | 35 | 0.7% |
| New Zealander | 50 | 1.0% |
| Norwegian | 69 | 1.4% |
| Pennsylvania German | 17 | 0.4% |
| Polish | 100 | 2.1% |
| Portuguese | 127 | 2.6% |
| Romanian | 31 | 0.6% |
| Russian | 7 | 0.1% |
| Scandinavian | 28 | 0.6% |
| Scotch-Irish | 93 | 1.9% |
| Scottish | 213 | 4.4% |
| South American | 36 | 0.7% |
| Spaniard | 62 | 1.3% |
| Subsaharan African | 5 | 0.1% |
| Swedish | 81 | 1.7% |
| Swiss | 15 | 0.3% |
| Syrian | 19 | 0.4% |
| Ukrainian | 6 | 0.1% |
| Welsh | 28 | 0.6% | View All 42 Rows |
Immigrants in Marshfield
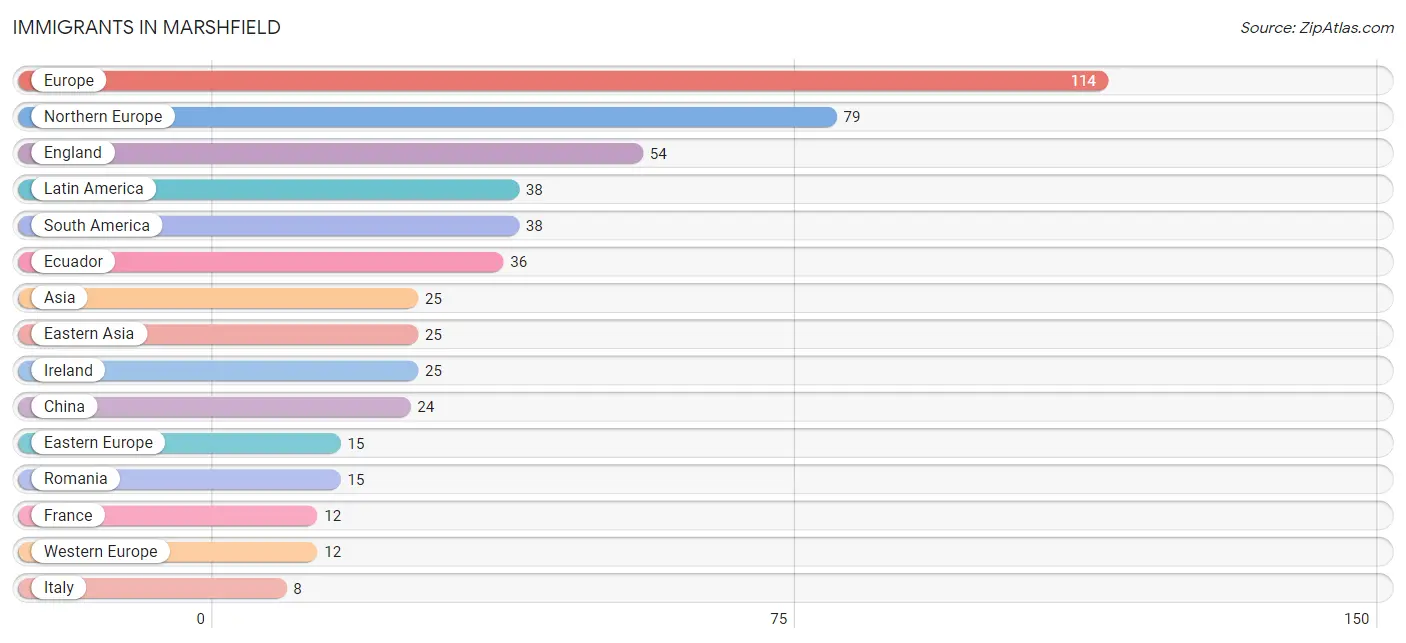
The most numerous immigrant groups reported in Marshfield came from Europe (114 | 2.3%), Northern Europe (79 | 1.6%), England (54 | 1.1%), Latin America (38 | 0.8%), and South America (38 | 0.8%), together accounting for 6.6% of all Marshfield residents.
| Immigration Origin | # Population | % Population |
| Asia | 25 | 0.5% |
| Brazil | 2 | 0.0% |
| Canada | 5 | 0.1% |
| China | 24 | 0.5% |
| Eastern Asia | 25 | 0.5% |
| Eastern Europe | 15 | 0.3% |
| Ecuador | 36 | 0.7% |
| England | 54 | 1.1% |
| Europe | 114 | 2.3% |
| France | 12 | 0.3% |
| Ireland | 25 | 0.5% |
| Italy | 8 | 0.2% |
| Korea | 1 | 0.0% |
| Latin America | 38 | 0.8% |
| Northern Europe | 79 | 1.6% |
| Romania | 15 | 0.3% |
| South America | 38 | 0.8% |
| Southern Europe | 8 | 0.2% |
| Western Europe | 12 | 0.3% | View All 19 Rows |
Sex and Age in Marshfield
Sex and Age in Marshfield
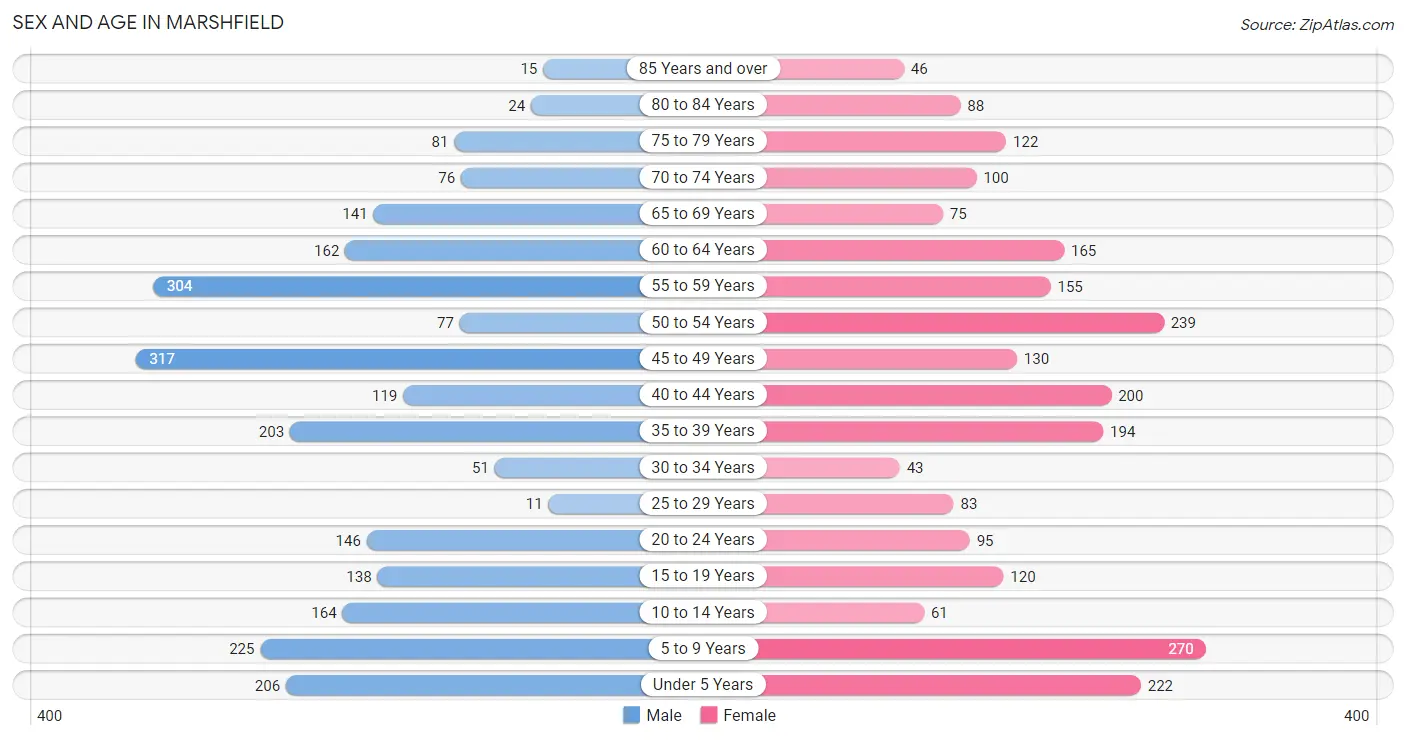
The most populous age groups in Marshfield are 45 to 49 Years (317 | 12.9%) for men and 5 to 9 Years (270 | 11.2%) for women.
| Age Bracket | Male | Female |
| Under 5 Years | 206 (8.4%) | 222 (9.2%) |
| 5 to 9 Years | 225 (9.1%) | 270 (11.2%) |
| 10 to 14 Years | 164 (6.7%) | 61 (2.5%) |
| 15 to 19 Years | 138 (5.6%) | 120 (5.0%) |
| 20 to 24 Years | 146 (5.9%) | 95 (4.0%) |
| 25 to 29 Years | 11 (0.4%) | 83 (3.5%) |
| 30 to 34 Years | 51 (2.1%) | 43 (1.8%) |
| 35 to 39 Years | 203 (8.3%) | 194 (8.1%) |
| 40 to 44 Years | 119 (4.8%) | 200 (8.3%) |
| 45 to 49 Years | 317 (12.9%) | 130 (5.4%) |
| 50 to 54 Years | 77 (3.1%) | 239 (9.9%) |
| 55 to 59 Years | 304 (12.4%) | 155 (6.4%) |
| 60 to 64 Years | 162 (6.6%) | 165 (6.9%) |
| 65 to 69 Years | 141 (5.7%) | 75 (3.1%) |
| 70 to 74 Years | 76 (3.1%) | 100 (4.2%) |
| 75 to 79 Years | 81 (3.3%) | 122 (5.1%) |
| 80 to 84 Years | 24 (1.0%) | 88 (3.6%) |
| 85 Years and over | 15 (0.6%) | 46 (1.9%) |
| Total | 2,460 (100.0%) | 2,408 (100.0%) |
Families and Households in Marshfield
Median Family Size in Marshfield
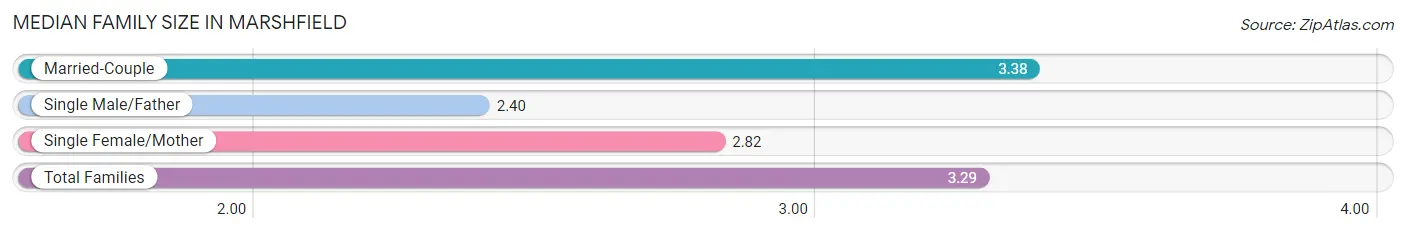
The median family size in Marshfield is 3.29 persons per family, with married-couple families (1,056 | 86.4%) accounting for the largest median family size of 3.38 persons per family. On the other hand, single male/father families (52 | 4.3%) represent the smallest median family size with 2.40 persons per family.
| Family Type | # Families | Family Size |
| Married-Couple | 1,056 (86.4%) | 3.38 |
| Single Male/Father | 52 (4.3%) | 2.40 |
| Single Female/Mother | 114 (9.3%) | 2.82 |
| Total Families | 1,222 (100.0%) | 3.29 |
Median Household Size in Marshfield
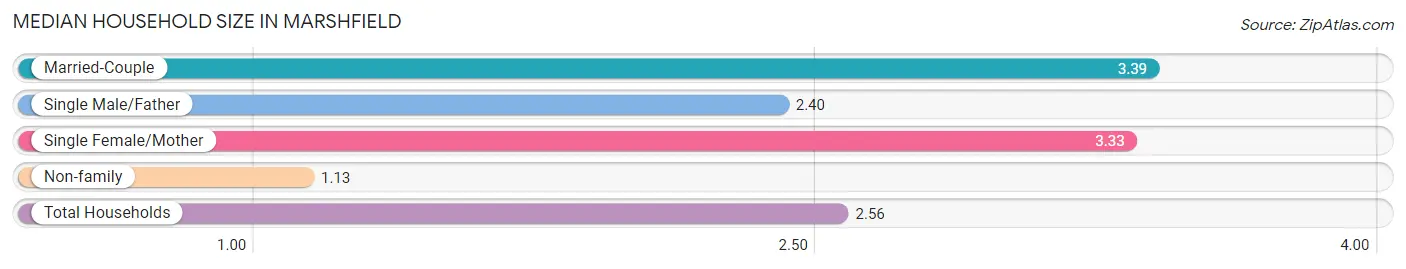
The median household size in Marshfield is 2.56 persons per household, with married-couple households (1,056 | 55.7%) accounting for the largest median household size of 3.39 persons per household. non-family households (674 | 35.5%) represent the smallest median household size with 1.13 persons per household.
| Household Type | # Households | Household Size |
| Married-Couple | 1,056 (55.7%) | 3.39 |
| Single Male/Father | 52 (2.7%) | 2.40 |
| Single Female/Mother | 114 (6.0%) | 3.33 |
| Non-family | 674 (35.5%) | 1.13 |
| Total Households | 1,896 (100.0%) | 2.56 |
Household Size by Marriage Status in Marshfield
Out of a total of 1,896 households in Marshfield, 1,222 (64.4%) are family households, while 674 (35.5%) are nonfamily households. The most numerous type of family households are 2-person households, comprising 537, and the most common type of nonfamily households are 1-person households, comprising 602.
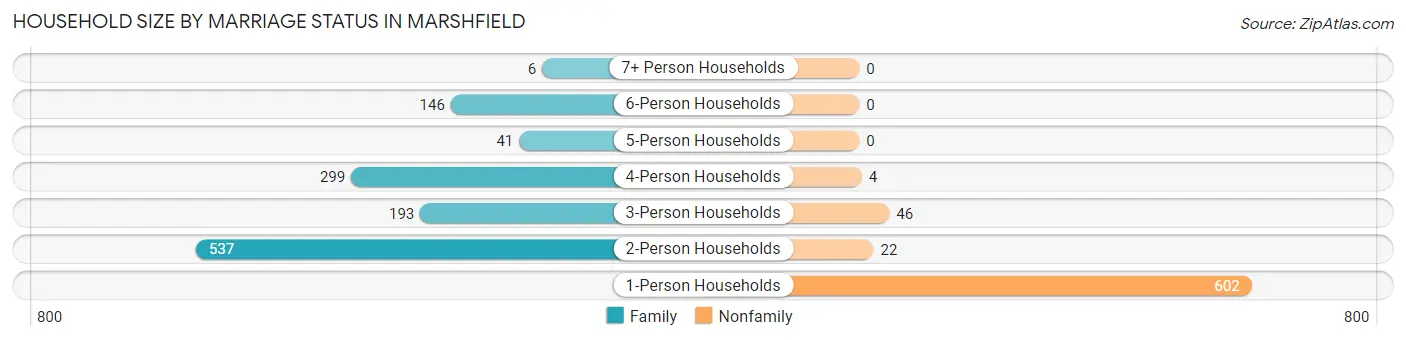
| Household Size | Family Households | Nonfamily Households |
| 1-Person Households | - | 602 (31.8%) |
| 2-Person Households | 537 (28.3%) | 22 (1.2%) |
| 3-Person Households | 193 (10.2%) | 46 (2.4%) |
| 4-Person Households | 299 (15.8%) | 4 (0.2%) |
| 5-Person Households | 41 (2.2%) | 0 (0.0%) |
| 6-Person Households | 146 (7.7%) | 0 (0.0%) |
| 7+ Person Households | 6 (0.3%) | 0 (0.0%) |
| Total | 1,222 (64.4%) | 674 (35.5%) |
Female Fertility in Marshfield
Fertility by Age in Marshfield
Average fertility rate in Marshfield is 70.0 births per 1,000 women. Women in the age bracket of 35 to 50 years have the highest fertility rate with 114.0 births per 1,000 women. Women in the age bracket of 35 to 50 years acount for 100.0% of all women with births.
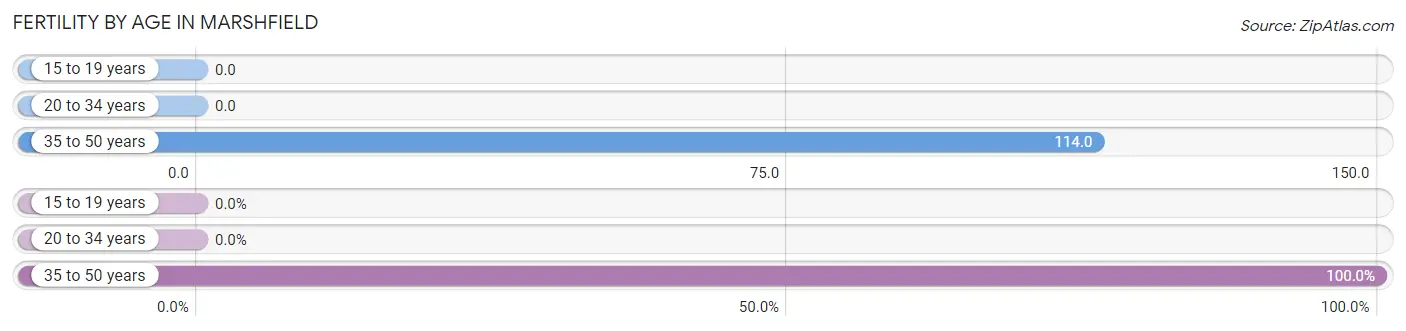
| Age Bracket | Women with Births | Births / 1,000 Women |
| 15 to 19 years | 0 (0.0%) | 0.0 |
| 20 to 34 years | 0 (0.0%) | 0.0 |
| 35 to 50 years | 62 (100.0%) | 114.0 |
| Total | 62 (100.0%) | 70.0 |
Fertility by Age by Marriage Status in Marshfield
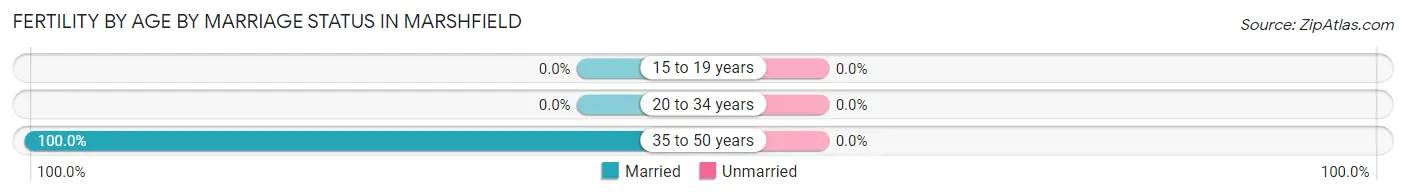
| Age Bracket | Married | Unmarried |
| 15 to 19 years | 0 (0.0%) | 0 (0.0%) |
| 20 to 34 years | 0 (0.0%) | 0 (0.0%) |
| 35 to 50 years | 62 (100.0%) | 0 (0.0%) |
| Total | 62 (100.0%) | 0 (0.0%) |
Fertility by Education in Marshfield
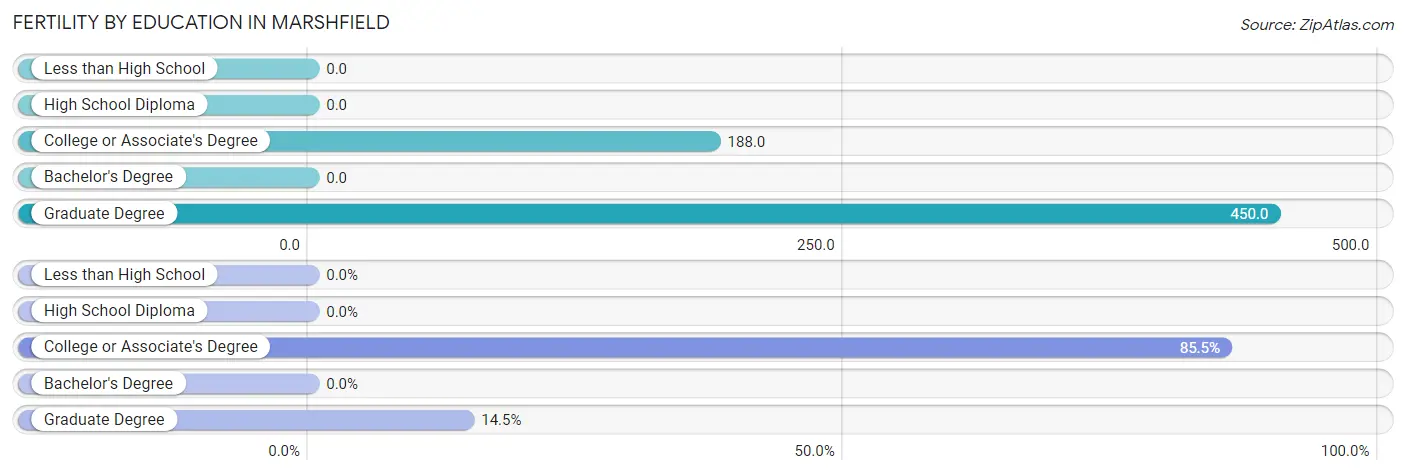
| Educational Attainment | Women with Births | Births / 1,000 Women |
| Less than High School | 0 (0.0%) | 0.0 |
| High School Diploma | 0 (0.0%) | 0.0 |
| College or Associate's Degree | 53 (85.5%) | 188.0 |
| Bachelor's Degree | 0 (0.0%) | 0.0 |
| Graduate Degree | 9 (14.5%) | 450.0 |
| Total | 62 (100.0%) | 70.0 |
Fertility by Education by Marriage Status in Marshfield
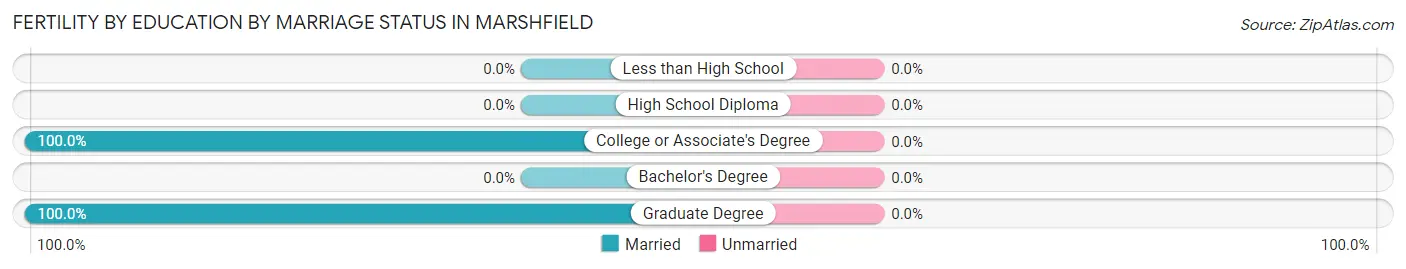
| Educational Attainment | Married | Unmarried |
| Less than High School | 0 (0.0%) | 0 (0.0%) |
| High School Diploma | 0 (0.0%) | 0 (0.0%) |
| College or Associate's Degree | 53 (100.0%) | 0 (0.0%) |
| Bachelor's Degree | 0 (0.0%) | 0 (0.0%) |
| Graduate Degree | 9 (100.0%) | 0 (0.0%) |
| Total | 62 (100.0%) | 0 (0.0%) |
Employment Characteristics in Marshfield
Employment by Class of Employer in Marshfield
Among the 2,438 employed individuals in Marshfield, private company employees (1,520 | 62.4%), local government employees (283 | 11.6%), and self-employed (not incorporated) (252 | 10.3%) make up the most common classes of employment.
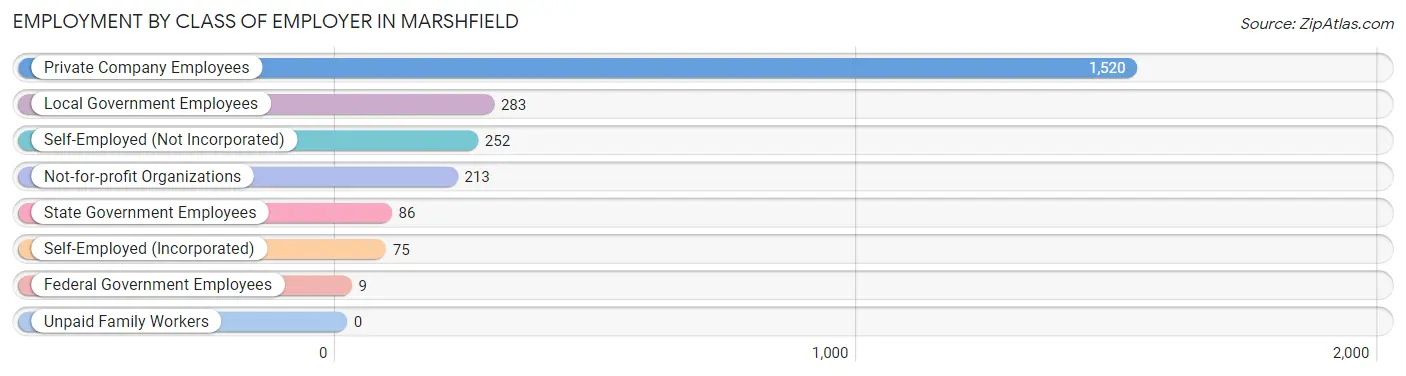
| Employer Class | # Employees | % Employees |
| Private Company Employees | 1,520 | 62.4% |
| Self-Employed (Incorporated) | 75 | 3.1% |
| Self-Employed (Not Incorporated) | 252 | 10.3% |
| Not-for-profit Organizations | 213 | 8.7% |
| Local Government Employees | 283 | 11.6% |
| State Government Employees | 86 | 3.5% |
| Federal Government Employees | 9 | 0.4% |
| Unpaid Family Workers | 0 | 0.0% |
| Total | 2,438 | 100.0% |
Employment Status by Age in Marshfield
According to the labor force statistics for Marshfield, out of the total population over 16 years of age (3,720), 69.4% or 2,582 individuals are in the labor force, with 4.8% or 124 of them unemployed. The age group with the highest labor force participation rate is 25 to 29 years, with 100.0% or 94 individuals in the labor force. Within the labor force, the 20 to 24 years age range has the highest percentage of unemployed individuals, with 31.6% or 68 of them being unemployed.
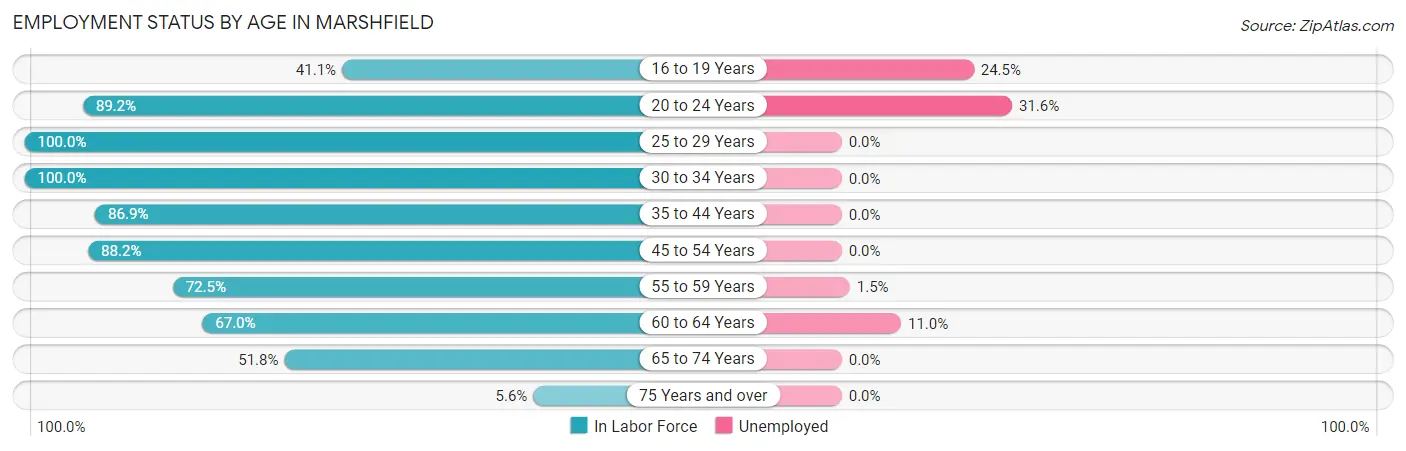
| Age Bracket | In Labor Force | Unemployed |
| 16 to 19 Years | 106 (41.1%) | 26 (24.5%) |
| 20 to 24 Years | 215 (89.2%) | 68 (31.6%) |
| 25 to 29 Years | 94 (100.0%) | 0 (0.0%) |
| 30 to 34 Years | 94 (100.0%) | 0 (0.0%) |
| 35 to 44 Years | 622 (86.9%) | 0 (0.0%) |
| 45 to 54 Years | 673 (88.2%) | 0 (0.0%) |
| 55 to 59 Years | 333 (72.5%) | 5 (1.5%) |
| 60 to 64 Years | 219 (67.0%) | 24 (11.0%) |
| 65 to 74 Years | 203 (51.8%) | 0 (0.0%) |
| 75 Years and over | 21 (5.6%) | 0 (0.0%) |
| Total | 2,582 (69.4%) | 124 (4.8%) |
Employment Status by Educational Attainment in Marshfield
According to labor force statistics for Marshfield, 83.0% of individuals (2,036) out of the total population between 25 and 64 years of age (2,453) are in the labor force, with 1.4% or 29 of them being unemployed. The group with the highest labor force participation rate are those with the educational attainment of bachelor's degree or higher, with 92.0% or 1,234 individuals in the labor force. Within the labor force, individuals with high school diploma education have the highest percentage of unemployment, with 7.2% or 24 of them being unemployed.
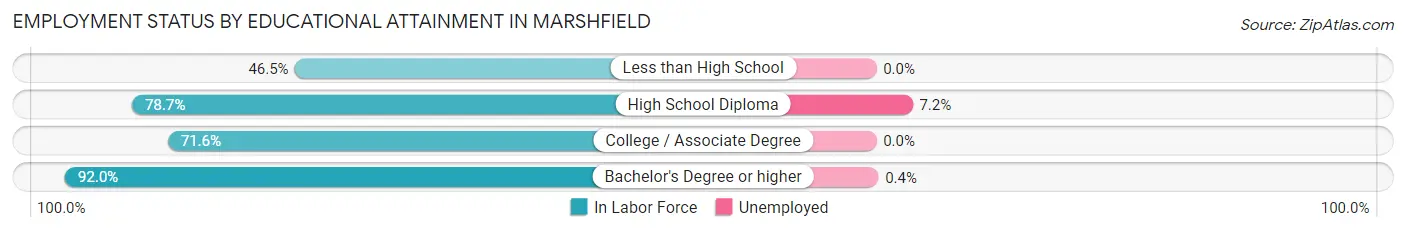
| Educational Attainment | In Labor Force | Unemployed |
| Less than High School | 46 (46.5%) | 0 (0.0%) |
| High School Diploma | 332 (78.7%) | 30 (7.2%) |
| College / Associate Degree | 423 (71.6%) | 0 (0.0%) |
| Bachelor's Degree or higher | 1,234 (92.0%) | 5 (0.4%) |
| Total | 2,036 (83.0%) | 34 (1.4%) |
Employment Occupations by Sex in Marshfield
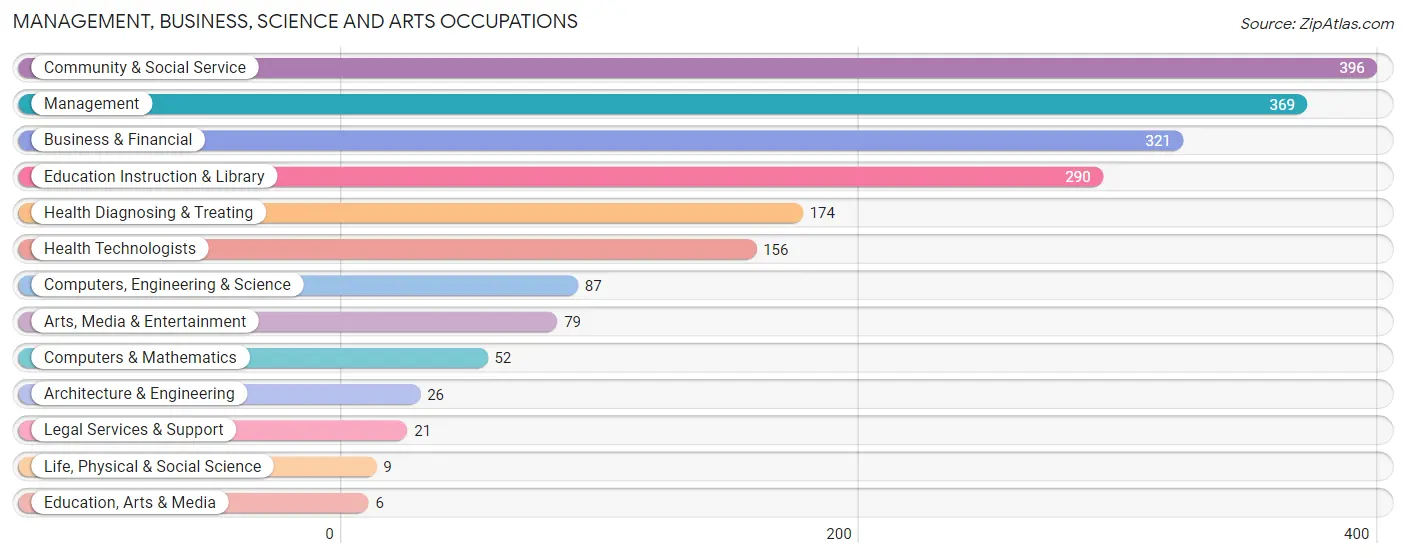
Management, Business, Science and Arts Occupations
The most common Management, Business, Science and Arts occupations in Marshfield are Community & Social Service (396 | 16.1%), Management (369 | 15.0%), Business & Financial (321 | 13.1%), Education Instruction & Library (290 | 11.8%), and Health Diagnosing & Treating (174 | 7.1%).
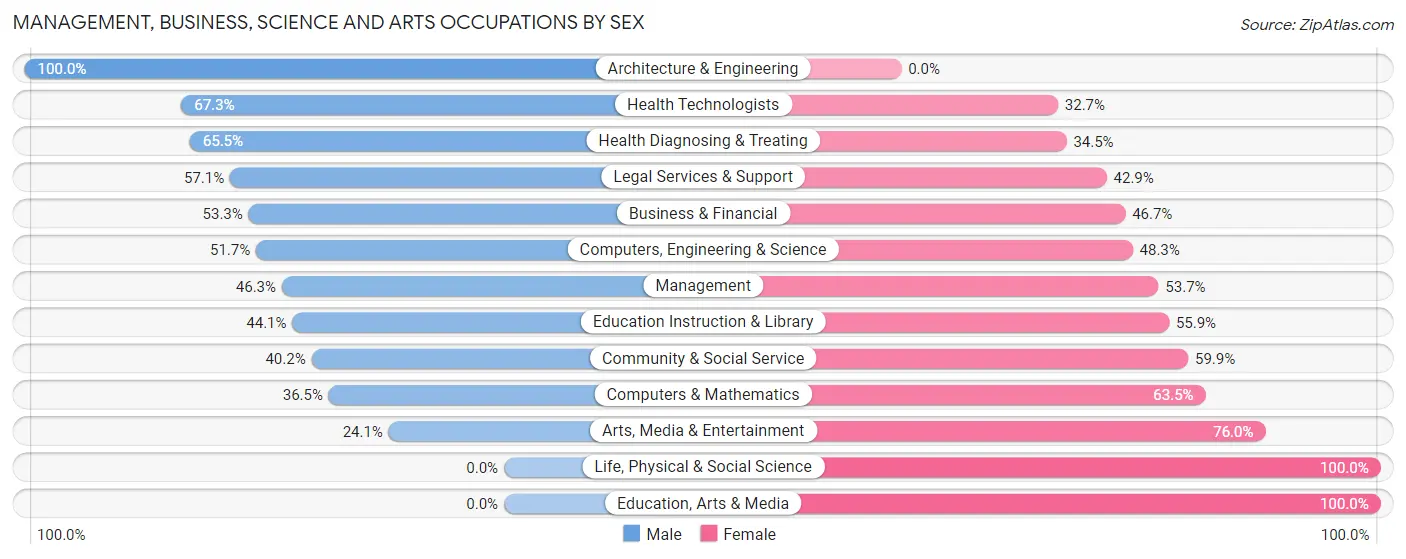
Management, Business, Science and Arts Occupations by Sex
Within the Management, Business, Science and Arts occupations in Marshfield, the most male-oriented occupations are Architecture & Engineering (100.0%), Health Technologists (67.3%), and Health Diagnosing & Treating (65.5%), while the most female-oriented occupations are Life, Physical & Social Science (100.0%), Education, Arts & Media (100.0%), and Arts, Media & Entertainment (75.9%).
| Occupation | Male | Female |
| Management | 171 (46.3%) | 198 (53.7%) |
| Business & Financial | 171 (53.3%) | 150 (46.7%) |
| Computers, Engineering & Science | 45 (51.7%) | 42 (48.3%) |
| Computers & Mathematics | 19 (36.5%) | 33 (63.5%) |
| Architecture & Engineering | 26 (100.0%) | 0 (0.0%) |
| Life, Physical & Social Science | 0 (0.0%) | 9 (100.0%) |
| Community & Social Service | 159 (40.2%) | 237 (59.9%) |
| Education, Arts & Media | 0 (0.0%) | 6 (100.0%) |
| Legal Services & Support | 12 (57.1%) | 9 (42.9%) |
| Education Instruction & Library | 128 (44.1%) | 162 (55.9%) |
| Arts, Media & Entertainment | 19 (24.0%) | 60 (75.9%) |
| Health Diagnosing & Treating | 114 (65.5%) | 60 (34.5%) |
| Health Technologists | 105 (67.3%) | 51 (32.7%) |
| Total (Category) | 660 (49.0%) | 687 (51.0%) |
| Total (Overall) | 1,251 (50.9%) | 1,206 (49.1%) |
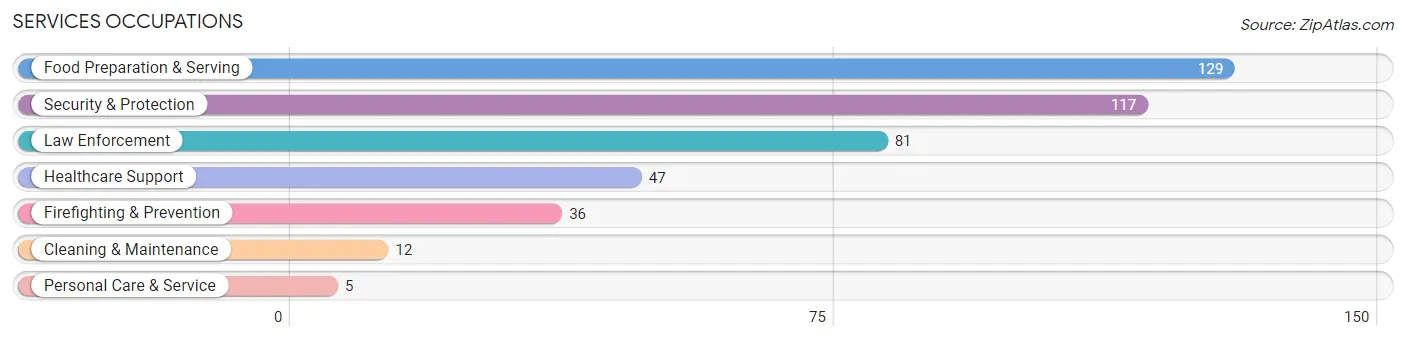
Services Occupations
The most common Services occupations in Marshfield are Food Preparation & Serving (129 | 5.2%), Security & Protection (117 | 4.8%), Law Enforcement (81 | 3.3%), Healthcare Support (47 | 1.9%), and Firefighting & Prevention (36 | 1.5%).
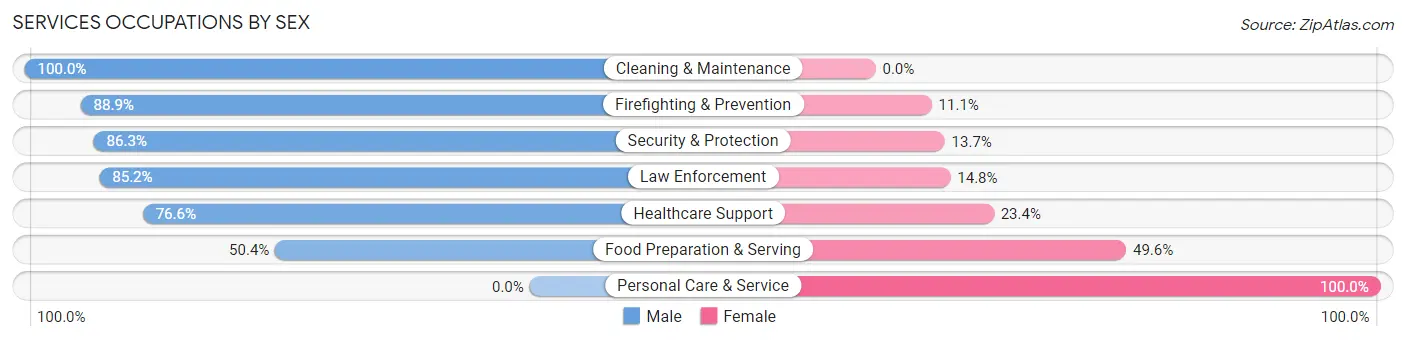
Services Occupations by Sex
Within the Services occupations in Marshfield, the most male-oriented occupations are Cleaning & Maintenance (100.0%), Firefighting & Prevention (88.9%), and Security & Protection (86.3%), while the most female-oriented occupations are Personal Care & Service (100.0%), Food Preparation & Serving (49.6%), and Healthcare Support (23.4%).
| Occupation | Male | Female |
| Healthcare Support | 36 (76.6%) | 11 (23.4%) |
| Security & Protection | 101 (86.3%) | 16 (13.7%) |
| Firefighting & Prevention | 32 (88.9%) | 4 (11.1%) |
| Law Enforcement | 69 (85.2%) | 12 (14.8%) |
| Food Preparation & Serving | 65 (50.4%) | 64 (49.6%) |
| Cleaning & Maintenance | 12 (100.0%) | 0 (0.0%) |
| Personal Care & Service | 0 (0.0%) | 5 (100.0%) |
| Total (Category) | 214 (69.0%) | 96 (31.0%) |
| Total (Overall) | 1,251 (50.9%) | 1,206 (49.1%) |
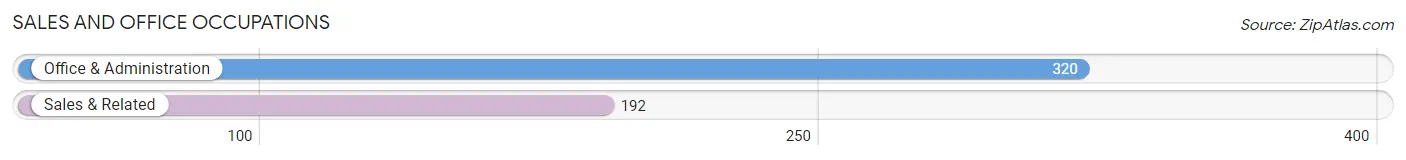
Sales and Office Occupations
The most common Sales and Office occupations in Marshfield are Office & Administration (320 | 13.0%), and Sales & Related (192 | 7.8%).
Sales and Office Occupations by Sex
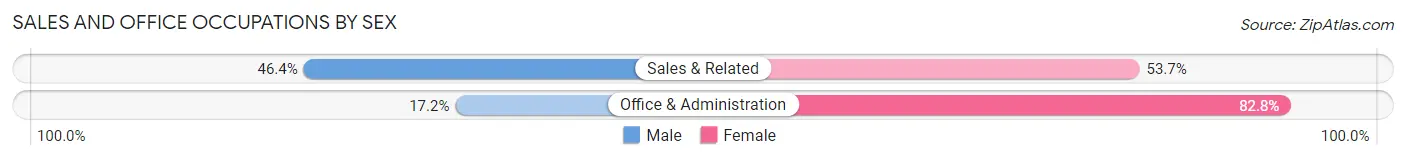
| Occupation | Male | Female |
| Sales & Related | 89 (46.4%) | 103 (53.6%) |
| Office & Administration | 55 (17.2%) | 265 (82.8%) |
| Total (Category) | 144 (28.1%) | 368 (71.9%) |
| Total (Overall) | 1,251 (50.9%) | 1,206 (49.1%) |
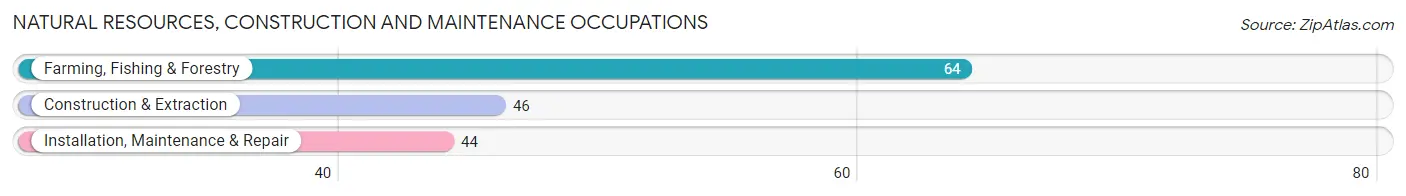
Natural Resources, Construction and Maintenance Occupations
The most common Natural Resources, Construction and Maintenance occupations in Marshfield are Farming, Fishing & Forestry (64 | 2.6%), Construction & Extraction (46 | 1.9%), and Installation, Maintenance & Repair (44 | 1.8%).
Natural Resources, Construction and Maintenance Occupations by Sex
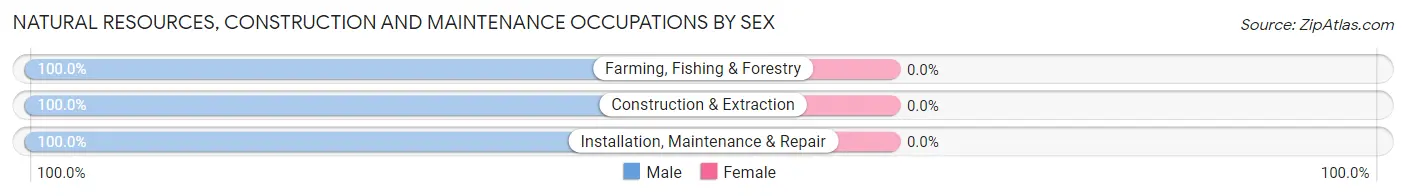
| Occupation | Male | Female |
| Farming, Fishing & Forestry | 64 (100.0%) | 0 (0.0%) |
| Construction & Extraction | 46 (100.0%) | 0 (0.0%) |
| Installation, Maintenance & Repair | 44 (100.0%) | 0 (0.0%) |
| Total (Category) | 154 (100.0%) | 0 (0.0%) |
| Total (Overall) | 1,251 (50.9%) | 1,206 (49.1%) |
Production, Transportation and Moving Occupations
The most common Production, Transportation and Moving occupations in Marshfield are Transportation (102 | 4.2%), and Production (32 | 1.3%).
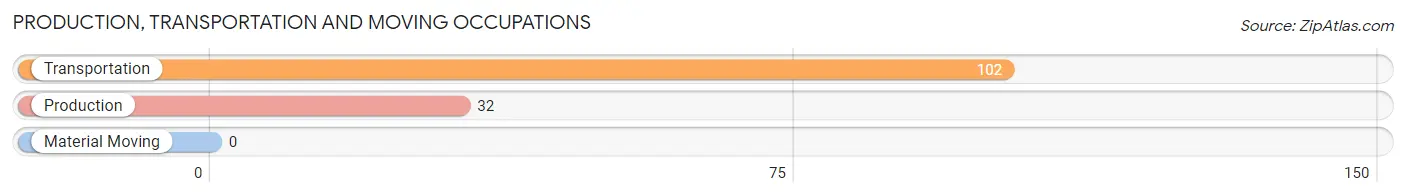
Production, Transportation and Moving Occupations by Sex
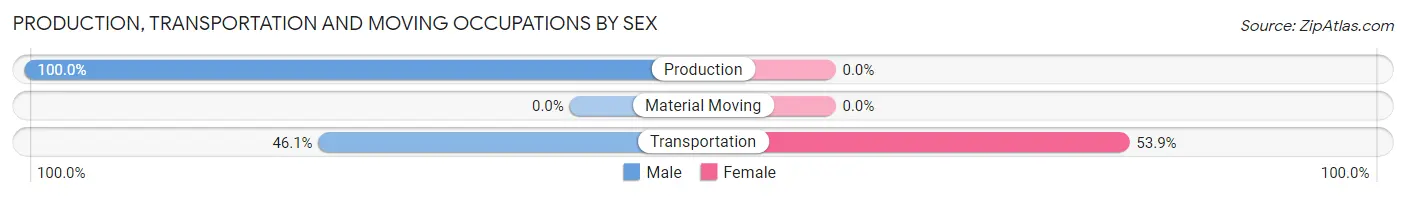
| Occupation | Male | Female |
| Production | 32 (100.0%) | 0 (0.0%) |
| Transportation | 47 (46.1%) | 55 (53.9%) |
| Material Moving | 0 (0.0%) | 0 (0.0%) |
| Total (Category) | 79 (59.0%) | 55 (41.0%) |
| Total (Overall) | 1,251 (50.9%) | 1,206 (49.1%) |
Employment Industries by Sex in Marshfield
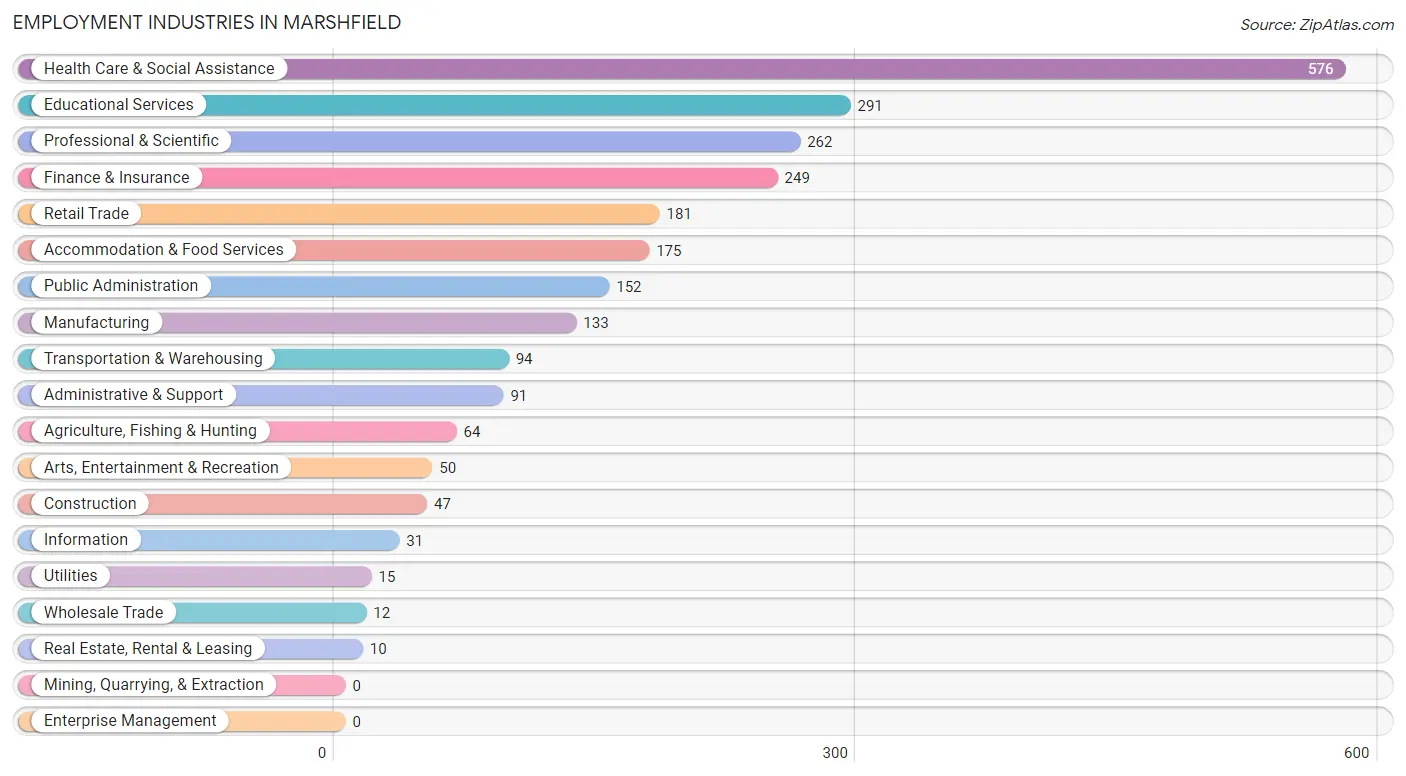
Employment Industries in Marshfield
The major employment industries in Marshfield include Health Care & Social Assistance (576 | 23.4%), Educational Services (291 | 11.8%), Professional & Scientific (262 | 10.7%), Finance & Insurance (249 | 10.1%), and Retail Trade (181 | 7.4%).
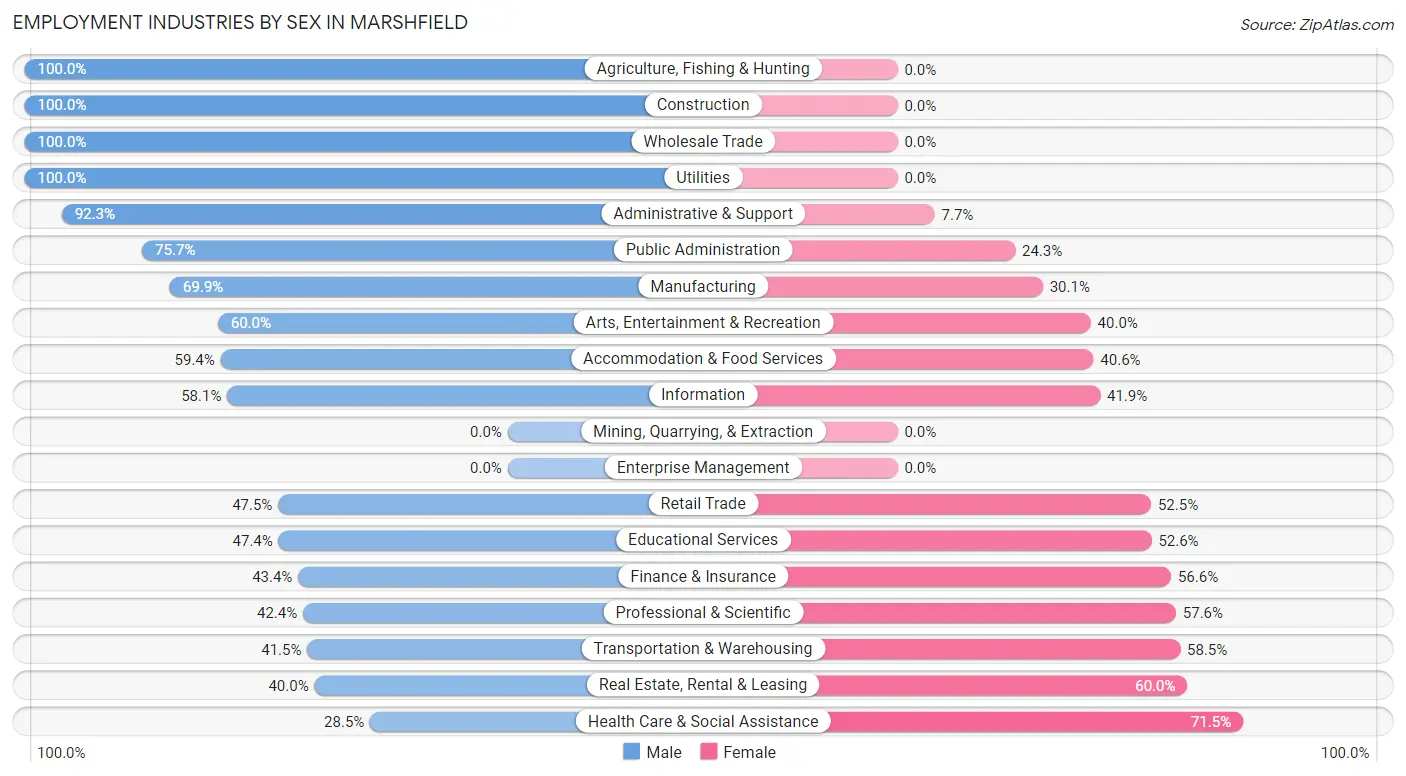
Employment Industries by Sex in Marshfield
The Marshfield industries that see more men than women are Agriculture, Fishing & Hunting (100.0%), Construction (100.0%), and Wholesale Trade (100.0%), whereas the industries that tend to have a higher number of women are Health Care & Social Assistance (71.5%), Real Estate, Rental & Leasing (60.0%), and Transportation & Warehousing (58.5%).
| Industry | Male | Female |
| Agriculture, Fishing & Hunting | 64 (100.0%) | 0 (0.0%) |
| Mining, Quarrying, & Extraction | 0 (0.0%) | 0 (0.0%) |
| Construction | 47 (100.0%) | 0 (0.0%) |
| Manufacturing | 93 (69.9%) | 40 (30.1%) |
| Wholesale Trade | 12 (100.0%) | 0 (0.0%) |
| Retail Trade | 86 (47.5%) | 95 (52.5%) |
| Transportation & Warehousing | 39 (41.5%) | 55 (58.5%) |
| Utilities | 15 (100.0%) | 0 (0.0%) |
| Information | 18 (58.1%) | 13 (41.9%) |
| Finance & Insurance | 108 (43.4%) | 141 (56.6%) |
| Real Estate, Rental & Leasing | 4 (40.0%) | 6 (60.0%) |
| Professional & Scientific | 111 (42.4%) | 151 (57.6%) |
| Enterprise Management | 0 (0.0%) | 0 (0.0%) |
| Administrative & Support | 84 (92.3%) | 7 (7.7%) |
| Educational Services | 138 (47.4%) | 153 (52.6%) |
| Health Care & Social Assistance | 164 (28.5%) | 412 (71.5%) |
| Arts, Entertainment & Recreation | 30 (60.0%) | 20 (40.0%) |
| Accommodation & Food Services | 104 (59.4%) | 71 (40.6%) |
| Public Administration | 115 (75.7%) | 37 (24.3%) |
| Total | 1,251 (50.9%) | 1,206 (49.1%) |
Education in Marshfield
School Enrollment in Marshfield
The most common levels of schooling among the 834 students in Marshfield are middle school (212 | 25.4%), college / undergraduate (194 | 23.3%), and elementary school (155 | 18.6%).
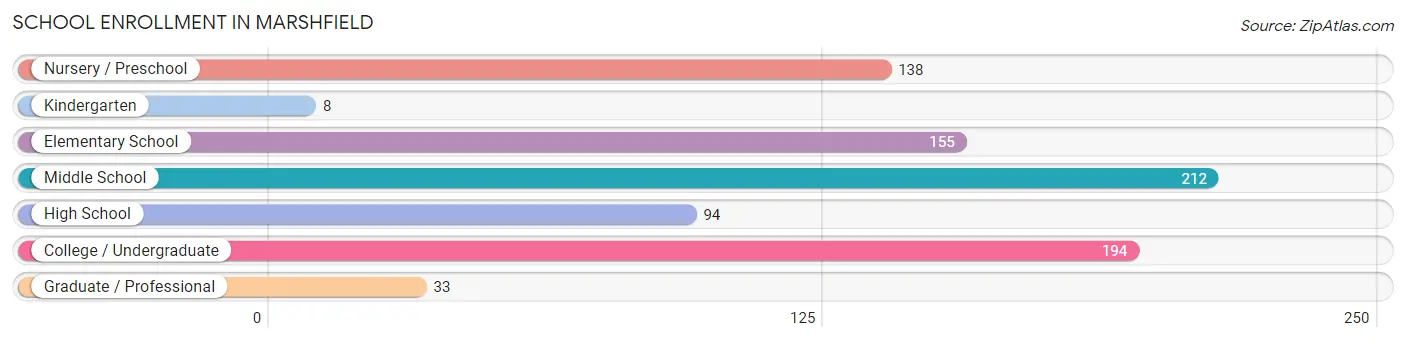
| School Level | # Students | % Students |
| Nursery / Preschool | 138 | 16.6% |
| Kindergarten | 8 | 1.0% |
| Elementary School | 155 | 18.6% |
| Middle School | 212 | 25.4% |
| High School | 94 | 11.3% |
| College / Undergraduate | 194 | 23.3% |
| Graduate / Professional | 33 | 4.0% |
| Total | 834 | 100.0% |
School Enrollment by Age by Funding Source in Marshfield
Out of a total of 834 students who are enrolled in schools in Marshfield, 108 (12.9%) attend a private institution, while the remaining 726 (87.1%) are enrolled in public schools. The age group of 25 to 34 year olds has the highest likelihood of being enrolled in private schools, with 3 (100.0% in the age bracket) enrolled. Conversely, the age group of 10 to 14 year olds has the lowest likelihood of being enrolled in a private school, with 209 (92.9% in the age bracket) attending a public institution.
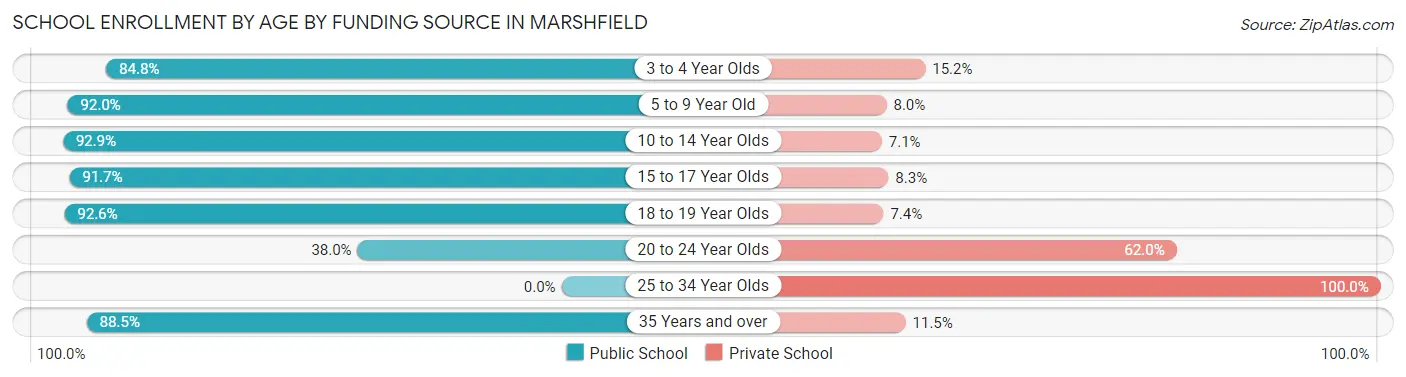
| Age Bracket | Public School | Private School |
| 3 to 4 Year Olds | 106 (84.8%) | 19 (15.2%) |
| 5 to 9 Year Old | 150 (92.0%) | 13 (8.0%) |
| 10 to 14 Year Olds | 209 (92.9%) | 16 (7.1%) |
| 15 to 17 Year Olds | 77 (91.7%) | 7 (8.3%) |
| 18 to 19 Year Olds | 50 (92.6%) | 4 (7.4%) |
| 20 to 24 Year Olds | 19 (38.0%) | 31 (62.0%) |
| 25 to 34 Year Olds | 0 (0.0%) | 3 (100.0%) |
| 35 Years and over | 115 (88.5%) | 15 (11.5%) |
| Total | 726 (87.1%) | 108 (12.9%) |
Educational Attainment by Field of Study in Marshfield
Business (476 | 26.1%), education (286 | 15.7%), social sciences (185 | 10.2%), science & technology (182 | 10.0%), and psychology (165 | 9.0%) are the most common fields of study among 1,823 individuals in Marshfield who have obtained a bachelor's degree or higher.
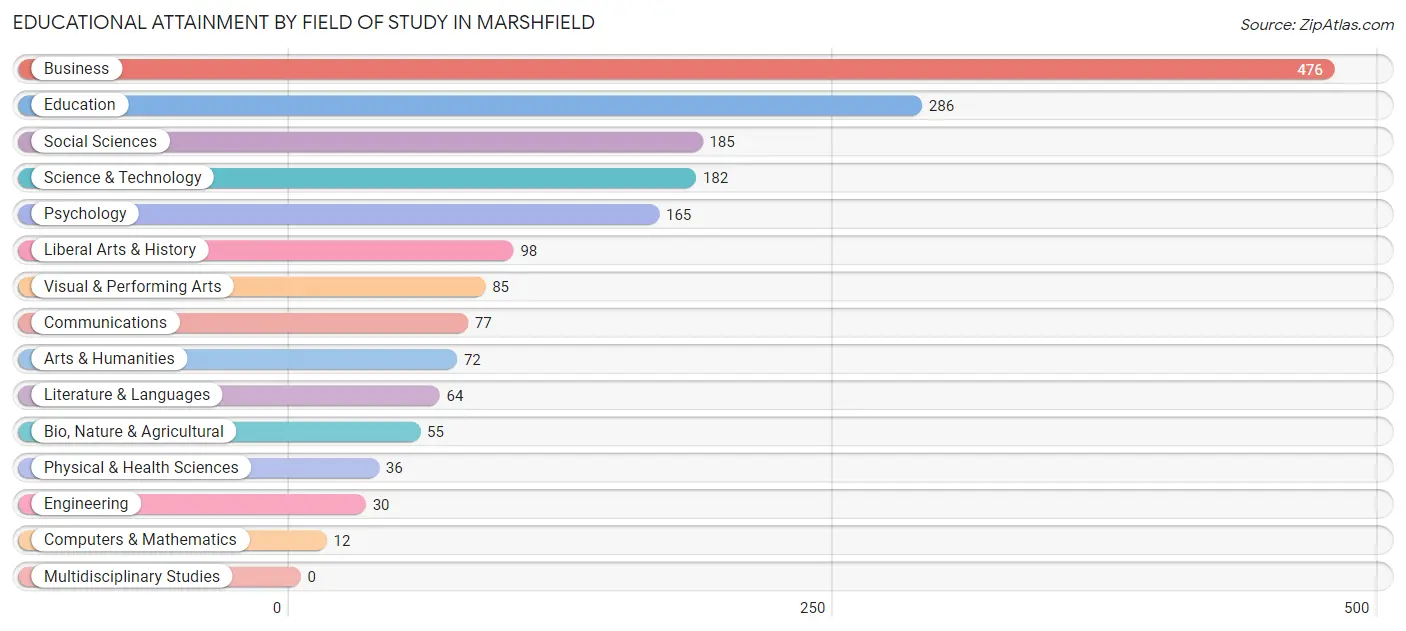
| Field of Study | # Graduates | % Graduates |
| Computers & Mathematics | 12 | 0.7% |
| Bio, Nature & Agricultural | 55 | 3.0% |
| Physical & Health Sciences | 36 | 2.0% |
| Psychology | 165 | 9.0% |
| Social Sciences | 185 | 10.2% |
| Engineering | 30 | 1.7% |
| Multidisciplinary Studies | 0 | 0.0% |
| Science & Technology | 182 | 10.0% |
| Business | 476 | 26.1% |
| Education | 286 | 15.7% |
| Literature & Languages | 64 | 3.5% |
| Liberal Arts & History | 98 | 5.4% |
| Visual & Performing Arts | 85 | 4.7% |
| Communications | 77 | 4.2% |
| Arts & Humanities | 72 | 4.0% |
| Total | 1,823 | 100.0% |
Transportation & Commute in Marshfield
Vehicle Availability by Sex in Marshfield
The most prevalent vehicle ownership categories in Marshfield are males with 2 vehicles (663, accounting for 53.4%) and females with 2 vehicles (686, making up 55.4%).
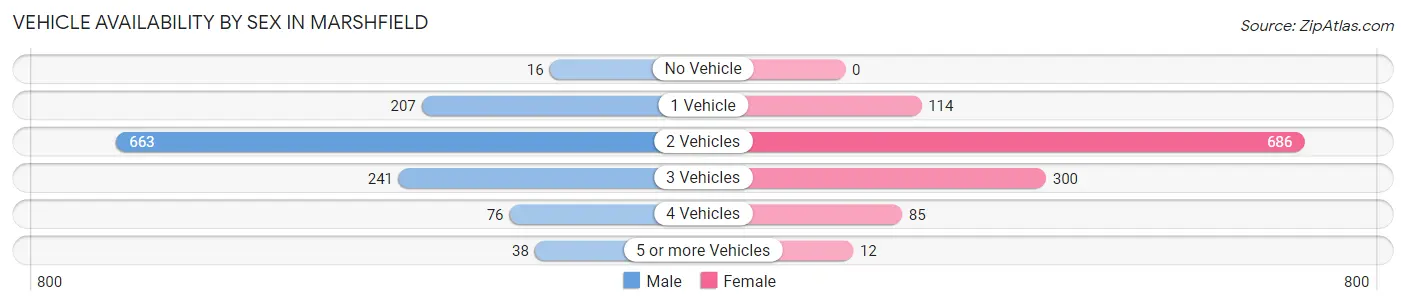
| Vehicles Available | Male | Female |
| No Vehicle | 16 (1.3%) | 0 (0.0%) |
| 1 Vehicle | 207 (16.7%) | 114 (9.5%) |
| 2 Vehicles | 663 (53.4%) | 686 (57.3%) |
| 3 Vehicles | 241 (19.4%) | 300 (25.1%) |
| 4 Vehicles | 76 (6.1%) | 85 (7.1%) |
| 5 or more Vehicles | 38 (3.1%) | 12 (1.0%) |
| Total | 1,241 (100.0%) | 1,197 (100.0%) |
Commute Time in Marshfield
The most frequently occuring commute durations in Marshfield are 60 to 89 minutes (345 commuters, 16.8%), 10 to 14 minutes (287 commuters, 14.0%), and 5 to 9 minutes (285 commuters, 13.9%).
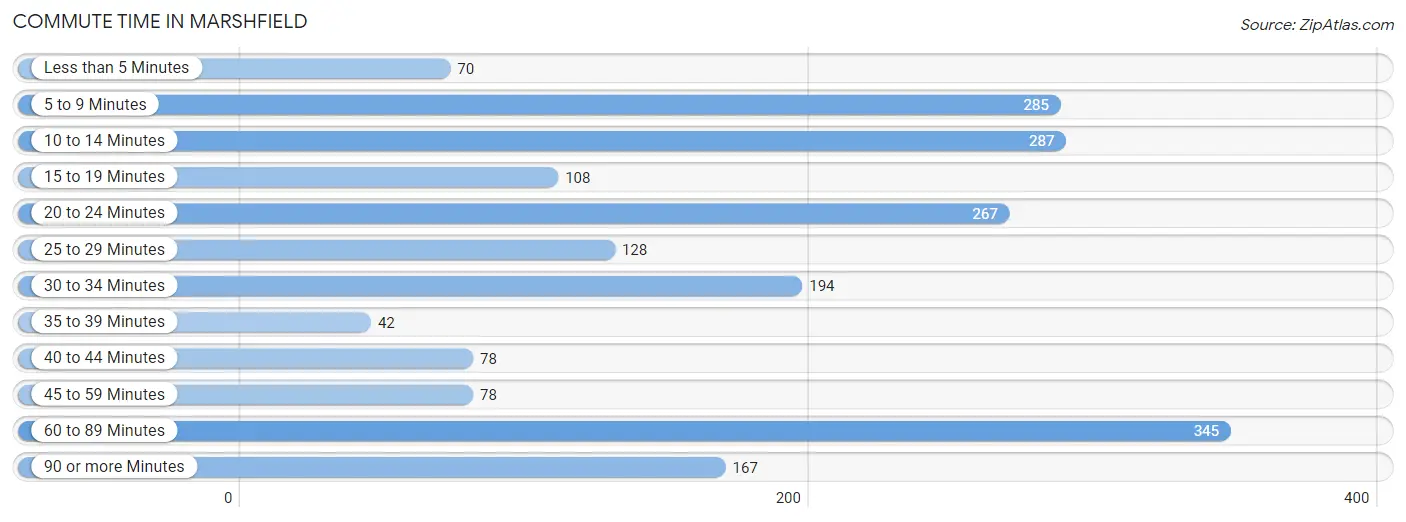
| Commute Time | # Commuters | % Commuters |
| Less than 5 Minutes | 70 | 3.4% |
| 5 to 9 Minutes | 285 | 13.9% |
| 10 to 14 Minutes | 287 | 14.0% |
| 15 to 19 Minutes | 108 | 5.3% |
| 20 to 24 Minutes | 267 | 13.0% |
| 25 to 29 Minutes | 128 | 6.2% |
| 30 to 34 Minutes | 194 | 9.5% |
| 35 to 39 Minutes | 42 | 2.1% |
| 40 to 44 Minutes | 78 | 3.8% |
| 45 to 59 Minutes | 78 | 3.8% |
| 60 to 89 Minutes | 345 | 16.8% |
| 90 or more Minutes | 167 | 8.2% |
Commute Time by Sex in Marshfield
The most common commute times in Marshfield are 60 to 89 minutes (251 commuters, 23.7%) for males and 10 to 14 minutes (191 commuters, 19.3%) for females.
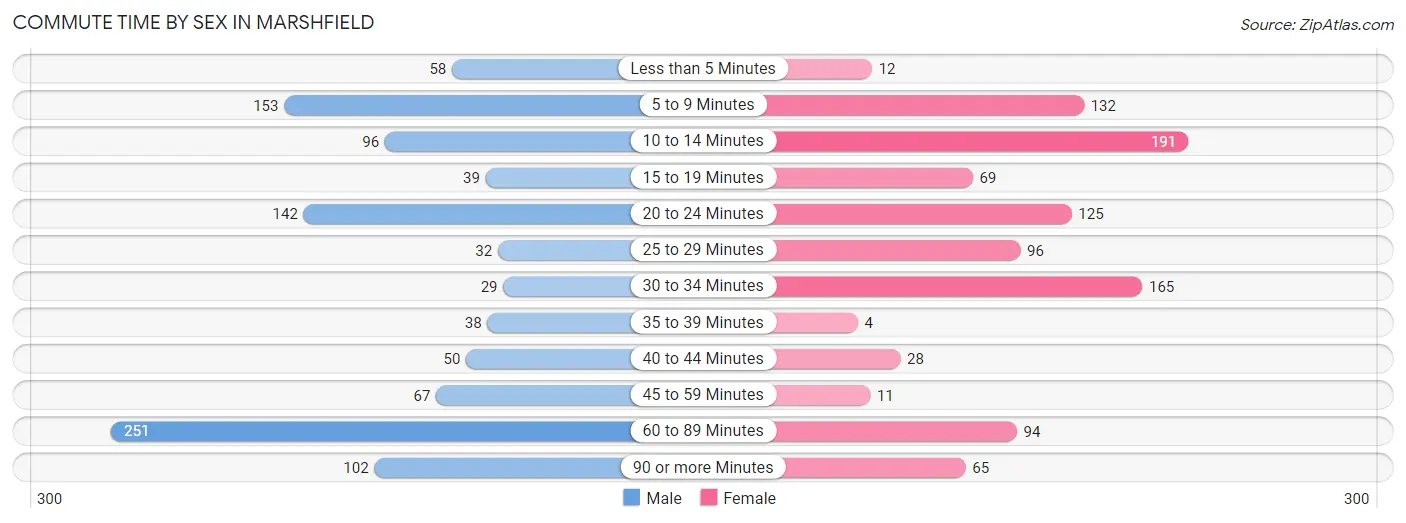
| Commute Time | Male | Female |
| Less than 5 Minutes | 58 (5.5%) | 12 (1.2%) |
| 5 to 9 Minutes | 153 (14.5%) | 132 (13.3%) |
| 10 to 14 Minutes | 96 (9.1%) | 191 (19.3%) |
| 15 to 19 Minutes | 39 (3.7%) | 69 (7.0%) |
| 20 to 24 Minutes | 142 (13.4%) | 125 (12.6%) |
| 25 to 29 Minutes | 32 (3.0%) | 96 (9.7%) |
| 30 to 34 Minutes | 29 (2.7%) | 165 (16.6%) |
| 35 to 39 Minutes | 38 (3.6%) | 4 (0.4%) |
| 40 to 44 Minutes | 50 (4.7%) | 28 (2.8%) |
| 45 to 59 Minutes | 67 (6.3%) | 11 (1.1%) |
| 60 to 89 Minutes | 251 (23.7%) | 94 (9.5%) |
| 90 or more Minutes | 102 (9.7%) | 65 (6.6%) |
Time of Departure to Work by Sex in Marshfield
The most frequent times of departure to work in Marshfield are 6:00 AM to 6:29 AM (198, 18.7%) for males and 7:00 AM to 7:29 AM (262, 26.4%) for females.
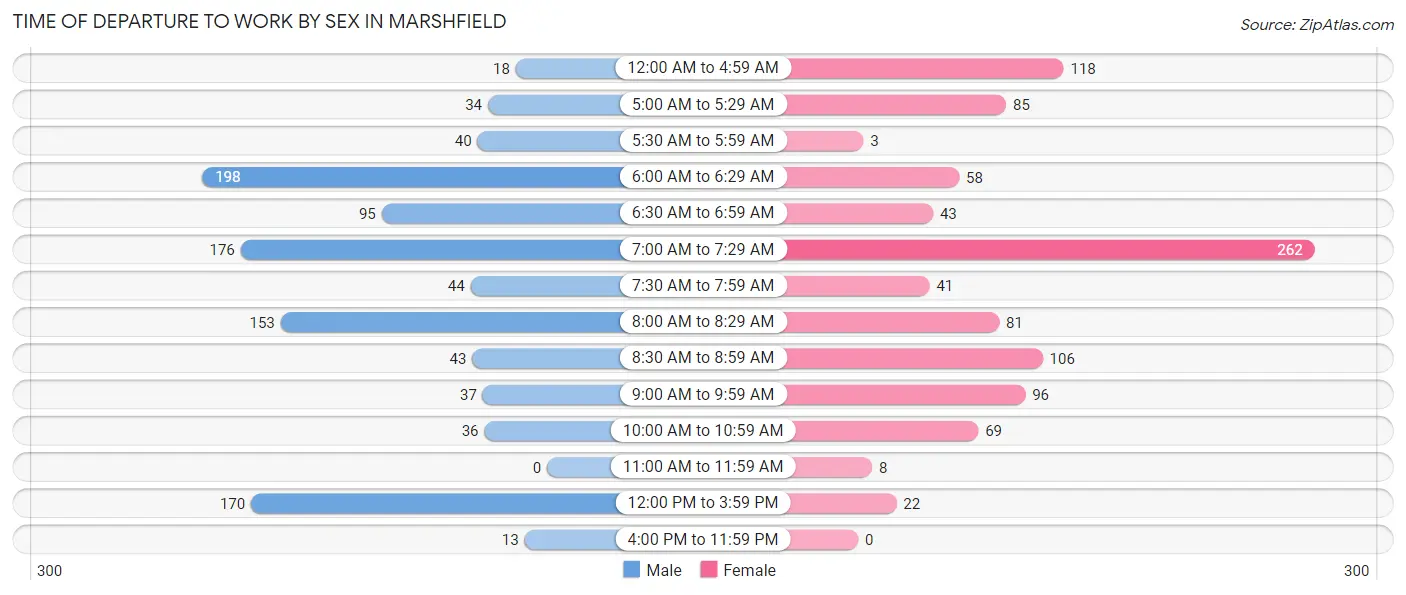
| Time of Departure | Male | Female |
| 12:00 AM to 4:59 AM | 18 (1.7%) | 118 (11.9%) |
| 5:00 AM to 5:29 AM | 34 (3.2%) | 85 (8.6%) |
| 5:30 AM to 5:59 AM | 40 (3.8%) | 3 (0.3%) |
| 6:00 AM to 6:29 AM | 198 (18.7%) | 58 (5.9%) |
| 6:30 AM to 6:59 AM | 95 (9.0%) | 43 (4.3%) |
| 7:00 AM to 7:29 AM | 176 (16.7%) | 262 (26.4%) |
| 7:30 AM to 7:59 AM | 44 (4.2%) | 41 (4.1%) |
| 8:00 AM to 8:29 AM | 153 (14.5%) | 81 (8.2%) |
| 8:30 AM to 8:59 AM | 43 (4.1%) | 106 (10.7%) |
| 9:00 AM to 9:59 AM | 37 (3.5%) | 96 (9.7%) |
| 10:00 AM to 10:59 AM | 36 (3.4%) | 69 (7.0%) |
| 11:00 AM to 11:59 AM | 0 (0.0%) | 8 (0.8%) |
| 12:00 PM to 3:59 PM | 170 (16.1%) | 22 (2.2%) |
| 4:00 PM to 11:59 PM | 13 (1.2%) | 0 (0.0%) |
| Total | 1,057 (100.0%) | 992 (100.0%) |
Housing Occupancy in Marshfield
Occupancy by Ownership in Marshfield
Of the total 1,896 dwellings in Marshfield, owner-occupied units account for 1,242 (65.5%), while renter-occupied units make up 654 (34.5%).
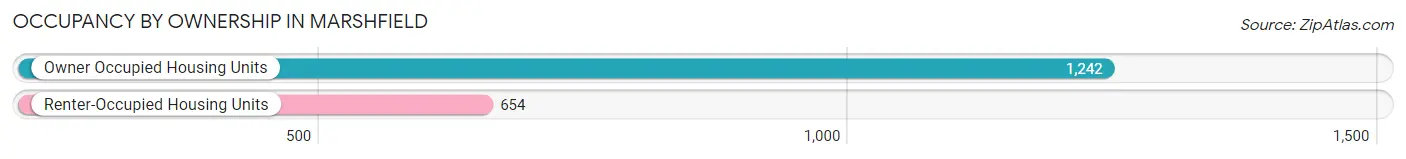
| Occupancy | # Housing Units | % Housing Units |
| Owner Occupied Housing Units | 1,242 | 65.5% |
| Renter-Occupied Housing Units | 654 | 34.5% |
| Total Occupied Housing Units | 1,896 | 100.0% |
Occupancy by Household Size in Marshfield
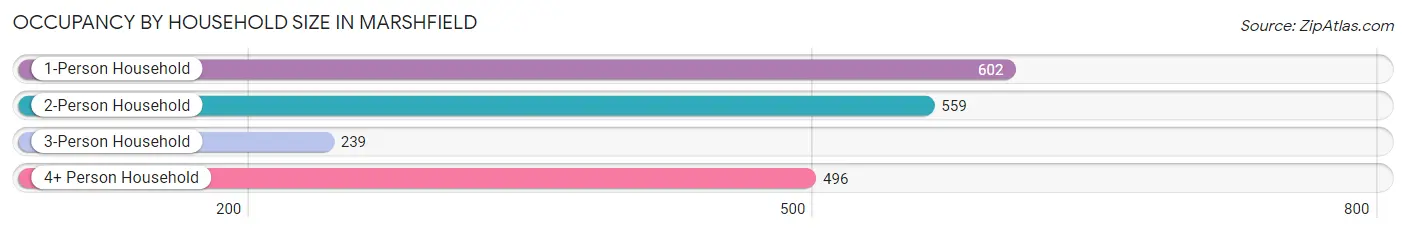
| Household Size | # Housing Units | % Housing Units |
| 1-Person Household | 602 | 31.8% |
| 2-Person Household | 559 | 29.5% |
| 3-Person Household | 239 | 12.6% |
| 4+ Person Household | 496 | 26.2% |
| Total Housing Units | 1,896 | 100.0% |
Occupancy by Ownership by Household Size in Marshfield
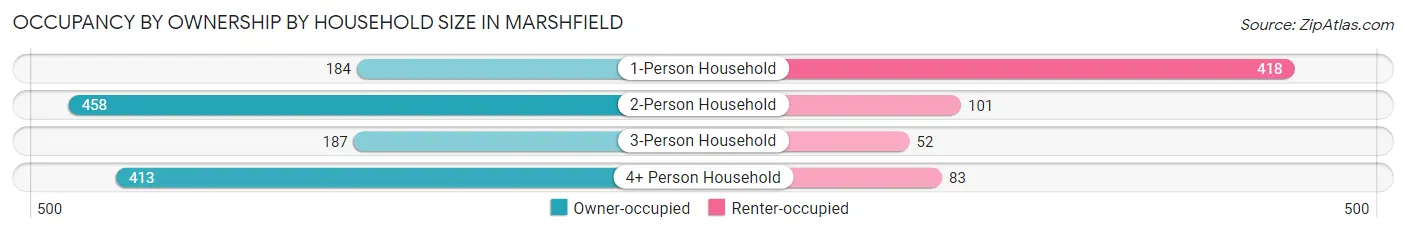
| Household Size | Owner-occupied | Renter-occupied |
| 1-Person Household | 184 (30.6%) | 418 (69.4%) |
| 2-Person Household | 458 (81.9%) | 101 (18.1%) |
| 3-Person Household | 187 (78.2%) | 52 (21.8%) |
| 4+ Person Household | 413 (83.3%) | 83 (16.7%) |
| Total Housing Units | 1,242 (65.5%) | 654 (34.5%) |
Occupancy by Educational Attainment in Marshfield
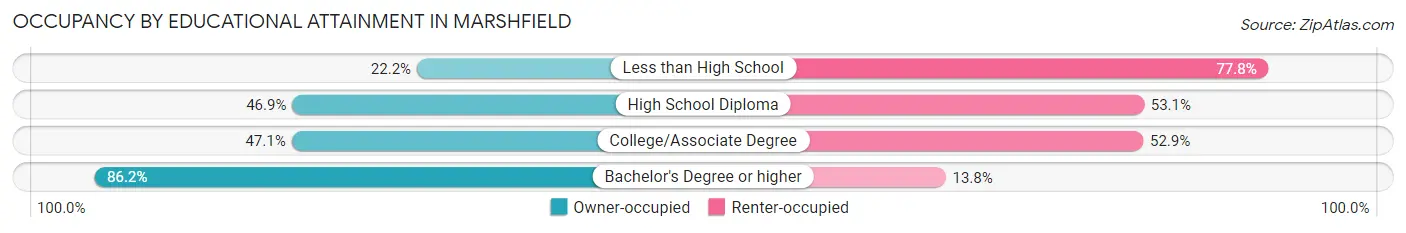
| Household Size | Owner-occupied | Renter-occupied |
| Less than High School | 8 (22.2%) | 28 (77.8%) |
| High School Diploma | 169 (46.9%) | 191 (53.1%) |
| College/Associate Degree | 275 (47.1%) | 309 (52.9%) |
| Bachelor's Degree or higher | 790 (86.2%) | 126 (13.8%) |
Occupancy by Age of Householder in Marshfield
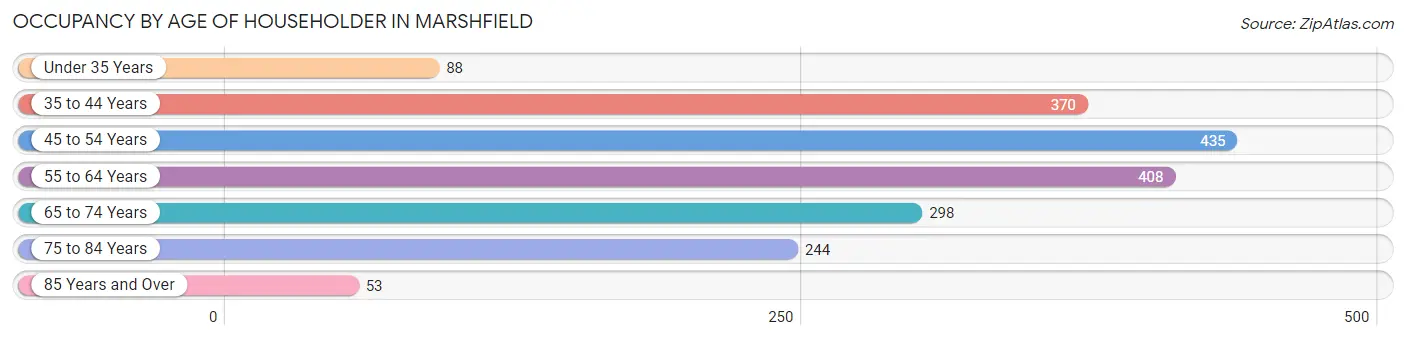
| Age Bracket | # Households | % Households |
| Under 35 Years | 88 | 4.6% |
| 35 to 44 Years | 370 | 19.5% |
| 45 to 54 Years | 435 | 22.9% |
| 55 to 64 Years | 408 | 21.5% |
| 65 to 74 Years | 298 | 15.7% |
| 75 to 84 Years | 244 | 12.9% |
| 85 Years and Over | 53 | 2.8% |
| Total | 1,896 | 100.0% |
Housing Finances in Marshfield
Median Income by Occupancy in Marshfield
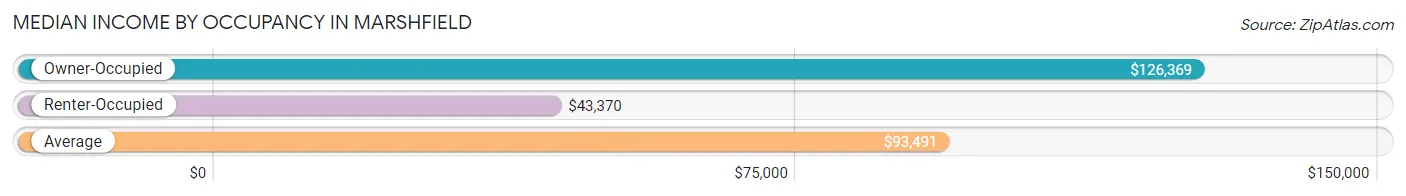
| Occupancy Type | # Households | Median Income |
| Owner-Occupied | 1,242 (65.5%) | $126,369 |
| Renter-Occupied | 654 (34.5%) | $43,370 |
| Average | 1,896 (100.0%) | $93,491 |
Occupancy by Householder Income Bracket in Marshfield
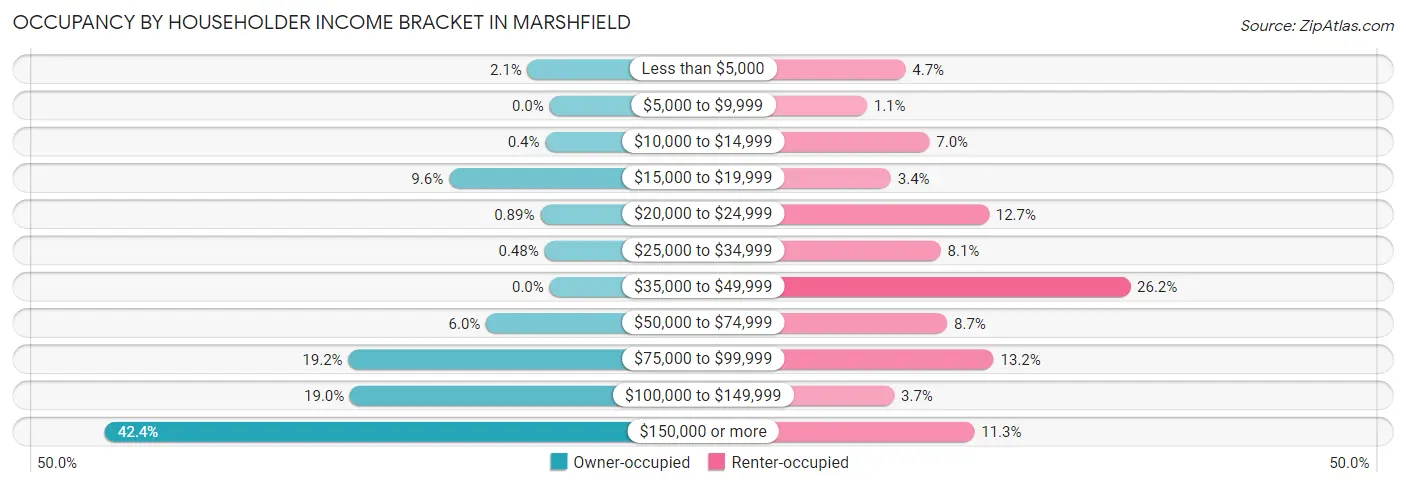
| Income Bracket | Owner-occupied | Renter-occupied |
| Less than $5,000 | 26 (2.1%) | 31 (4.7%) |
| $5,000 to $9,999 | 0 (0.0%) | 7 (1.1%) |
| $10,000 to $14,999 | 5 (0.4%) | 46 (7.0%) |
| $15,000 to $19,999 | 119 (9.6%) | 22 (3.4%) |
| $20,000 to $24,999 | 11 (0.9%) | 83 (12.7%) |
| $25,000 to $34,999 | 6 (0.5%) | 53 (8.1%) |
| $35,000 to $49,999 | 0 (0.0%) | 171 (26.2%) |
| $50,000 to $74,999 | 75 (6.0%) | 57 (8.7%) |
| $75,000 to $99,999 | 238 (19.2%) | 86 (13.2%) |
| $100,000 to $149,999 | 236 (19.0%) | 24 (3.7%) |
| $150,000 or more | 526 (42.3%) | 74 (11.3%) |
| Total | 1,242 (100.0%) | 654 (100.0%) |
Monthly Housing Cost Tiers in Marshfield
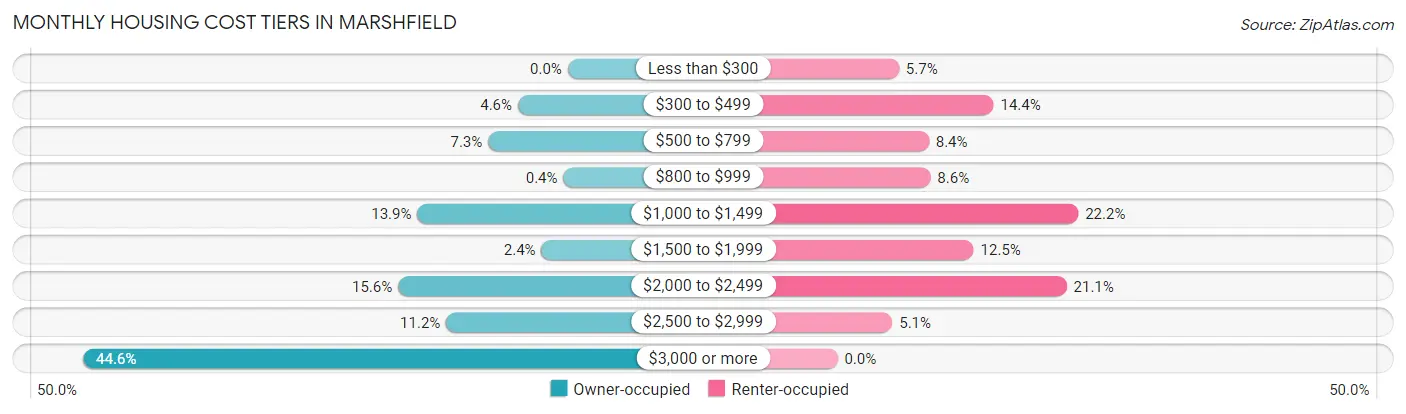
| Monthly Cost | Owner-occupied | Renter-occupied |
| Less than $300 | 0 (0.0%) | 37 (5.7%) |
| $300 to $499 | 57 (4.6%) | 94 (14.4%) |
| $500 to $799 | 91 (7.3%) | 55 (8.4%) |
| $800 to $999 | 5 (0.4%) | 56 (8.6%) |
| $1,000 to $1,499 | 172 (13.9%) | 145 (22.2%) |
| $1,500 to $1,999 | 30 (2.4%) | 82 (12.5%) |
| $2,000 to $2,499 | 194 (15.6%) | 138 (21.1%) |
| $2,500 to $2,999 | 139 (11.2%) | 33 (5.1%) |
| $3,000 or more | 554 (44.6%) | 0 (0.0%) |
| Total | 1,242 (100.0%) | 654 (100.0%) |
Physical Housing Characteristics in Marshfield
Housing Structures in Marshfield
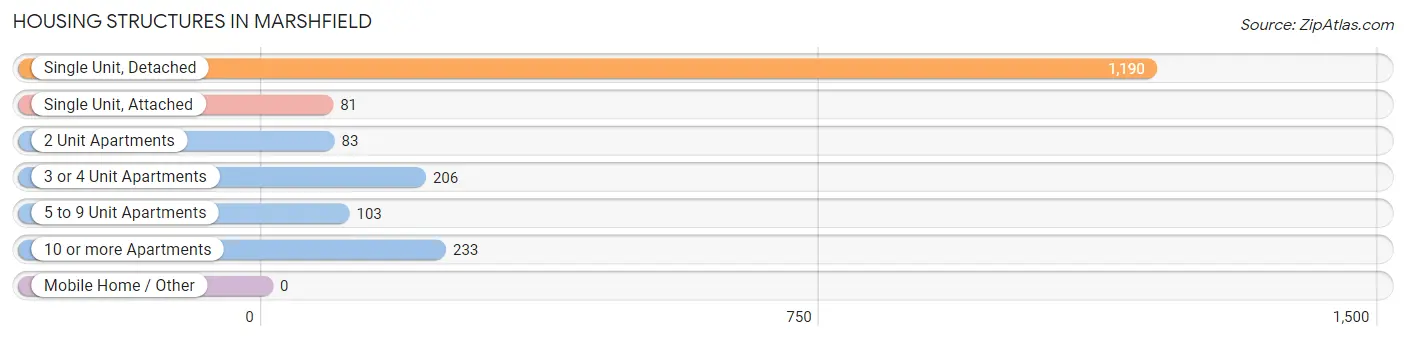
| Structure Type | # Housing Units | % Housing Units |
| Single Unit, Detached | 1,190 | 62.8% |
| Single Unit, Attached | 81 | 4.3% |
| 2 Unit Apartments | 83 | 4.4% |
| 3 or 4 Unit Apartments | 206 | 10.9% |
| 5 to 9 Unit Apartments | 103 | 5.4% |
| 10 or more Apartments | 233 | 12.3% |
| Mobile Home / Other | 0 | 0.0% |
| Total | 1,896 | 100.0% |
Housing Structures by Occupancy in Marshfield
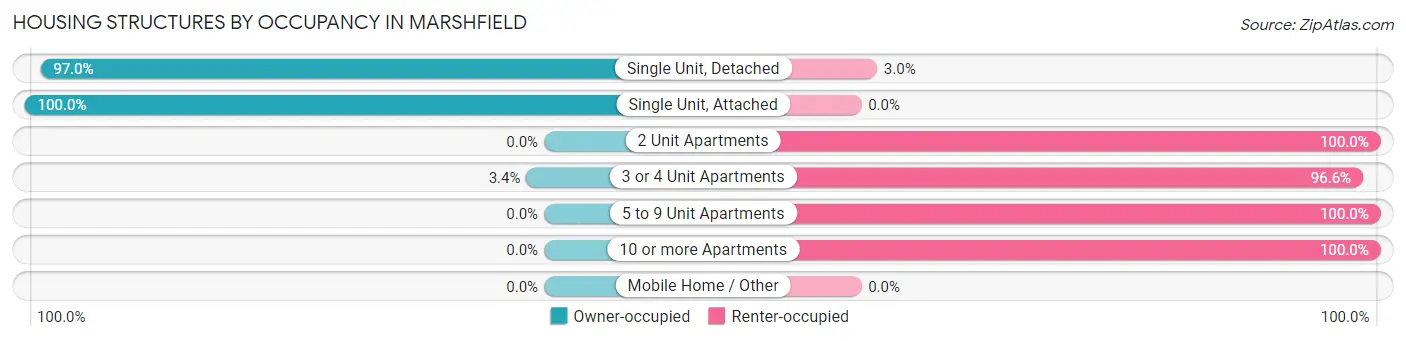
| Structure Type | Owner-occupied | Renter-occupied |
| Single Unit, Detached | 1,154 (97.0%) | 36 (3.0%) |
| Single Unit, Attached | 81 (100.0%) | 0 (0.0%) |
| 2 Unit Apartments | 0 (0.0%) | 83 (100.0%) |
| 3 or 4 Unit Apartments | 7 (3.4%) | 199 (96.6%) |
| 5 to 9 Unit Apartments | 0 (0.0%) | 103 (100.0%) |
| 10 or more Apartments | 0 (0.0%) | 233 (100.0%) |
| Mobile Home / Other | 0 (0.0%) | 0 (0.0%) |
| Total | 1,242 (65.5%) | 654 (34.5%) |
Housing Structures by Number of Rooms in Marshfield
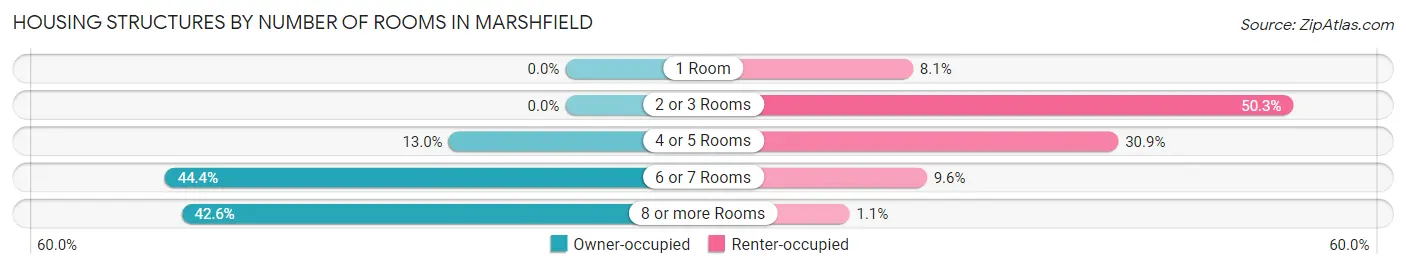
| Number of Rooms | Owner-occupied | Renter-occupied |
| 1 Room | 0 (0.0%) | 53 (8.1%) |
| 2 or 3 Rooms | 0 (0.0%) | 329 (50.3%) |
| 4 or 5 Rooms | 161 (13.0%) | 202 (30.9%) |
| 6 or 7 Rooms | 552 (44.4%) | 63 (9.6%) |
| 8 or more Rooms | 529 (42.6%) | 7 (1.1%) |
| Total | 1,242 (100.0%) | 654 (100.0%) |
Housing Structure by Heating Type in Marshfield
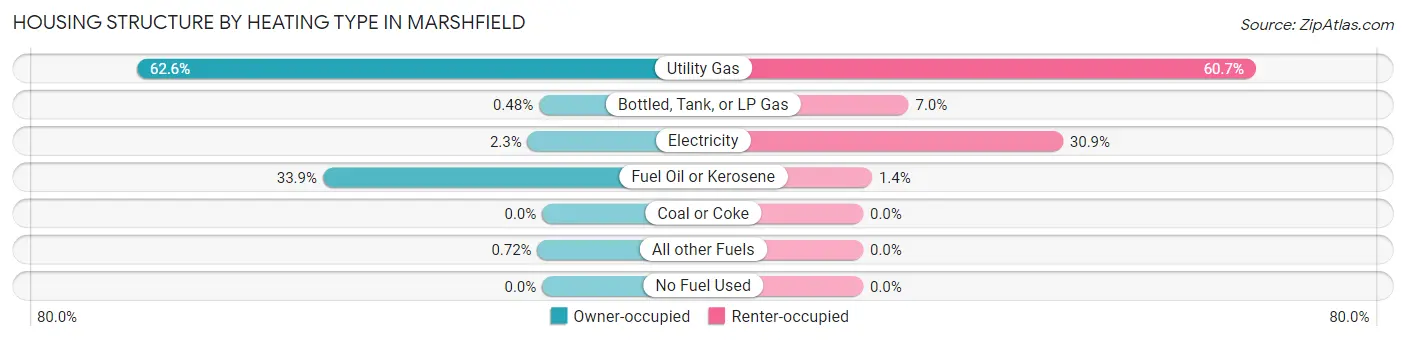
| Heating Type | Owner-occupied | Renter-occupied |
| Utility Gas | 778 (62.6%) | 397 (60.7%) |
| Bottled, Tank, or LP Gas | 6 (0.5%) | 46 (7.0%) |
| Electricity | 28 (2.2%) | 202 (30.9%) |
| Fuel Oil or Kerosene | 421 (33.9%) | 9 (1.4%) |
| Coal or Coke | 0 (0.0%) | 0 (0.0%) |
| All other Fuels | 9 (0.7%) | 0 (0.0%) |
| No Fuel Used | 0 (0.0%) | 0 (0.0%) |
| Total | 1,242 (100.0%) | 654 (100.0%) |
Household Vehicle Usage in Marshfield
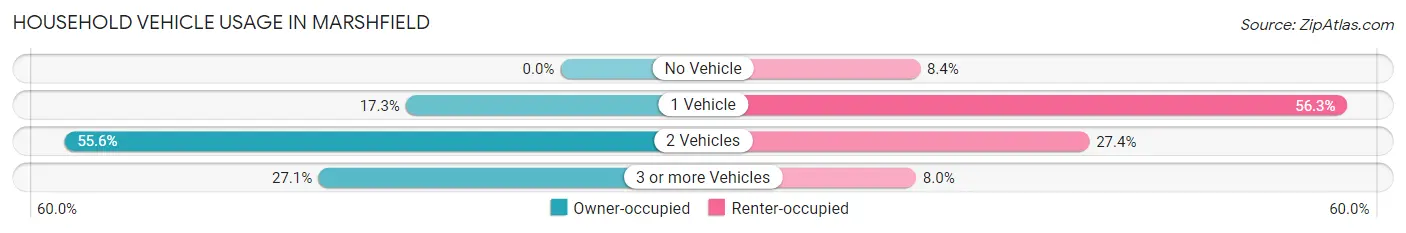
| Vehicles per Household | Owner-occupied | Renter-occupied |
| No Vehicle | 0 (0.0%) | 55 (8.4%) |
| 1 Vehicle | 215 (17.3%) | 368 (56.3%) |
| 2 Vehicles | 690 (55.6%) | 179 (27.4%) |
| 3 or more Vehicles | 337 (27.1%) | 52 (8.0%) |
| Total | 1,242 (100.0%) | 654 (100.0%) |
Real Estate & Mortgages in Marshfield
Real Estate and Mortgage Overview in Marshfield
| Characteristic | Without Mortgage | With Mortgage |
| Housing Units | 387 | 855 |
| Median Property Value | $556,900 | $579,100 |
| Median Household Income | $93,608 | $489 |
| Monthly Housing Costs | $1,071 | $490 |
| Real Estate Taxes | $5,898 | $0 |
Property Value by Mortgage Status in Marshfield
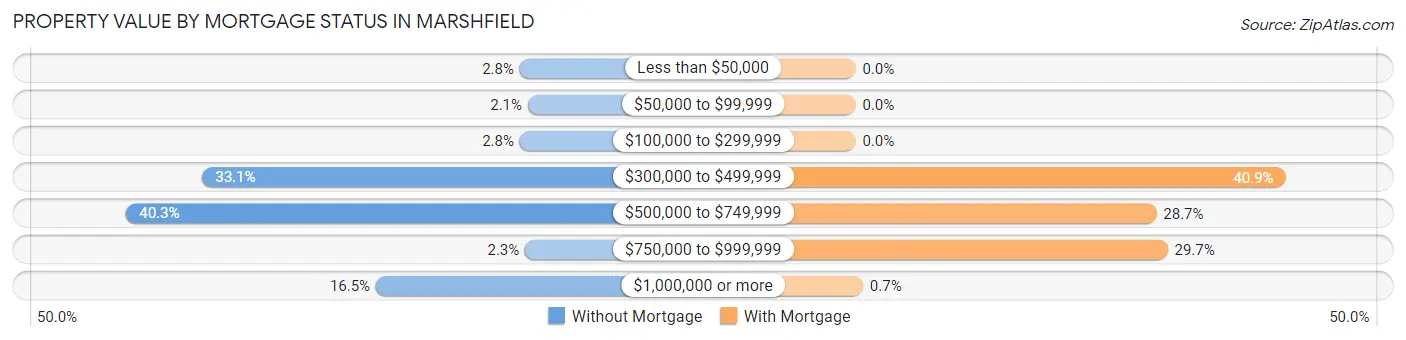
| Property Value | Without Mortgage | With Mortgage |
| Less than $50,000 | 11 (2.8%) | 0 (0.0%) |
| $50,000 to $99,999 | 8 (2.1%) | 0 (0.0%) |
| $100,000 to $299,999 | 11 (2.8%) | 0 (0.0%) |
| $300,000 to $499,999 | 128 (33.1%) | 350 (40.9%) |
| $500,000 to $749,999 | 156 (40.3%) | 245 (28.6%) |
| $750,000 to $999,999 | 9 (2.3%) | 254 (29.7%) |
| $1,000,000 or more | 64 (16.5%) | 6 (0.7%) |
| Total | 387 (100.0%) | 855 (100.0%) |
Household Income by Mortgage Status in Marshfield
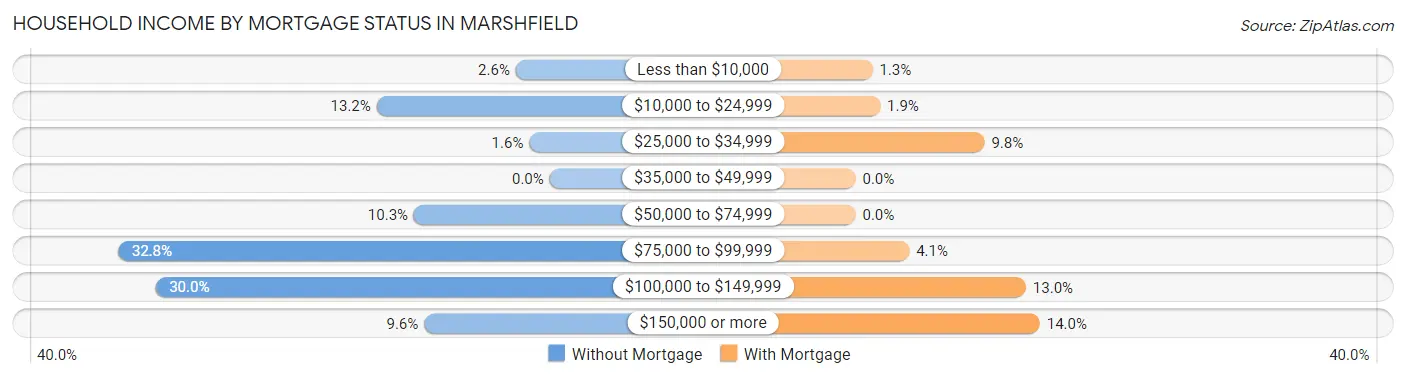
| Household Income | Without Mortgage | With Mortgage |
| Less than $10,000 | 10 (2.6%) | 11 (1.3%) |
| $10,000 to $24,999 | 51 (13.2%) | 16 (1.9%) |
| $25,000 to $34,999 | 6 (1.5%) | 84 (9.8%) |
| $35,000 to $49,999 | 0 (0.0%) | 0 (0.0%) |
| $50,000 to $74,999 | 40 (10.3%) | 0 (0.0%) |
| $75,000 to $99,999 | 127 (32.8%) | 35 (4.1%) |
| $100,000 to $149,999 | 116 (30.0%) | 111 (13.0%) |
| $150,000 or more | 37 (9.6%) | 120 (14.0%) |
| Total | 387 (100.0%) | 855 (100.0%) |
Property Value to Household Income Ratio in Marshfield
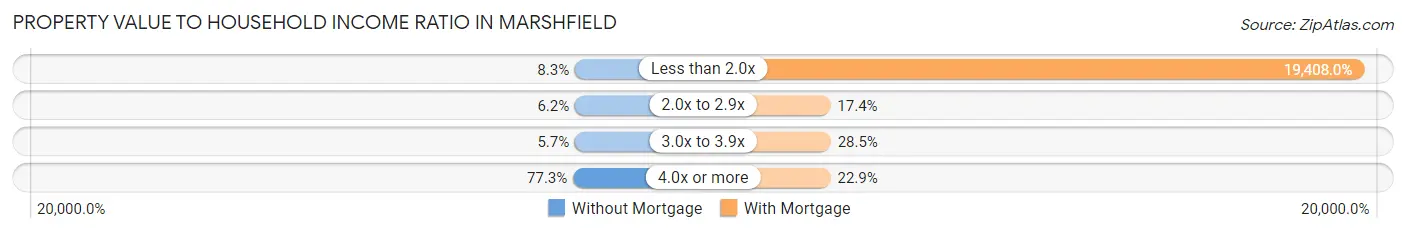
| Value-to-Income Ratio | Without Mortgage | With Mortgage |
| Less than 2.0x | 32 (8.3%) | 165,938 (19,407.9%) |
| 2.0x to 2.9x | 24 (6.2%) | 149 (17.4%) |
| 3.0x to 3.9x | 22 (5.7%) | 244 (28.5%) |
| 4.0x or more | 299 (77.3%) | 196 (22.9%) |
| Total | 387 (100.0%) | 855 (100.0%) |
Real Estate Taxes by Mortgage Status in Marshfield
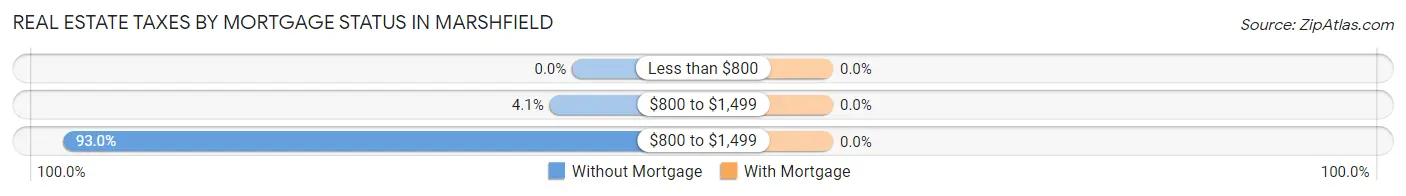
| Property Taxes | Without Mortgage | With Mortgage |
| Less than $800 | 0 (0.0%) | 0 (0.0%) |
| $800 to $1,499 | 16 (4.1%) | 0 (0.0%) |
| $800 to $1,499 | 360 (93.0%) | 0 (0.0%) |
| Total | 387 (100.0%) | 855 (100.0%) |
Health & Disability in Marshfield
Health Insurance Coverage by Age in Marshfield
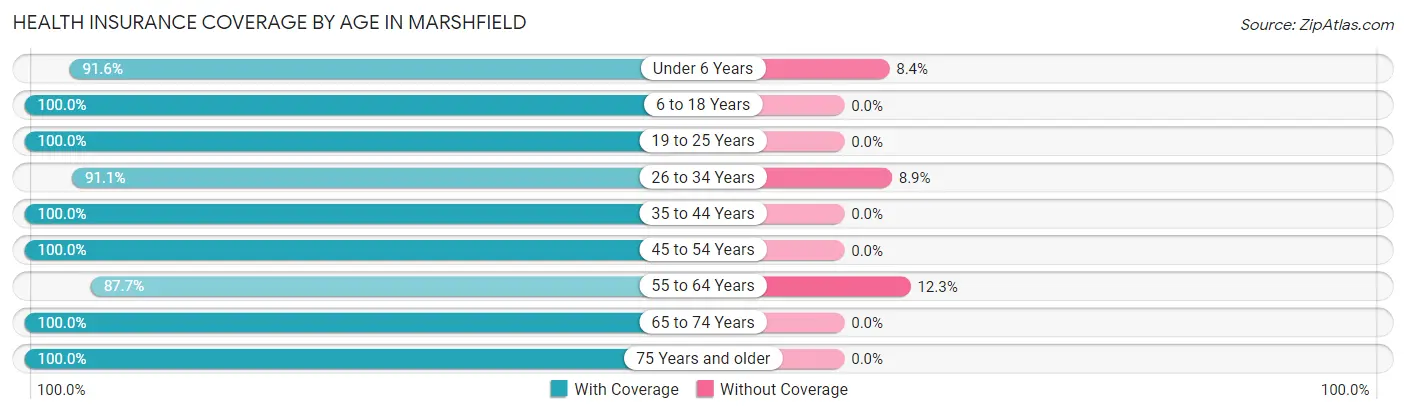
| Age Bracket | With Coverage | Without Coverage |
| Under 6 Years | 404 (91.6%) | 37 (8.4%) |
| 6 to 18 Years | 844 (100.0%) | 0 (0.0%) |
| 19 to 25 Years | 392 (100.0%) | 0 (0.0%) |
| 26 to 34 Years | 144 (91.1%) | 14 (8.9%) |
| 35 to 44 Years | 716 (100.0%) | 0 (0.0%) |
| 45 to 54 Years | 763 (100.0%) | 0 (0.0%) |
| 55 to 64 Years | 689 (87.7%) | 97 (12.3%) |
| 65 to 74 Years | 392 (100.0%) | 0 (0.0%) |
| 75 Years and older | 376 (100.0%) | 0 (0.0%) |
| Total | 4,720 (97.0%) | 148 (3.0%) |
Health Insurance Coverage by Citizenship Status in Marshfield
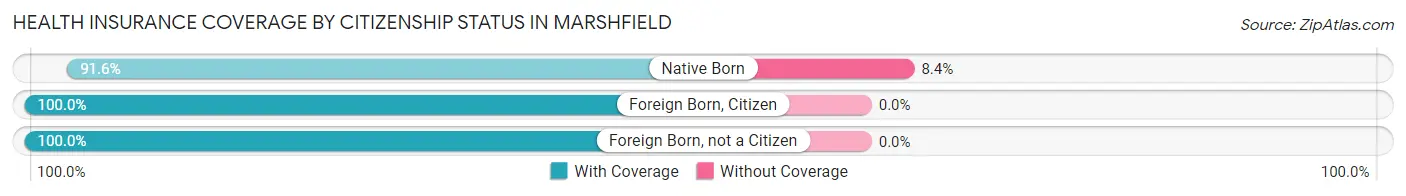
| Citizenship Status | With Coverage | Without Coverage |
| Native Born | 404 (91.6%) | 37 (8.4%) |
| Foreign Born, Citizen | 844 (100.0%) | 0 (0.0%) |
| Foreign Born, not a Citizen | 392 (100.0%) | 0 (0.0%) |
Health Insurance Coverage by Household Income in Marshfield
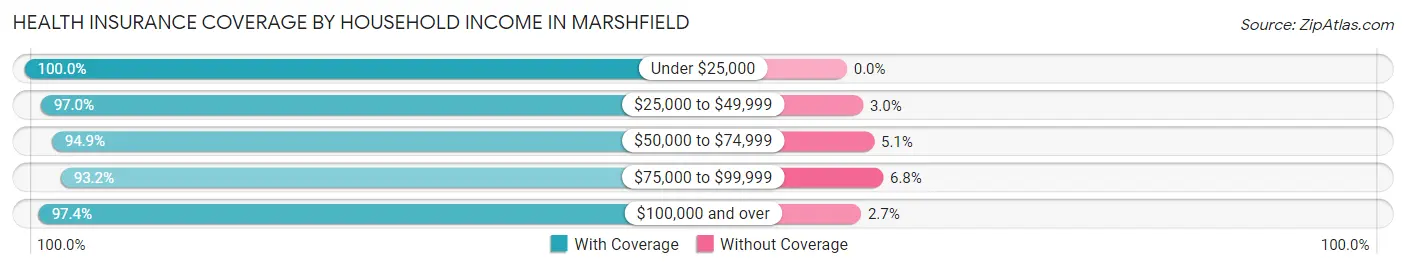
| Household Income | With Coverage | Without Coverage |
| Under $25,000 | 863 (100.0%) | 0 (0.0%) |
| $25,000 to $49,999 | 384 (97.0%) | 12 (3.0%) |
| $50,000 to $74,999 | 186 (94.9%) | 10 (5.1%) |
| $75,000 to $99,999 | 810 (93.2%) | 59 (6.8%) |
| $100,000 and over | 2,463 (97.4%) | 67 (2.6%) |
Public vs Private Health Insurance Coverage by Age in Marshfield
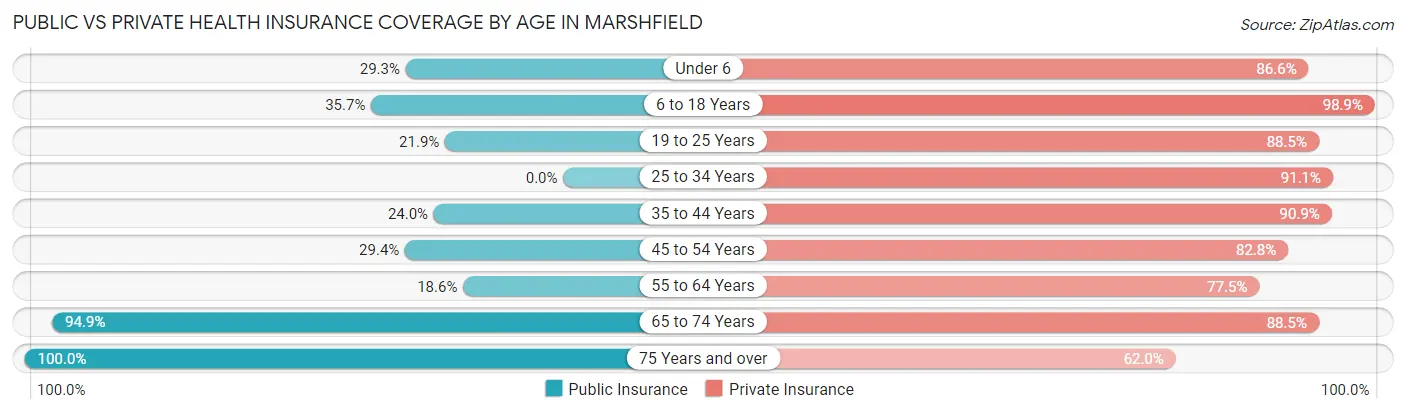
| Age Bracket | Public Insurance | Private Insurance |
| Under 6 | 129 (29.2%) | 382 (86.6%) |
| 6 to 18 Years | 301 (35.7%) | 835 (98.9%) |
| 19 to 25 Years | 86 (21.9%) | 347 (88.5%) |
| 25 to 34 Years | 0 (0.0%) | 144 (91.1%) |
| 35 to 44 Years | 172 (24.0%) | 651 (90.9%) |
| 45 to 54 Years | 224 (29.4%) | 632 (82.8%) |
| 55 to 64 Years | 146 (18.6%) | 609 (77.5%) |
| 65 to 74 Years | 372 (94.9%) | 347 (88.5%) |
| 75 Years and over | 376 (100.0%) | 233 (62.0%) |
| Total | 1,806 (37.1%) | 4,180 (85.9%) |
Disability Status by Sex by Age in Marshfield
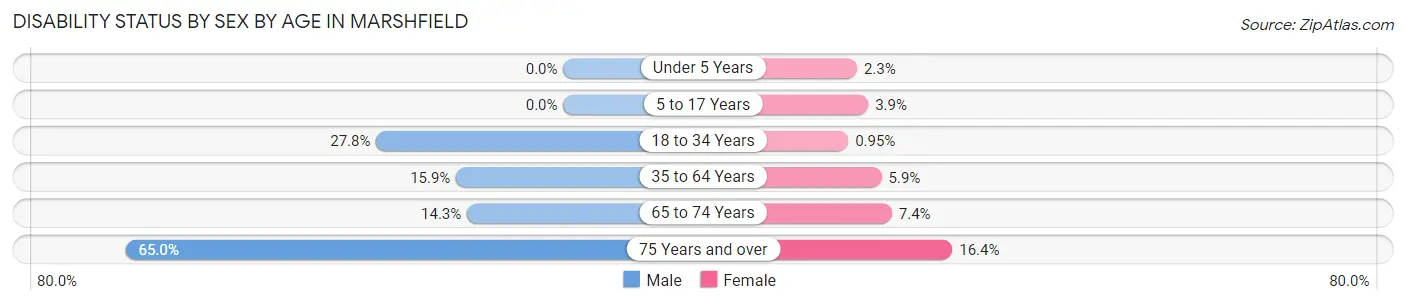
| Age Bracket | Male | Female |
| Under 5 Years | 0 (0.0%) | 5 (2.2%) |
| 5 to 17 Years | 0 (0.0%) | 14 (3.9%) |
| 18 to 34 Years | 80 (27.8%) | 3 (0.9%) |
| 35 to 64 Years | 188 (15.9%) | 64 (5.9%) |
| 65 to 74 Years | 31 (14.3%) | 13 (7.4%) |
| 75 Years and over | 78 (65.0%) | 42 (16.4%) |
Disability Class by Sex by Age in Marshfield
Disability Class: Hearing Difficulty
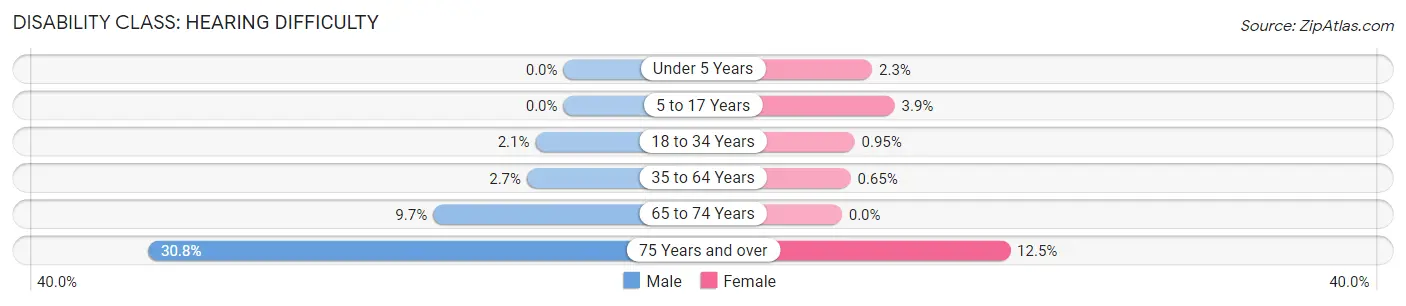
| Age Bracket | Male | Female |
| Under 5 Years | 0 (0.0%) | 5 (2.2%) |
| 5 to 17 Years | 0 (0.0%) | 14 (3.9%) |
| 18 to 34 Years | 6 (2.1%) | 3 (0.9%) |
| 35 to 64 Years | 32 (2.7%) | 7 (0.6%) |
| 65 to 74 Years | 21 (9.7%) | 0 (0.0%) |
| 75 Years and over | 37 (30.8%) | 32 (12.5%) |
Disability Class: Vision Difficulty
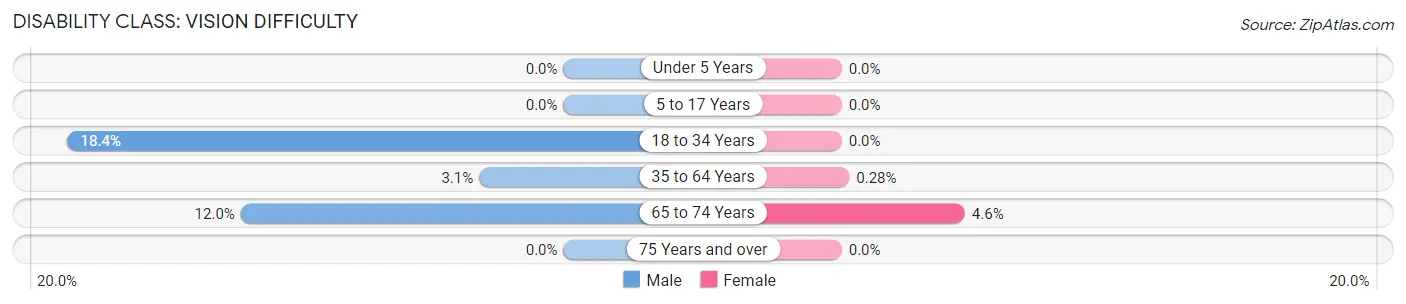
| Age Bracket | Male | Female |
| Under 5 Years | 0 (0.0%) | 0 (0.0%) |
| 5 to 17 Years | 0 (0.0%) | 0 (0.0%) |
| 18 to 34 Years | 53 (18.4%) | 0 (0.0%) |
| 35 to 64 Years | 37 (3.1%) | 3 (0.3%) |
| 65 to 74 Years | 26 (12.0%) | 8 (4.6%) |
| 75 Years and over | 0 (0.0%) | 0 (0.0%) |
Disability Class: Cognitive Difficulty
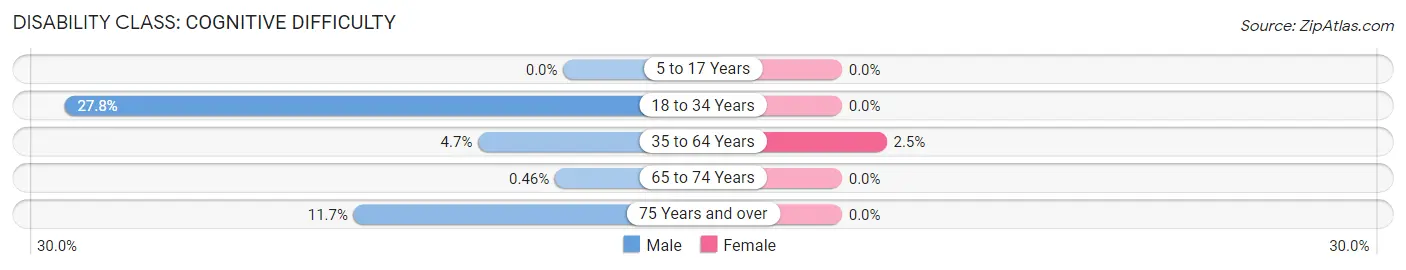
| Age Bracket | Male | Female |
| 5 to 17 Years | 0 (0.0%) | 0 (0.0%) |
| 18 to 34 Years | 80 (27.8%) | 0 (0.0%) |
| 35 to 64 Years | 56 (4.7%) | 27 (2.5%) |
| 65 to 74 Years | 1 (0.5%) | 0 (0.0%) |
| 75 Years and over | 14 (11.7%) | 0 (0.0%) |
Disability Class: Ambulatory Difficulty
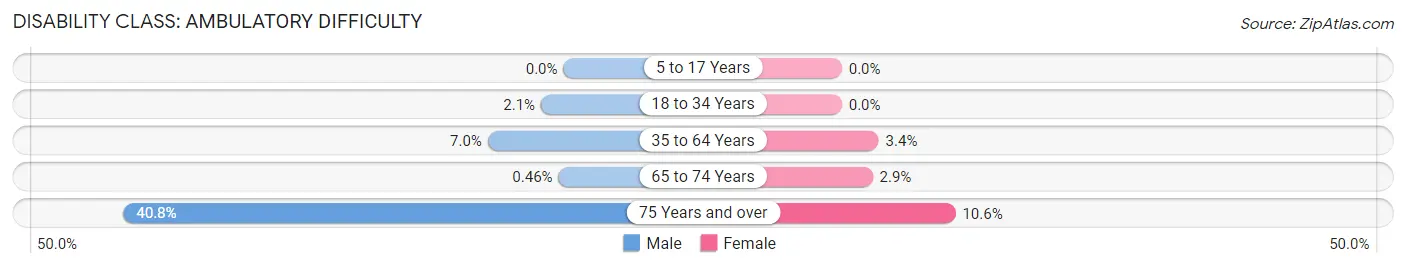
| Age Bracket | Male | Female |
| 5 to 17 Years | 0 (0.0%) | 0 (0.0%) |
| 18 to 34 Years | 6 (2.1%) | 0 (0.0%) |
| 35 to 64 Years | 83 (7.0%) | 37 (3.4%) |
| 65 to 74 Years | 1 (0.5%) | 5 (2.9%) |
| 75 Years and over | 49 (40.8%) | 27 (10.5%) |
Disability Class: Self-Care Difficulty
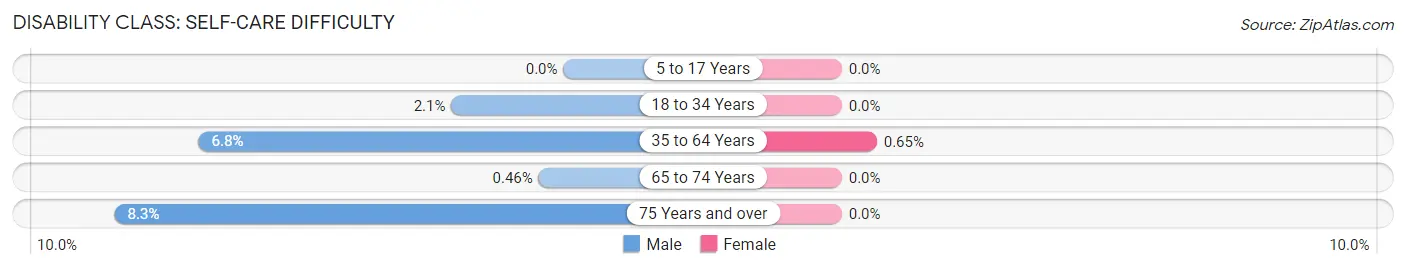
| Age Bracket | Male | Female |
| 5 to 17 Years | 0 (0.0%) | 0 (0.0%) |
| 18 to 34 Years | 6 (2.1%) | 0 (0.0%) |
| 35 to 64 Years | 80 (6.8%) | 7 (0.6%) |
| 65 to 74 Years | 1 (0.5%) | 0 (0.0%) |
| 75 Years and over | 10 (8.3%) | 0 (0.0%) |
Technology Access in Marshfield
Computing Device Access in Marshfield
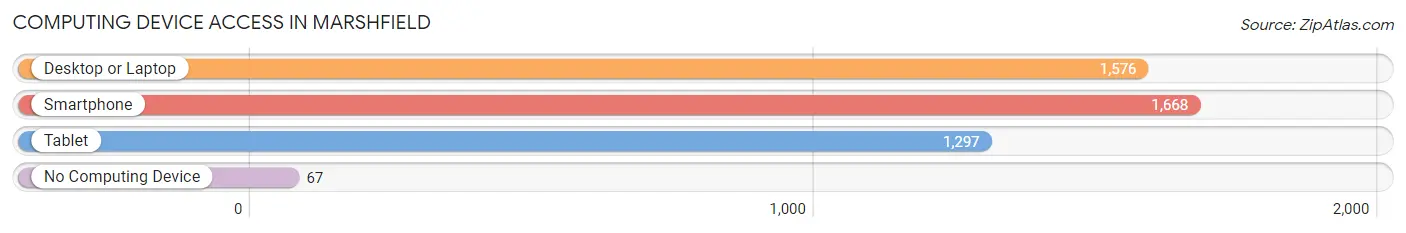
| Device Type | # Households | % Households |
| Desktop or Laptop | 1,576 | 83.1% |
| Smartphone | 1,668 | 88.0% |
| Tablet | 1,297 | 68.4% |
| No Computing Device | 67 | 3.5% |
| Total | 1,896 | 100.0% |
Internet Access in Marshfield
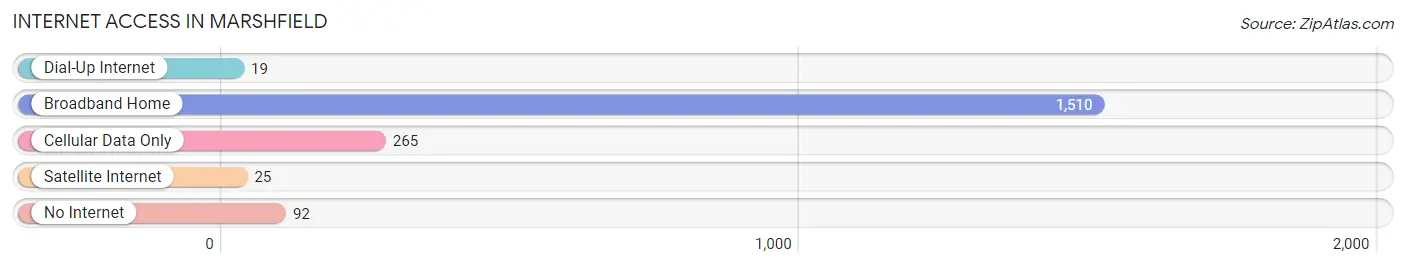
| Internet Type | # Households | % Households |
| Dial-Up Internet | 19 | 1.0% |
| Broadband Home | 1,510 | 79.6% |
| Cellular Data Only | 265 | 14.0% |
| Satellite Internet | 25 | 1.3% |
| No Internet | 92 | 4.9% |
| Total | 1,896 | 100.0% |
Marshfield Summary
Marshfield is a town located in Plymouth County, Massachusetts, United States. It is situated on the South Shore, about 25 miles (40 km) southeast of Boston. The population was 25,132 at the 2010 census.
History
Marshfield was first settled in 1632 by a group of English settlers led by Governor Thomas Prence. The town was named after the marshy area near the original settlement. The town was officially incorporated in 1640.
In the early 1700s, the town was a major shipbuilding center, and it was also a major whaling port. During the Revolutionary War, the town was a major supplier of food and supplies to the Continental Army.
In the 19th century, the town was a major center for the production of cranberries. The town was also a major center for the production of ice, which was harvested from the many ponds in the area.
Geography
Marshfield is located at 42°6′N 70°41′W (42.097, -70.683). According to the United States Census Bureau, the town has a total area of 28.2 square miles (73.1 km2), of which, 27.7 square miles (71.6 km2) of it is land and 0.5 square miles (1.3 km2) of it (1.77%) is water.
The town is bordered by Duxbury to the east, Pembroke to the south, Norwell to the west, and Scituate to the north. The town is located on the South Shore of Massachusetts, about 25 miles (40 km) southeast of Boston.
Economy
Marshfield is a largely residential community, with a strong agricultural and fishing industry. The town is home to several cranberry bogs, and is a major producer of cranberries. The town is also home to several seafood processing plants, which process fish and shellfish caught in the local waters.
The town is also home to several small businesses, including retail stores, restaurants, and professional services. The town is also home to several large employers, including South Shore Hospital, Marshfield Clinic, and South Shore Bank.
Demographics
As of the 2010 census, there were 25,132 people, 9,845 households, and 6,845 families residing in the town. The population density was 905.3 people per square mile (349.7/km2). There were 10,541 housing units at an average density of 379.3 per square mile (146.5/km2). The racial makeup of the town was 95.3% White, 0.9% African American, 0.2% Native American, 1.3% Asian, 0.1% Pacific Islander, 0.7% from other races, and 1.5% from two or more races. Hispanic or Latino of any race were 2.2% of the population.
There were 9,845 households, out of which 33.2% had children under the age of 18 living with them, 57.2% were married couples living together, 9.7% had a female householder with no husband present, and 29.2% were non-families. 24.2% of all households were made up of individuals, and 11.2% had someone living alone who was 65 years of age or older. The average household size was 2.54 and the average family size was 3.04.
In the town, the population was spread out, with 24.2% under the age of 18, 5.9% from 18 to 24, 28.2% from 25 to 44, 26.3% from 45 to 64, and 15.4% who were 65 years of age or older. The median age was 40 years. For every 100 females, there were 94.2 males. For every 100 females age 18 and over, there were 90.7 males.
The median income for a household in the town was $68,837, and the median income for a family was $81,837. Males had a median income of $51,919 versus $37,813 for females. The per capita income for the town was $31,945. About 3.2% of families and 4.7% of the population were below the poverty line, including 5.2% of those under age 18 and 5.2% of those age 65 or over.
Common Questions
What is Per Capita Income in Marshfield?
Per Capita income in Marshfield is $54,716.
What is the Median Family Income in Marshfield?
Median Family Income in Marshfield is $132,045.
What is the Median Household income in Marshfield?
Median Household Income in Marshfield is $93,491.
What is Income or Wage Gap in Marshfield?
Income or Wage Gap in Marshfield is 15.7%.
Women in Marshfield earn 84.3 cents for every dollar earned by a man.
What is Family Income Deficit in Marshfield?
Family Income Deficit in Marshfield is $16,003.
Families that are below poverty line in Marshfield earn $16,003 less on average than the poverty threshold level.
What is Inequality or Gini Index in Marshfield?
Inequality or Gini Index in Marshfield is 0.52.
What is the Total Population of Marshfield?
Total Population of Marshfield is 4,868.
What is the Total Male Population of Marshfield?
Total Male Population of Marshfield is 2,460.
What is the Total Female Population of Marshfield?
Total Female Population of Marshfield is 2,408.
What is the Ratio of Males per 100 Females in Marshfield?
There are 102.16 Males per 100 Females in Marshfield.
What is the Ratio of Females per 100 Males in Marshfield?
There are 97.89 Females per 100 Males in Marshfield.
What is the Median Population Age in Marshfield?
Median Population Age in Marshfield is 44.2 Years.
What is the Average Family Size in Marshfield
Average Family Size in Marshfield is 3.3 People.
What is the Average Household Size in Marshfield
Average Household Size in Marshfield is 2.6 People.
How Large is the Labor Force in Marshfield?
There are 2,582 People in the Labor Forcein in Marshfield.
What is the Percentage of People in the Labor Force in Marshfield?
69.4% of People are in the Labor Force in Marshfield.
What is the Unemployment Rate in Marshfield?
Unemployment Rate in Marshfield is 4.8%.