Rockport, MA Map & Demographics
Rockport Map
Rockport Overview
$60,379
PER CAPITA INCOME
$131,932
AVG FAMILY INCOME
$89,574
AVG HOUSEHOLD INCOME
39.8%
WAGE / INCOME GAP [ % ]
60.2¢/ $1
WAGE / INCOME GAP [ $ ]
$5,198
FAMILY INCOME DEFICIT
0.48
INEQUALITY / GINI INDEX
4,943
TOTAL POPULATION
2,261
MALE POPULATION
2,682
FEMALE POPULATION
84.30
MALES / 100 FEMALES
118.62
FEMALES / 100 MALES
59.9
MEDIAN AGE
2.6
AVG FAMILY SIZE
2.1
AVG HOUSEHOLD SIZE
2,557
LABOR FORCE [ PEOPLE ]
56.9%
PERCENT IN LABOR FORCE
7.6%
UNEMPLOYMENT RATE
Rockport Zip Codes
Income in Rockport
Income Overview in Rockport
Per Capita Income in Rockport is $60,379, while median incomes of families and households are $131,932 and $89,574 respectively.
| Characteristic | Number | Measure |
| Per Capita Income | 4,943 | $60,379 |
| Median Family Income | 1,464 | $131,932 |
| Mean Family Income | 1,464 | $155,631 |
| Median Household Income | 2,372 | $89,574 |
| Mean Household Income | 2,372 | $123,467 |
| Income Deficit | 1,464 | $5,198 |
| Wage / Income Gap (%) | 4,943 | 39.77% |
| Wage / Income Gap ($) | 4,943 | 60.23¢ per $1 |
| Gini / Inequality Index | 4,943 | 0.48 |
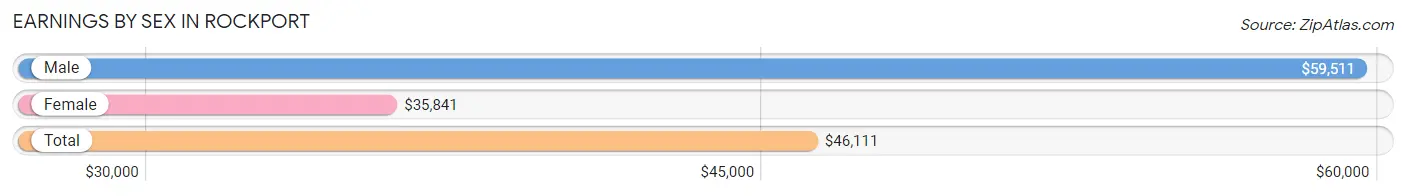
Earnings by Sex in Rockport
Average Earnings in Rockport are $46,111, $59,511 for men and $35,841 for women, a difference of 39.8%.
| Sex | Number | Average Earnings |
| Male | 1,241 (45.9%) | $59,511 |
| Female | 1,463 (54.1%) | $35,841 |
| Total | 2,704 (100.0%) | $46,111 |
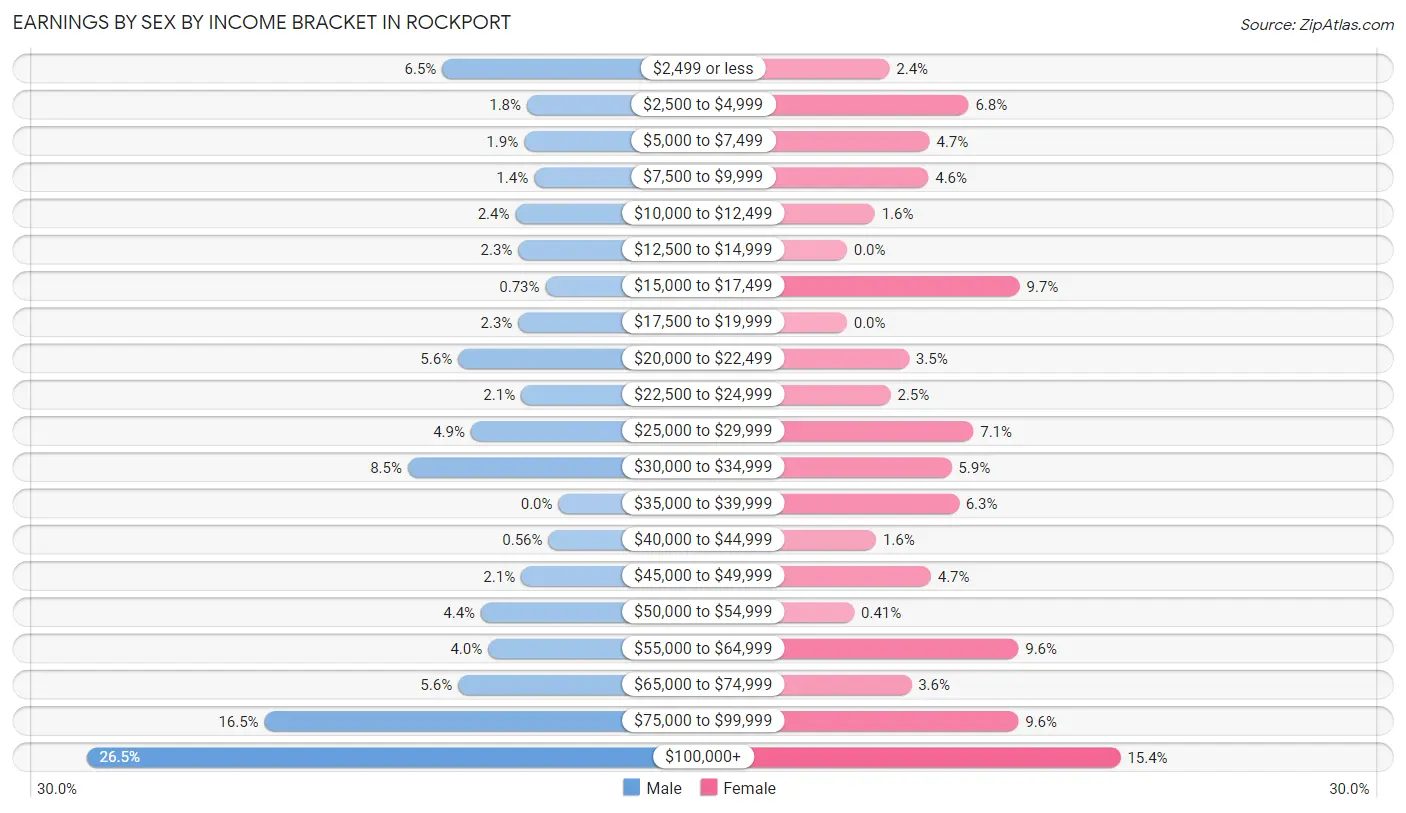
Earnings by Sex by Income Bracket in Rockport
The most common earnings brackets in Rockport are $100,000+ for men (329 | 26.5%) and $100,000+ for women (225 | 15.4%).
| Income | Male | Female |
| $2,499 or less | 81 (6.5%) | 35 (2.4%) |
| $2,500 to $4,999 | 22 (1.8%) | 100 (6.8%) |
| $5,000 to $7,499 | 24 (1.9%) | 68 (4.6%) |
| $7,500 to $9,999 | 17 (1.4%) | 67 (4.6%) |
| $10,000 to $12,499 | 30 (2.4%) | 23 (1.6%) |
| $12,500 to $14,999 | 28 (2.3%) | 0 (0.0%) |
| $15,000 to $17,499 | 9 (0.7%) | 142 (9.7%) |
| $17,500 to $19,999 | 28 (2.3%) | 0 (0.0%) |
| $20,000 to $22,499 | 70 (5.6%) | 51 (3.5%) |
| $22,500 to $24,999 | 26 (2.1%) | 36 (2.5%) |
| $25,000 to $29,999 | 61 (4.9%) | 104 (7.1%) |
| $30,000 to $34,999 | 105 (8.5%) | 86 (5.9%) |
| $35,000 to $39,999 | 0 (0.0%) | 92 (6.3%) |
| $40,000 to $44,999 | 7 (0.6%) | 24 (1.6%) |
| $45,000 to $49,999 | 26 (2.1%) | 69 (4.7%) |
| $50,000 to $54,999 | 54 (4.3%) | 6 (0.4%) |
| $55,000 to $64,999 | 49 (4.0%) | 141 (9.6%) |
| $65,000 to $74,999 | 70 (5.6%) | 53 (3.6%) |
| $75,000 to $99,999 | 205 (16.5%) | 141 (9.6%) |
| $100,000+ | 329 (26.5%) | 225 (15.4%) |
| Total | 1,241 (100.0%) | 1,463 (100.0%) |
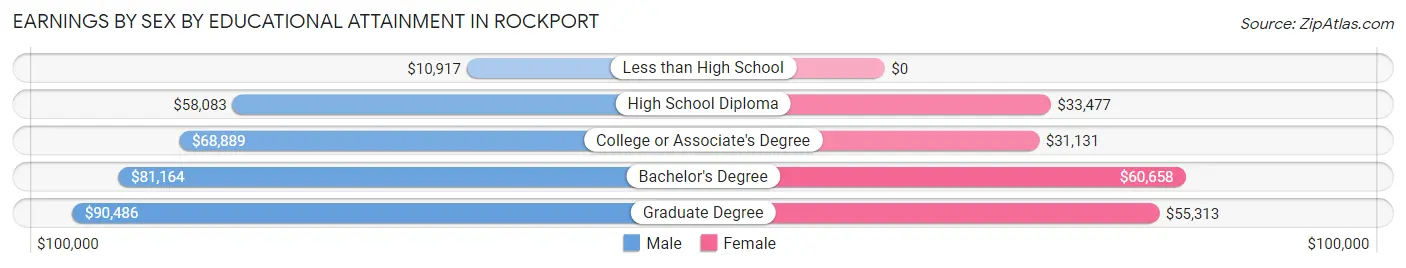
Earnings by Sex by Educational Attainment in Rockport
Average earnings in Rockport are $72,260 for men and $45,924 for women, a difference of 36.4%. Men with an educational attainment of graduate degree enjoy the highest average annual earnings of $90,486, while those with less than high school education earn the least with $10,917. Women with an educational attainment of bachelor's degree earn the most with the average annual earnings of $60,658, while those with college or associate's degree education have the smallest earnings of $31,131.
| Educational Attainment | Male Income | Female Income |
| Less than High School | $10,917 | $0 |
| High School Diploma | $58,083 | $33,477 |
| College or Associate's Degree | $68,889 | $31,131 |
| Bachelor's Degree | $81,164 | $60,658 |
| Graduate Degree | $90,486 | $55,313 |
| Total | $72,260 | $45,924 |
Family Income in Rockport
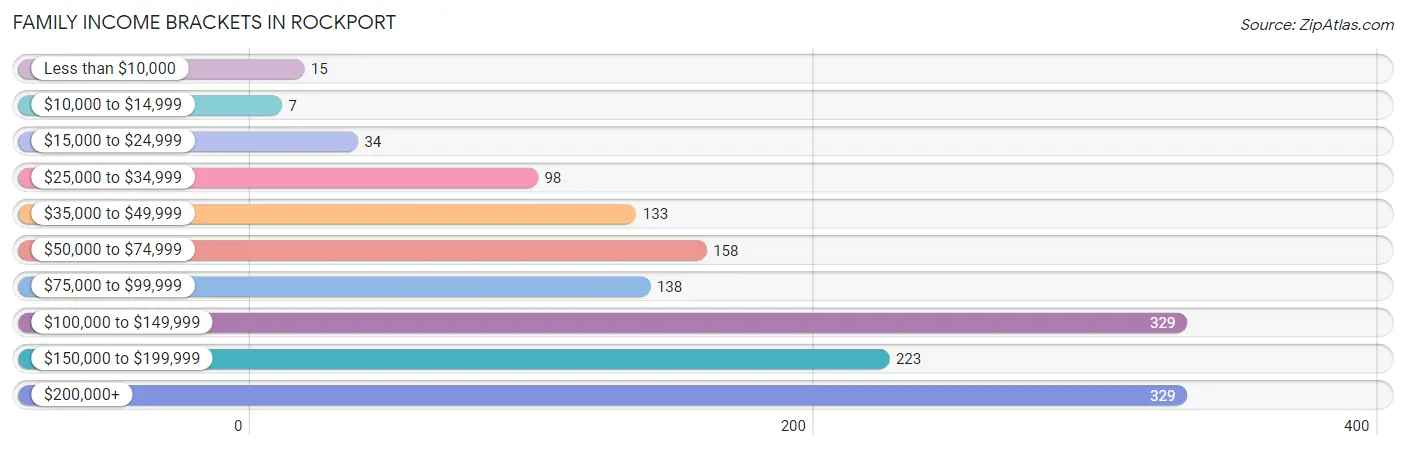
Family Income Brackets in Rockport
According to the Rockport family income data, there are 329 families falling into the $100,000 to $149,999 income range, which is the most common income bracket and makes up 22.5% of all families. Conversely, the $10,000 to $14,999 income bracket is the least frequent group with only 7 families (0.5%) belonging to this category.
| Income Bracket | # Families | % Families |
| Less than $10,000 | 15 | 1.0% |
| $10,000 to $14,999 | 7 | 0.5% |
| $15,000 to $24,999 | 34 | 2.3% |
| $25,000 to $34,999 | 98 | 6.7% |
| $35,000 to $49,999 | 133 | 9.1% |
| $50,000 to $74,999 | 158 | 10.8% |
| $75,000 to $99,999 | 138 | 9.4% |
| $100,000 to $149,999 | 329 | 22.5% |
| $150,000 to $199,999 | 223 | 15.2% |
| $200,000+ | 329 | 22.5% |
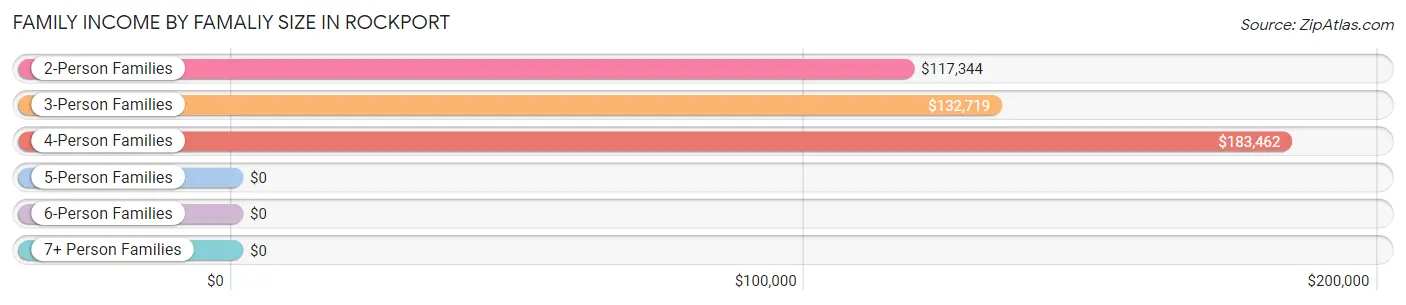
Family Income by Famaliy Size in Rockport
4-person families (188 | 12.8%) account for the highest median family income in Rockport with $183,462 per family, while 2-person families (995 | 68.0%) have the highest median income of $58,672 per family member.
| Income Bracket | # Families | Median Income |
| 2-Person Families | 995 (68.0%) | $117,344 |
| 3-Person Families | 211 (14.4%) | $132,719 |
| 4-Person Families | 188 (12.8%) | $183,462 |
| 5-Person Families | 55 (3.8%) | $0 |
| 6-Person Families | 15 (1.0%) | $0 |
| 7+ Person Families | 0 (0.0%) | $0 |
| Total | 1,464 (100.0%) | $131,932 |
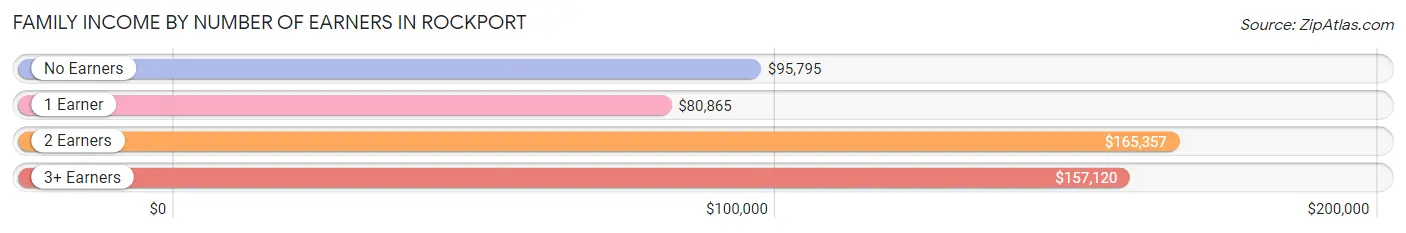
Family Income by Number of Earners in Rockport
The median family income in Rockport is $131,932, with families comprising 2 earners (486) having the highest median family income of $165,357, while families with 1 earner (501) have the lowest median family income of $80,865, accounting for 33.2% and 34.2% of families, respectively.
| Number of Earners | # Families | Median Income |
| No Earners | 304 (20.8%) | $95,795 |
| 1 Earner | 501 (34.2%) | $80,865 |
| 2 Earners | 486 (33.2%) | $165,357 |
| 3+ Earners | 173 (11.8%) | $157,120 |
| Total | 1,464 (100.0%) | $131,932 |
Household Income in Rockport
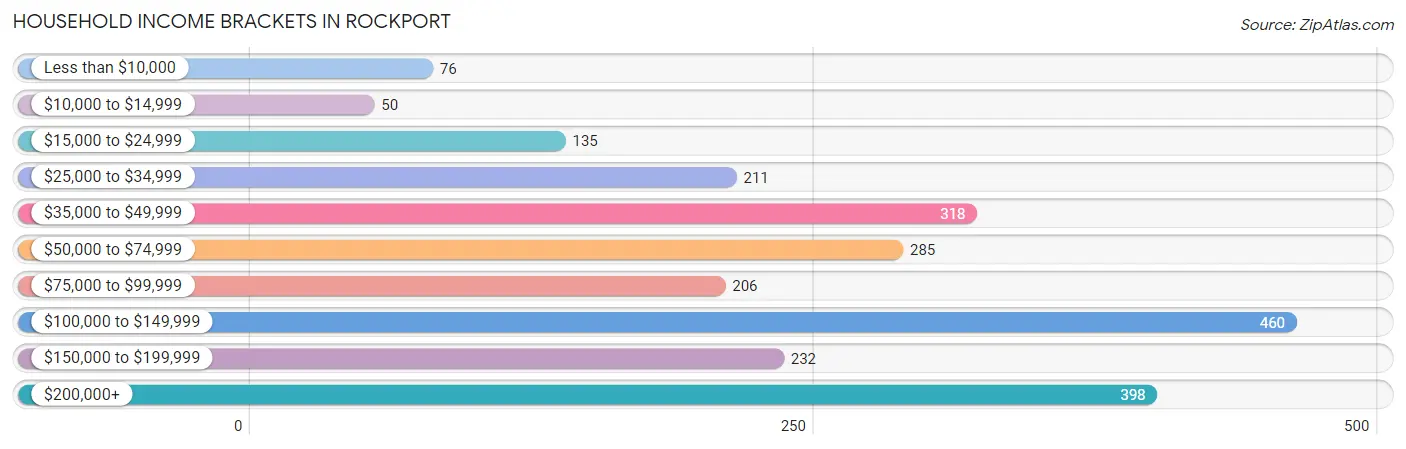
Household Income Brackets in Rockport
With 460 households falling in the category, the $100,000 to $149,999 income range is the most frequent in Rockport, accounting for 19.4% of all households. In contrast, only 50 households (2.1%) fall into the $10,000 to $14,999 income bracket, making it the least populous group.
| Income Bracket | # Households | % Households |
| Less than $10,000 | 76 | 3.2% |
| $10,000 to $14,999 | 50 | 2.1% |
| $15,000 to $24,999 | 135 | 5.7% |
| $25,000 to $34,999 | 211 | 8.9% |
| $35,000 to $49,999 | 318 | 13.4% |
| $50,000 to $74,999 | 285 | 12.0% |
| $75,000 to $99,999 | 206 | 8.7% |
| $100,000 to $149,999 | 460 | 19.4% |
| $150,000 to $199,999 | 232 | 9.8% |
| $200,000+ | 398 | 16.8% |
Household Income by Householder Age in Rockport
The median household income in Rockport is $89,574, with the highest median household income of $120,966 found in the 45 to 64 years age bracket for the primary householder. A total of 849 households (35.8%) fall into this category.
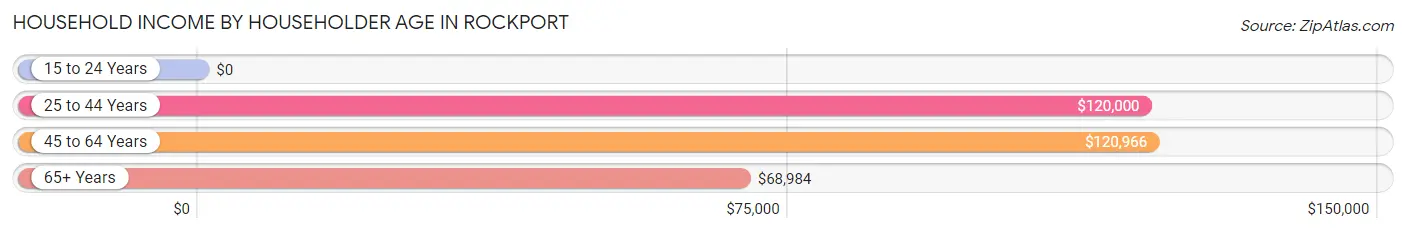
| Income Bracket | # Households | Median Income |
| 15 to 24 Years | 0 (0.0%) | $0 |
| 25 to 44 Years | 322 (13.6%) | $120,000 |
| 45 to 64 Years | 849 (35.8%) | $120,966 |
| 65+ Years | 1,201 (50.6%) | $68,984 |
| Total | 2,372 (100.0%) | $89,574 |
Poverty in Rockport
Income Below Poverty by Sex and Age in Rockport
With 4.2% poverty level for males and 5.3% for females among the residents of Rockport, 18 to 24 year old males and 35 to 44 year old females are the most vulnerable to poverty, with 28 males (20.3%) and 25 females (12.0%) in their respective age groups living below the poverty level.
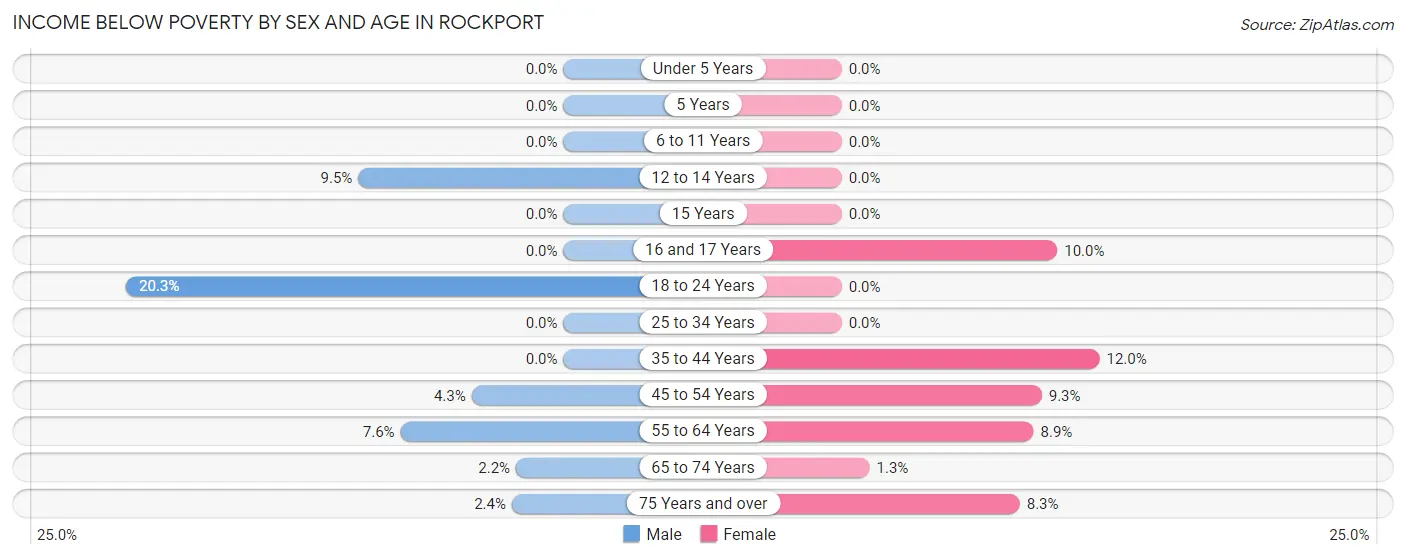
| Age Bracket | Male | Female |
| Under 5 Years | 0 (0.0%) | 0 (0.0%) |
| 5 Years | 0 (0.0%) | 0 (0.0%) |
| 6 to 11 Years | 0 (0.0%) | 0 (0.0%) |
| 12 to 14 Years | 8 (9.5%) | 0 (0.0%) |
| 15 Years | 0 (0.0%) | 0 (0.0%) |
| 16 and 17 Years | 0 (0.0%) | 6 (10.0%) |
| 18 to 24 Years | 28 (20.3%) | 0 (0.0%) |
| 25 to 34 Years | 0 (0.0%) | 0 (0.0%) |
| 35 to 44 Years | 0 (0.0%) | 25 (12.0%) |
| 45 to 54 Years | 8 (4.3%) | 31 (9.3%) |
| 55 to 64 Years | 30 (7.6%) | 42 (8.9%) |
| 65 to 74 Years | 12 (2.2%) | 9 (1.3%) |
| 75 Years and over | 8 (2.4%) | 28 (8.3%) |
| Total | 94 (4.2%) | 141 (5.3%) |
Income Above Poverty by Sex and Age in Rockport
According to the poverty statistics in Rockport, males aged under 5 years and females aged under 5 years are the age groups that are most secure financially, with 100.0% of males and 100.0% of females in these age groups living above the poverty line.
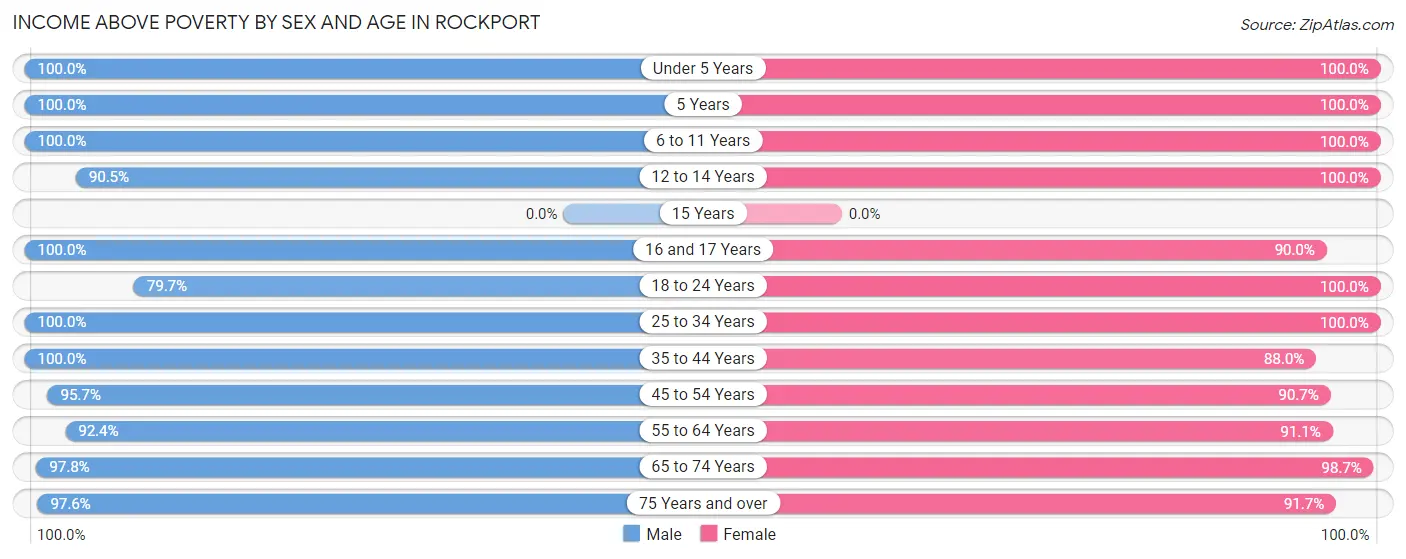
| Age Bracket | Male | Female |
| Under 5 Years | 142 (100.0%) | 9 (100.0%) |
| 5 Years | 5 (100.0%) | 32 (100.0%) |
| 6 to 11 Years | 21 (100.0%) | 71 (100.0%) |
| 12 to 14 Years | 76 (90.5%) | 85 (100.0%) |
| 15 Years | 0 (0.0%) | 0 (0.0%) |
| 16 and 17 Years | 52 (100.0%) | 54 (90.0%) |
| 18 to 24 Years | 110 (79.7%) | 181 (100.0%) |
| 25 to 34 Years | 155 (100.0%) | 168 (100.0%) |
| 35 to 44 Years | 172 (100.0%) | 184 (88.0%) |
| 45 to 54 Years | 180 (95.7%) | 303 (90.7%) |
| 55 to 64 Years | 367 (92.4%) | 430 (91.1%) |
| 65 to 74 Years | 534 (97.8%) | 688 (98.7%) |
| 75 Years and over | 327 (97.6%) | 311 (91.7%) |
| Total | 2,141 (95.8%) | 2,516 (94.7%) |
Income Below Poverty Among Married-Couple Families in Rockport
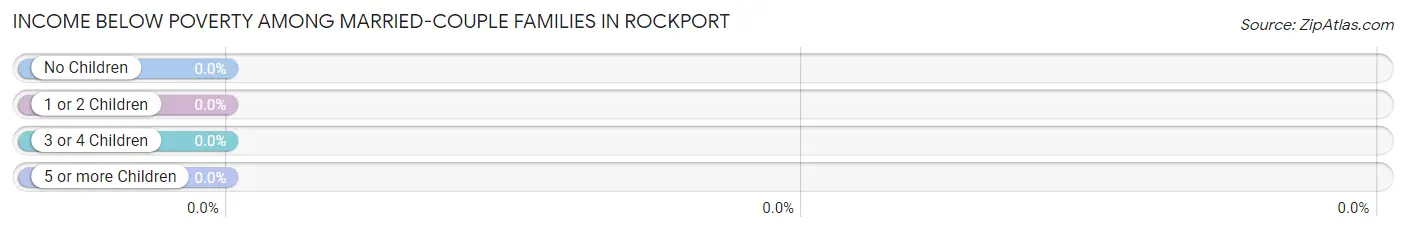
| Children | Above Poverty | Below Poverty |
| No Children | 977 (100.0%) | 0 (0.0%) |
| 1 or 2 Children | 199 (100.0%) | 0 (0.0%) |
| 3 or 4 Children | 22 (100.0%) | 0 (0.0%) |
| 5 or more Children | 0 (0.0%) | 0 (0.0%) |
| Total | 1,198 (100.0%) | 0 (0.0%) |
Income Below Poverty Among Single-Parent Households in Rockport
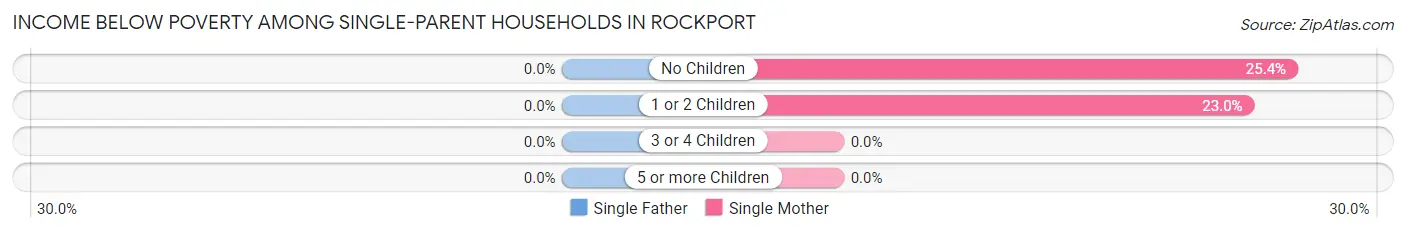
| Children | Single Father | Single Mother |
| No Children | 0 (0.0%) | 33 (25.4%) |
| 1 or 2 Children | 0 (0.0%) | 14 (23.0%) |
| 3 or 4 Children | 0 (0.0%) | 0 (0.0%) |
| 5 or more Children | 0 (0.0%) | 0 (0.0%) |
| Total | 0 (0.0%) | 47 (23.4%) |
Income Below Poverty Among Married-Couple vs Single-Parent Households in Rockport
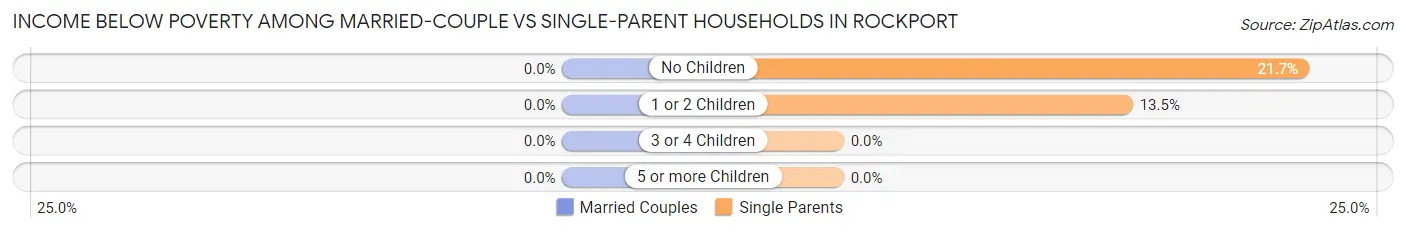
| Children | Married-Couple Families | Single-Parent Households |
| No Children | 0 (0.0%) | 33 (21.7%) |
| 1 or 2 Children | 0 (0.0%) | 14 (13.5%) |
| 3 or 4 Children | 0 (0.0%) | 0 (0.0%) |
| 5 or more Children | 0 (0.0%) | 0 (0.0%) |
| Total | 0 (0.0%) | 47 (17.7%) |
Race in Rockport
The most populous races in Rockport are White / Caucasian (4,632 | 93.7%), Two or more Races (249 | 5.0%), and Hispanic or Latino (171 | 3.5%).
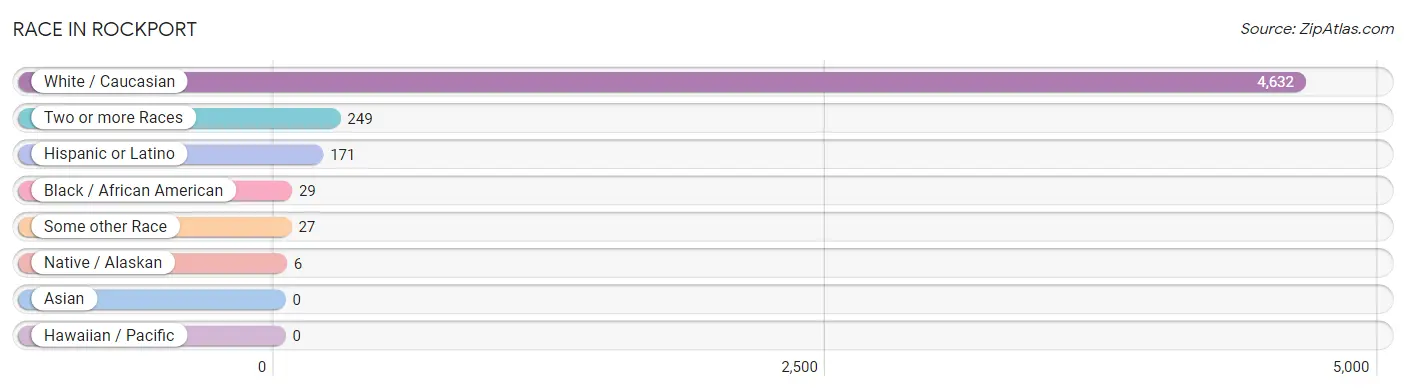
| Race | # Population | % Population |
| Asian | 0 | 0.0% |
| Black / African American | 29 | 0.6% |
| Hawaiian / Pacific | 0 | 0.0% |
| Hispanic or Latino | 171 | 3.5% |
| Native / Alaskan | 6 | 0.1% |
| White / Caucasian | 4,632 | 93.7% |
| Two or more Races | 249 | 5.0% |
| Some other Race | 27 | 0.5% |
| Total | 4,943 | 100.0% |
Ancestry in Rockport
The most populous ancestries reported in Rockport are Irish (1,393 | 28.2%), English (944 | 19.1%), Italian (817 | 16.5%), German (474 | 9.6%), and French (286 | 5.8%), together accounting for 79.2% of all Rockport residents.
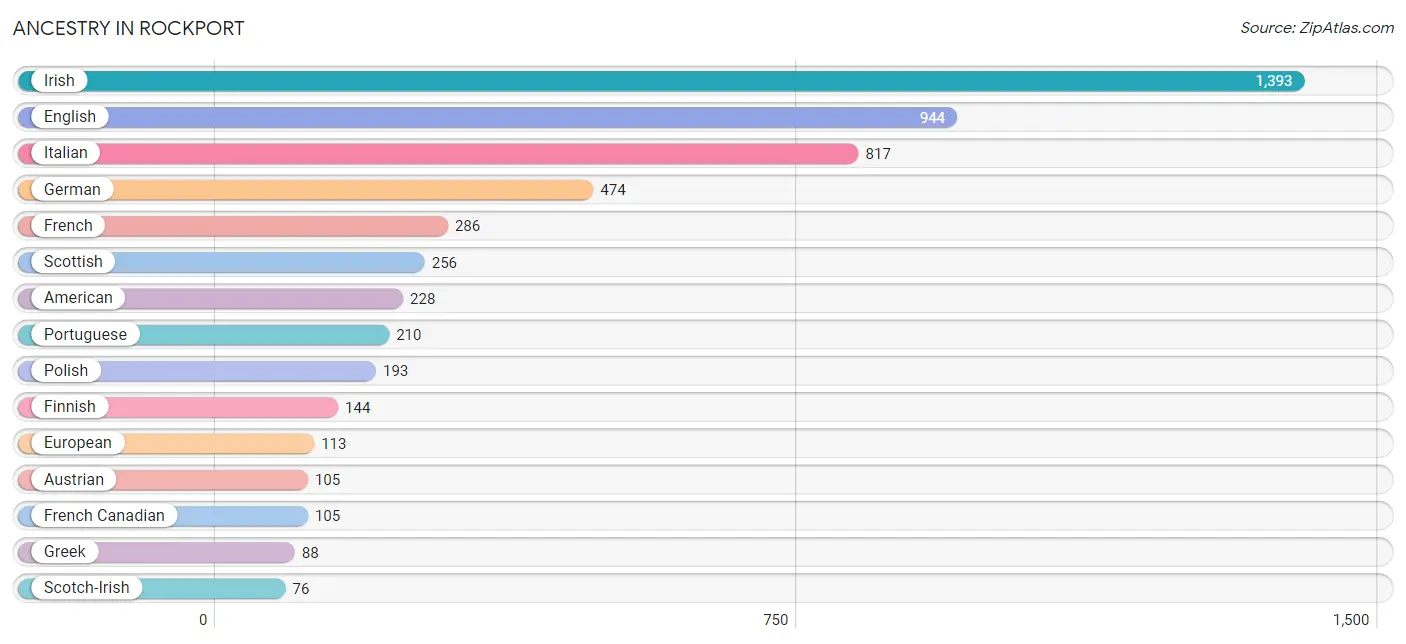
| Ancestry | # Population | % Population |
| Afghan | 14 | 0.3% |
| Albanian | 19 | 0.4% |
| American | 228 | 4.6% |
| Arab | 33 | 0.7% |
| Armenian | 54 | 1.1% |
| Austrian | 105 | 2.1% |
| British | 43 | 0.9% |
| Burmese | 19 | 0.4% |
| Canadian | 17 | 0.3% |
| Celtic | 35 | 0.7% |
| Central American | 14 | 0.3% |
| Cherokee | 22 | 0.4% |
| Chippewa | 6 | 0.1% |
| Colombian | 16 | 0.3% |
| Creek | 6 | 0.1% |
| Czech | 8 | 0.2% |
| Czechoslovakian | 8 | 0.2% |
| Danish | 33 | 0.7% |
| Dominican | 13 | 0.3% |
| Dutch | 20 | 0.4% |
| Eastern European | 14 | 0.3% |
| English | 944 | 19.1% |
| European | 113 | 2.3% |
| Finnish | 144 | 2.9% |
| French | 286 | 5.8% |
| French Canadian | 105 | 2.1% |
| German | 474 | 9.6% |
| Greek | 88 | 1.8% |
| Hungarian | 11 | 0.2% |
| Iranian | 15 | 0.3% |
| Irish | 1,393 | 28.2% |
| Italian | 817 | 16.5% |
| Jamaican | 10 | 0.2% |
| Lebanese | 33 | 0.7% |
| Lithuanian | 26 | 0.5% |
| Mexican | 21 | 0.4% |
| Norwegian | 24 | 0.5% |
| Polish | 193 | 3.9% |
| Portuguese | 210 | 4.3% |
| Puerto Rican | 69 | 1.4% |
| Russian | 28 | 0.6% |
| Salvadoran | 14 | 0.3% |
| Scotch-Irish | 76 | 1.5% |
| Scottish | 256 | 5.2% |
| South American | 16 | 0.3% |
| Spaniard | 20 | 0.4% |
| Spanish | 18 | 0.4% |
| Swedish | 73 | 1.5% |
| Swiss | 36 | 0.7% |
| Thai | 20 | 0.4% |
| Ukrainian | 25 | 0.5% |
| Welsh | 45 | 0.9% |
| West Indian | 29 | 0.6% | View All 53 Rows |
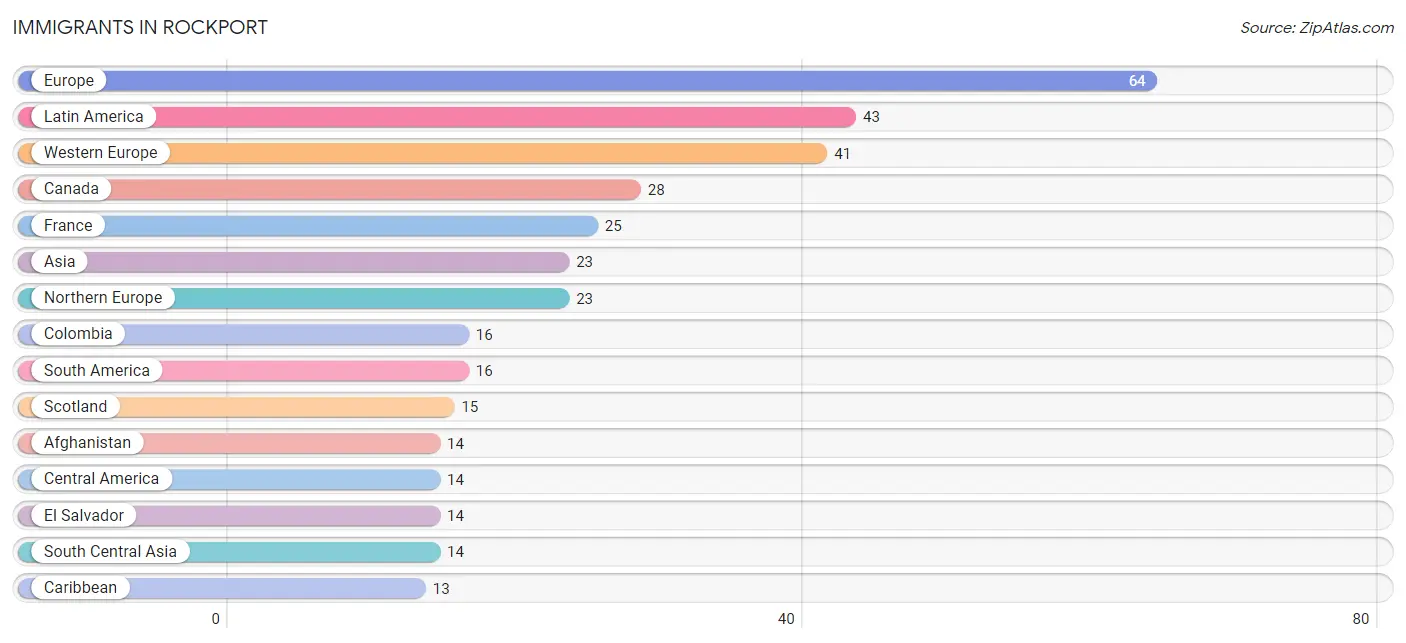
Immigrants in Rockport
The most numerous immigrant groups reported in Rockport came from Europe (64 | 1.3%), Latin America (43 | 0.9%), Western Europe (41 | 0.8%), Canada (28 | 0.6%), and France (25 | 0.5%), together accounting for 4.1% of all Rockport residents.
| Immigration Origin | # Population | % Population |
| Afghanistan | 14 | 0.3% |
| Asia | 23 | 0.5% |
| Australia | 7 | 0.1% |
| Canada | 28 | 0.6% |
| Caribbean | 13 | 0.3% |
| Central America | 14 | 0.3% |
| Colombia | 16 | 0.3% |
| Dominican Republic | 13 | 0.3% |
| El Salvador | 14 | 0.3% |
| England | 8 | 0.2% |
| Europe | 64 | 1.3% |
| France | 25 | 0.5% |
| Germany | 8 | 0.2% |
| Latin America | 43 | 0.9% |
| Lebanon | 9 | 0.2% |
| Northern Europe | 23 | 0.5% |
| Oceania | 7 | 0.1% |
| Scotland | 15 | 0.3% |
| South America | 16 | 0.3% |
| South Central Asia | 14 | 0.3% |
| Switzerland | 8 | 0.2% |
| Western Asia | 9 | 0.2% |
| Western Europe | 41 | 0.8% | View All 23 Rows |
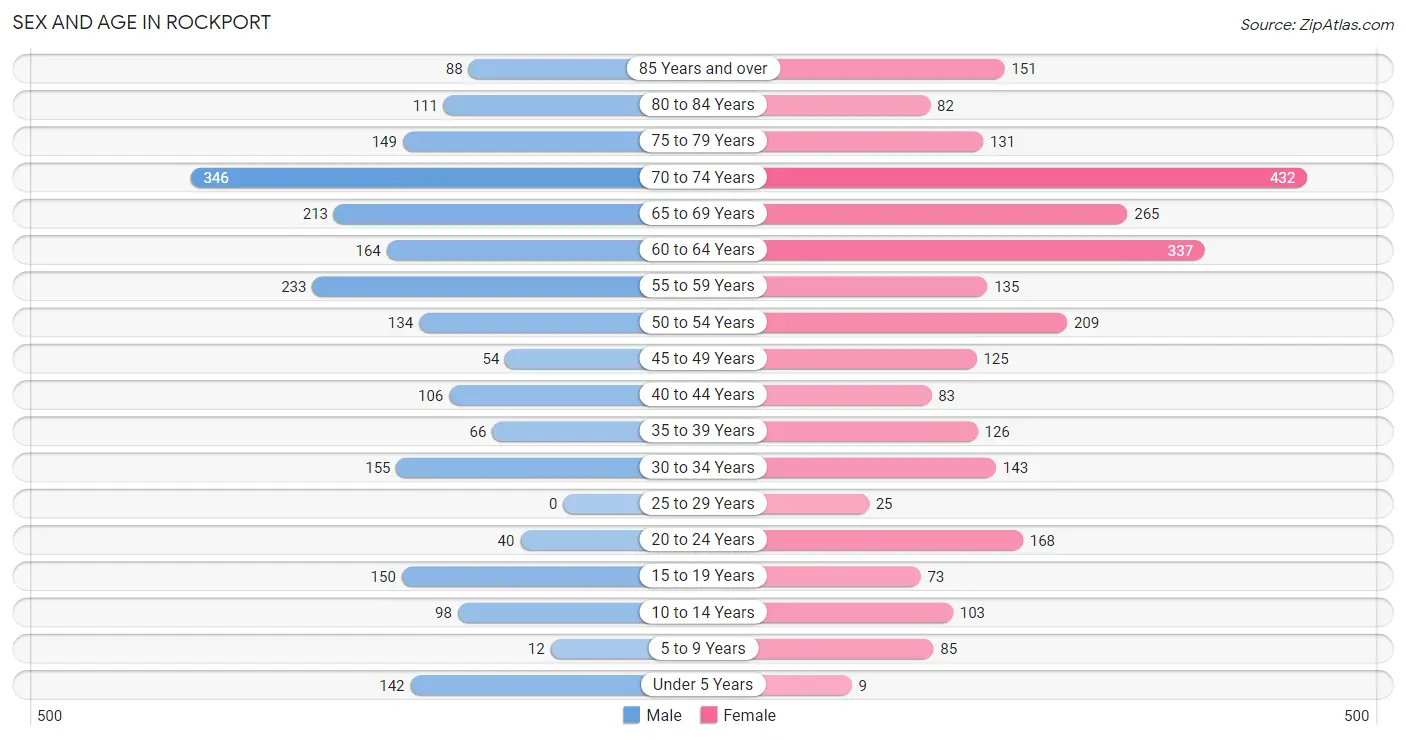
Sex and Age in Rockport
Sex and Age in Rockport
The most populous age groups in Rockport are 70 to 74 Years (346 | 15.3%) for men and 70 to 74 Years (432 | 16.1%) for women.
| Age Bracket | Male | Female |
| Under 5 Years | 142 (6.3%) | 9 (0.3%) |
| 5 to 9 Years | 12 (0.5%) | 85 (3.2%) |
| 10 to 14 Years | 98 (4.3%) | 103 (3.8%) |
| 15 to 19 Years | 150 (6.6%) | 73 (2.7%) |
| 20 to 24 Years | 40 (1.8%) | 168 (6.3%) |
| 25 to 29 Years | 0 (0.0%) | 25 (0.9%) |
| 30 to 34 Years | 155 (6.9%) | 143 (5.3%) |
| 35 to 39 Years | 66 (2.9%) | 126 (4.7%) |
| 40 to 44 Years | 106 (4.7%) | 83 (3.1%) |
| 45 to 49 Years | 54 (2.4%) | 125 (4.7%) |
| 50 to 54 Years | 134 (5.9%) | 209 (7.8%) |
| 55 to 59 Years | 233 (10.3%) | 135 (5.0%) |
| 60 to 64 Years | 164 (7.2%) | 337 (12.6%) |
| 65 to 69 Years | 213 (9.4%) | 265 (9.9%) |
| 70 to 74 Years | 346 (15.3%) | 432 (16.1%) |
| 75 to 79 Years | 149 (6.6%) | 131 (4.9%) |
| 80 to 84 Years | 111 (4.9%) | 82 (3.1%) |
| 85 Years and over | 88 (3.9%) | 151 (5.6%) |
| Total | 2,261 (100.0%) | 2,682 (100.0%) |
Families and Households in Rockport
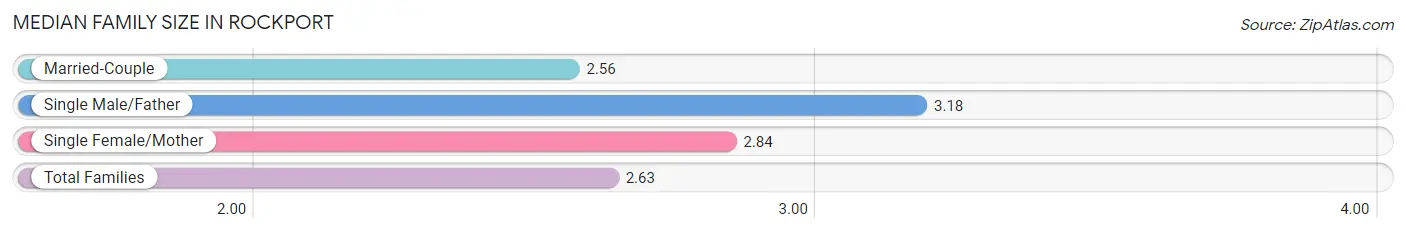
Median Family Size in Rockport
The median family size in Rockport is 2.63 persons per family, with single male/father families (65 | 4.4%) accounting for the largest median family size of 3.18 persons per family. On the other hand, married-couple families (1,198 | 81.8%) represent the smallest median family size with 2.56 persons per family.
| Family Type | # Families | Family Size |
| Married-Couple | 1,198 (81.8%) | 2.56 |
| Single Male/Father | 65 (4.4%) | 3.18 |
| Single Female/Mother | 201 (13.7%) | 2.84 |
| Total Families | 1,464 (100.0%) | 2.63 |
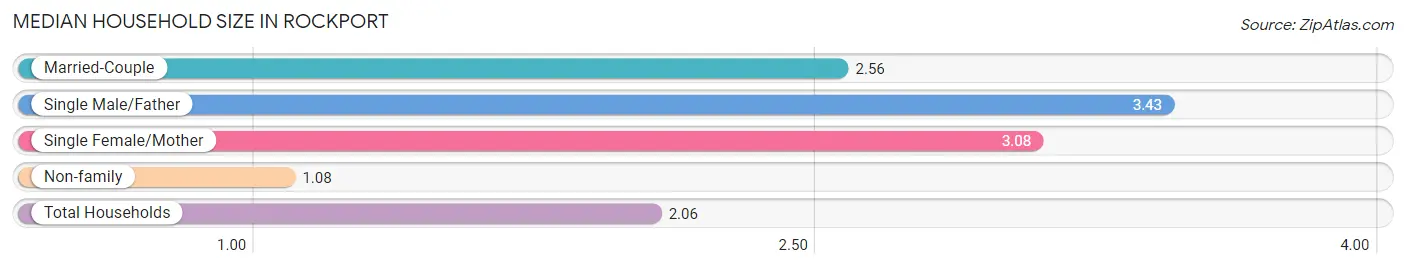
Median Household Size in Rockport
The median household size in Rockport is 2.06 persons per household, with single male/father households (65 | 2.7%) accounting for the largest median household size of 3.43 persons per household. non-family households (908 | 38.3%) represent the smallest median household size with 1.08 persons per household.
| Household Type | # Households | Household Size |
| Married-Couple | 1,198 (50.5%) | 2.56 |
| Single Male/Father | 65 (2.7%) | 3.43 |
| Single Female/Mother | 201 (8.5%) | 3.08 |
| Non-family | 908 (38.3%) | 1.08 |
| Total Households | 2,372 (100.0%) | 2.06 |
Household Size by Marriage Status in Rockport
Out of a total of 2,372 households in Rockport, 1,464 (61.7%) are family households, while 908 (38.3%) are nonfamily households. The most numerous type of family households are 2-person households, comprising 995, and the most common type of nonfamily households are 1-person households, comprising 826.
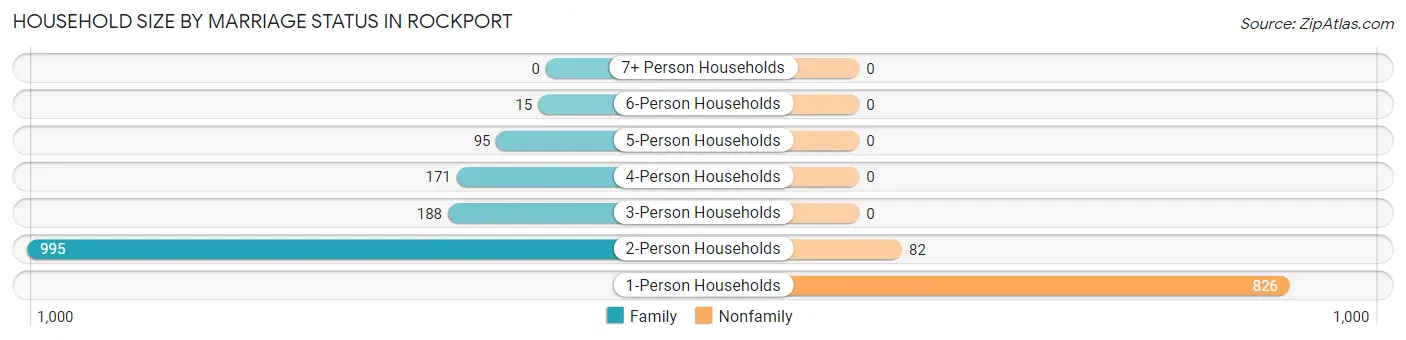
| Household Size | Family Households | Nonfamily Households |
| 1-Person Households | - | 826 (34.8%) |
| 2-Person Households | 995 (41.9%) | 82 (3.5%) |
| 3-Person Households | 188 (7.9%) | 0 (0.0%) |
| 4-Person Households | 171 (7.2%) | 0 (0.0%) |
| 5-Person Households | 95 (4.0%) | 0 (0.0%) |
| 6-Person Households | 15 (0.6%) | 0 (0.0%) |
| 7+ Person Households | 0 (0.0%) | 0 (0.0%) |
| Total | 1,464 (61.7%) | 908 (38.3%) |
Female Fertility in Rockport
Fertility by Age in Rockport
| Age Bracket | Women with Births | Births / 1,000 Women |
| 15 to 19 years | 0 (0.0%) | 0.0 |
| 20 to 34 years | 0 (0.0%) | 0.0 |
| 35 to 50 years | 0 (0.0%) | 0.0 |
| Total | 0 (0.0%) | 0.0 |
Fertility by Age by Marriage Status in Rockport
| Age Bracket | Married | Unmarried |
| 15 to 19 years | 0 (0.0%) | 0 (0.0%) |
| 20 to 34 years | 0 (0.0%) | 0 (0.0%) |
| 35 to 50 years | 0 (0.0%) | 0 (0.0%) |
| Total | 0 (0.0%) | 0 (0.0%) |
Fertility by Education in Rockport
| Educational Attainment | Women with Births | Births / 1,000 Women |
| Less than High School | 0 (0.0%) | 0.0 |
| High School Diploma | 0 (0.0%) | 0.0 |
| College or Associate's Degree | 0 (0.0%) | 0.0 |
| Bachelor's Degree | 0 (0.0%) | 0.0 |
| Graduate Degree | 0 (0.0%) | 0.0 |
| Total | 0 (0.0%) | 0.0 |
Fertility by Education by Marriage Status in Rockport
| Educational Attainment | Married | Unmarried |
| Less than High School | 0 (0.0%) | 0 (0.0%) |
| High School Diploma | 0 (0.0%) | 0 (0.0%) |
| College or Associate's Degree | 0 (0.0%) | 0 (0.0%) |
| Bachelor's Degree | 0 (0.0%) | 0 (0.0%) |
| Graduate Degree | 0 (0.0%) | 0 (0.0%) |
| Total | 0 (0.0%) | 0 (0.0%) |
Employment Characteristics in Rockport
Employment by Class of Employer in Rockport
Among the 2,340 employed individuals in Rockport, private company employees (1,137 | 48.6%), not-for-profit organizations (340 | 14.5%), and self-employed (not incorporated) (245 | 10.5%) make up the most common classes of employment.
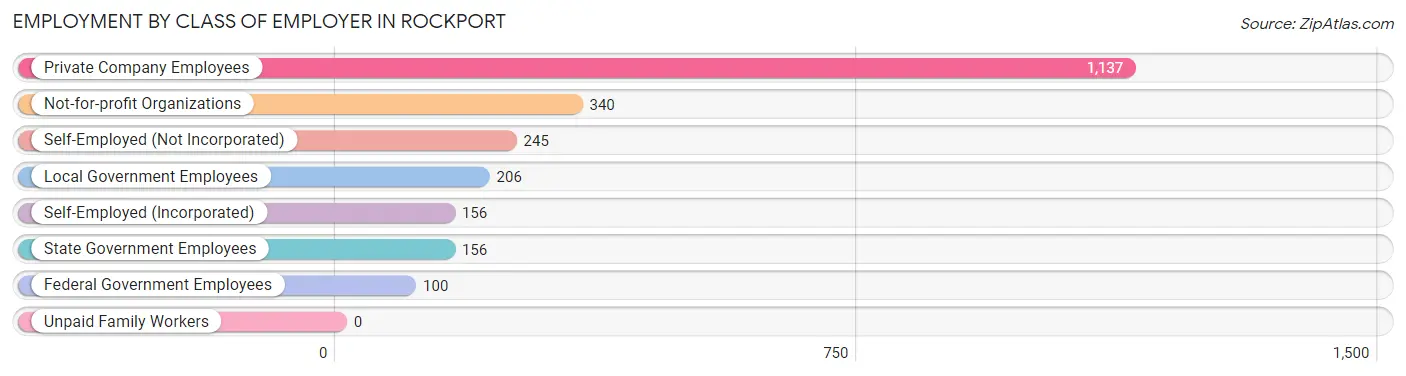
| Employer Class | # Employees | % Employees |
| Private Company Employees | 1,137 | 48.6% |
| Self-Employed (Incorporated) | 156 | 6.7% |
| Self-Employed (Not Incorporated) | 245 | 10.5% |
| Not-for-profit Organizations | 340 | 14.5% |
| Local Government Employees | 206 | 8.8% |
| State Government Employees | 156 | 6.7% |
| Federal Government Employees | 100 | 4.3% |
| Unpaid Family Workers | 0 | 0.0% |
| Total | 2,340 | 100.0% |
Employment Status by Age in Rockport
According to the labor force statistics for Rockport, out of the total population over 16 years of age (4,494), 56.9% or 2,557 individuals are in the labor force, with 7.6% or 194 of them unemployed. The age group with the highest labor force participation rate is 25 to 29 years, with 100.0% or 25 individuals in the labor force. Within the labor force, the 20 to 24 years age range has the highest percentage of unemployed individuals, with 22.6% or 38 of them being unemployed.
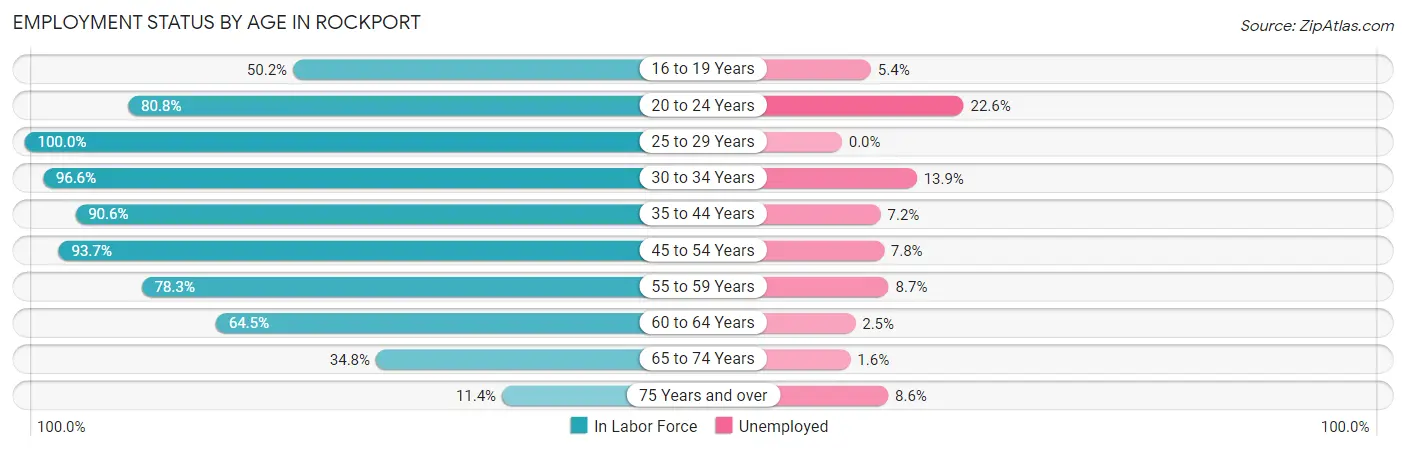
| Age Bracket | In Labor Force | Unemployed |
| 16 to 19 Years | 112 (50.2%) | 6 (5.4%) |
| 20 to 24 Years | 168 (80.8%) | 38 (22.6%) |
| 25 to 29 Years | 25 (100.0%) | 0 (0.0%) |
| 30 to 34 Years | 288 (96.6%) | 40 (13.9%) |
| 35 to 44 Years | 345 (90.6%) | 25 (7.2%) |
| 45 to 54 Years | 489 (93.7%) | 38 (7.8%) |
| 55 to 59 Years | 288 (78.3%) | 25 (8.7%) |
| 60 to 64 Years | 323 (64.5%) | 8 (2.5%) |
| 65 to 74 Years | 437 (34.8%) | 7 (1.6%) |
| 75 Years and over | 81 (11.4%) | 7 (8.6%) |
| Total | 2,557 (56.9%) | 194 (7.6%) |
Employment Status by Educational Attainment in Rockport
According to labor force statistics for Rockport, 83.9% of individuals (1,758) out of the total population between 25 and 64 years of age (2,095) are in the labor force, with 7.7% or 135 of them being unemployed. The group with the highest labor force participation rate are those with the educational attainment of bachelor's degree or higher, with 85.1% or 1,071 individuals in the labor force. Within the labor force, individuals with less than high school education have the highest percentage of unemployment, with 28.4% or 25 of them being unemployed.
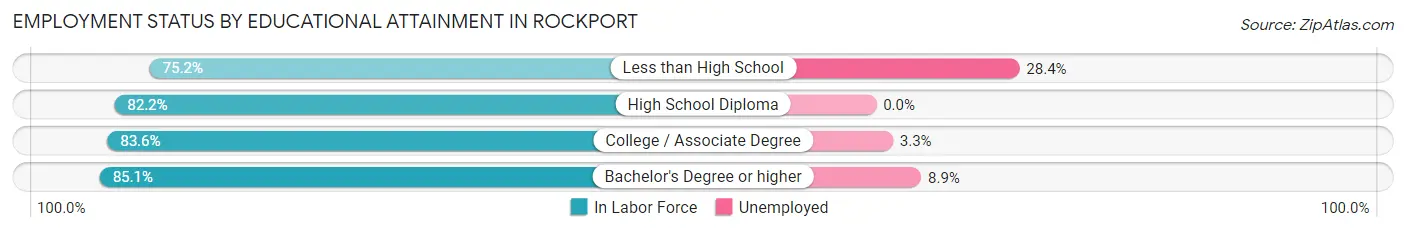
| Educational Attainment | In Labor Force | Unemployed |
| Less than High School | 88 (75.2%) | 33 (28.4%) |
| High School Diploma | 120 (82.2%) | 0 (0.0%) |
| College / Associate Degree | 479 (83.6%) | 19 (3.3%) |
| Bachelor's Degree or higher | 1,071 (85.1%) | 112 (8.9%) |
| Total | 1,758 (83.9%) | 161 (7.7%) |
Employment Occupations by Sex in Rockport
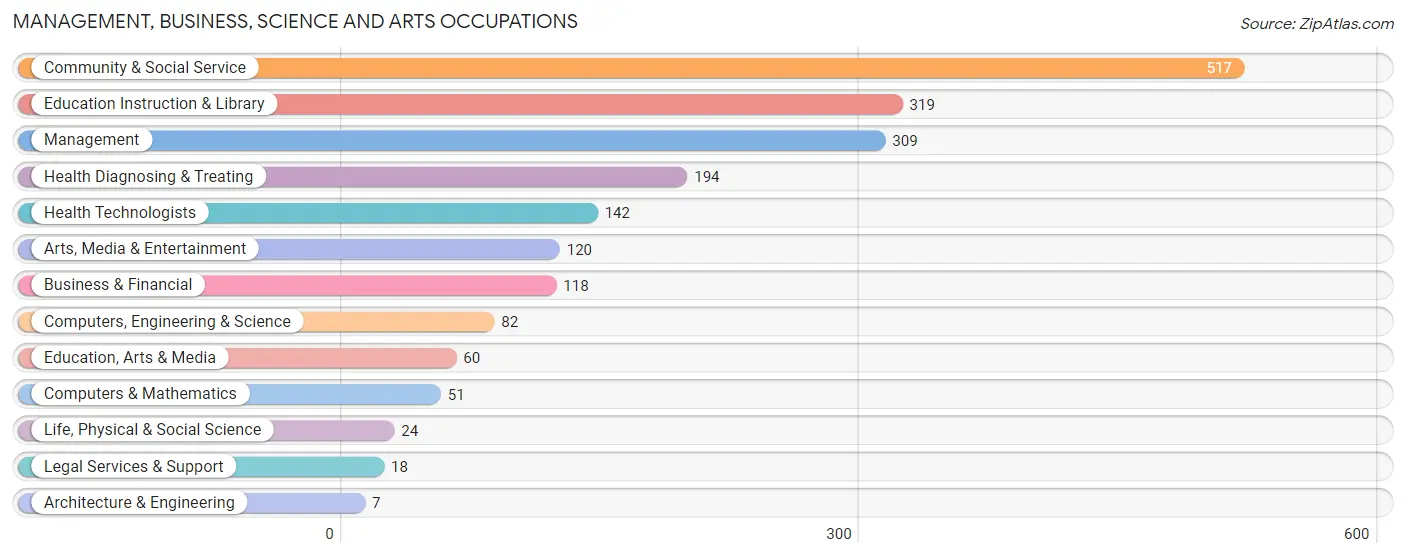
Management, Business, Science and Arts Occupations
The most common Management, Business, Science and Arts occupations in Rockport are Community & Social Service (517 | 21.9%), Education Instruction & Library (319 | 13.5%), Management (309 | 13.1%), Health Diagnosing & Treating (194 | 8.2%), and Health Technologists (142 | 6.0%).
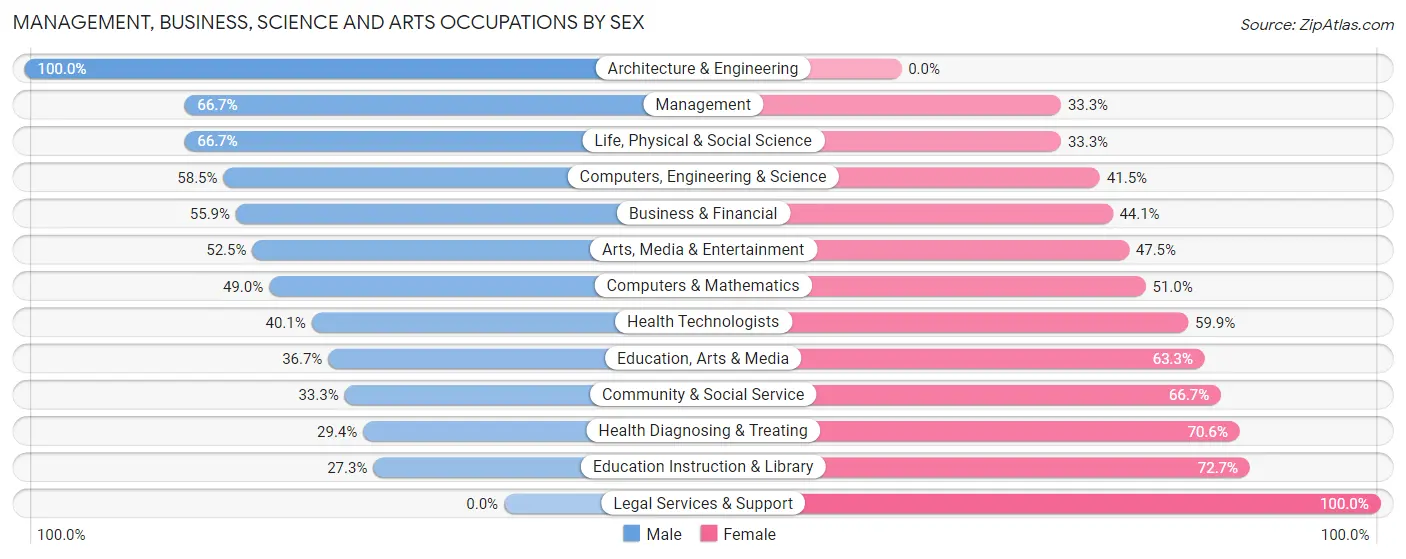
Management, Business, Science and Arts Occupations by Sex
Within the Management, Business, Science and Arts occupations in Rockport, the most male-oriented occupations are Architecture & Engineering (100.0%), Management (66.7%), and Life, Physical & Social Science (66.7%), while the most female-oriented occupations are Legal Services & Support (100.0%), Education Instruction & Library (72.7%), and Health Diagnosing & Treating (70.6%).
| Occupation | Male | Female |
| Management | 206 (66.7%) | 103 (33.3%) |
| Business & Financial | 66 (55.9%) | 52 (44.1%) |
| Computers, Engineering & Science | 48 (58.5%) | 34 (41.5%) |
| Computers & Mathematics | 25 (49.0%) | 26 (51.0%) |
| Architecture & Engineering | 7 (100.0%) | 0 (0.0%) |
| Life, Physical & Social Science | 16 (66.7%) | 8 (33.3%) |
| Community & Social Service | 172 (33.3%) | 345 (66.7%) |
| Education, Arts & Media | 22 (36.7%) | 38 (63.3%) |
| Legal Services & Support | 0 (0.0%) | 18 (100.0%) |
| Education Instruction & Library | 87 (27.3%) | 232 (72.7%) |
| Arts, Media & Entertainment | 63 (52.5%) | 57 (47.5%) |
| Health Diagnosing & Treating | 57 (29.4%) | 137 (70.6%) |
| Health Technologists | 57 (40.1%) | 85 (59.9%) |
| Total (Category) | 549 (45.0%) | 671 (55.0%) |
| Total (Overall) | 1,073 (45.4%) | 1,289 (54.6%) |
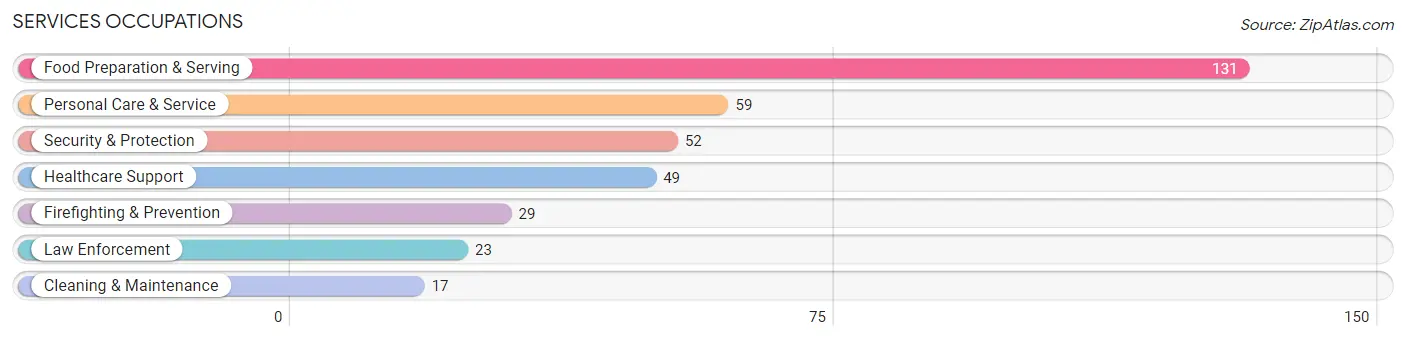
Services Occupations
The most common Services occupations in Rockport are Food Preparation & Serving (131 | 5.6%), Personal Care & Service (59 | 2.5%), Security & Protection (52 | 2.2%), Healthcare Support (49 | 2.1%), and Firefighting & Prevention (29 | 1.2%).
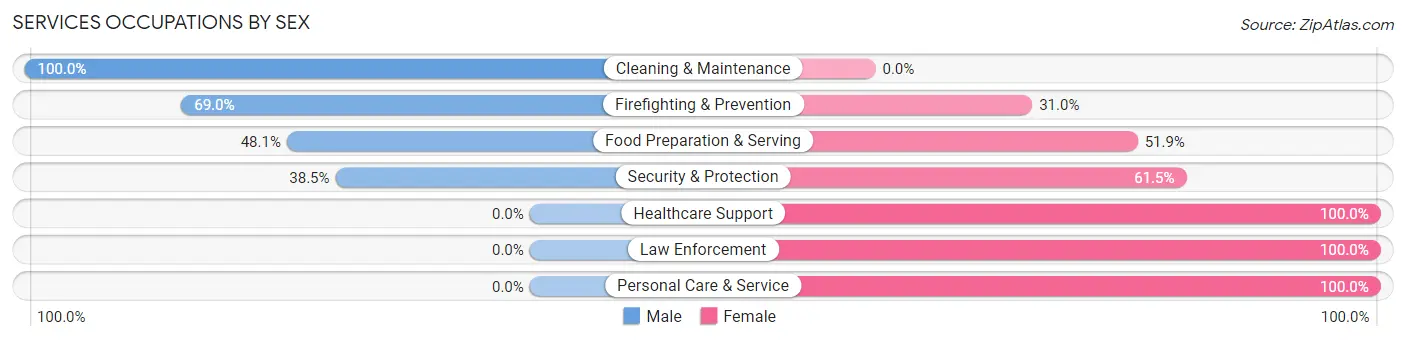
Services Occupations by Sex
Within the Services occupations in Rockport, the most male-oriented occupations are Cleaning & Maintenance (100.0%), Firefighting & Prevention (69.0%), and Food Preparation & Serving (48.1%), while the most female-oriented occupations are Healthcare Support (100.0%), Law Enforcement (100.0%), and Personal Care & Service (100.0%).
| Occupation | Male | Female |
| Healthcare Support | 0 (0.0%) | 49 (100.0%) |
| Security & Protection | 20 (38.5%) | 32 (61.5%) |
| Firefighting & Prevention | 20 (69.0%) | 9 (31.0%) |
| Law Enforcement | 0 (0.0%) | 23 (100.0%) |
| Food Preparation & Serving | 63 (48.1%) | 68 (51.9%) |
| Cleaning & Maintenance | 17 (100.0%) | 0 (0.0%) |
| Personal Care & Service | 0 (0.0%) | 59 (100.0%) |
| Total (Category) | 100 (32.5%) | 208 (67.5%) |
| Total (Overall) | 1,073 (45.4%) | 1,289 (54.6%) |
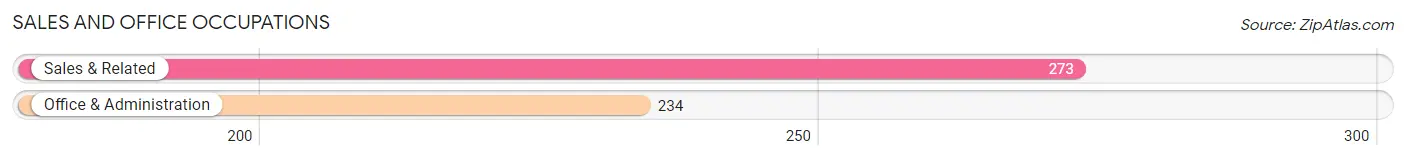
Sales and Office Occupations
The most common Sales and Office occupations in Rockport are Sales & Related (273 | 11.6%), and Office & Administration (234 | 9.9%).
Sales and Office Occupations by Sex
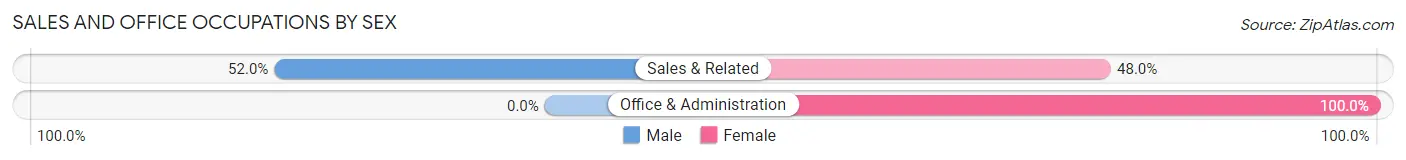
| Occupation | Male | Female |
| Sales & Related | 142 (52.0%) | 131 (48.0%) |
| Office & Administration | 0 (0.0%) | 234 (100.0%) |
| Total (Category) | 142 (28.0%) | 365 (72.0%) |
| Total (Overall) | 1,073 (45.4%) | 1,289 (54.6%) |
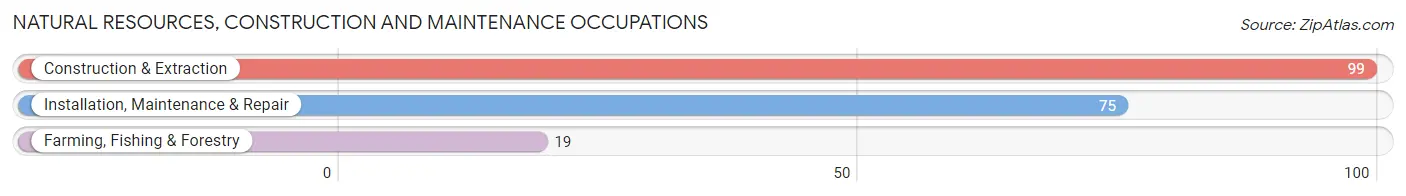
Natural Resources, Construction and Maintenance Occupations
The most common Natural Resources, Construction and Maintenance occupations in Rockport are Construction & Extraction (99 | 4.2%), Installation, Maintenance & Repair (75 | 3.2%), and Farming, Fishing & Forestry (19 | 0.8%).
Natural Resources, Construction and Maintenance Occupations by Sex
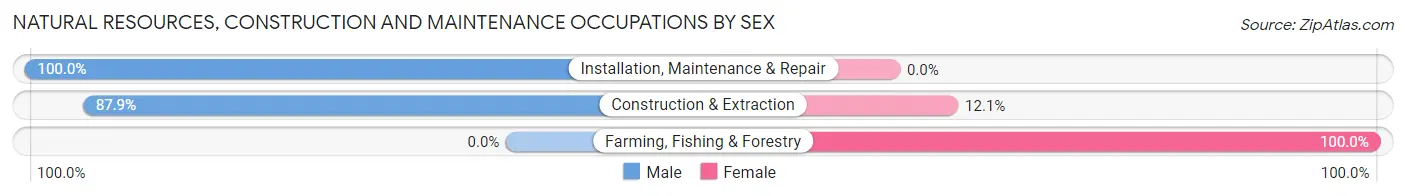
| Occupation | Male | Female |
| Farming, Fishing & Forestry | 0 (0.0%) | 19 (100.0%) |
| Construction & Extraction | 87 (87.9%) | 12 (12.1%) |
| Installation, Maintenance & Repair | 75 (100.0%) | 0 (0.0%) |
| Total (Category) | 162 (83.9%) | 31 (16.1%) |
| Total (Overall) | 1,073 (45.4%) | 1,289 (54.6%) |
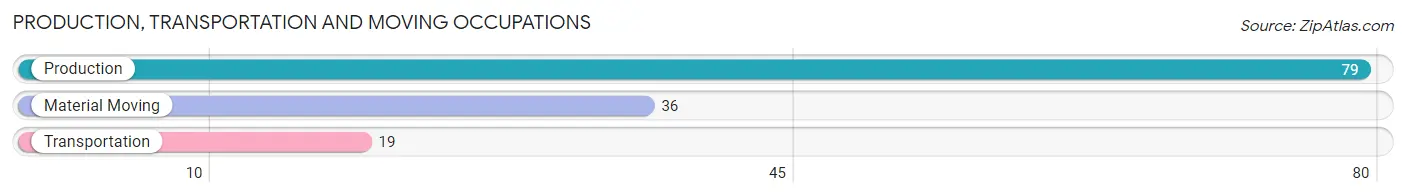
Production, Transportation and Moving Occupations
The most common Production, Transportation and Moving occupations in Rockport are Production (79 | 3.3%), Material Moving (36 | 1.5%), and Transportation (19 | 0.8%).
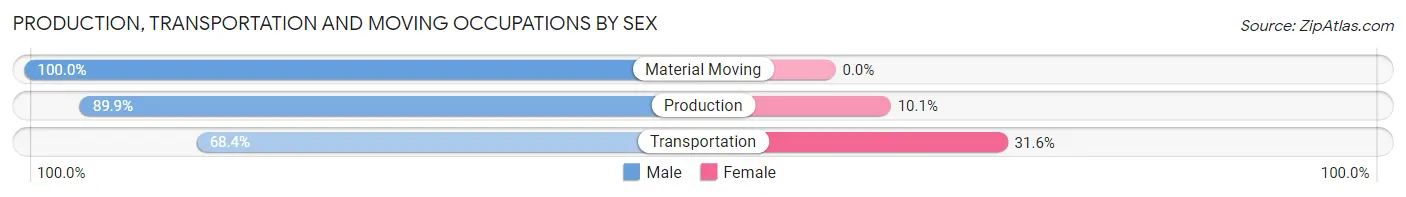
Production, Transportation and Moving Occupations by Sex
| Occupation | Male | Female |
| Production | 71 (89.9%) | 8 (10.1%) |
| Transportation | 13 (68.4%) | 6 (31.6%) |
| Material Moving | 36 (100.0%) | 0 (0.0%) |
| Total (Category) | 120 (89.5%) | 14 (10.4%) |
| Total (Overall) | 1,073 (45.4%) | 1,289 (54.6%) |
Employment Industries by Sex in Rockport
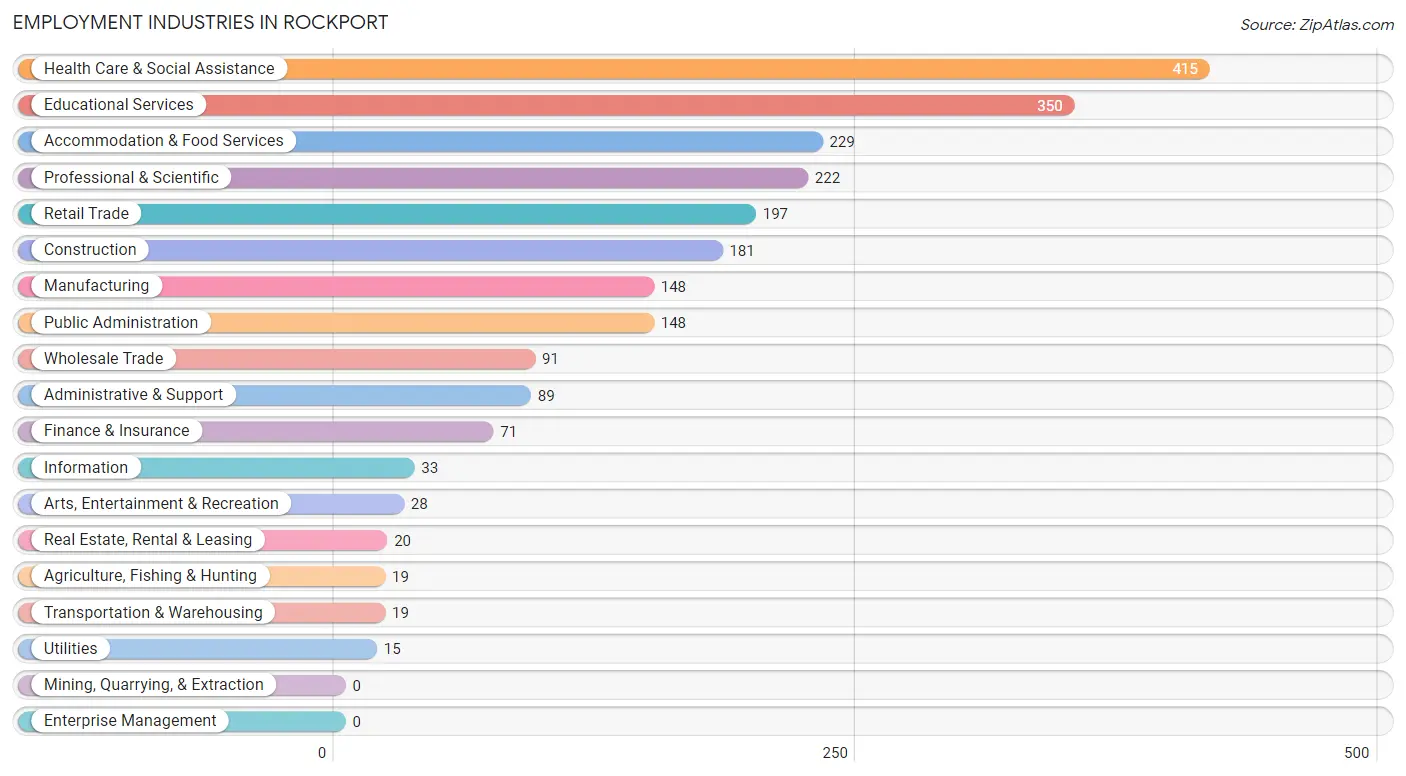
Employment Industries in Rockport
The major employment industries in Rockport include Health Care & Social Assistance (415 | 17.6%), Educational Services (350 | 14.8%), Accommodation & Food Services (229 | 9.7%), Professional & Scientific (222 | 9.4%), and Retail Trade (197 | 8.3%).
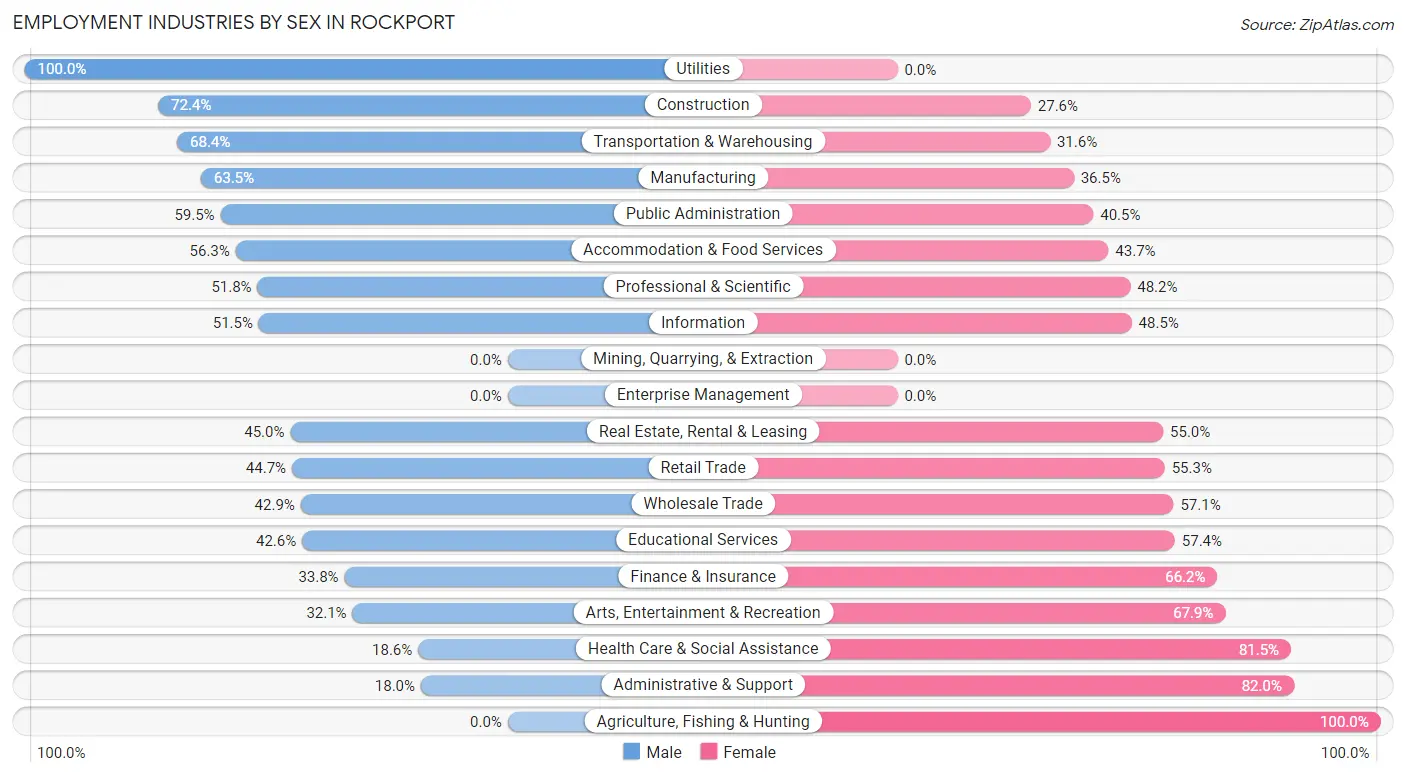
Employment Industries by Sex in Rockport
The Rockport industries that see more men than women are Utilities (100.0%), Construction (72.4%), and Transportation & Warehousing (68.4%), whereas the industries that tend to have a higher number of women are Agriculture, Fishing & Hunting (100.0%), Administrative & Support (82.0%), and Health Care & Social Assistance (81.5%).
| Industry | Male | Female |
| Agriculture, Fishing & Hunting | 0 (0.0%) | 19 (100.0%) |
| Mining, Quarrying, & Extraction | 0 (0.0%) | 0 (0.0%) |
| Construction | 131 (72.4%) | 50 (27.6%) |
| Manufacturing | 94 (63.5%) | 54 (36.5%) |
| Wholesale Trade | 39 (42.9%) | 52 (57.1%) |
| Retail Trade | 88 (44.7%) | 109 (55.3%) |
| Transportation & Warehousing | 13 (68.4%) | 6 (31.6%) |
| Utilities | 15 (100.0%) | 0 (0.0%) |
| Information | 17 (51.5%) | 16 (48.5%) |
| Finance & Insurance | 24 (33.8%) | 47 (66.2%) |
| Real Estate, Rental & Leasing | 9 (45.0%) | 11 (55.0%) |
| Professional & Scientific | 115 (51.8%) | 107 (48.2%) |
| Enterprise Management | 0 (0.0%) | 0 (0.0%) |
| Administrative & Support | 16 (18.0%) | 73 (82.0%) |
| Educational Services | 149 (42.6%) | 201 (57.4%) |
| Health Care & Social Assistance | 77 (18.5%) | 338 (81.5%) |
| Arts, Entertainment & Recreation | 9 (32.1%) | 19 (67.9%) |
| Accommodation & Food Services | 129 (56.3%) | 100 (43.7%) |
| Public Administration | 88 (59.5%) | 60 (40.5%) |
| Total | 1,073 (45.4%) | 1,289 (54.6%) |
Education in Rockport
School Enrollment in Rockport
The most common levels of schooling among the 702 students in Rockport are middle school (194 | 27.6%), college / undergraduate (149 | 21.2%), and high school (147 | 20.9%).
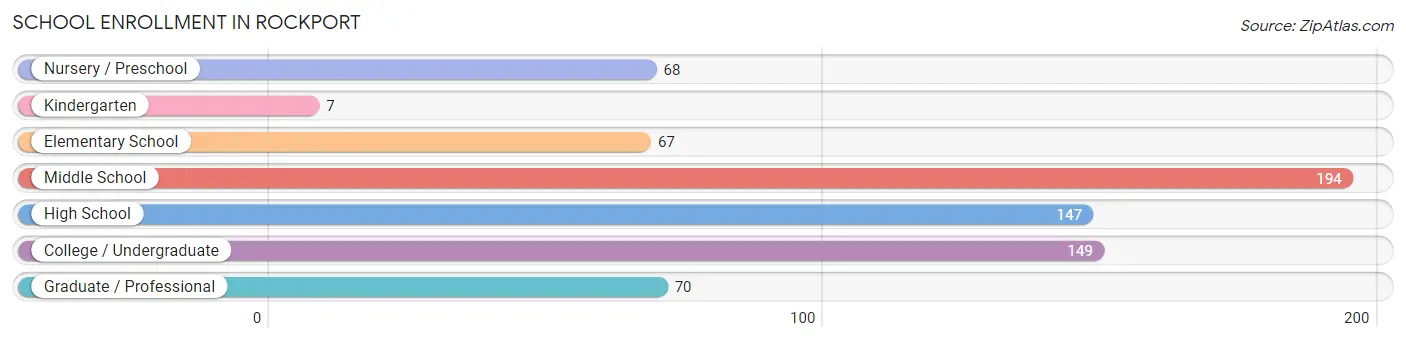
| School Level | # Students | % Students |
| Nursery / Preschool | 68 | 9.7% |
| Kindergarten | 7 | 1.0% |
| Elementary School | 67 | 9.5% |
| Middle School | 194 | 27.6% |
| High School | 147 | 20.9% |
| College / Undergraduate | 149 | 21.2% |
| Graduate / Professional | 70 | 10.0% |
| Total | 702 | 100.0% |
School Enrollment by Age by Funding Source in Rockport
Out of a total of 702 students who are enrolled in schools in Rockport, 168 (23.9%) attend a private institution, while the remaining 534 (76.1%) are enrolled in public schools. The age group of 25 to 34 year olds has the highest likelihood of being enrolled in private schools, with 27 (100.0% in the age bracket) enrolled. Conversely, the age group of 10 to 14 year olds has the lowest likelihood of being enrolled in a private school, with 201 (100.0% in the age bracket) attending a public institution.
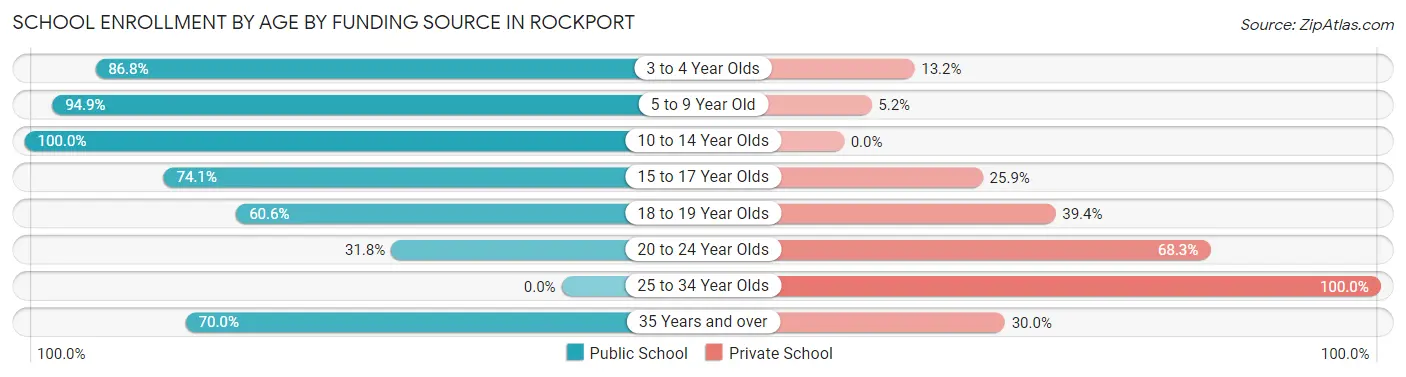
| Age Bracket | Public School | Private School |
| 3 to 4 Year Olds | 33 (86.8%) | 5 (13.2%) |
| 5 to 9 Year Old | 92 (94.9%) | 5 (5.1%) |
| 10 to 14 Year Olds | 201 (100.0%) | 0 (0.0%) |
| 15 to 17 Year Olds | 83 (74.1%) | 29 (25.9%) |
| 18 to 19 Year Olds | 63 (60.6%) | 41 (39.4%) |
| 20 to 24 Year Olds | 20 (31.8%) | 43 (68.2%) |
| 25 to 34 Year Olds | 0 (0.0%) | 27 (100.0%) |
| 35 Years and over | 42 (70.0%) | 18 (30.0%) |
| Total | 534 (76.1%) | 168 (23.9%) |
Educational Attainment by Field of Study in Rockport
Education (441 | 16.2%), business (339 | 12.4%), social sciences (265 | 9.7%), science & technology (255 | 9.4%), and visual & performing arts (234 | 8.6%) are the most common fields of study among 2,724 individuals in Rockport who have obtained a bachelor's degree or higher.
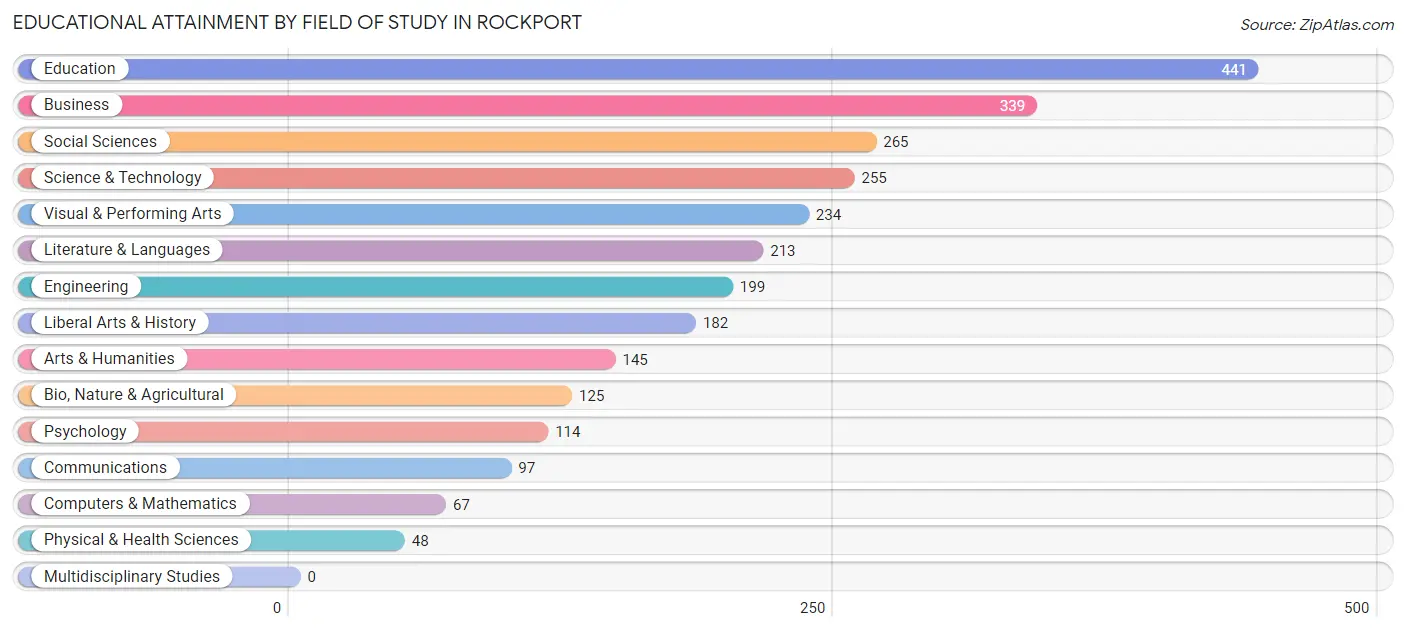
| Field of Study | # Graduates | % Graduates |
| Computers & Mathematics | 67 | 2.5% |
| Bio, Nature & Agricultural | 125 | 4.6% |
| Physical & Health Sciences | 48 | 1.8% |
| Psychology | 114 | 4.2% |
| Social Sciences | 265 | 9.7% |
| Engineering | 199 | 7.3% |
| Multidisciplinary Studies | 0 | 0.0% |
| Science & Technology | 255 | 9.4% |
| Business | 339 | 12.4% |
| Education | 441 | 16.2% |
| Literature & Languages | 213 | 7.8% |
| Liberal Arts & History | 182 | 6.7% |
| Visual & Performing Arts | 234 | 8.6% |
| Communications | 97 | 3.6% |
| Arts & Humanities | 145 | 5.3% |
| Total | 2,724 | 100.0% |
Transportation & Commute in Rockport
Vehicle Availability by Sex in Rockport
The most prevalent vehicle ownership categories in Rockport are males with 2 vehicles (562, accounting for 52.4%) and females with 2 vehicles (485, making up 44.4%).
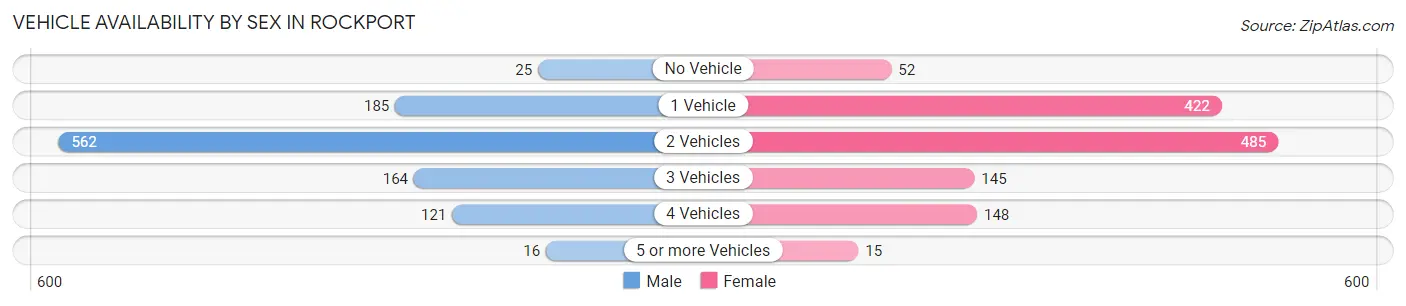
| Vehicles Available | Male | Female |
| No Vehicle | 25 (2.3%) | 52 (4.1%) |
| 1 Vehicle | 185 (17.2%) | 422 (33.3%) |
| 2 Vehicles | 562 (52.4%) | 485 (38.3%) |
| 3 Vehicles | 164 (15.3%) | 145 (11.4%) |
| 4 Vehicles | 121 (11.3%) | 148 (11.7%) |
| 5 or more Vehicles | 16 (1.5%) | 15 (1.2%) |
| Total | 1,073 (100.0%) | 1,267 (100.0%) |
Commute Time in Rockport
The most frequently occuring commute durations in Rockport are 5 to 9 minutes (369 commuters, 19.0%), 15 to 19 minutes (219 commuters, 11.3%), and 10 to 14 minutes (215 commuters, 11.1%).
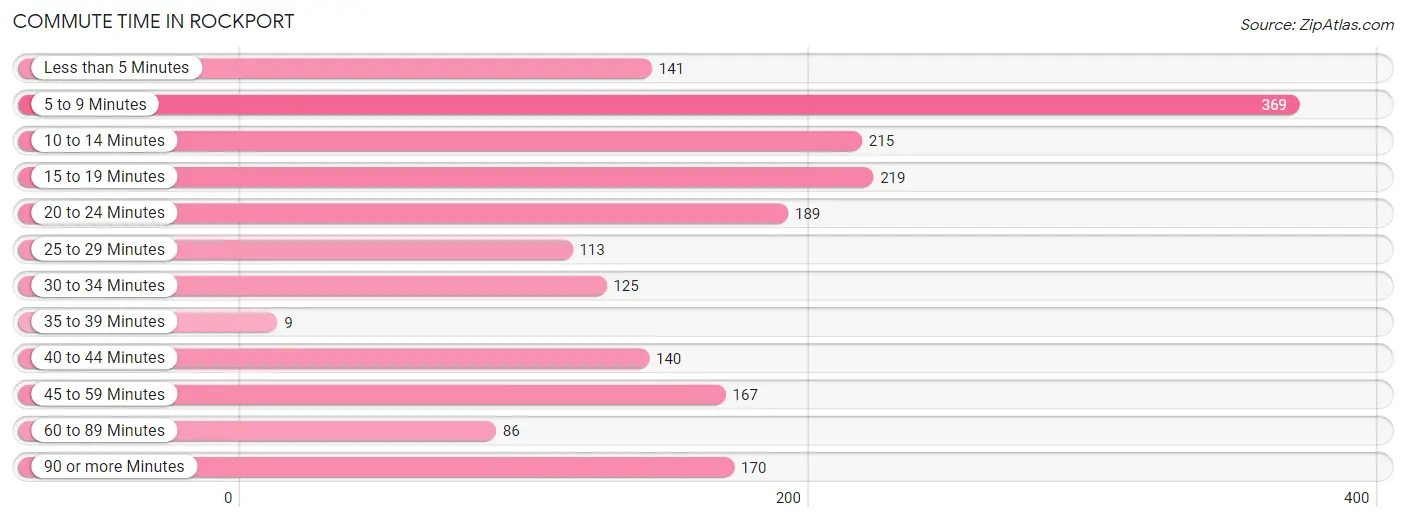
| Commute Time | # Commuters | % Commuters |
| Less than 5 Minutes | 141 | 7.3% |
| 5 to 9 Minutes | 369 | 19.0% |
| 10 to 14 Minutes | 215 | 11.1% |
| 15 to 19 Minutes | 219 | 11.3% |
| 20 to 24 Minutes | 189 | 9.7% |
| 25 to 29 Minutes | 113 | 5.8% |
| 30 to 34 Minutes | 125 | 6.4% |
| 35 to 39 Minutes | 9 | 0.5% |
| 40 to 44 Minutes | 140 | 7.2% |
| 45 to 59 Minutes | 167 | 8.6% |
| 60 to 89 Minutes | 86 | 4.4% |
| 90 or more Minutes | 170 | 8.7% |
Commute Time by Sex in Rockport
The most common commute times in Rockport are 5 to 9 minutes (215 commuters, 25.0%) for males and 15 to 19 minutes (157 commuters, 14.5%) for females.
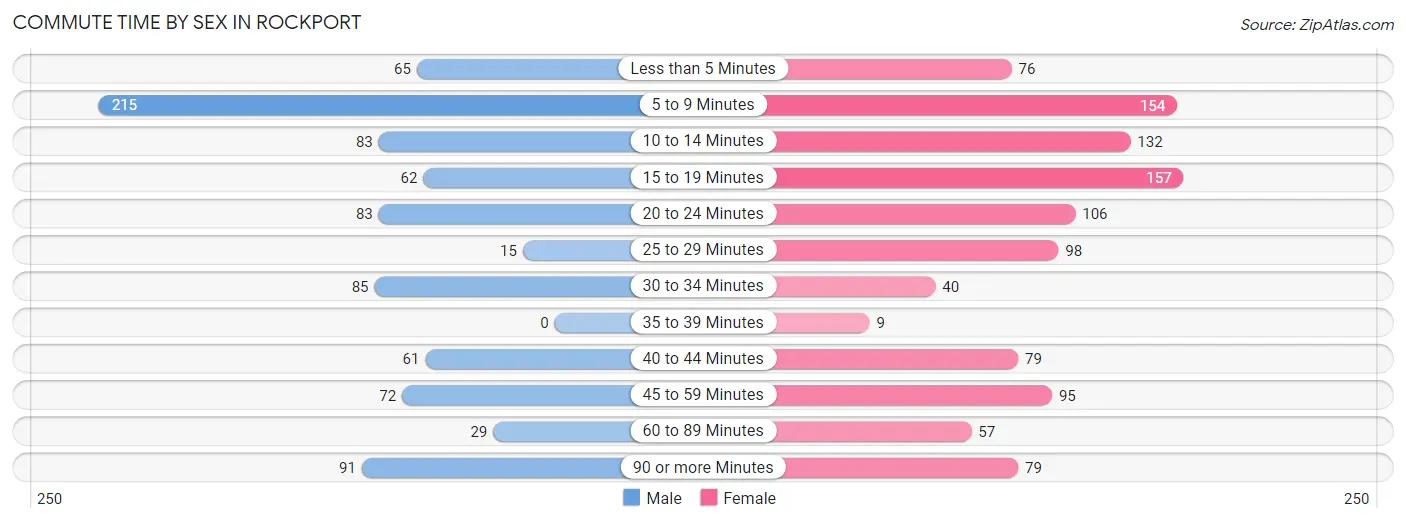
| Commute Time | Male | Female |
| Less than 5 Minutes | 65 (7.5%) | 76 (7.0%) |
| 5 to 9 Minutes | 215 (25.0%) | 154 (14.2%) |
| 10 to 14 Minutes | 83 (9.6%) | 132 (12.2%) |
| 15 to 19 Minutes | 62 (7.2%) | 157 (14.5%) |
| 20 to 24 Minutes | 83 (9.6%) | 106 (9.8%) |
| 25 to 29 Minutes | 15 (1.7%) | 98 (9.1%) |
| 30 to 34 Minutes | 85 (9.9%) | 40 (3.7%) |
| 35 to 39 Minutes | 0 (0.0%) | 9 (0.8%) |
| 40 to 44 Minutes | 61 (7.1%) | 79 (7.3%) |
| 45 to 59 Minutes | 72 (8.4%) | 95 (8.8%) |
| 60 to 89 Minutes | 29 (3.4%) | 57 (5.3%) |
| 90 or more Minutes | 91 (10.6%) | 79 (7.3%) |
Time of Departure to Work by Sex in Rockport
The most frequent times of departure to work in Rockport are 7:00 AM to 7:29 AM (159, 18.5%) for males and 9:00 AM to 9:59 AM (163, 15.1%) for females.
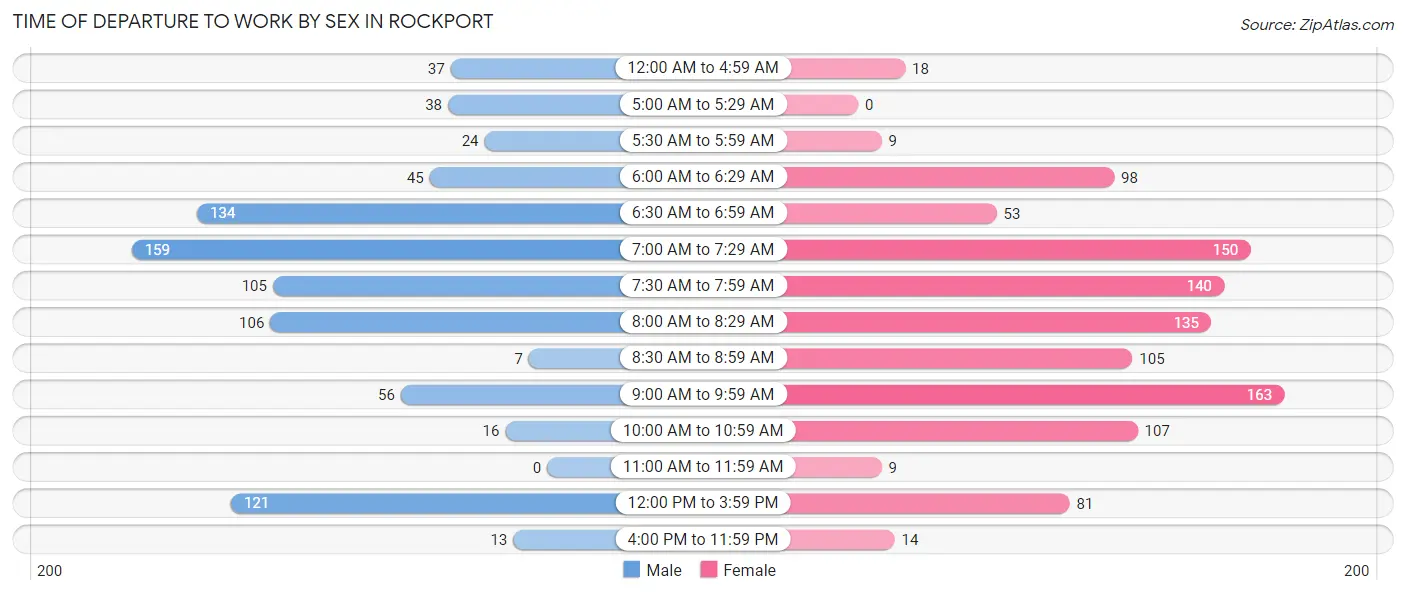
| Time of Departure | Male | Female |
| 12:00 AM to 4:59 AM | 37 (4.3%) | 18 (1.7%) |
| 5:00 AM to 5:29 AM | 38 (4.4%) | 0 (0.0%) |
| 5:30 AM to 5:59 AM | 24 (2.8%) | 9 (0.8%) |
| 6:00 AM to 6:29 AM | 45 (5.2%) | 98 (9.1%) |
| 6:30 AM to 6:59 AM | 134 (15.6%) | 53 (4.9%) |
| 7:00 AM to 7:29 AM | 159 (18.5%) | 150 (13.9%) |
| 7:30 AM to 7:59 AM | 105 (12.2%) | 140 (12.9%) |
| 8:00 AM to 8:29 AM | 106 (12.3%) | 135 (12.5%) |
| 8:30 AM to 8:59 AM | 7 (0.8%) | 105 (9.7%) |
| 9:00 AM to 9:59 AM | 56 (6.5%) | 163 (15.1%) |
| 10:00 AM to 10:59 AM | 16 (1.9%) | 107 (9.9%) |
| 11:00 AM to 11:59 AM | 0 (0.0%) | 9 (0.8%) |
| 12:00 PM to 3:59 PM | 121 (14.1%) | 81 (7.5%) |
| 4:00 PM to 11:59 PM | 13 (1.5%) | 14 (1.3%) |
| Total | 861 (100.0%) | 1,082 (100.0%) |
Housing Occupancy in Rockport
Occupancy by Ownership in Rockport
Of the total 2,372 dwellings in Rockport, owner-occupied units account for 1,585 (66.8%), while renter-occupied units make up 787 (33.2%).
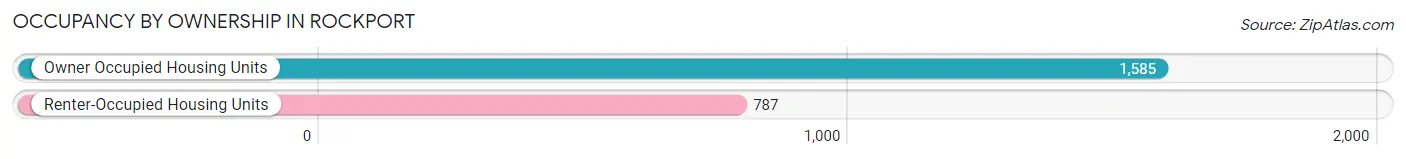
| Occupancy | # Housing Units | % Housing Units |
| Owner Occupied Housing Units | 1,585 | 66.8% |
| Renter-Occupied Housing Units | 787 | 33.2% |
| Total Occupied Housing Units | 2,372 | 100.0% |
Occupancy by Household Size in Rockport
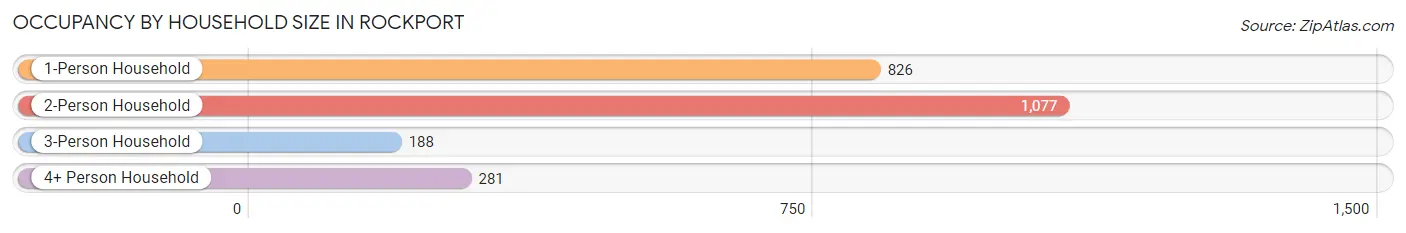
| Household Size | # Housing Units | % Housing Units |
| 1-Person Household | 826 | 34.8% |
| 2-Person Household | 1,077 | 45.4% |
| 3-Person Household | 188 | 7.9% |
| 4+ Person Household | 281 | 11.8% |
| Total Housing Units | 2,372 | 100.0% |
Occupancy by Ownership by Household Size in Rockport
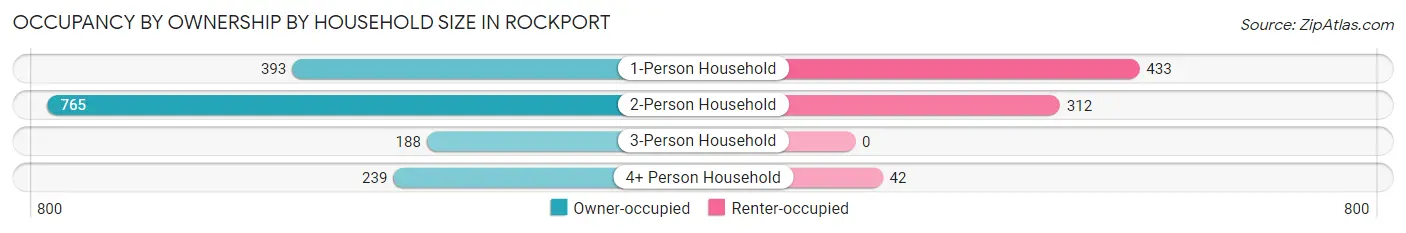
| Household Size | Owner-occupied | Renter-occupied |
| 1-Person Household | 393 (47.6%) | 433 (52.4%) |
| 2-Person Household | 765 (71.0%) | 312 (29.0%) |
| 3-Person Household | 188 (100.0%) | 0 (0.0%) |
| 4+ Person Household | 239 (85.1%) | 42 (14.9%) |
| Total Housing Units | 1,585 (66.8%) | 787 (33.2%) |
Occupancy by Educational Attainment in Rockport
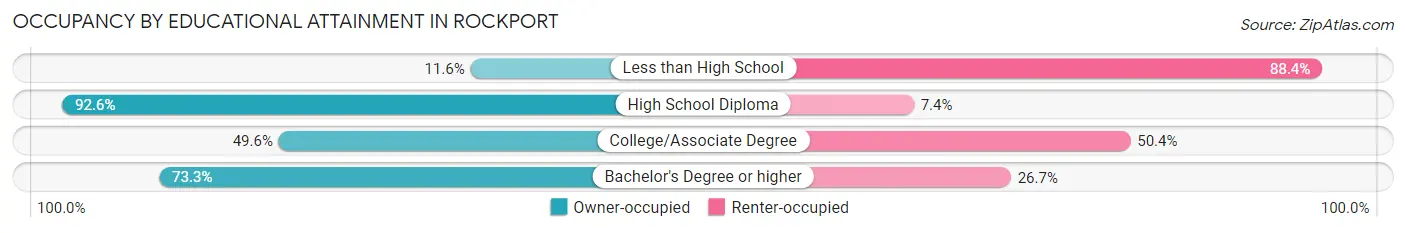
| Household Size | Owner-occupied | Renter-occupied |
| Less than High School | 8 (11.6%) | 61 (88.4%) |
| High School Diploma | 199 (92.6%) | 16 (7.4%) |
| College/Associate Degree | 320 (49.6%) | 325 (50.4%) |
| Bachelor's Degree or higher | 1,058 (73.3%) | 385 (26.7%) |
Occupancy by Age of Householder in Rockport
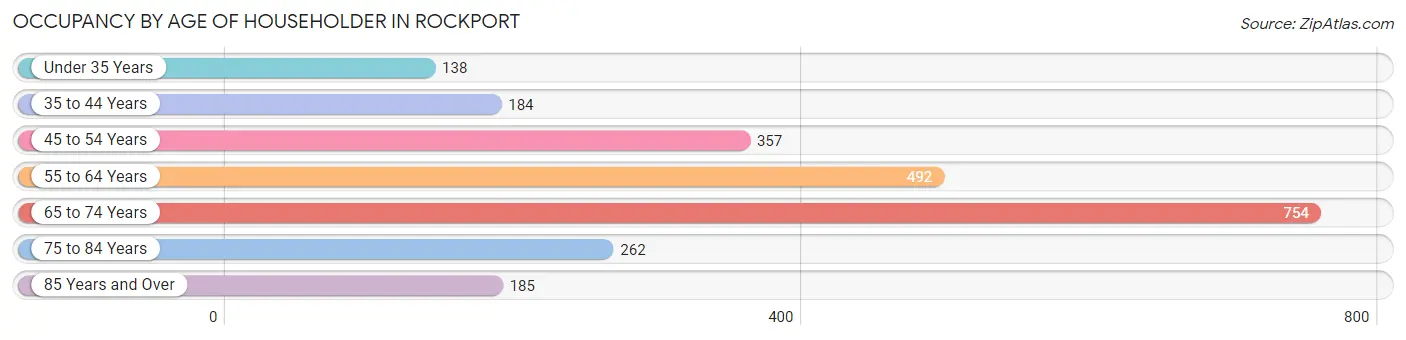
| Age Bracket | # Households | % Households |
| Under 35 Years | 138 | 5.8% |
| 35 to 44 Years | 184 | 7.8% |
| 45 to 54 Years | 357 | 15.0% |
| 55 to 64 Years | 492 | 20.7% |
| 65 to 74 Years | 754 | 31.8% |
| 75 to 84 Years | 262 | 11.1% |
| 85 Years and Over | 185 | 7.8% |
| Total | 2,372 | 100.0% |
Housing Finances in Rockport
Median Income by Occupancy in Rockport
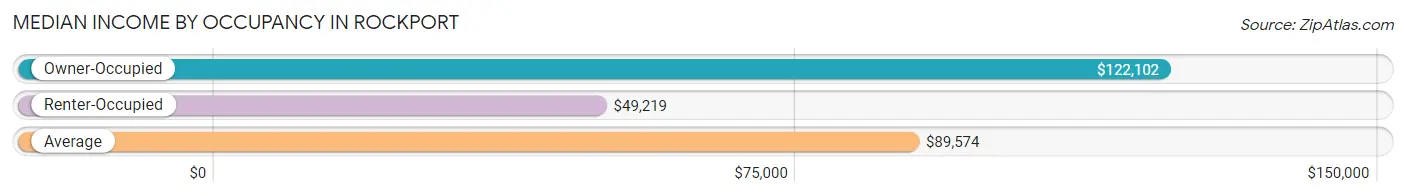
| Occupancy Type | # Households | Median Income |
| Owner-Occupied | 1,585 (66.8%) | $122,102 |
| Renter-Occupied | 787 (33.2%) | $49,219 |
| Average | 2,372 (100.0%) | $89,574 |
Occupancy by Householder Income Bracket in Rockport
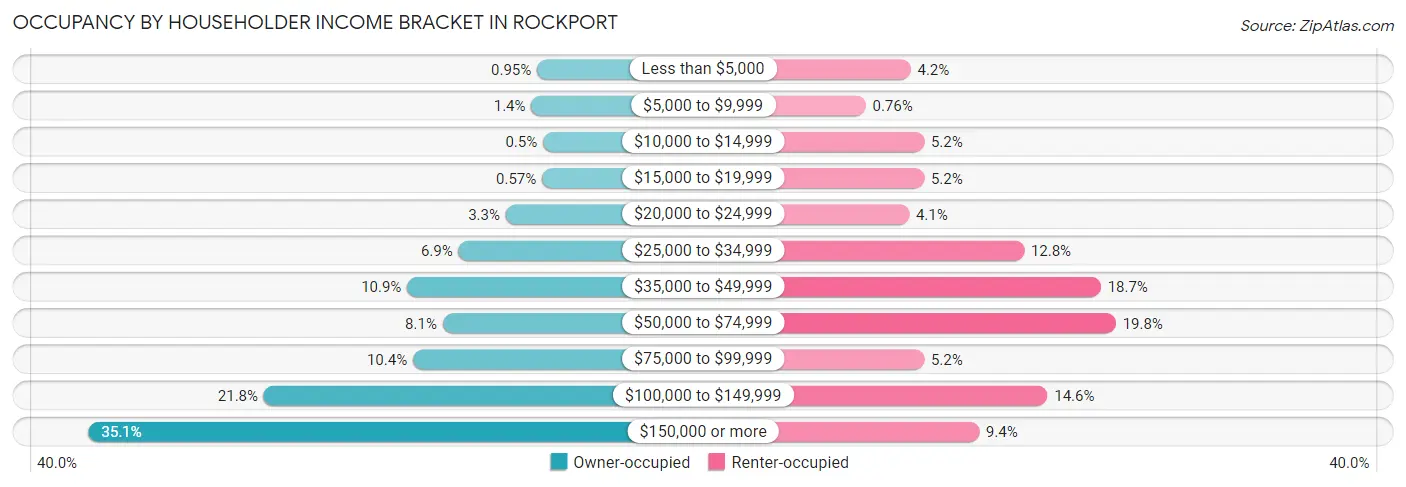
| Income Bracket | Owner-occupied | Renter-occupied |
| Less than $5,000 | 15 (0.9%) | 33 (4.2%) |
| $5,000 to $9,999 | 22 (1.4%) | 6 (0.8%) |
| $10,000 to $14,999 | 8 (0.5%) | 41 (5.2%) |
| $15,000 to $19,999 | 9 (0.6%) | 41 (5.2%) |
| $20,000 to $24,999 | 53 (3.3%) | 32 (4.1%) |
| $25,000 to $34,999 | 110 (6.9%) | 101 (12.8%) |
| $35,000 to $49,999 | 172 (10.8%) | 147 (18.7%) |
| $50,000 to $74,999 | 129 (8.1%) | 156 (19.8%) |
| $75,000 to $99,999 | 165 (10.4%) | 41 (5.2%) |
| $100,000 to $149,999 | 345 (21.8%) | 115 (14.6%) |
| $150,000 or more | 557 (35.1%) | 74 (9.4%) |
| Total | 1,585 (100.0%) | 787 (100.0%) |
Monthly Housing Cost Tiers in Rockport
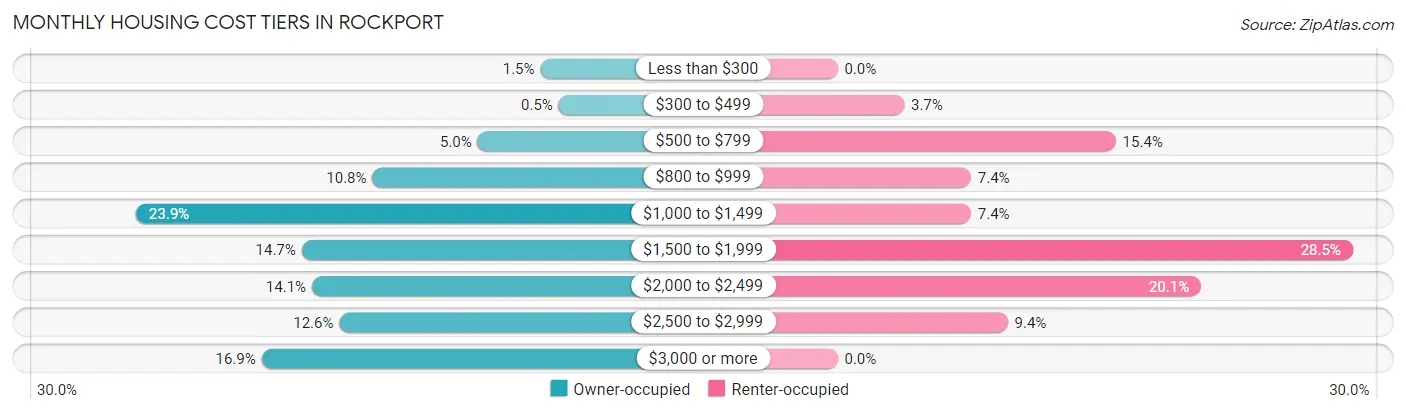
| Monthly Cost | Owner-occupied | Renter-occupied |
| Less than $300 | 24 (1.5%) | 0 (0.0%) |
| $300 to $499 | 8 (0.5%) | 29 (3.7%) |
| $500 to $799 | 79 (5.0%) | 121 (15.4%) |
| $800 to $999 | 171 (10.8%) | 58 (7.4%) |
| $1,000 to $1,499 | 378 (23.8%) | 58 (7.4%) |
| $1,500 to $1,999 | 233 (14.7%) | 224 (28.5%) |
| $2,000 to $2,499 | 224 (14.1%) | 158 (20.1%) |
| $2,500 to $2,999 | 200 (12.6%) | 74 (9.4%) |
| $3,000 or more | 268 (16.9%) | 0 (0.0%) |
| Total | 1,585 (100.0%) | 787 (100.0%) |
Physical Housing Characteristics in Rockport
Housing Structures in Rockport
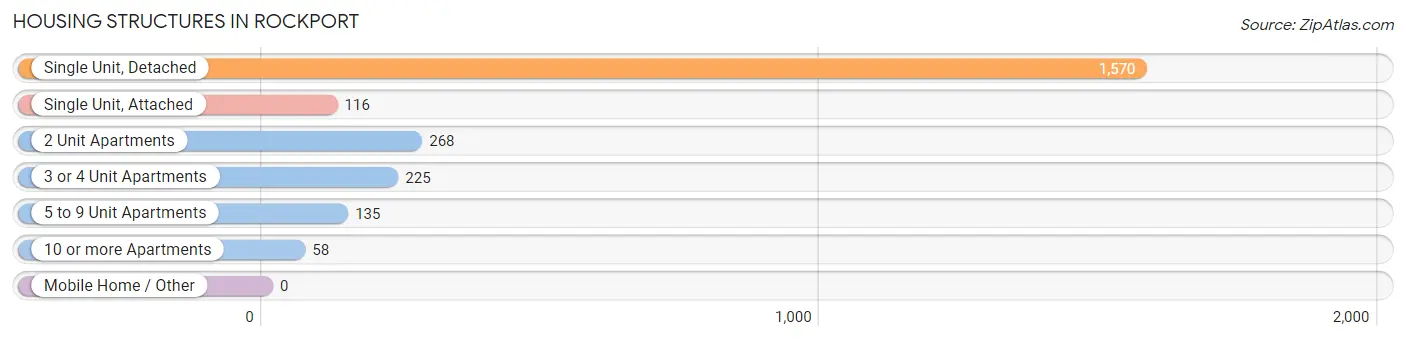
| Structure Type | # Housing Units | % Housing Units |
| Single Unit, Detached | 1,570 | 66.2% |
| Single Unit, Attached | 116 | 4.9% |
| 2 Unit Apartments | 268 | 11.3% |
| 3 or 4 Unit Apartments | 225 | 9.5% |
| 5 to 9 Unit Apartments | 135 | 5.7% |
| 10 or more Apartments | 58 | 2.5% |
| Mobile Home / Other | 0 | 0.0% |
| Total | 2,372 | 100.0% |
Housing Structures by Occupancy in Rockport
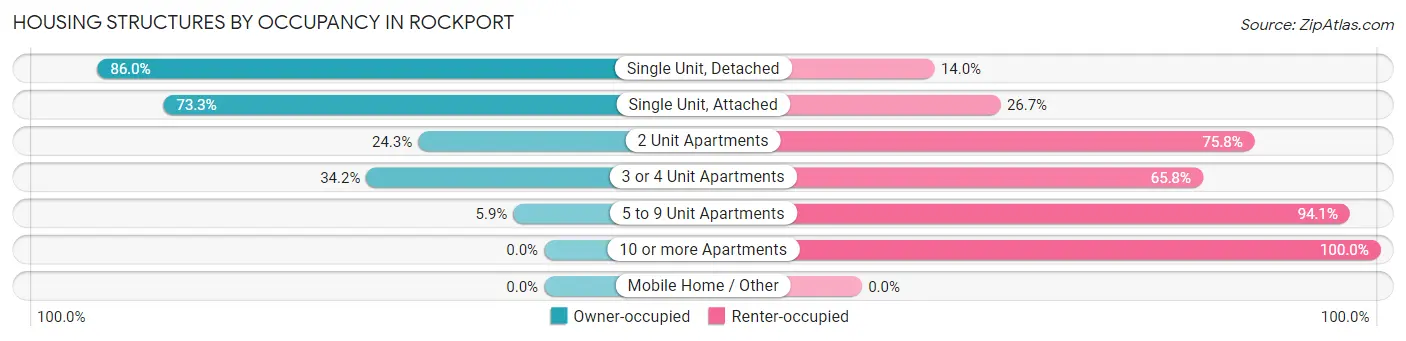
| Structure Type | Owner-occupied | Renter-occupied |
| Single Unit, Detached | 1,350 (86.0%) | 220 (14.0%) |
| Single Unit, Attached | 85 (73.3%) | 31 (26.7%) |
| 2 Unit Apartments | 65 (24.2%) | 203 (75.7%) |
| 3 or 4 Unit Apartments | 77 (34.2%) | 148 (65.8%) |
| 5 to 9 Unit Apartments | 8 (5.9%) | 127 (94.1%) |
| 10 or more Apartments | 0 (0.0%) | 58 (100.0%) |
| Mobile Home / Other | 0 (0.0%) | 0 (0.0%) |
| Total | 1,585 (66.8%) | 787 (33.2%) |
Housing Structures by Number of Rooms in Rockport
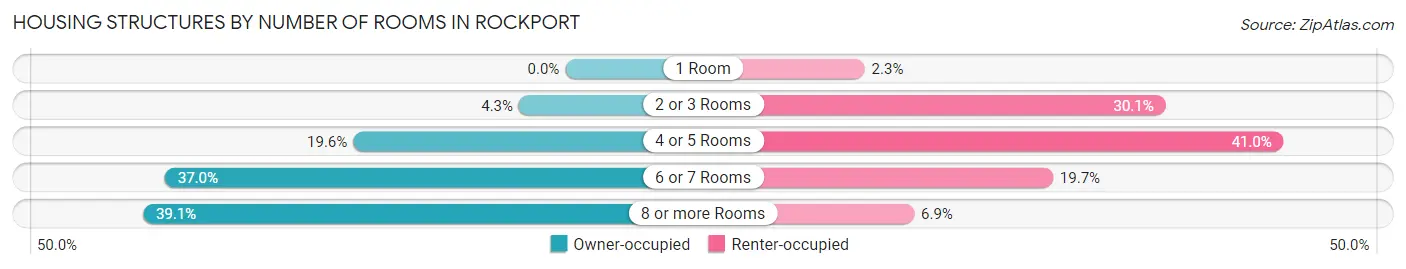
| Number of Rooms | Owner-occupied | Renter-occupied |
| 1 Room | 0 (0.0%) | 18 (2.3%) |
| 2 or 3 Rooms | 68 (4.3%) | 237 (30.1%) |
| 4 or 5 Rooms | 311 (19.6%) | 323 (41.0%) |
| 6 or 7 Rooms | 587 (37.0%) | 155 (19.7%) |
| 8 or more Rooms | 619 (39.1%) | 54 (6.9%) |
| Total | 1,585 (100.0%) | 787 (100.0%) |
Housing Structure by Heating Type in Rockport
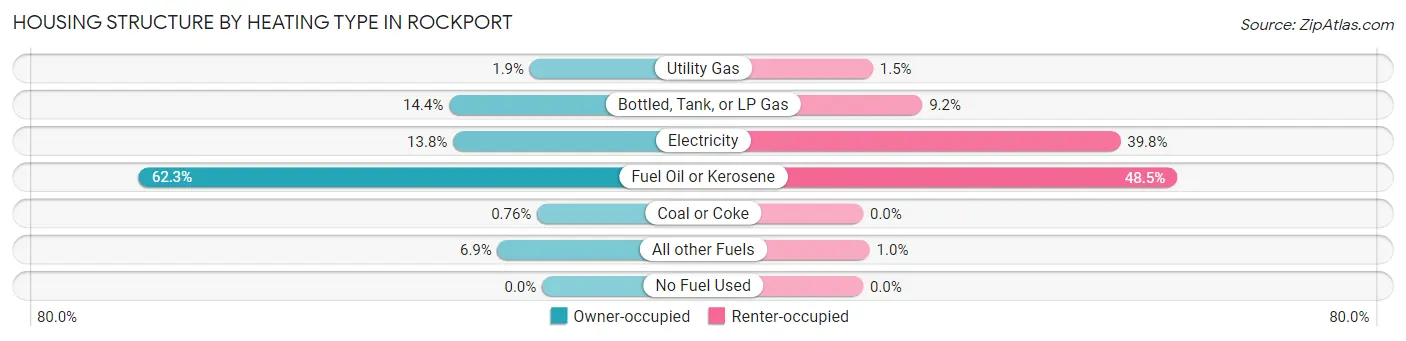
| Heating Type | Owner-occupied | Renter-occupied |
| Utility Gas | 30 (1.9%) | 12 (1.5%) |
| Bottled, Tank, or LP Gas | 228 (14.4%) | 72 (9.1%) |
| Electricity | 218 (13.8%) | 313 (39.8%) |
| Fuel Oil or Kerosene | 988 (62.3%) | 382 (48.5%) |
| Coal or Coke | 12 (0.8%) | 0 (0.0%) |
| All other Fuels | 109 (6.9%) | 8 (1.0%) |
| No Fuel Used | 0 (0.0%) | 0 (0.0%) |
| Total | 1,585 (100.0%) | 787 (100.0%) |
Household Vehicle Usage in Rockport
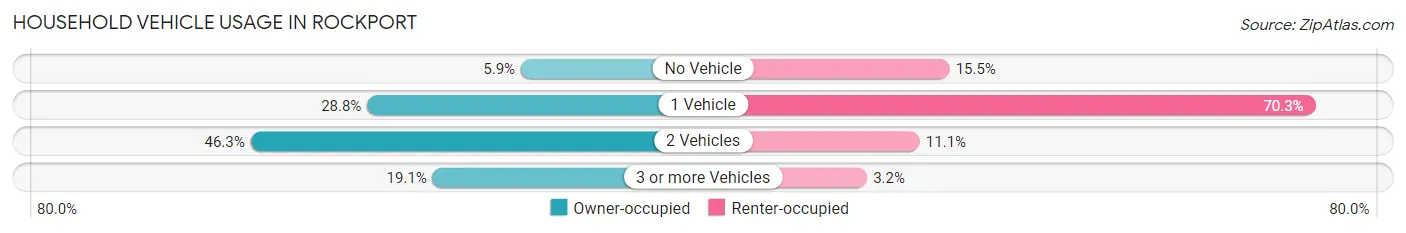
| Vehicles per Household | Owner-occupied | Renter-occupied |
| No Vehicle | 93 (5.9%) | 122 (15.5%) |
| 1 Vehicle | 457 (28.8%) | 553 (70.3%) |
| 2 Vehicles | 733 (46.3%) | 87 (11.1%) |
| 3 or more Vehicles | 302 (19.1%) | 25 (3.2%) |
| Total | 1,585 (100.0%) | 787 (100.0%) |
Real Estate & Mortgages in Rockport
Real Estate and Mortgage Overview in Rockport
| Characteristic | Without Mortgage | With Mortgage |
| Housing Units | 746 | 839 |
| Median Property Value | $700,200 | $608,400 |
| Median Household Income | $92,750 | $352 |
| Monthly Housing Costs | $1,053 | $268 |
| Real Estate Taxes | $6,349 | $0 |
Property Value by Mortgage Status in Rockport
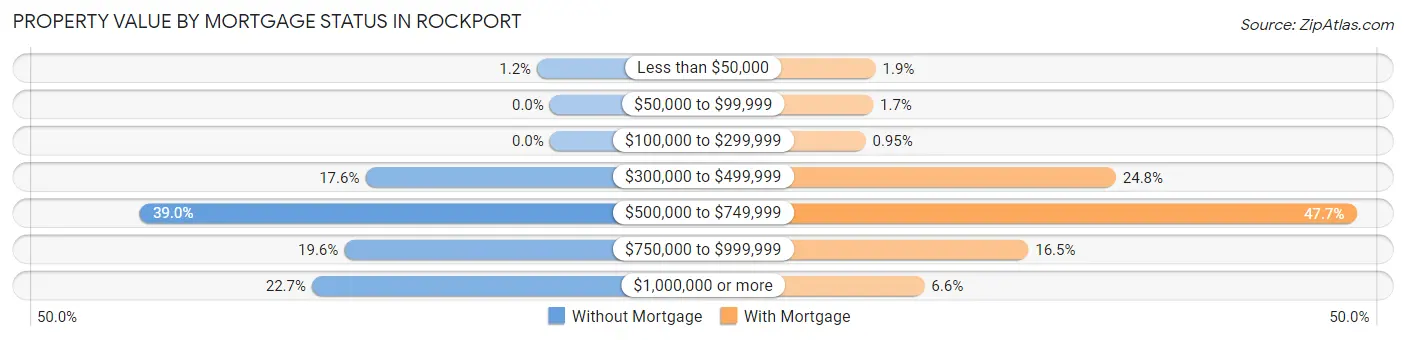
| Property Value | Without Mortgage | With Mortgage |
| Less than $50,000 | 9 (1.2%) | 16 (1.9%) |
| $50,000 to $99,999 | 0 (0.0%) | 14 (1.7%) |
| $100,000 to $299,999 | 0 (0.0%) | 8 (0.9%) |
| $300,000 to $499,999 | 131 (17.6%) | 208 (24.8%) |
| $500,000 to $749,999 | 291 (39.0%) | 400 (47.7%) |
| $750,000 to $999,999 | 146 (19.6%) | 138 (16.5%) |
| $1,000,000 or more | 169 (22.7%) | 55 (6.6%) |
| Total | 746 (100.0%) | 839 (100.0%) |
Household Income by Mortgage Status in Rockport
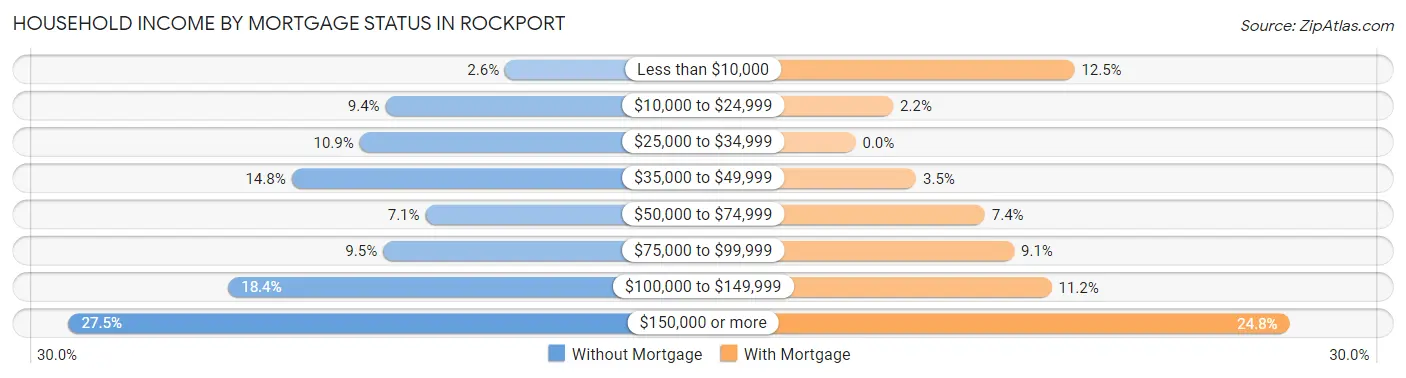
| Household Income | Without Mortgage | With Mortgage |
| Less than $10,000 | 19 (2.5%) | 105 (12.5%) |
| $10,000 to $24,999 | 70 (9.4%) | 18 (2.1%) |
| $25,000 to $34,999 | 81 (10.9%) | 0 (0.0%) |
| $35,000 to $49,999 | 110 (14.7%) | 29 (3.5%) |
| $50,000 to $74,999 | 53 (7.1%) | 62 (7.4%) |
| $75,000 to $99,999 | 71 (9.5%) | 76 (9.1%) |
| $100,000 to $149,999 | 137 (18.4%) | 94 (11.2%) |
| $150,000 or more | 205 (27.5%) | 208 (24.8%) |
| Total | 746 (100.0%) | 839 (100.0%) |
Property Value to Household Income Ratio in Rockport
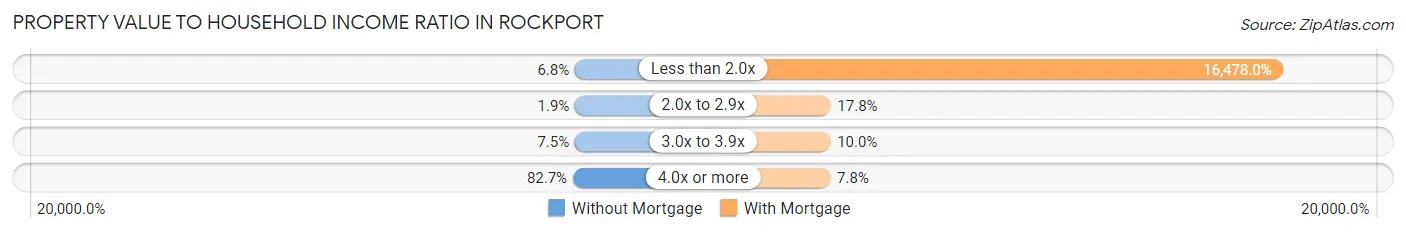
| Value-to-Income Ratio | Without Mortgage | With Mortgage |
| Less than 2.0x | 51 (6.8%) | 138,250 (16,478.0%) |
| 2.0x to 2.9x | 14 (1.9%) | 149 (17.8%) |
| 3.0x to 3.9x | 56 (7.5%) | 84 (10.0%) |
| 4.0x or more | 617 (82.7%) | 65 (7.7%) |
| Total | 746 (100.0%) | 839 (100.0%) |
Real Estate Taxes by Mortgage Status in Rockport
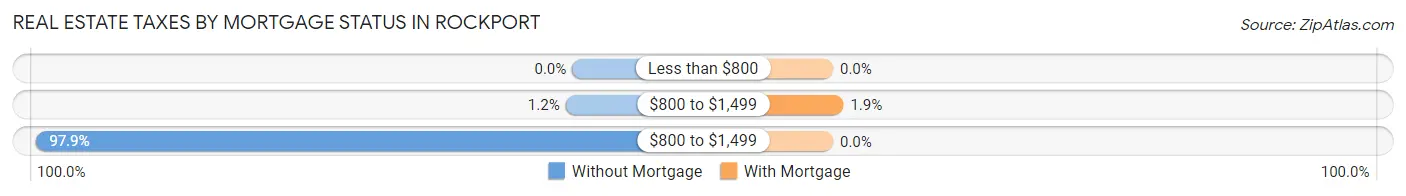
| Property Taxes | Without Mortgage | With Mortgage |
| Less than $800 | 0 (0.0%) | 0 (0.0%) |
| $800 to $1,499 | 9 (1.2%) | 16 (1.9%) |
| $800 to $1,499 | 730 (97.9%) | 0 (0.0%) |
| Total | 746 (100.0%) | 839 (100.0%) |
Health & Disability in Rockport
Health Insurance Coverage by Age in Rockport
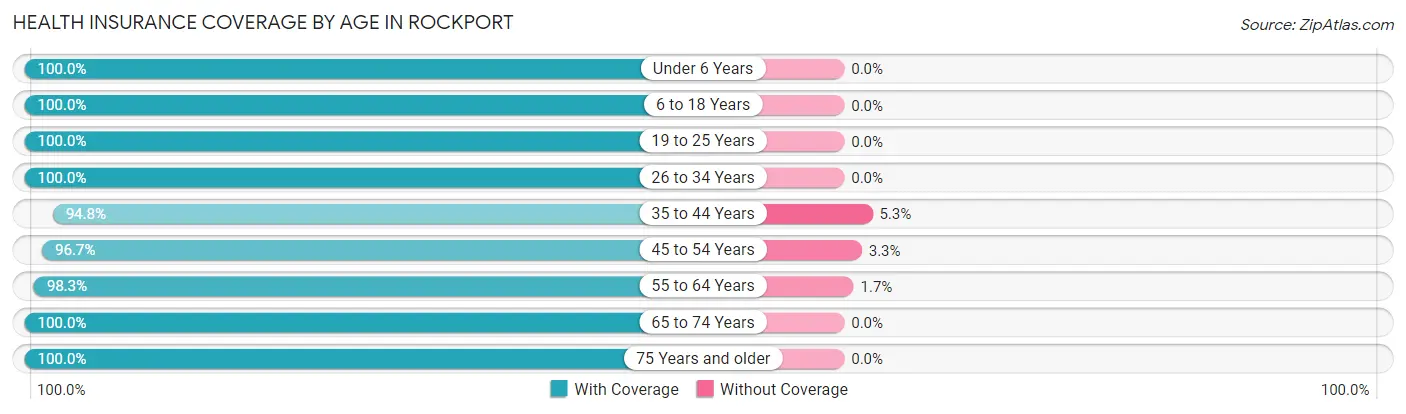
| Age Bracket | With Coverage | Without Coverage |
| Under 6 Years | 188 (100.0%) | 0 (0.0%) |
| 6 to 18 Years | 436 (100.0%) | 0 (0.0%) |
| 19 to 25 Years | 256 (100.0%) | 0 (0.0%) |
| 26 to 34 Years | 323 (100.0%) | 0 (0.0%) |
| 35 to 44 Years | 361 (94.8%) | 20 (5.2%) |
| 45 to 54 Years | 505 (96.7%) | 17 (3.3%) |
| 55 to 64 Years | 854 (98.3%) | 15 (1.7%) |
| 65 to 74 Years | 1,243 (100.0%) | 0 (0.0%) |
| 75 Years and older | 674 (100.0%) | 0 (0.0%) |
| Total | 4,840 (98.9%) | 52 (1.1%) |
Health Insurance Coverage by Citizenship Status in Rockport
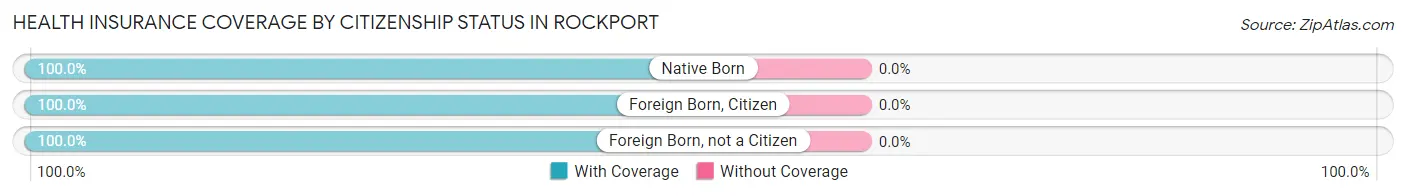
| Citizenship Status | With Coverage | Without Coverage |
| Native Born | 188 (100.0%) | 0 (0.0%) |
| Foreign Born, Citizen | 436 (100.0%) | 0 (0.0%) |
| Foreign Born, not a Citizen | 256 (100.0%) | 0 (0.0%) |
Health Insurance Coverage by Household Income in Rockport
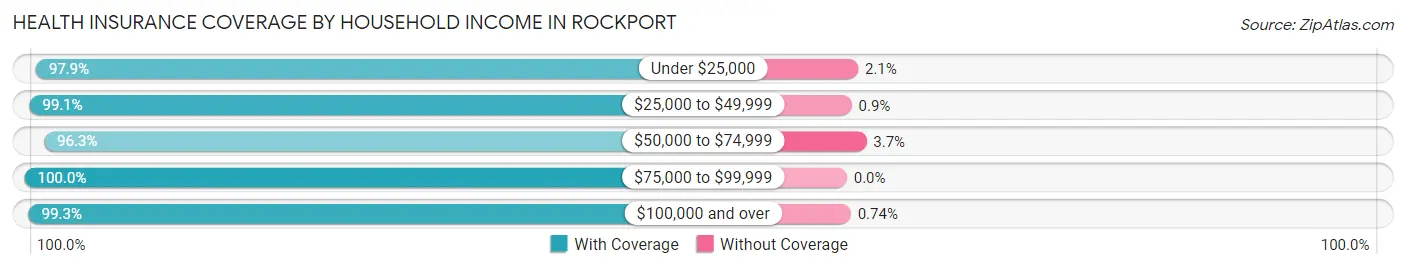
| Household Income | With Coverage | Without Coverage |
| Under $25,000 | 324 (97.9%) | 7 (2.1%) |
| $25,000 to $49,999 | 877 (99.1%) | 8 (0.9%) |
| $50,000 to $74,999 | 447 (96.3%) | 17 (3.7%) |
| $75,000 to $99,999 | 504 (100.0%) | 0 (0.0%) |
| $100,000 and over | 2,688 (99.3%) | 20 (0.7%) |
Public vs Private Health Insurance Coverage by Age in Rockport
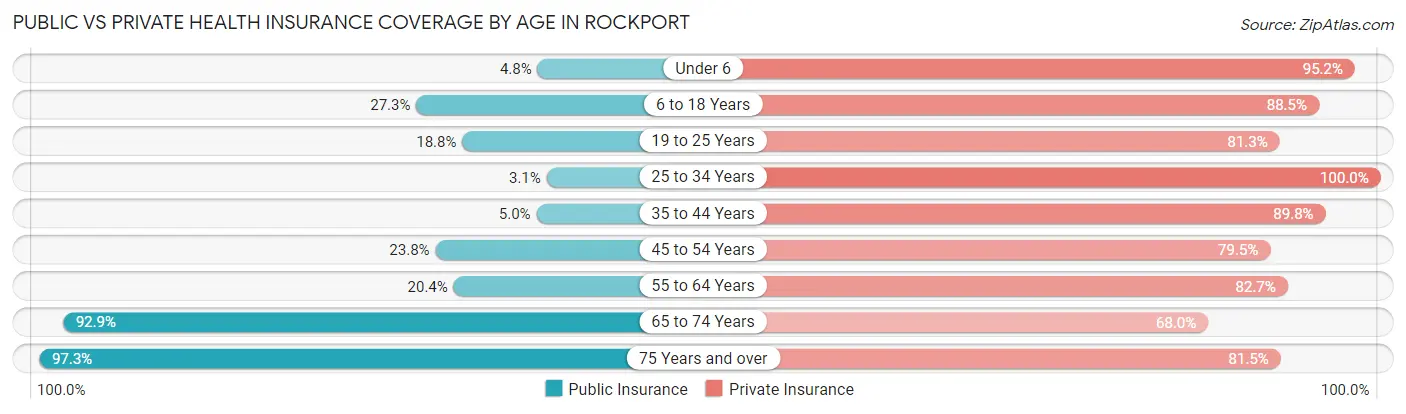
| Age Bracket | Public Insurance | Private Insurance |
| Under 6 | 9 (4.8%) | 179 (95.2%) |
| 6 to 18 Years | 119 (27.3%) | 386 (88.5%) |
| 19 to 25 Years | 48 (18.8%) | 208 (81.2%) |
| 25 to 34 Years | 10 (3.1%) | 323 (100.0%) |
| 35 to 44 Years | 19 (5.0%) | 342 (89.8%) |
| 45 to 54 Years | 124 (23.7%) | 415 (79.5%) |
| 55 to 64 Years | 177 (20.4%) | 719 (82.7%) |
| 65 to 74 Years | 1,155 (92.9%) | 845 (68.0%) |
| 75 Years and over | 656 (97.3%) | 549 (81.5%) |
| Total | 2,317 (47.4%) | 3,966 (81.1%) |
Disability Status by Sex by Age in Rockport
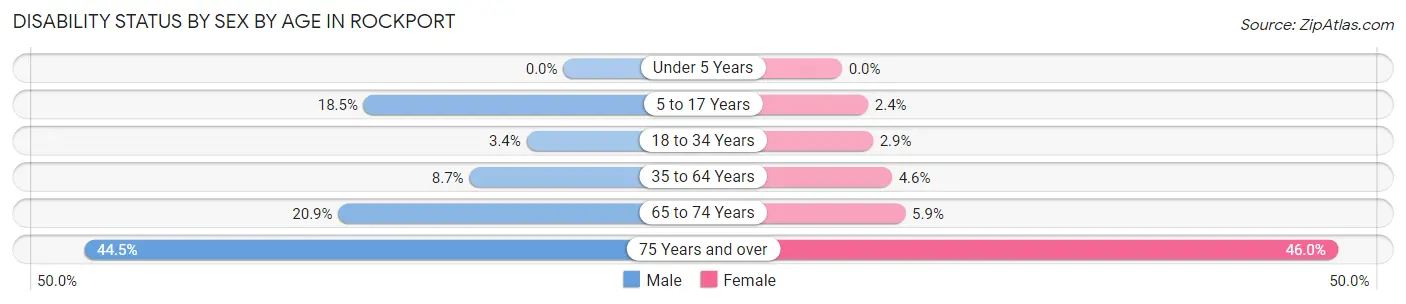
| Age Bracket | Male | Female |
| Under 5 Years | 0 (0.0%) | 0 (0.0%) |
| 5 to 17 Years | 30 (18.5%) | 6 (2.4%) |
| 18 to 34 Years | 10 (3.4%) | 10 (2.9%) |
| 35 to 64 Years | 66 (8.7%) | 47 (4.6%) |
| 65 to 74 Years | 114 (20.9%) | 41 (5.9%) |
| 75 Years and over | 149 (44.5%) | 156 (46.0%) |
Disability Class by Sex by Age in Rockport
Disability Class: Hearing Difficulty
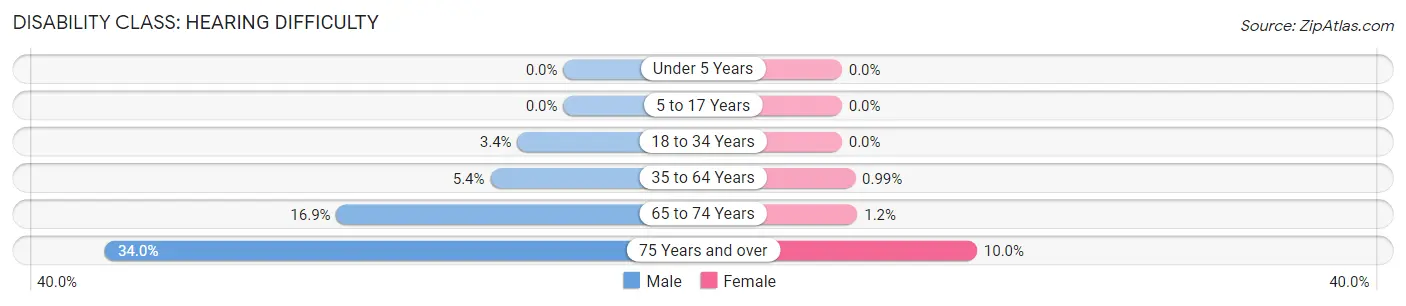
| Age Bracket | Male | Female |
| Under 5 Years | 0 (0.0%) | 0 (0.0%) |
| 5 to 17 Years | 0 (0.0%) | 0 (0.0%) |
| 18 to 34 Years | 10 (3.4%) | 0 (0.0%) |
| 35 to 64 Years | 41 (5.4%) | 10 (1.0%) |
| 65 to 74 Years | 92 (16.9%) | 8 (1.1%) |
| 75 Years and over | 114 (34.0%) | 34 (10.0%) |
Disability Class: Vision Difficulty
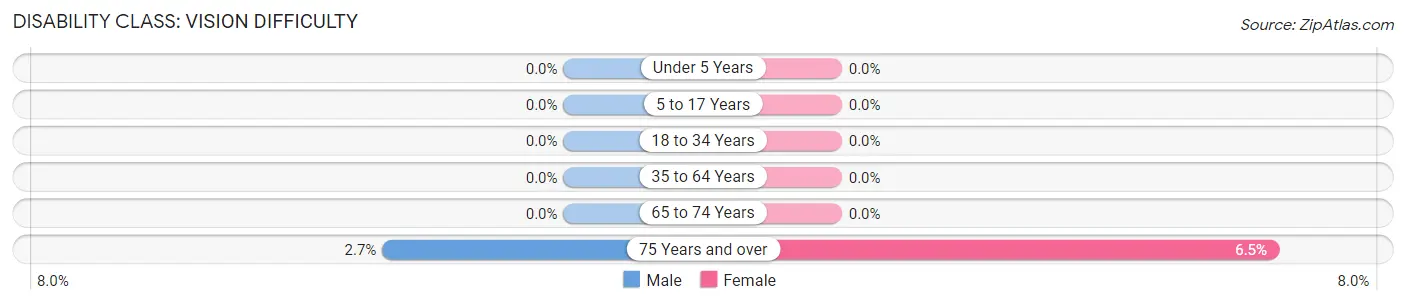
| Age Bracket | Male | Female |
| Under 5 Years | 0 (0.0%) | 0 (0.0%) |
| 5 to 17 Years | 0 (0.0%) | 0 (0.0%) |
| 18 to 34 Years | 0 (0.0%) | 0 (0.0%) |
| 35 to 64 Years | 0 (0.0%) | 0 (0.0%) |
| 65 to 74 Years | 0 (0.0%) | 0 (0.0%) |
| 75 Years and over | 9 (2.7%) | 22 (6.5%) |
Disability Class: Cognitive Difficulty
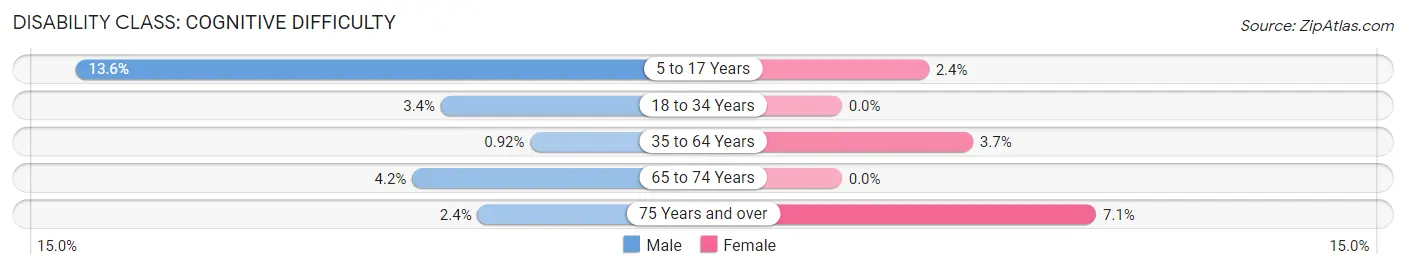
| Age Bracket | Male | Female |
| 5 to 17 Years | 22 (13.6%) | 6 (2.4%) |
| 18 to 34 Years | 10 (3.4%) | 0 (0.0%) |
| 35 to 64 Years | 7 (0.9%) | 37 (3.6%) |
| 65 to 74 Years | 23 (4.2%) | 0 (0.0%) |
| 75 Years and over | 8 (2.4%) | 24 (7.1%) |
Disability Class: Ambulatory Difficulty
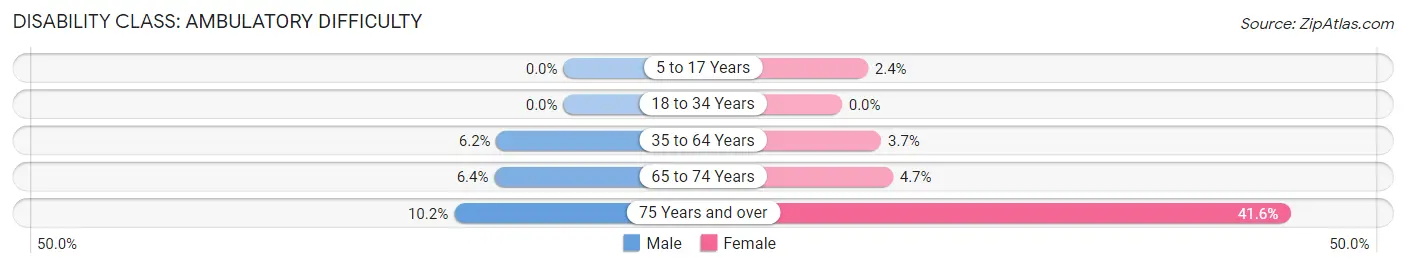
| Age Bracket | Male | Female |
| 5 to 17 Years | 0 (0.0%) | 6 (2.4%) |
| 18 to 34 Years | 0 (0.0%) | 0 (0.0%) |
| 35 to 64 Years | 47 (6.2%) | 37 (3.6%) |
| 65 to 74 Years | 35 (6.4%) | 33 (4.7%) |
| 75 Years and over | 34 (10.2%) | 141 (41.6%) |
Disability Class: Self-Care Difficulty
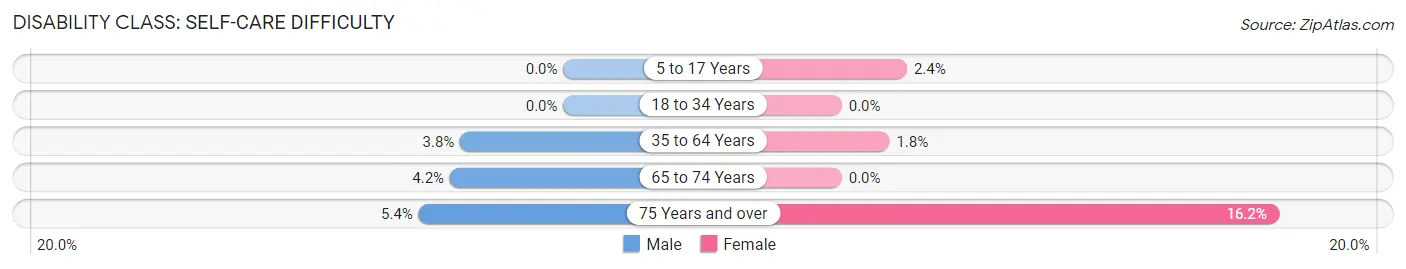
| Age Bracket | Male | Female |
| 5 to 17 Years | 0 (0.0%) | 6 (2.4%) |
| 18 to 34 Years | 0 (0.0%) | 0 (0.0%) |
| 35 to 64 Years | 29 (3.8%) | 18 (1.8%) |
| 65 to 74 Years | 23 (4.2%) | 0 (0.0%) |
| 75 Years and over | 18 (5.4%) | 55 (16.2%) |
Technology Access in Rockport
Computing Device Access in Rockport
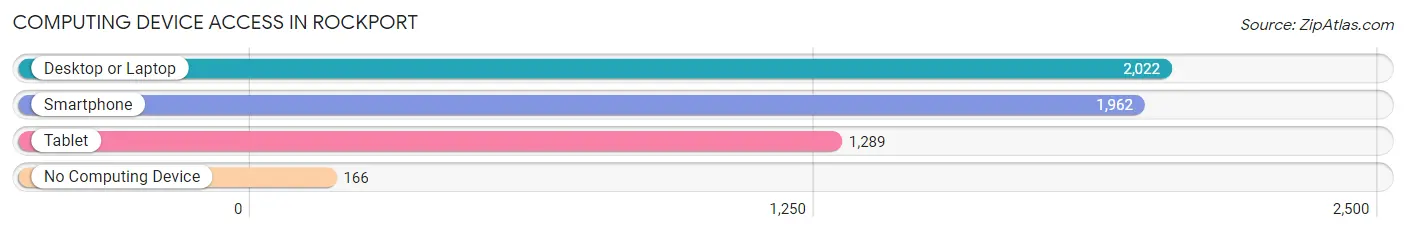
| Device Type | # Households | % Households |
| Desktop or Laptop | 2,022 | 85.2% |
| Smartphone | 1,962 | 82.7% |
| Tablet | 1,289 | 54.3% |
| No Computing Device | 166 | 7.0% |
| Total | 2,372 | 100.0% |
Internet Access in Rockport
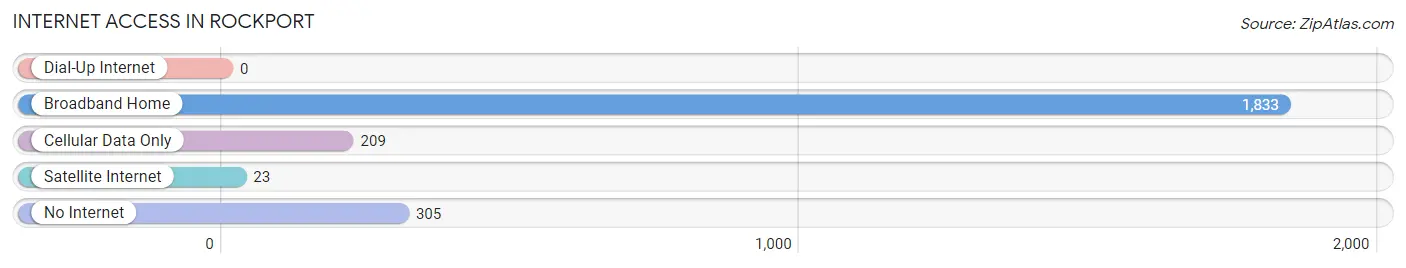
| Internet Type | # Households | % Households |
| Dial-Up Internet | 0 | 0.0% |
| Broadband Home | 1,833 | 77.3% |
| Cellular Data Only | 209 | 8.8% |
| Satellite Internet | 23 | 1.0% |
| No Internet | 305 | 12.9% |
| Total | 2,372 | 100.0% |
Rockport Summary
Rockport, Massachusetts is a small coastal town located in Essex County, approximately 30 miles northeast of Boston. It is a popular tourist destination due to its picturesque harbor, sandy beaches, and quaint downtown area. The town has a population of approximately 6,000 people and covers an area of 8.3 square miles.
History
Rockport was first settled in 1690 by a group of fishermen from Gloucester. The town was officially incorporated in 1840 and was named after the rocky shoreline that surrounds the town. In the 19th century, Rockport was a major fishing port and was home to a thriving shipbuilding industry. The town was also known for its granite quarries, which provided the stone for many of the buildings in Boston.
In the early 20th century, Rockport began to attract tourists due to its natural beauty and proximity to Boston. The town was also home to a thriving art colony, which attracted many prominent artists, including Winslow Homer and Edward Hopper.
Geography
Rockport is located on the Atlantic Ocean, approximately 30 miles northeast of Boston. The town is bordered by Gloucester to the north, Essex to the east, and Ipswich to the south. The town is situated on a peninsula, with the Annisquam River to the west and the Ipswich River to the east. The town is home to several small islands, including Straitsmouth Island, Thacher Island, and Halibut Point.
The town is mostly flat, with the highest point being the summit of Halibut Point, which is approximately 100 feet above sea level. The town is home to several small coves and beaches, including Long Beach, Front Beach, and Back Beach.
Economy
Rockport’s economy is largely based on tourism and fishing. The town is home to several popular tourist attractions, including the Rockport Art Association, the Shalin Liu Performance Center, and the Rockport Music Festival. The town is also home to several seafood restaurants, which serve fresh seafood caught in the local waters.
The town is also home to several small businesses, including art galleries, gift shops, and clothing stores. The town is also home to several boatyards, which provide boat repair and maintenance services.
Demographics
As of the 2010 census, Rockport had a population of 6,952 people. The racial makeup of the town was 94.3% White, 1.3% African American, 0.3% Native American, 1.2% Asian, 0.1% Pacific Islander, 1.2% from other races, and 1.6% from two or more races. Hispanic or Latino of any race were 3.2% of the population.
The median household income in Rockport was $62,813, and the median family income was $76,944. The per capita income for the town was $37,945. About 5.2% of families and 7.2% of the population were below the poverty line, including 8.3% of those under age 18 and 5.2% of those age 65 or over.
Common Questions
What is Per Capita Income in Rockport?
Per Capita income in Rockport is $60,379.
What is the Median Family Income in Rockport?
Median Family Income in Rockport is $131,932.
What is the Median Household income in Rockport?
Median Household Income in Rockport is $89,574.
What is Income or Wage Gap in Rockport?
Income or Wage Gap in Rockport is 39.8%.
Women in Rockport earn 60.2 cents for every dollar earned by a man.
What is Family Income Deficit in Rockport?
Family Income Deficit in Rockport is $5,198.
Families that are below poverty line in Rockport earn $5,198 less on average than the poverty threshold level.
What is Inequality or Gini Index in Rockport?
Inequality or Gini Index in Rockport is 0.48.
What is the Total Population of Rockport?
Total Population of Rockport is 4,943.
What is the Total Male Population of Rockport?
Total Male Population of Rockport is 2,261.
What is the Total Female Population of Rockport?
Total Female Population of Rockport is 2,682.
What is the Ratio of Males per 100 Females in Rockport?
There are 84.30 Males per 100 Females in Rockport.
What is the Ratio of Females per 100 Males in Rockport?
There are 118.62 Females per 100 Males in Rockport.
What is the Median Population Age in Rockport?
Median Population Age in Rockport is 59.9 Years.
What is the Average Family Size in Rockport
Average Family Size in Rockport is 2.6 People.
What is the Average Household Size in Rockport
Average Household Size in Rockport is 2.1 People.
How Large is the Labor Force in Rockport?
There are 2,557 People in the Labor Forcein in Rockport.
What is the Percentage of People in the Labor Force in Rockport?
56.9% of People are in the Labor Force in Rockport.
What is the Unemployment Rate in Rockport?
Unemployment Rate in Rockport is 7.6%.