Dennis, MA Map & Demographics
Dennis Map
Dennis Overview
$74,784
PER CAPITA INCOME
$129,531
AVG FAMILY INCOME
$113,526
AVG HOUSEHOLD INCOME
47.8%
WAGE / INCOME GAP [ % ]
52.2¢/ $1
WAGE / INCOME GAP [ $ ]
0.42
INEQUALITY / GINI INDEX
1,898
TOTAL POPULATION
940
MALE POPULATION
958
FEMALE POPULATION
98.12
MALES / 100 FEMALES
101.91
FEMALES / 100 MALES
64.1
MEDIAN AGE
2.3
AVG FAMILY SIZE
1.9
AVG HOUSEHOLD SIZE
834
LABOR FORCE [ PEOPLE ]
47.7%
PERCENT IN LABOR FORCE
5.5%
UNEMPLOYMENT RATE
Dennis Zip Codes
Income in Dennis
Income Overview in Dennis
Per Capita Income in Dennis is $74,784, while median incomes of families and households are $129,531 and $113,526 respectively.
| Characteristic | Number | Measure |
| Per Capita Income | 1,898 | $74,784 |
| Median Family Income | 619 | $129,531 |
| Mean Family Income | 619 | $169,953 |
| Median Household Income | 986 | $113,526 |
| Mean Household Income | 986 | $143,700 |
| Income Deficit | 619 | $0 |
| Wage / Income Gap (%) | 1,898 | 47.83% |
| Wage / Income Gap ($) | 1,898 | 52.17¢ per $1 |
| Gini / Inequality Index | 1,898 | 0.42 |
Earnings by Sex in Dennis
Average Earnings in Dennis are $55,787, $68,750 for men and $35,865 for women, a difference of 47.8%.
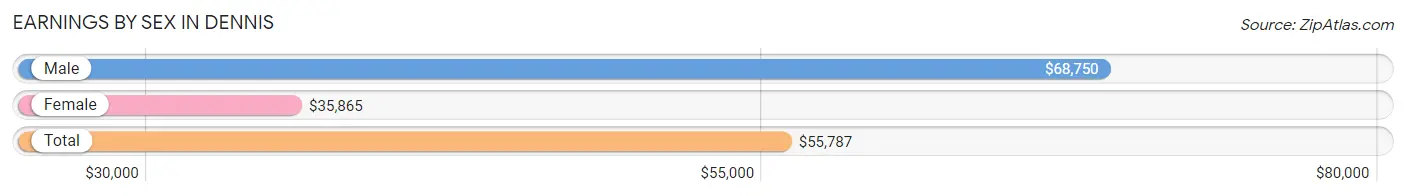
| Sex | Number | Average Earnings |
| Male | 473 (53.4%) | $68,750 |
| Female | 412 (46.6%) | $35,865 |
| Total | 885 (100.0%) | $55,787 |
Earnings by Sex by Income Bracket in Dennis
The most common earnings brackets in Dennis are $100,000+ for men (190 | 40.2%) and $30,000 to $34,999 for women (73 | 17.7%).
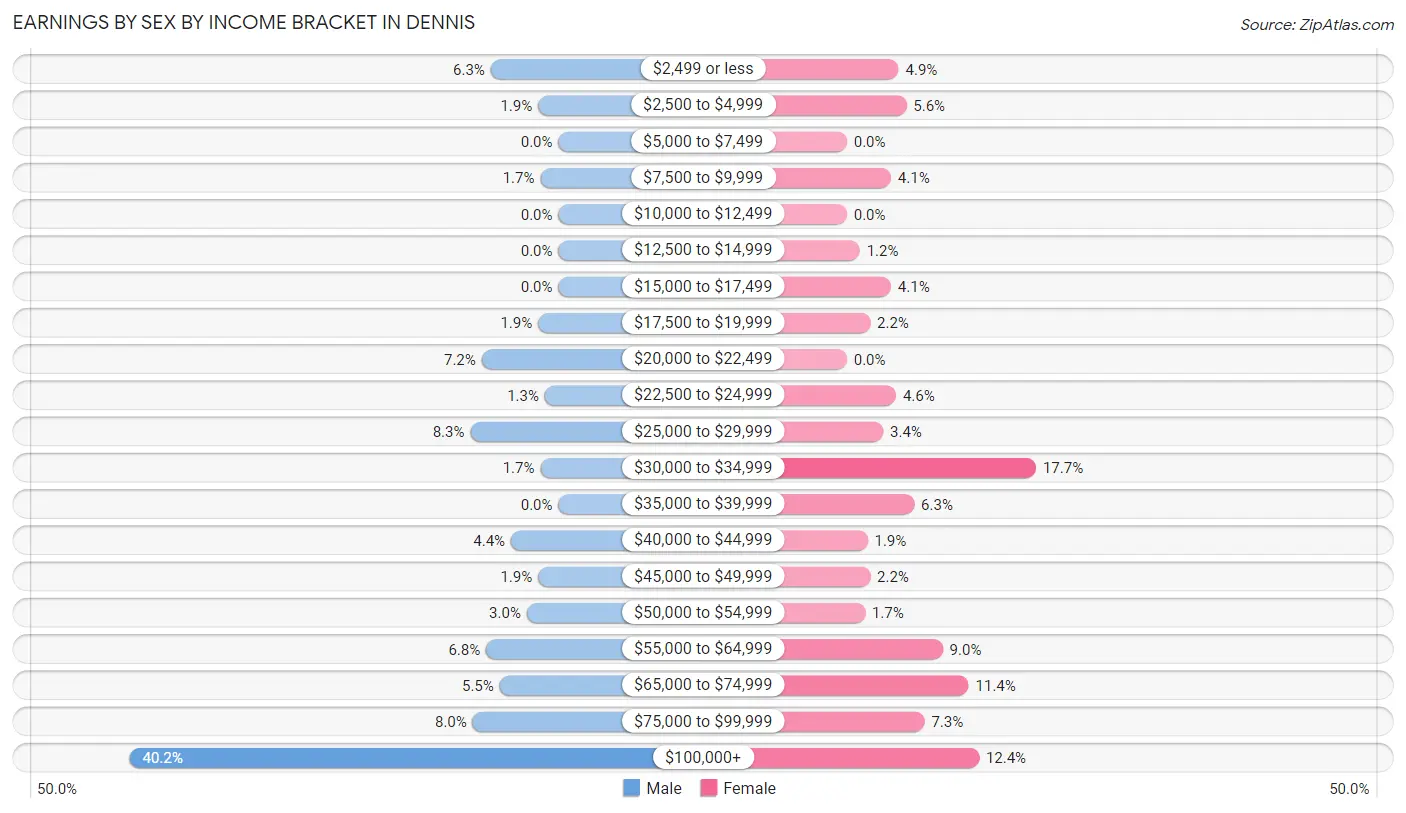
| Income | Male | Female |
| $2,499 or less | 30 (6.3%) | 20 (4.9%) |
| $2,500 to $4,999 | 9 (1.9%) | 23 (5.6%) |
| $5,000 to $7,499 | 0 (0.0%) | 0 (0.0%) |
| $7,500 to $9,999 | 8 (1.7%) | 17 (4.1%) |
| $10,000 to $12,499 | 0 (0.0%) | 0 (0.0%) |
| $12,500 to $14,999 | 0 (0.0%) | 5 (1.2%) |
| $15,000 to $17,499 | 0 (0.0%) | 17 (4.1%) |
| $17,500 to $19,999 | 9 (1.9%) | 9 (2.2%) |
| $20,000 to $22,499 | 34 (7.2%) | 0 (0.0%) |
| $22,500 to $24,999 | 6 (1.3%) | 19 (4.6%) |
| $25,000 to $29,999 | 39 (8.3%) | 14 (3.4%) |
| $30,000 to $34,999 | 8 (1.7%) | 73 (17.7%) |
| $35,000 to $39,999 | 0 (0.0%) | 26 (6.3%) |
| $40,000 to $44,999 | 21 (4.4%) | 8 (1.9%) |
| $45,000 to $49,999 | 9 (1.9%) | 9 (2.2%) |
| $50,000 to $54,999 | 14 (3.0%) | 7 (1.7%) |
| $55,000 to $64,999 | 32 (6.8%) | 37 (9.0%) |
| $65,000 to $74,999 | 26 (5.5%) | 47 (11.4%) |
| $75,000 to $99,999 | 38 (8.0%) | 30 (7.3%) |
| $100,000+ | 190 (40.2%) | 51 (12.4%) |
| Total | 473 (100.0%) | 412 (100.0%) |
Earnings by Sex by Educational Attainment in Dennis
Average earnings in Dennis are $68,750 for men and $49,583 for women, a difference of 27.9%. Men with an educational attainment of bachelor's degree enjoy the highest average annual earnings of $137,950, while those with high school diploma education earn the least with $51,518. Women with an educational attainment of high school diploma earn the most with the average annual earnings of $67,083, while those with college or associate's degree education have the smallest earnings of $40,156.
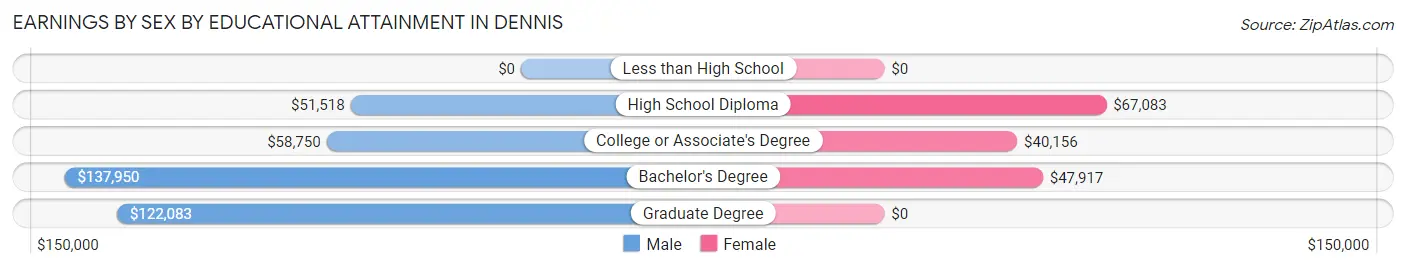
| Educational Attainment | Male Income | Female Income |
| Less than High School | - | - |
| High School Diploma | $51,518 | $67,083 |
| College or Associate's Degree | $58,750 | $40,156 |
| Bachelor's Degree | $137,950 | $47,917 |
| Graduate Degree | $122,083 | $0 |
| Total | $68,750 | $49,583 |
Family Income in Dennis
Family Income Brackets in Dennis
According to the Dennis family income data, there are 147 families falling into the $200,000+ income range, which is the most common income bracket and makes up 23.7% of all families.
| Income Bracket | # Families | % Families |
| Less than $10,000 | 20 | 3.2% |
| $10,000 to $14,999 | 0 | 0.0% |
| $15,000 to $24,999 | 19 | 3.1% |
| $25,000 to $34,999 | 38 | 6.1% |
| $35,000 to $49,999 | 12 | 1.9% |
| $50,000 to $74,999 | 54 | 8.7% |
| $75,000 to $99,999 | 75 | 12.1% |
| $100,000 to $149,999 | 126 | 20.4% |
| $150,000 to $199,999 | 128 | 20.7% |
| $200,000+ | 147 | 23.7% |
Family Income by Famaliy Size in Dennis
4-person families (25 | 4.0%) account for the highest median family income in Dennis with $227,596 per family, while 2-person families (511 | 82.6%) have the highest median income of $67,986 per family member.
| Income Bracket | # Families | Median Income |
| 2-Person Families | 511 (82.6%) | $135,972 |
| 3-Person Families | 63 (10.2%) | $88,906 |
| 4-Person Families | 25 (4.0%) | $227,596 |
| 5-Person Families | 14 (2.3%) | $0 |
| 6-Person Families | 6 (1.0%) | $0 |
| 7+ Person Families | 0 (0.0%) | $0 |
| Total | 619 (100.0%) | $129,531 |
Family Income by Number of Earners in Dennis
| Number of Earners | # Families | Median Income |
| No Earners | 175 (28.3%) | $145,875 |
| 1 Earner | 245 (39.6%) | $96,750 |
| 2 Earners | 181 (29.2%) | $145,417 |
| 3+ Earners | 18 (2.9%) | $0 |
| Total | 619 (100.0%) | $129,531 |
Household Income in Dennis
Household Income Brackets in Dennis
With 264 households falling in the category, the $100,000 to $149,999 income range is the most frequent in Dennis, accounting for 26.8% of all households. In contrast, only 16 households (1.6%) fall into the $10,000 to $14,999 income bracket, making it the least populous group.
| Income Bracket | # Households | % Households |
| Less than $10,000 | 20 | 2.0% |
| $10,000 to $14,999 | 16 | 1.6% |
| $15,000 to $24,999 | 71 | 7.2% |
| $25,000 to $34,999 | 22 | 2.2% |
| $35,000 to $49,999 | 30 | 3.0% |
| $50,000 to $74,999 | 135 | 13.7% |
| $75,000 to $99,999 | 84 | 8.5% |
| $100,000 to $149,999 | 264 | 26.8% |
| $150,000 to $199,999 | 181 | 18.4% |
| $200,000+ | 163 | 16.5% |
Household Income by Householder Age in Dennis
The median household income in Dennis is $113,526, with the highest median household income of $163,162 found in the 45 to 64 years age bracket for the primary householder. A total of 305 households (30.9%) fall into this category. Meanwhile, the 15 to 24 years age bracket for the primary householder has the lowest median household income of $0, with 46 households (4.7%) in this group.
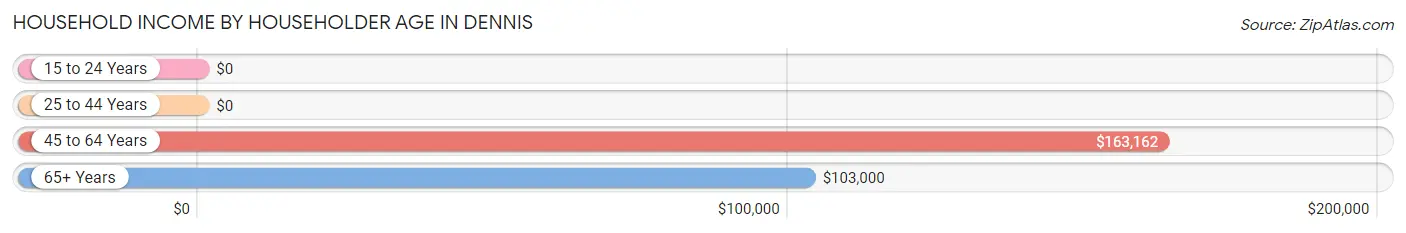
| Income Bracket | # Households | Median Income |
| 15 to 24 Years | 46 (4.7%) | $0 |
| 25 to 44 Years | 61 (6.2%) | $0 |
| 45 to 64 Years | 305 (30.9%) | $163,162 |
| 65+ Years | 574 (58.2%) | $103,000 |
| Total | 986 (100.0%) | $113,526 |
Poverty in Dennis
Income Below Poverty by Sex and Age in Dennis
With 4.2% poverty level for males and 4.7% for females among the residents of Dennis, under 5 year old males and 35 to 44 year old females are the most vulnerable to poverty, with 20 males (100.0%) and 20 females (32.8%) in their respective age groups living below the poverty level.
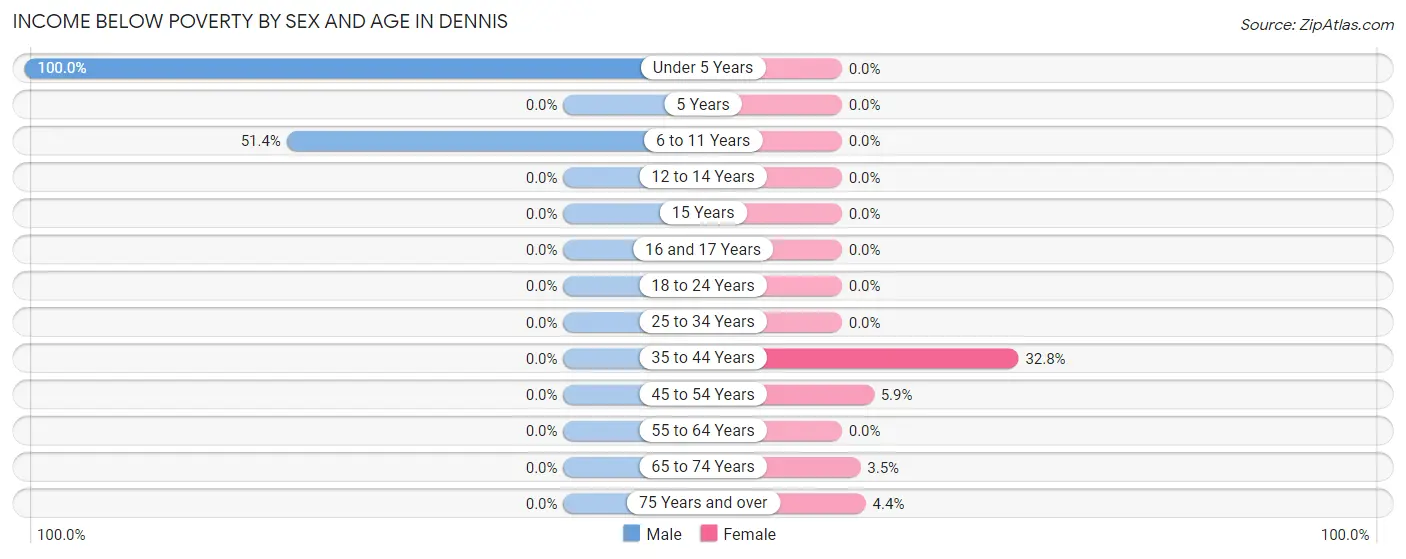
| Age Bracket | Male | Female |
| Under 5 Years | 20 (100.0%) | 0 (0.0%) |
| 5 Years | 0 (0.0%) | 0 (0.0%) |
| 6 to 11 Years | 19 (51.3%) | 0 (0.0%) |
| 12 to 14 Years | 0 (0.0%) | 0 (0.0%) |
| 15 Years | 0 (0.0%) | 0 (0.0%) |
| 16 and 17 Years | 0 (0.0%) | 0 (0.0%) |
| 18 to 24 Years | 0 (0.0%) | 0 (0.0%) |
| 25 to 34 Years | 0 (0.0%) | 0 (0.0%) |
| 35 to 44 Years | 0 (0.0%) | 20 (32.8%) |
| 45 to 54 Years | 0 (0.0%) | 7 (5.9%) |
| 55 to 64 Years | 0 (0.0%) | 0 (0.0%) |
| 65 to 74 Years | 0 (0.0%) | 9 (3.5%) |
| 75 Years and over | 0 (0.0%) | 9 (4.4%) |
| Total | 39 (4.2%) | 45 (4.7%) |
Income Above Poverty by Sex and Age in Dennis
According to the poverty statistics in Dennis, males aged 12 to 14 years and females aged under 5 years are the age groups that are most secure financially, with 100.0% of males and 100.0% of females in these age groups living above the poverty line.
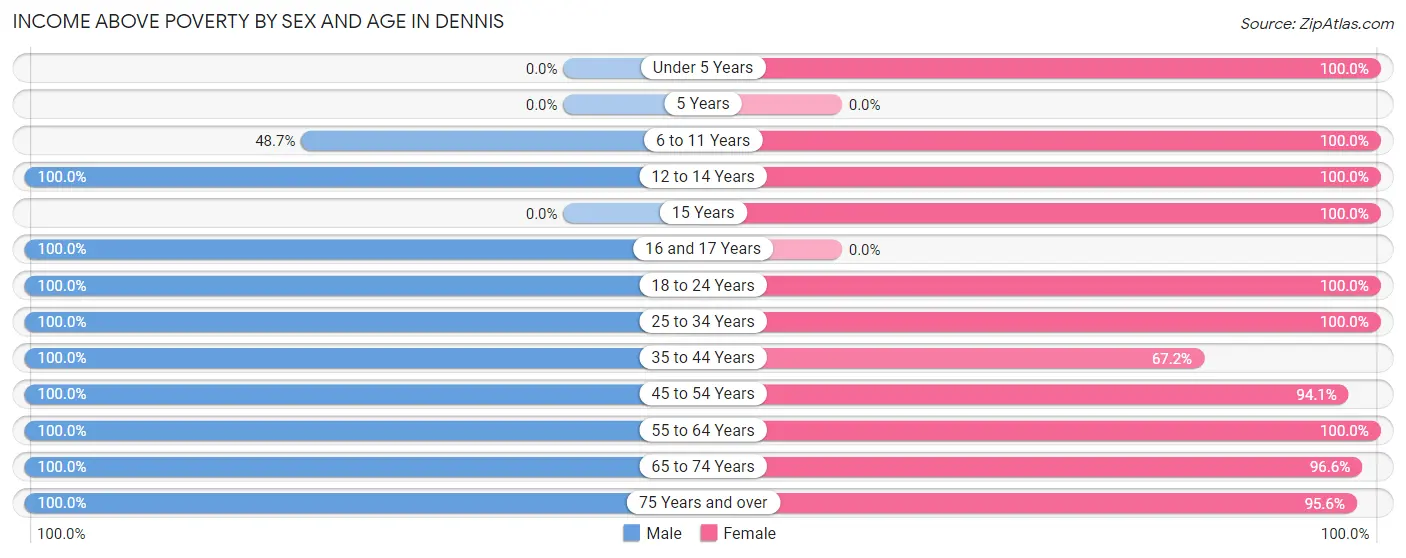
| Age Bracket | Male | Female |
| Under 5 Years | 0 (0.0%) | 4 (100.0%) |
| 5 Years | 0 (0.0%) | 0 (0.0%) |
| 6 to 11 Years | 18 (48.6%) | 30 (100.0%) |
| 12 to 14 Years | 33 (100.0%) | 13 (100.0%) |
| 15 Years | 0 (0.0%) | 13 (100.0%) |
| 16 and 17 Years | 13 (100.0%) | 0 (0.0%) |
| 18 to 24 Years | 37 (100.0%) | 101 (100.0%) |
| 25 to 34 Years | 52 (100.0%) | 5 (100.0%) |
| 35 to 44 Years | 42 (100.0%) | 41 (67.2%) |
| 45 to 54 Years | 82 (100.0%) | 111 (94.1%) |
| 55 to 64 Years | 179 (100.0%) | 149 (100.0%) |
| 65 to 74 Years | 268 (100.0%) | 252 (96.6%) |
| 75 Years and over | 177 (100.0%) | 194 (95.6%) |
| Total | 901 (95.9%) | 913 (95.3%) |
Income Below Poverty Among Married-Couple Families in Dennis
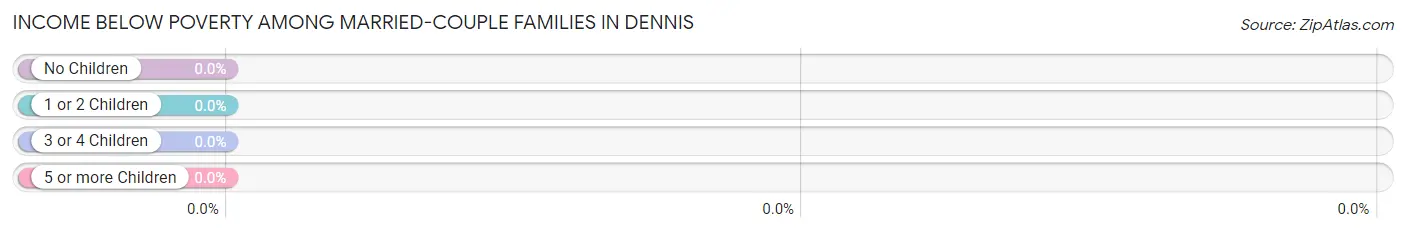
| Children | Above Poverty | Below Poverty |
| No Children | 470 (100.0%) | 0 (0.0%) |
| 1 or 2 Children | 26 (100.0%) | 0 (0.0%) |
| 3 or 4 Children | 20 (100.0%) | 0 (0.0%) |
| 5 or more Children | 0 (0.0%) | 0 (0.0%) |
| Total | 516 (100.0%) | 0 (0.0%) |
Income Below Poverty Among Single-Parent Households in Dennis
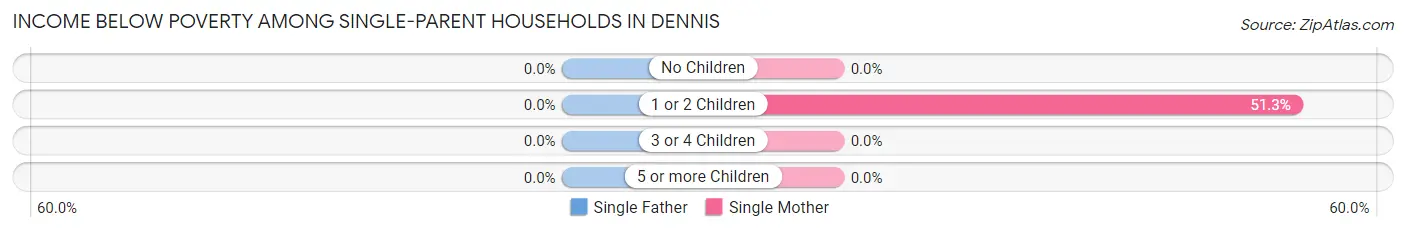
| Children | Single Father | Single Mother |
| No Children | 0 (0.0%) | 0 (0.0%) |
| 1 or 2 Children | 0 (0.0%) | 20 (51.3%) |
| 3 or 4 Children | 0 (0.0%) | 0 (0.0%) |
| 5 or more Children | 0 (0.0%) | 0 (0.0%) |
| Total | 0 (0.0%) | 20 (19.4%) |
Income Below Poverty Among Married-Couple vs Single-Parent Households in Dennis
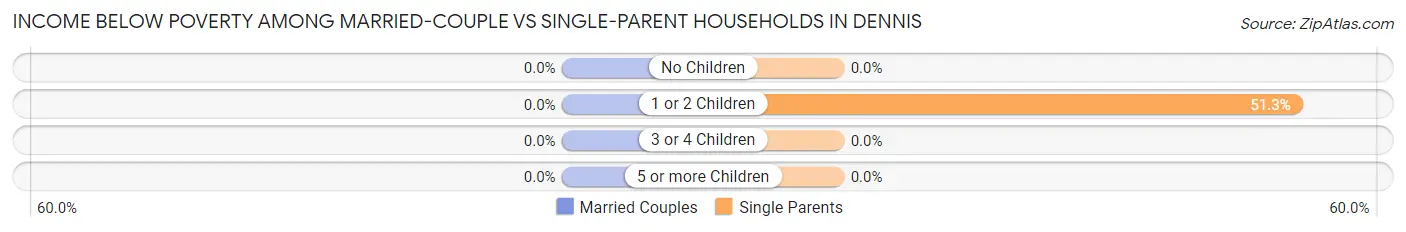
| Children | Married-Couple Families | Single-Parent Households |
| No Children | 0 (0.0%) | 0 (0.0%) |
| 1 or 2 Children | 0 (0.0%) | 20 (51.3%) |
| 3 or 4 Children | 0 (0.0%) | 0 (0.0%) |
| 5 or more Children | 0 (0.0%) | 0 (0.0%) |
| Total | 0 (0.0%) | 20 (19.4%) |
Race in Dennis
The most populous races in Dennis are White / Caucasian (1,808 | 95.3%), Two or more Races (69 | 3.6%), and Some other Race (21 | 1.1%).
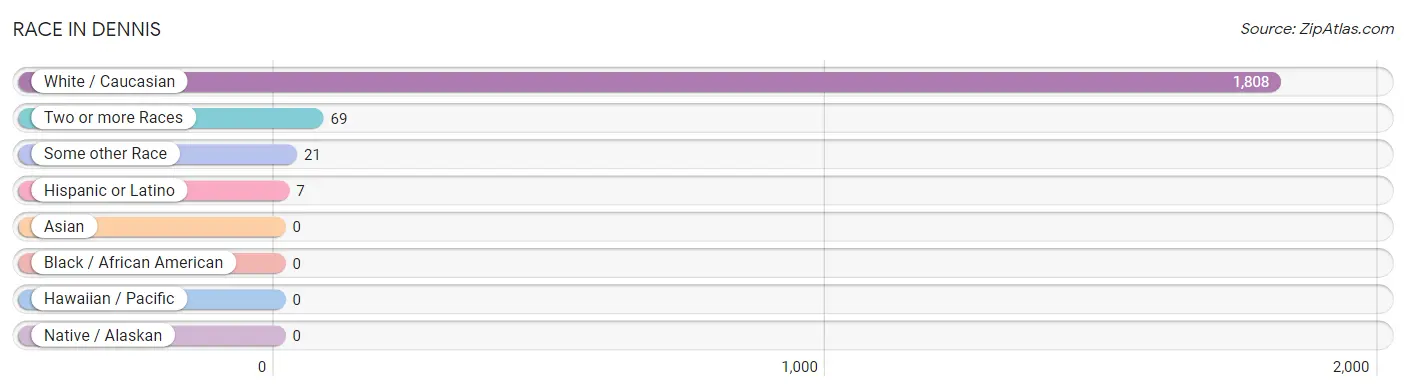
| Race | # Population | % Population |
| Asian | 0 | 0.0% |
| Black / African American | 0 | 0.0% |
| Hawaiian / Pacific | 0 | 0.0% |
| Hispanic or Latino | 7 | 0.4% |
| Native / Alaskan | 0 | 0.0% |
| White / Caucasian | 1,808 | 95.3% |
| Two or more Races | 69 | 3.6% |
| Some other Race | 21 | 1.1% |
| Total | 1,898 | 100.0% |
Ancestry in Dennis
The most populous ancestries reported in Dennis are Irish (449 | 23.7%), English (338 | 17.8%), Italian (322 | 17.0%), American (203 | 10.7%), and German (182 | 9.6%), together accounting for 78.7% of all Dennis residents.
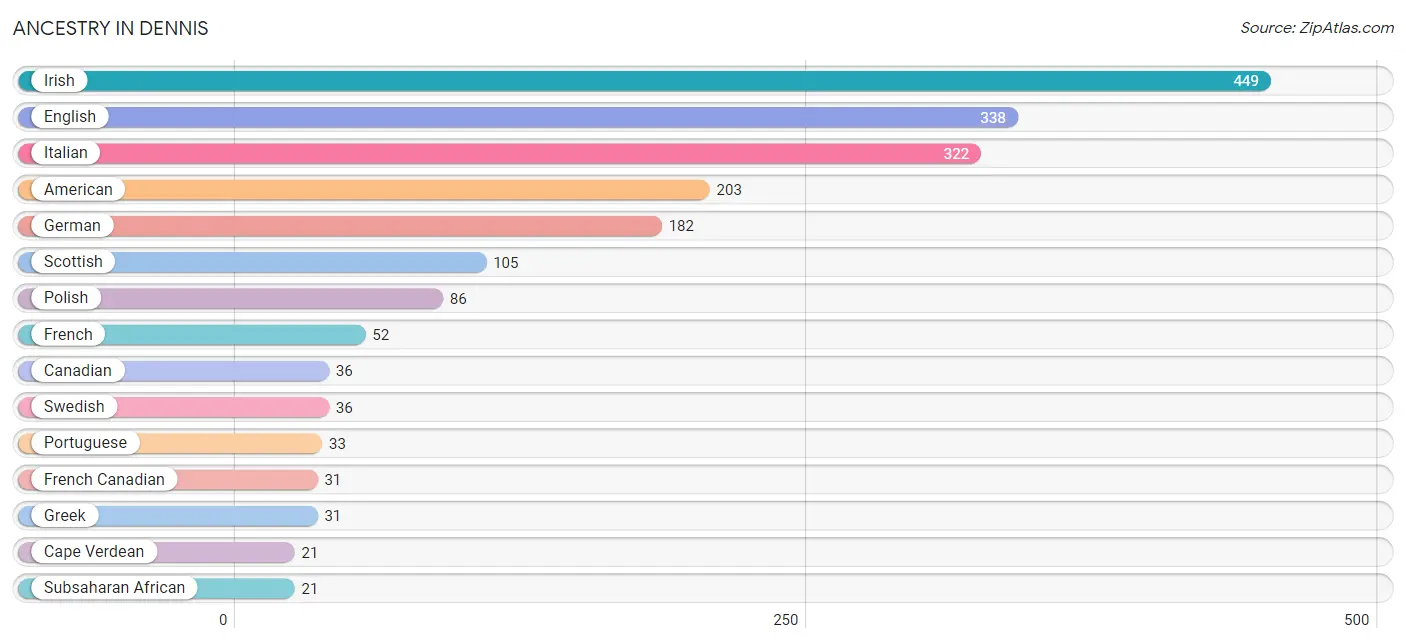
| Ancestry | # Population | % Population |
| Albanian | 11 | 0.6% |
| American | 203 | 10.7% |
| Canadian | 36 | 1.9% |
| Cape Verdean | 21 | 1.1% |
| Dutch | 9 | 0.5% |
| Eastern European | 4 | 0.2% |
| English | 338 | 17.8% |
| European | 9 | 0.5% |
| Finnish | 19 | 1.0% |
| French | 52 | 2.7% |
| French Canadian | 31 | 1.6% |
| German | 182 | 9.6% |
| Greek | 31 | 1.6% |
| Hungarian | 9 | 0.5% |
| Irish | 449 | 23.7% |
| Italian | 322 | 17.0% |
| Norwegian | 9 | 0.5% |
| Polish | 86 | 4.5% |
| Portuguese | 33 | 1.7% |
| Russian | 9 | 0.5% |
| Scotch-Irish | 3 | 0.2% |
| Scottish | 105 | 5.5% |
| Slovak | 8 | 0.4% |
| Subsaharan African | 21 | 1.1% |
| Swedish | 36 | 1.9% |
| Ukrainian | 6 | 0.3% | View All 26 Rows |
Immigrants in Dennis
The most numerous immigrant groups reported in Dennis came from Europe (49 | 2.6%), England (36 | 1.9%), Northern Europe (36 | 1.9%), Africa (25 | 1.3%), and South Africa (25 | 1.3%), together accounting for 9.0% of all Dennis residents.
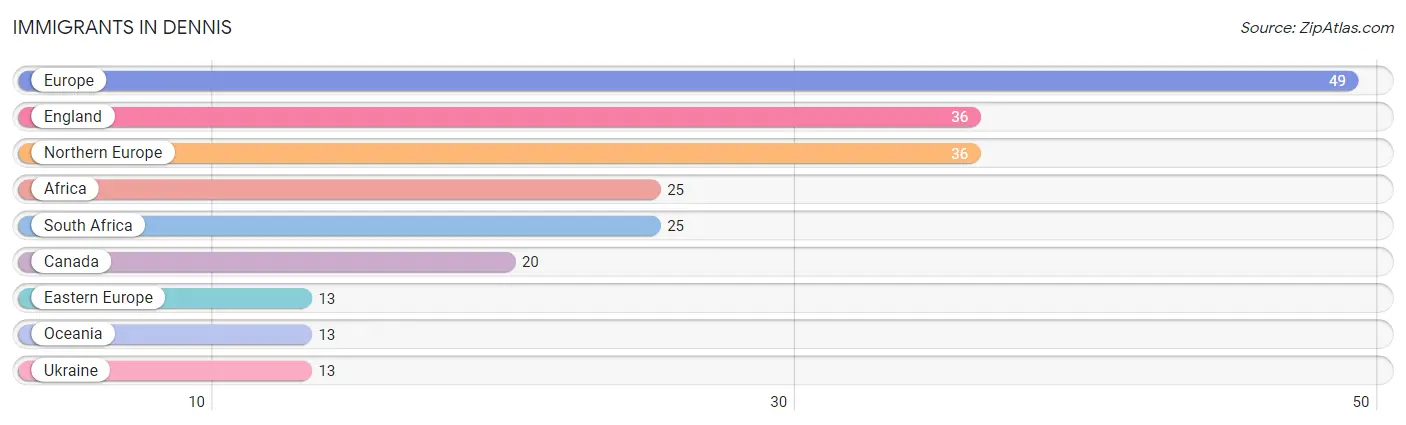
| Immigration Origin | # Population | % Population |
| Africa | 25 | 1.3% |
| Canada | 20 | 1.1% |
| Eastern Europe | 13 | 0.7% |
| England | 36 | 1.9% |
| Europe | 49 | 2.6% |
| Northern Europe | 36 | 1.9% |
| Oceania | 13 | 0.7% |
| South Africa | 25 | 1.3% |
| Ukraine | 13 | 0.7% | View All 9 Rows |
Sex and Age in Dennis
Sex and Age in Dennis
The most populous age groups in Dennis are 65 to 69 Years (162 | 17.2%) for men and 65 to 69 Years (158 | 16.5%) for women.
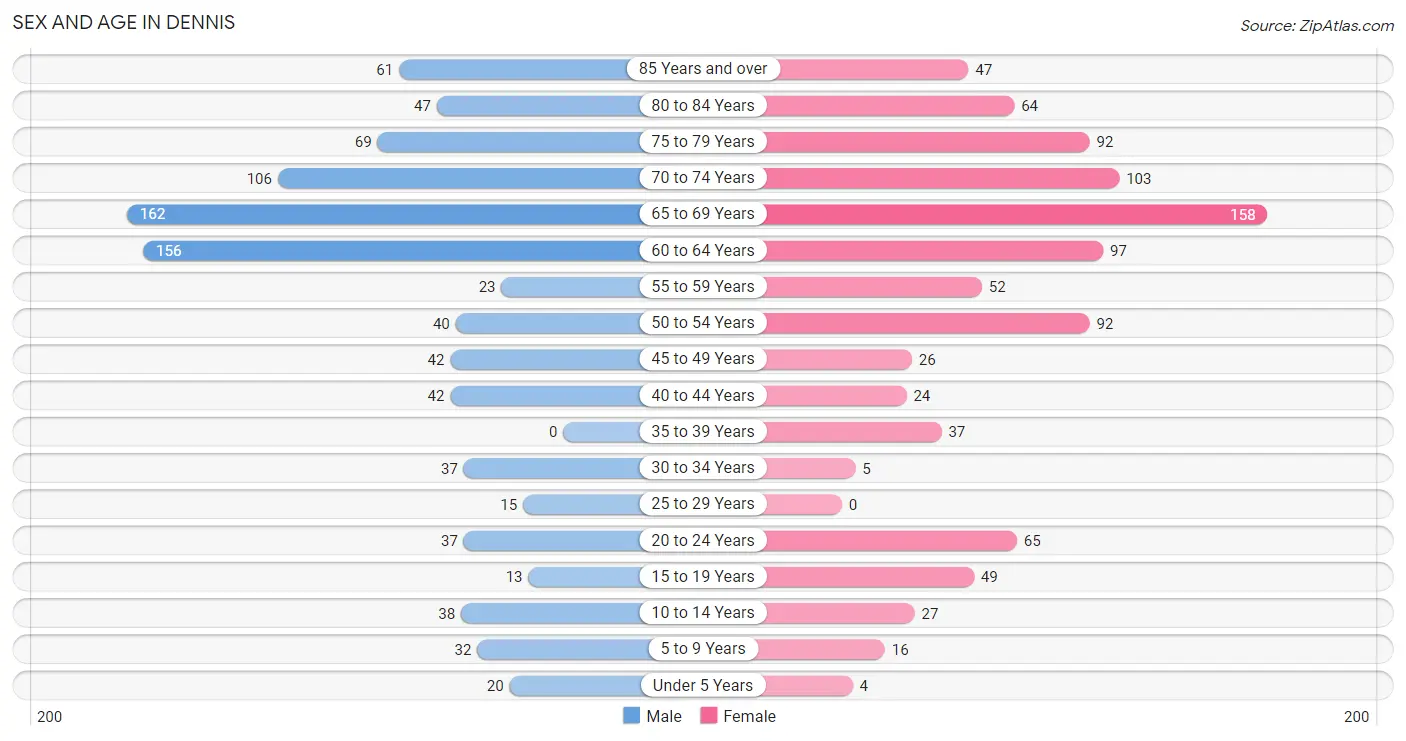
| Age Bracket | Male | Female |
| Under 5 Years | 20 (2.1%) | 4 (0.4%) |
| 5 to 9 Years | 32 (3.4%) | 16 (1.7%) |
| 10 to 14 Years | 38 (4.0%) | 27 (2.8%) |
| 15 to 19 Years | 13 (1.4%) | 49 (5.1%) |
| 20 to 24 Years | 37 (3.9%) | 65 (6.8%) |
| 25 to 29 Years | 15 (1.6%) | 0 (0.0%) |
| 30 to 34 Years | 37 (3.9%) | 5 (0.5%) |
| 35 to 39 Years | 0 (0.0%) | 37 (3.9%) |
| 40 to 44 Years | 42 (4.5%) | 24 (2.5%) |
| 45 to 49 Years | 42 (4.5%) | 26 (2.7%) |
| 50 to 54 Years | 40 (4.3%) | 92 (9.6%) |
| 55 to 59 Years | 23 (2.5%) | 52 (5.4%) |
| 60 to 64 Years | 156 (16.6%) | 97 (10.1%) |
| 65 to 69 Years | 162 (17.2%) | 158 (16.5%) |
| 70 to 74 Years | 106 (11.3%) | 103 (10.7%) |
| 75 to 79 Years | 69 (7.3%) | 92 (9.6%) |
| 80 to 84 Years | 47 (5.0%) | 64 (6.7%) |
| 85 Years and over | 61 (6.5%) | 47 (4.9%) |
| Total | 940 (100.0%) | 958 (100.0%) |
Families and Households in Dennis
Median Family Size in Dennis
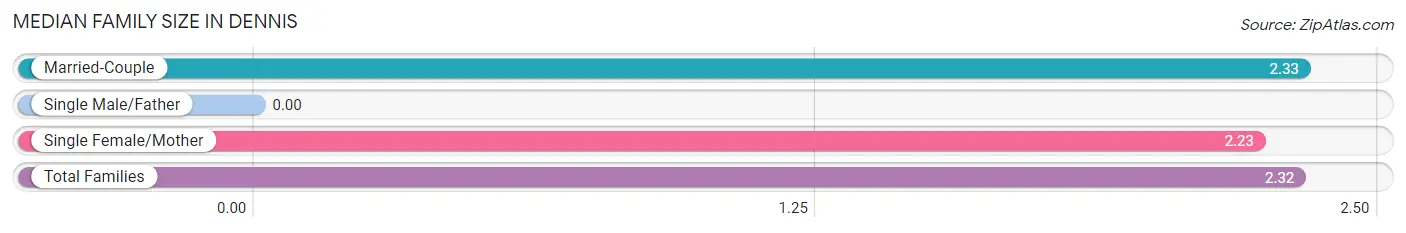
| Family Type | # Families | Family Size |
| Married-Couple | 516 (83.4%) | 2.33 |
| Single Male/Father | 0 (0.0%) | - |
| Single Female/Mother | 103 (16.6%) | 2.23 |
| Total Families | 619 (100.0%) | 2.32 |
Median Household Size in Dennis
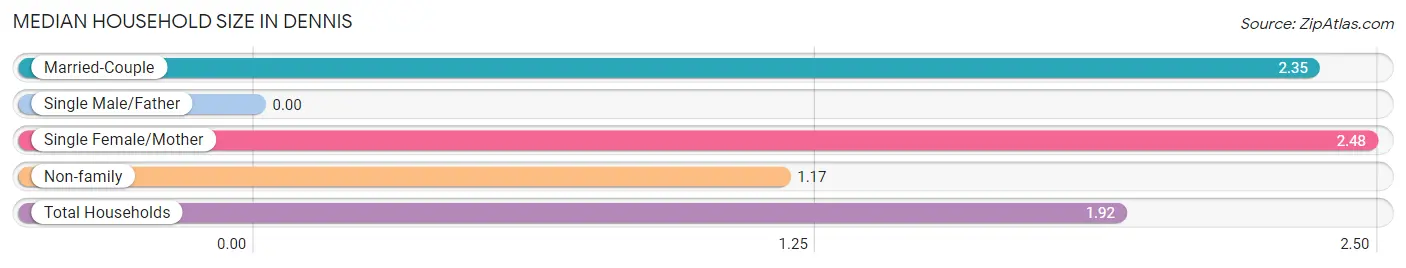
| Household Type | # Households | Household Size |
| Married-Couple | 516 (52.3%) | 2.35 |
| Single Male/Father | 0 (0.0%) | - |
| Single Female/Mother | 103 (10.4%) | 2.48 |
| Non-family | 367 (37.2%) | 1.17 |
| Total Households | 986 (100.0%) | 1.92 |
Household Size by Marriage Status in Dennis
Out of a total of 986 households in Dennis, 619 (62.8%) are family households, while 367 (37.2%) are nonfamily households. The most numerous type of family households are 2-person households, comprising 476, and the most common type of nonfamily households are 1-person households, comprising 304.
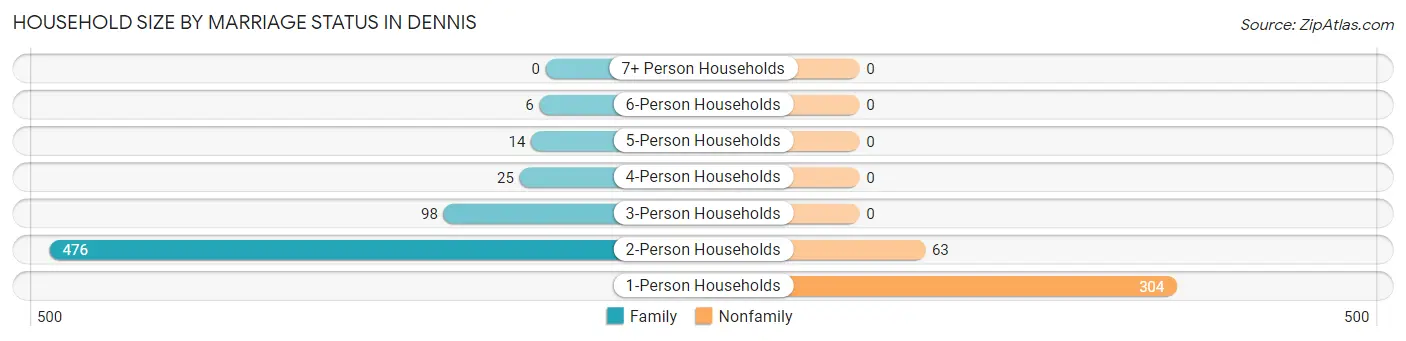
| Household Size | Family Households | Nonfamily Households |
| 1-Person Households | - | 304 (30.8%) |
| 2-Person Households | 476 (48.3%) | 63 (6.4%) |
| 3-Person Households | 98 (9.9%) | 0 (0.0%) |
| 4-Person Households | 25 (2.5%) | 0 (0.0%) |
| 5-Person Households | 14 (1.4%) | 0 (0.0%) |
| 6-Person Households | 6 (0.6%) | 0 (0.0%) |
| 7+ Person Households | 0 (0.0%) | 0 (0.0%) |
| Total | 619 (62.8%) | 367 (37.2%) |
Female Fertility in Dennis
Fertility by Age in Dennis
| Age Bracket | Women with Births | Births / 1,000 Women |
| 15 to 19 years | 0 (0.0%) | 0.0 |
| 20 to 34 years | 0 (0.0%) | 0.0 |
| 35 to 50 years | 0 (0.0%) | 0.0 |
| Total | 0 (0.0%) | 0.0 |
Fertility by Age by Marriage Status in Dennis
| Age Bracket | Married | Unmarried |
| 15 to 19 years | 0 (0.0%) | 0 (0.0%) |
| 20 to 34 years | 0 (0.0%) | 0 (0.0%) |
| 35 to 50 years | 0 (0.0%) | 0 (0.0%) |
| Total | 0 (0.0%) | 0 (0.0%) |
Fertility by Education in Dennis
| Educational Attainment | Women with Births | Births / 1,000 Women |
| Less than High School | 0 (0.0%) | 0.0 |
| High School Diploma | 0 (0.0%) | 0.0 |
| College or Associate's Degree | 0 (0.0%) | 0.0 |
| Bachelor's Degree | 0 (0.0%) | 0.0 |
| Graduate Degree | 0 (0.0%) | 0.0 |
| Total | 0 (0.0%) | 0.0 |
Fertility by Education by Marriage Status in Dennis
| Educational Attainment | Married | Unmarried |
| Less than High School | 0 (0.0%) | 0 (0.0%) |
| High School Diploma | 0 (0.0%) | 0 (0.0%) |
| College or Associate's Degree | 0 (0.0%) | 0 (0.0%) |
| Bachelor's Degree | 0 (0.0%) | 0 (0.0%) |
| Graduate Degree | 0 (0.0%) | 0 (0.0%) |
| Total | 0 (0.0%) | 0 (0.0%) |
Employment Characteristics in Dennis
Employment by Class of Employer in Dennis
Among the 782 employed individuals in Dennis, private company employees (400 | 51.1%), self-employed (not incorporated) (88 | 11.3%), and not-for-profit organizations (88 | 11.3%) make up the most common classes of employment.
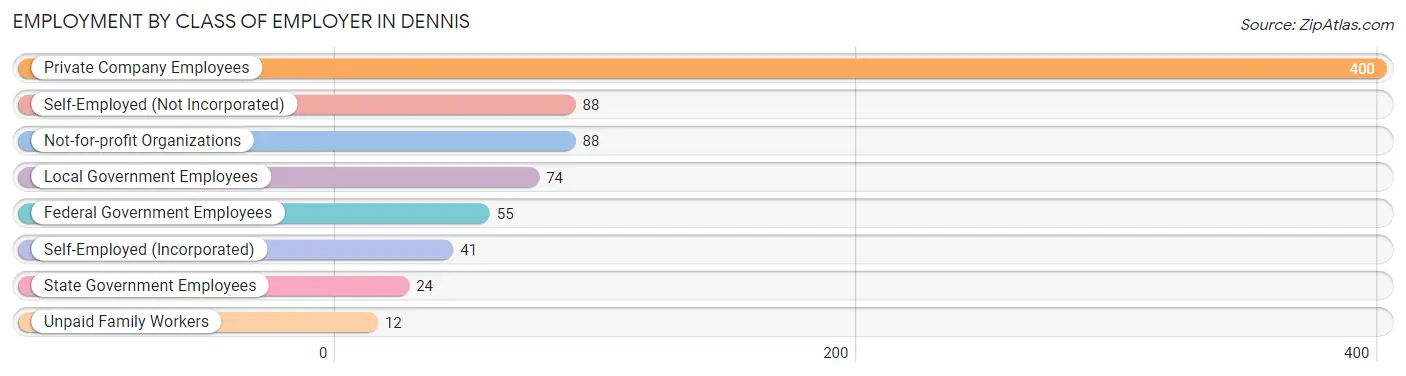
| Employer Class | # Employees | % Employees |
| Private Company Employees | 400 | 51.1% |
| Self-Employed (Incorporated) | 41 | 5.2% |
| Self-Employed (Not Incorporated) | 88 | 11.3% |
| Not-for-profit Organizations | 88 | 11.3% |
| Local Government Employees | 74 | 9.5% |
| State Government Employees | 24 | 3.1% |
| Federal Government Employees | 55 | 7.0% |
| Unpaid Family Workers | 12 | 1.5% |
| Total | 782 | 100.0% |
Employment Status by Age in Dennis
According to the labor force statistics for Dennis, out of the total population over 16 years of age (1,748), 47.7% or 834 individuals are in the labor force, with 5.5% or 46 of them unemployed. The age group with the highest labor force participation rate is 25 to 29 years, with 100.0% or 15 individuals in the labor force. Within the labor force, the 16 to 19 years age range has the highest percentage of unemployed individuals, with 100.0% or 13 of them being unemployed.
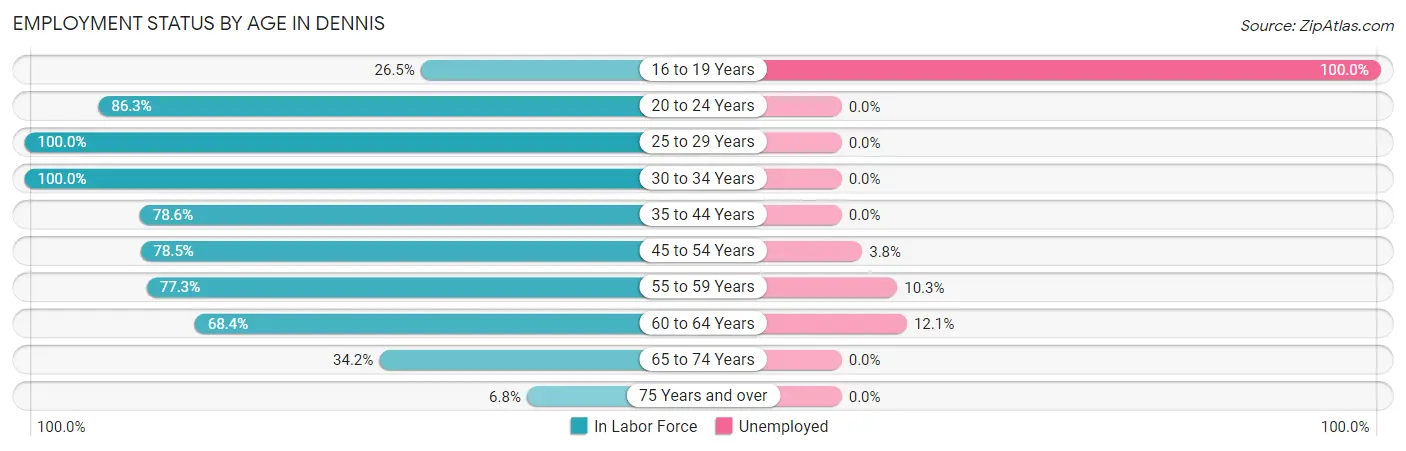
| Age Bracket | In Labor Force | Unemployed |
| 16 to 19 Years | 13 (26.5%) | 13 (100.0%) |
| 20 to 24 Years | 88 (86.3%) | 0 (0.0%) |
| 25 to 29 Years | 15 (100.0%) | 0 (0.0%) |
| 30 to 34 Years | 42 (100.0%) | 0 (0.0%) |
| 35 to 44 Years | 81 (78.6%) | 0 (0.0%) |
| 45 to 54 Years | 157 (78.5%) | 6 (3.8%) |
| 55 to 59 Years | 58 (77.3%) | 6 (10.3%) |
| 60 to 64 Years | 173 (68.4%) | 21 (12.1%) |
| 65 to 74 Years | 181 (34.2%) | 0 (0.0%) |
| 75 Years and over | 26 (6.8%) | 0 (0.0%) |
| Total | 834 (47.7%) | 46 (5.5%) |
Employment Status by Educational Attainment in Dennis
According to labor force statistics for Dennis, 76.5% of individuals (526) out of the total population between 25 and 64 years of age (688) are in the labor force, with 6.3% or 33 of them being unemployed. The group with the highest labor force participation rate are those with the educational attainment of less than high school, with 89.6% or 60 individuals in the labor force. Within the labor force, individuals with less than high school education have the highest percentage of unemployment, with 35.0% or 21 of them being unemployed.
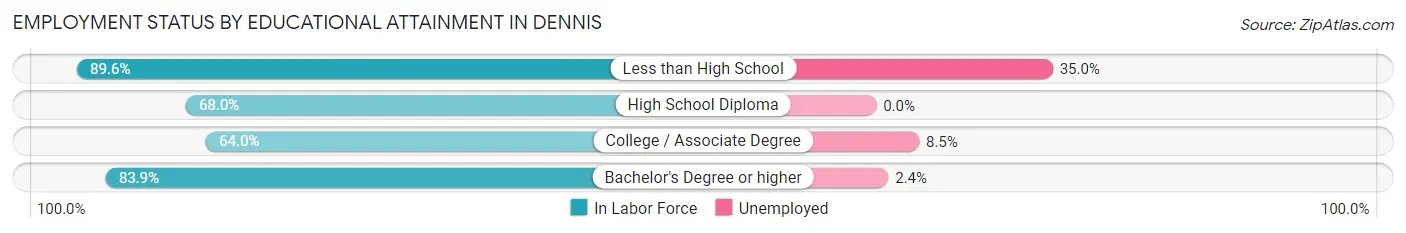
| Educational Attainment | In Labor Force | Unemployed |
| Less than High School | 60 (89.6%) | 23 (35.0%) |
| High School Diploma | 140 (68.0%) | 0 (0.0%) |
| College / Associate Degree | 71 (64.0%) | 9 (8.5%) |
| Bachelor's Degree or higher | 255 (83.9%) | 7 (2.4%) |
| Total | 526 (76.5%) | 43 (6.3%) |
Employment Occupations by Sex in Dennis
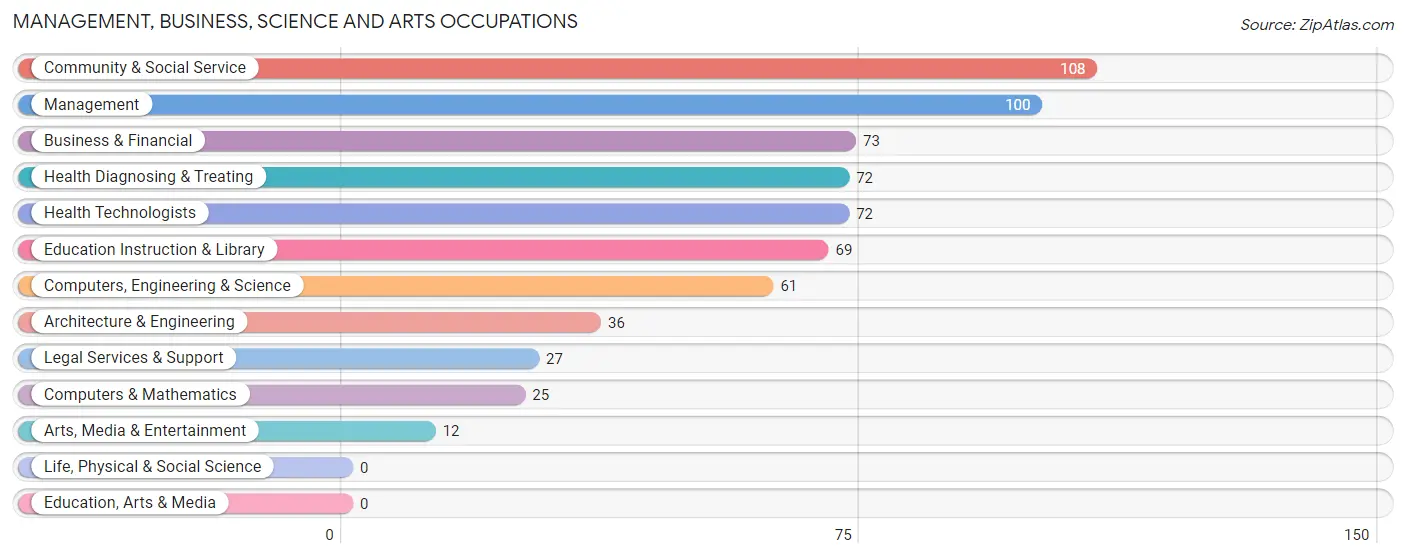
Management, Business, Science and Arts Occupations
The most common Management, Business, Science and Arts occupations in Dennis are Community & Social Service (108 | 13.7%), Management (100 | 12.7%), Business & Financial (73 | 9.3%), Health Diagnosing & Treating (72 | 9.1%), and Health Technologists (72 | 9.1%).
Management, Business, Science and Arts Occupations by Sex
Within the Management, Business, Science and Arts occupations in Dennis, the most male-oriented occupations are Computers, Engineering & Science (100.0%), Computers & Mathematics (100.0%), and Architecture & Engineering (100.0%), while the most female-oriented occupations are Education Instruction & Library (100.0%), Community & Social Service (83.3%), and Legal Services & Support (77.8%).
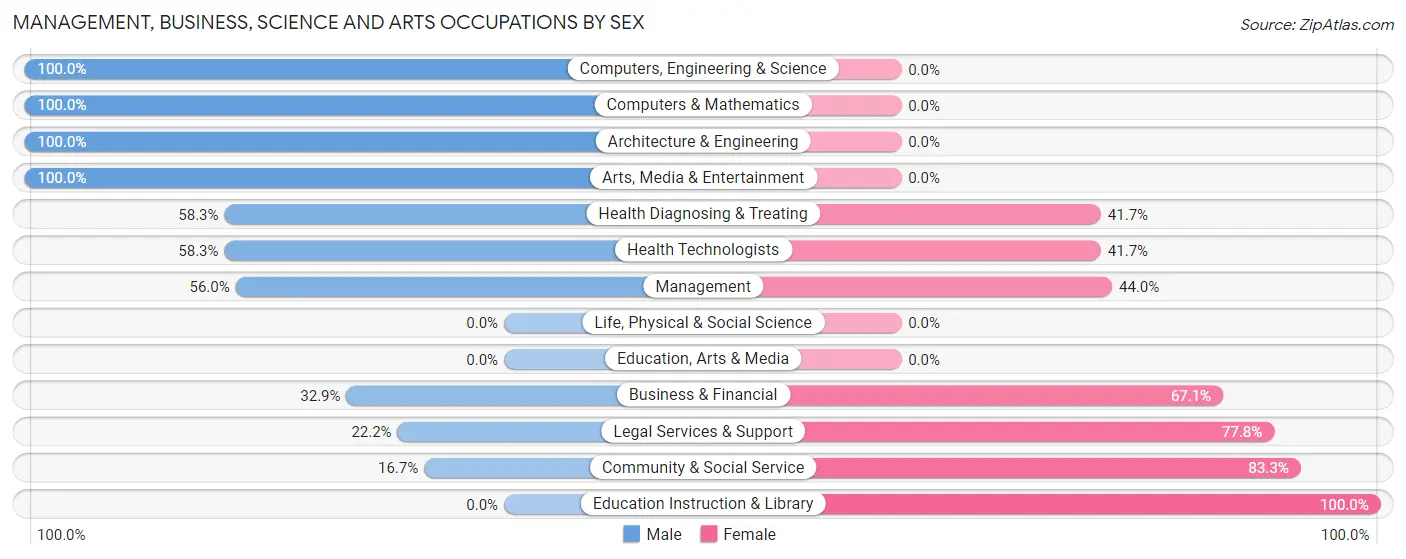
| Occupation | Male | Female |
| Management | 56 (56.0%) | 44 (44.0%) |
| Business & Financial | 24 (32.9%) | 49 (67.1%) |
| Computers, Engineering & Science | 61 (100.0%) | 0 (0.0%) |
| Computers & Mathematics | 25 (100.0%) | 0 (0.0%) |
| Architecture & Engineering | 36 (100.0%) | 0 (0.0%) |
| Life, Physical & Social Science | 0 (0.0%) | 0 (0.0%) |
| Community & Social Service | 18 (16.7%) | 90 (83.3%) |
| Education, Arts & Media | 0 (0.0%) | 0 (0.0%) |
| Legal Services & Support | 6 (22.2%) | 21 (77.8%) |
| Education Instruction & Library | 0 (0.0%) | 69 (100.0%) |
| Arts, Media & Entertainment | 12 (100.0%) | 0 (0.0%) |
| Health Diagnosing & Treating | 42 (58.3%) | 30 (41.7%) |
| Health Technologists | 42 (58.3%) | 30 (41.7%) |
| Total (Category) | 201 (48.5%) | 213 (51.4%) |
| Total (Overall) | 390 (49.5%) | 398 (50.5%) |
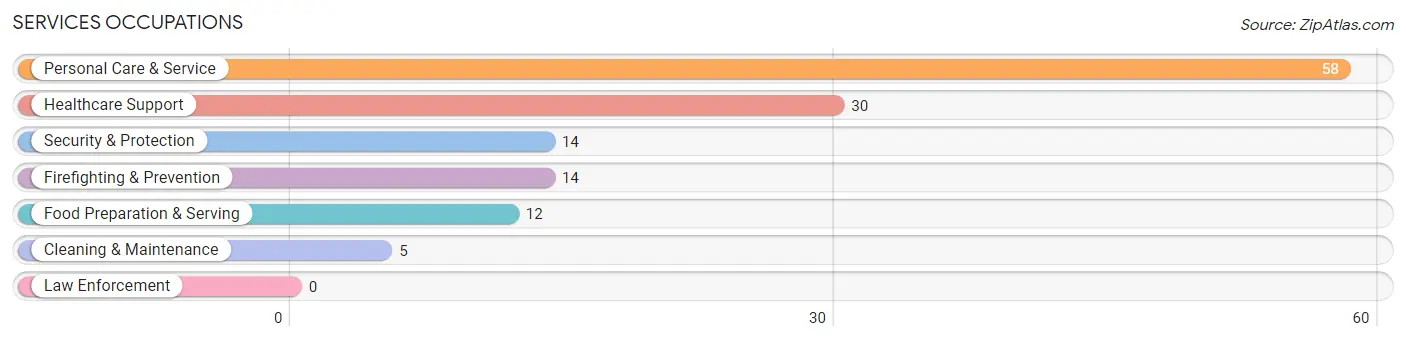
Services Occupations
The most common Services occupations in Dennis are Personal Care & Service (58 | 7.4%), Healthcare Support (30 | 3.8%), Security & Protection (14 | 1.8%), Firefighting & Prevention (14 | 1.8%), and Food Preparation & Serving (12 | 1.5%).
Services Occupations by Sex
Within the Services occupations in Dennis, the most male-oriented occupations are Security & Protection (100.0%), Firefighting & Prevention (100.0%), and Food Preparation & Serving (100.0%), while the most female-oriented occupations are Healthcare Support (100.0%), and Personal Care & Service (84.5%).
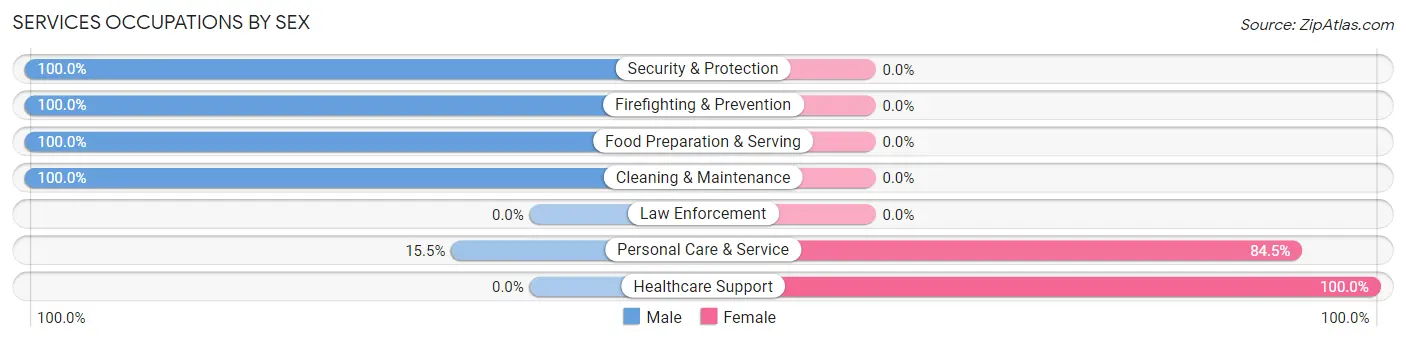
| Occupation | Male | Female |
| Healthcare Support | 0 (0.0%) | 30 (100.0%) |
| Security & Protection | 14 (100.0%) | 0 (0.0%) |
| Firefighting & Prevention | 14 (100.0%) | 0 (0.0%) |
| Law Enforcement | 0 (0.0%) | 0 (0.0%) |
| Food Preparation & Serving | 12 (100.0%) | 0 (0.0%) |
| Cleaning & Maintenance | 5 (100.0%) | 0 (0.0%) |
| Personal Care & Service | 9 (15.5%) | 49 (84.5%) |
| Total (Category) | 40 (33.6%) | 79 (66.4%) |
| Total (Overall) | 390 (49.5%) | 398 (50.5%) |
Sales and Office Occupations
The most common Sales and Office occupations in Dennis are Sales & Related (135 | 17.1%), and Office & Administration (36 | 4.6%).
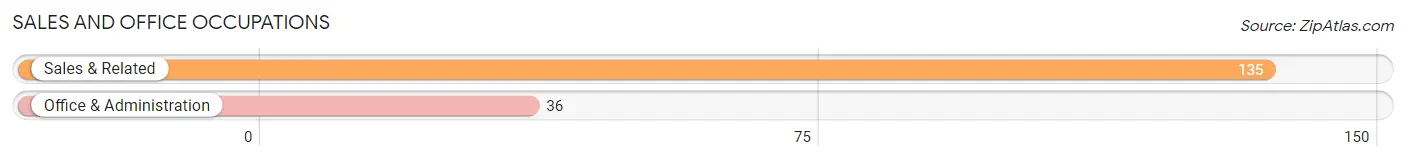
Sales and Office Occupations by Sex

| Occupation | Male | Female |
| Sales & Related | 65 (48.1%) | 70 (51.8%) |
| Office & Administration | 0 (0.0%) | 36 (100.0%) |
| Total (Category) | 65 (38.0%) | 106 (62.0%) |
| Total (Overall) | 390 (49.5%) | 398 (50.5%) |
Natural Resources, Construction and Maintenance Occupations
The most common Natural Resources, Construction and Maintenance occupations in Dennis are Construction & Extraction (24 | 3.0%), and Installation, Maintenance & Repair (9 | 1.1%).
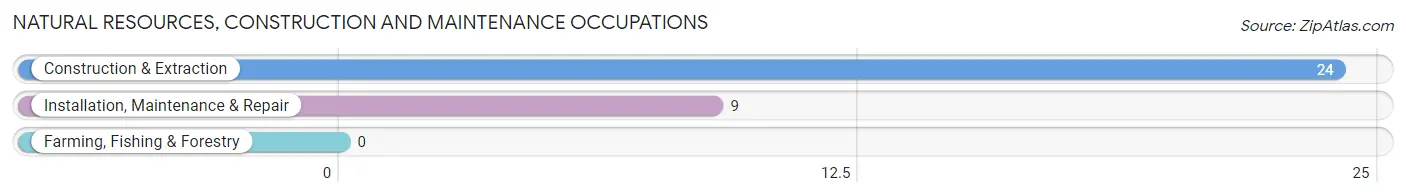
Natural Resources, Construction and Maintenance Occupations by Sex
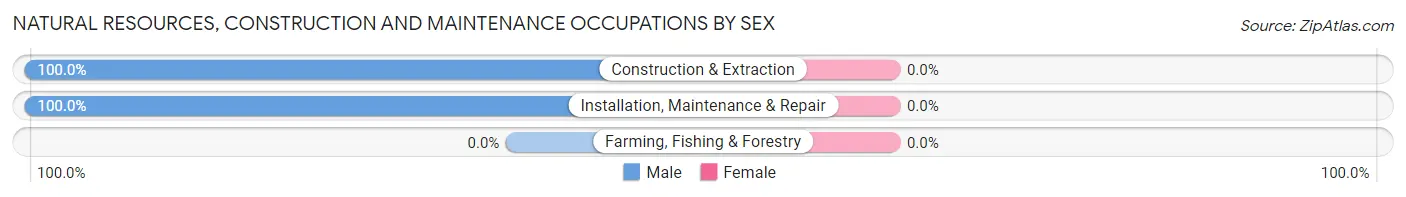
| Occupation | Male | Female |
| Farming, Fishing & Forestry | 0 (0.0%) | 0 (0.0%) |
| Construction & Extraction | 24 (100.0%) | 0 (0.0%) |
| Installation, Maintenance & Repair | 9 (100.0%) | 0 (0.0%) |
| Total (Category) | 33 (100.0%) | 0 (0.0%) |
| Total (Overall) | 390 (49.5%) | 398 (50.5%) |
Production, Transportation and Moving Occupations
The most common Production, Transportation and Moving occupations in Dennis are Transportation (43 | 5.5%), and Production (8 | 1.0%).
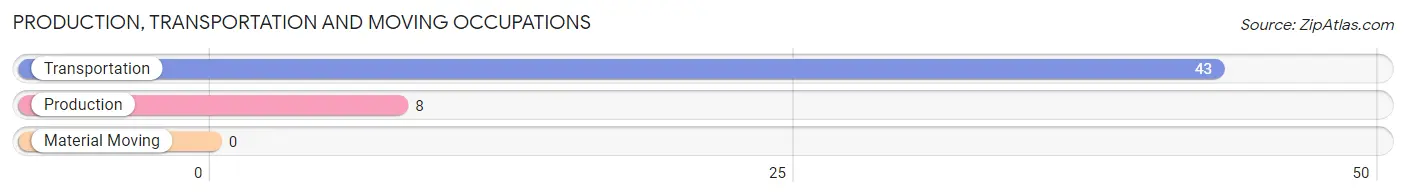
Production, Transportation and Moving Occupations by Sex
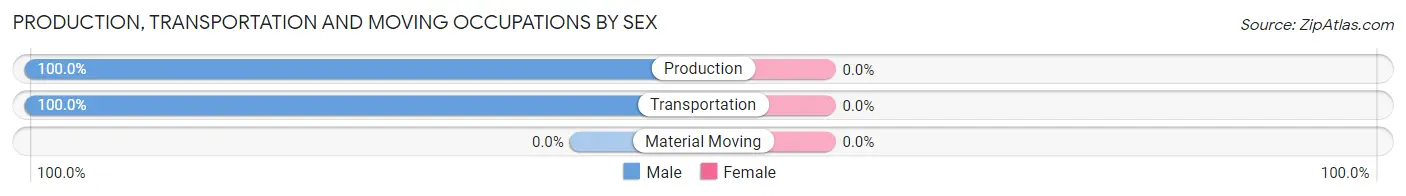
| Occupation | Male | Female |
| Production | 8 (100.0%) | 0 (0.0%) |
| Transportation | 43 (100.0%) | 0 (0.0%) |
| Material Moving | 0 (0.0%) | 0 (0.0%) |
| Total (Category) | 51 (100.0%) | 0 (0.0%) |
| Total (Overall) | 390 (49.5%) | 398 (50.5%) |
Employment Industries by Sex in Dennis
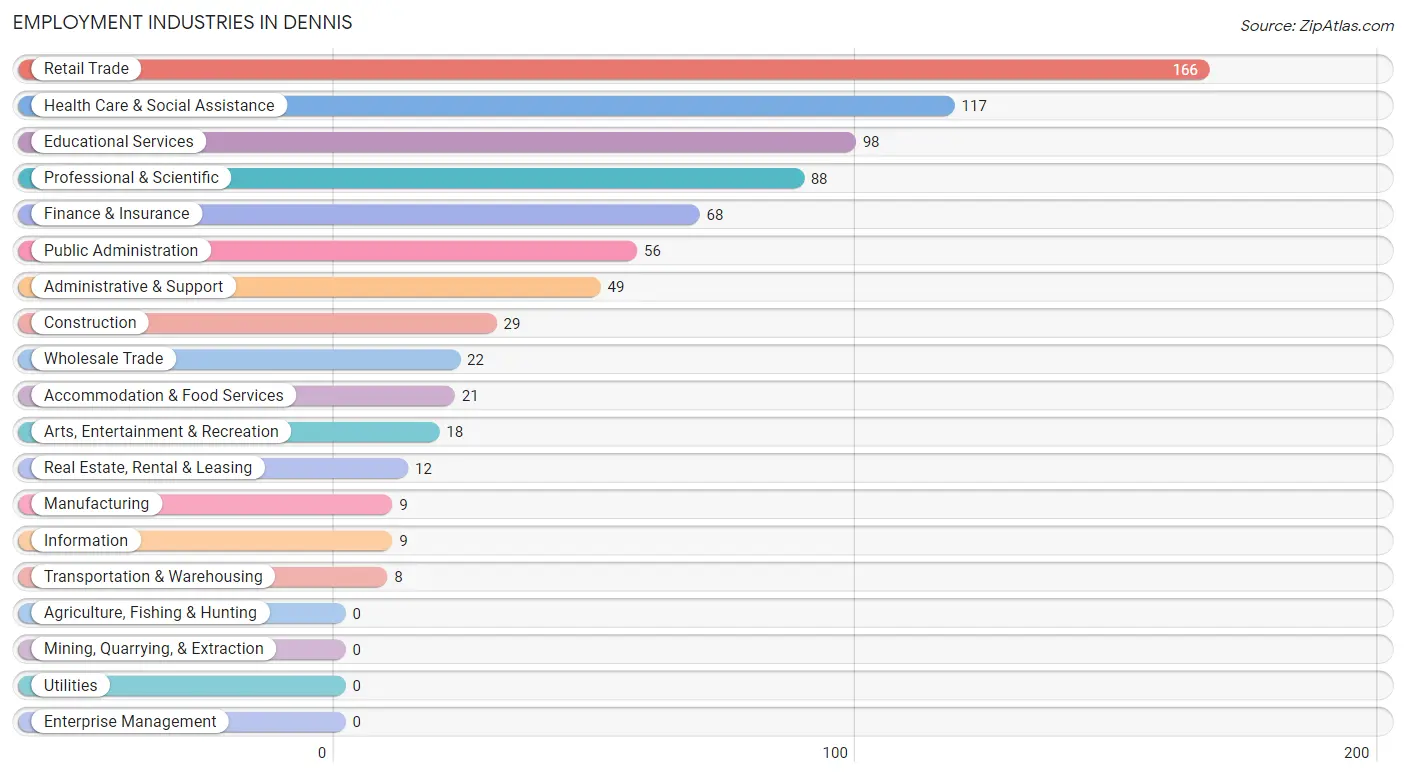
Employment Industries in Dennis
The major employment industries in Dennis include Retail Trade (166 | 21.1%), Health Care & Social Assistance (117 | 14.8%), Educational Services (98 | 12.4%), Professional & Scientific (88 | 11.2%), and Finance & Insurance (68 | 8.6%).
Employment Industries by Sex in Dennis
The Dennis industries that see more men than women are Construction (100.0%), Manufacturing (100.0%), and Real Estate, Rental & Leasing (100.0%), whereas the industries that tend to have a higher number of women are Transportation & Warehousing (100.0%), Information (100.0%), and Health Care & Social Assistance (85.5%).
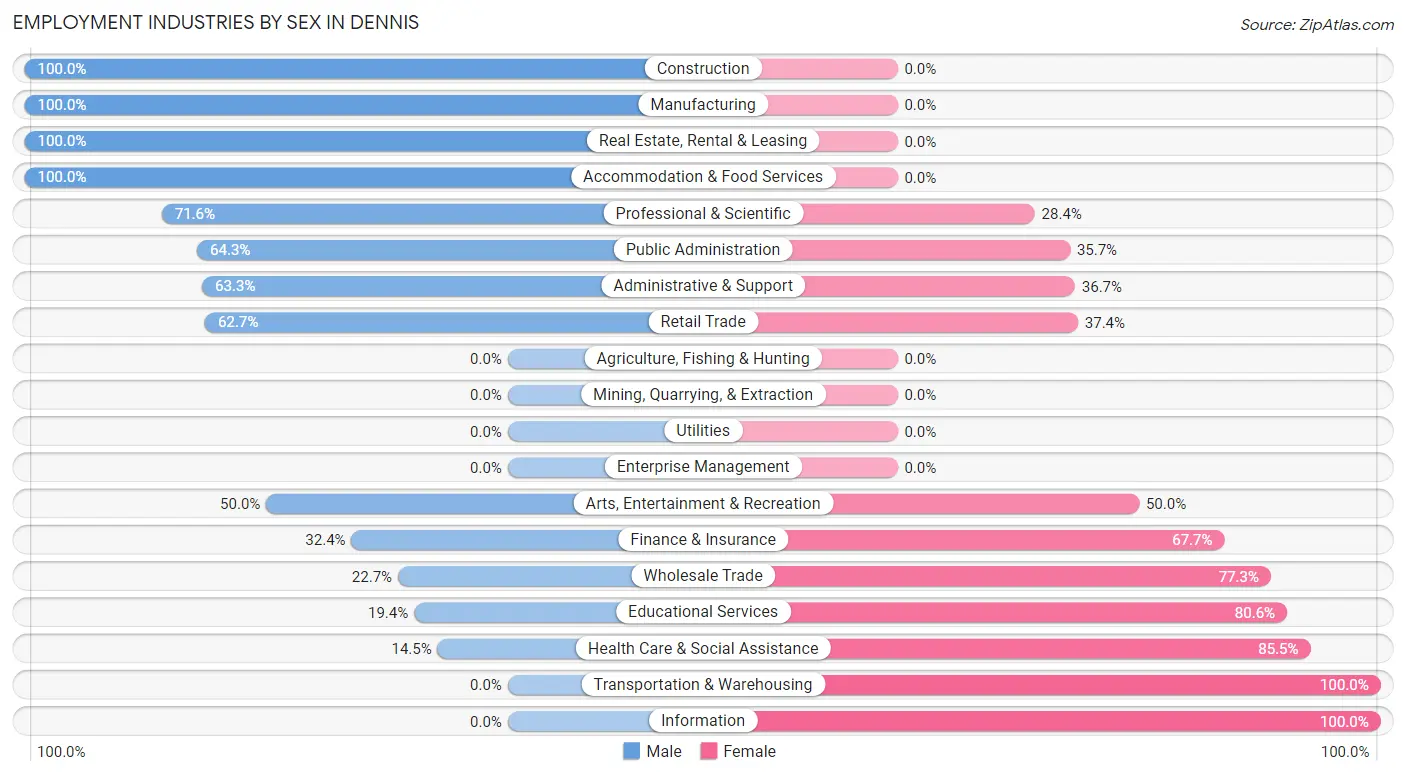
| Industry | Male | Female |
| Agriculture, Fishing & Hunting | 0 (0.0%) | 0 (0.0%) |
| Mining, Quarrying, & Extraction | 0 (0.0%) | 0 (0.0%) |
| Construction | 29 (100.0%) | 0 (0.0%) |
| Manufacturing | 9 (100.0%) | 0 (0.0%) |
| Wholesale Trade | 5 (22.7%) | 17 (77.3%) |
| Retail Trade | 104 (62.6%) | 62 (37.3%) |
| Transportation & Warehousing | 0 (0.0%) | 8 (100.0%) |
| Utilities | 0 (0.0%) | 0 (0.0%) |
| Information | 0 (0.0%) | 9 (100.0%) |
| Finance & Insurance | 22 (32.4%) | 46 (67.6%) |
| Real Estate, Rental & Leasing | 12 (100.0%) | 0 (0.0%) |
| Professional & Scientific | 63 (71.6%) | 25 (28.4%) |
| Enterprise Management | 0 (0.0%) | 0 (0.0%) |
| Administrative & Support | 31 (63.3%) | 18 (36.7%) |
| Educational Services | 19 (19.4%) | 79 (80.6%) |
| Health Care & Social Assistance | 17 (14.5%) | 100 (85.5%) |
| Arts, Entertainment & Recreation | 9 (50.0%) | 9 (50.0%) |
| Accommodation & Food Services | 21 (100.0%) | 0 (0.0%) |
| Public Administration | 36 (64.3%) | 20 (35.7%) |
| Total | 390 (49.5%) | 398 (50.5%) |
Education in Dennis
School Enrollment in Dennis
The most common levels of schooling among the 201 students in Dennis are middle school (52 | 25.9%), high school (39 | 19.4%), and graduate / professional (30 | 14.9%).
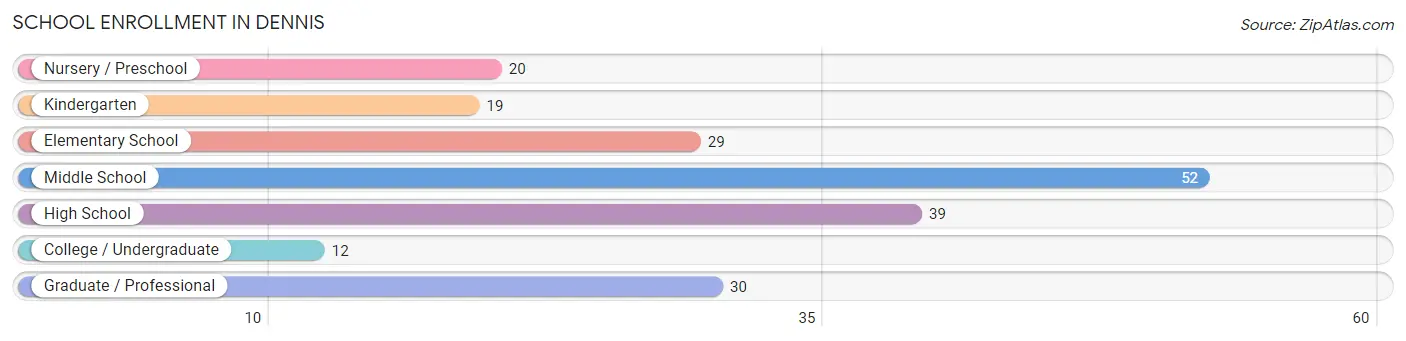
| School Level | # Students | % Students |
| Nursery / Preschool | 20 | 10.0% |
| Kindergarten | 19 | 9.5% |
| Elementary School | 29 | 14.4% |
| Middle School | 52 | 25.9% |
| High School | 39 | 19.4% |
| College / Undergraduate | 12 | 6.0% |
| Graduate / Professional | 30 | 14.9% |
| Total | 201 | 100.0% |
School Enrollment by Age by Funding Source in Dennis
Out of a total of 201 students who are enrolled in schools in Dennis, 39 (19.4%) attend a private institution, while the remaining 162 (80.6%) are enrolled in public schools. The age group of 3 to 4 year olds has the highest likelihood of being enrolled in private schools, with 20 (100.0% in the age bracket) enrolled. Conversely, the age group of 10 to 14 year olds has the lowest likelihood of being enrolled in a private school, with 65 (100.0% in the age bracket) attending a public institution.
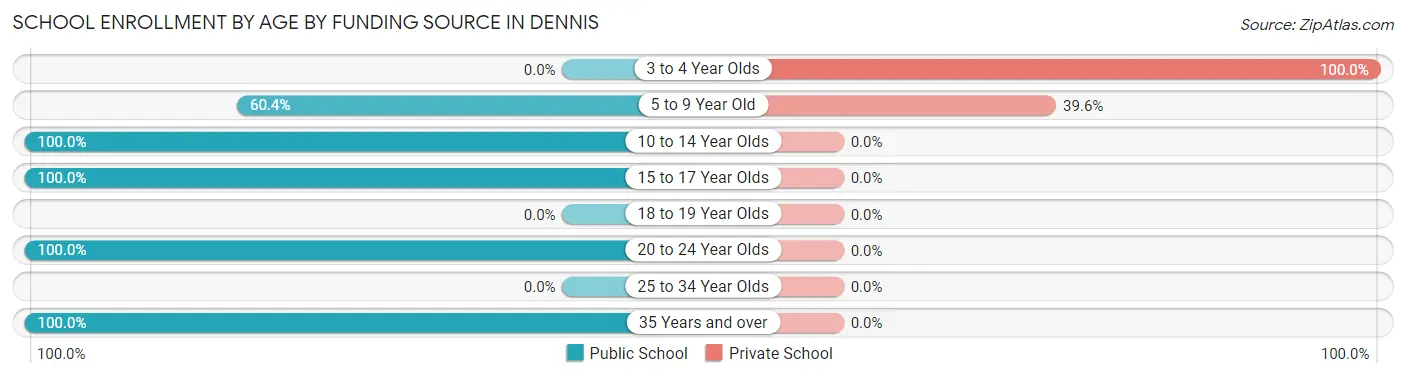
| Age Bracket | Public School | Private School |
| 3 to 4 Year Olds | 0 (0.0%) | 20 (100.0%) |
| 5 to 9 Year Old | 29 (60.4%) | 19 (39.6%) |
| 10 to 14 Year Olds | 65 (100.0%) | 0 (0.0%) |
| 15 to 17 Year Olds | 26 (100.0%) | 0 (0.0%) |
| 18 to 19 Year Olds | 0 (0.0%) | 0 (0.0%) |
| 20 to 24 Year Olds | 30 (100.0%) | 0 (0.0%) |
| 25 to 34 Year Olds | 0 (0.0%) | 0 (0.0%) |
| 35 Years and over | 12 (100.0%) | 0 (0.0%) |
| Total | 162 (80.6%) | 39 (19.4%) |
Educational Attainment by Field of Study in Dennis
Social sciences (173 | 20.0%), business (140 | 16.2%), education (115 | 13.3%), literature & languages (76 | 8.8%), and psychology (75 | 8.6%) are the most common fields of study among 867 individuals in Dennis who have obtained a bachelor's degree or higher.
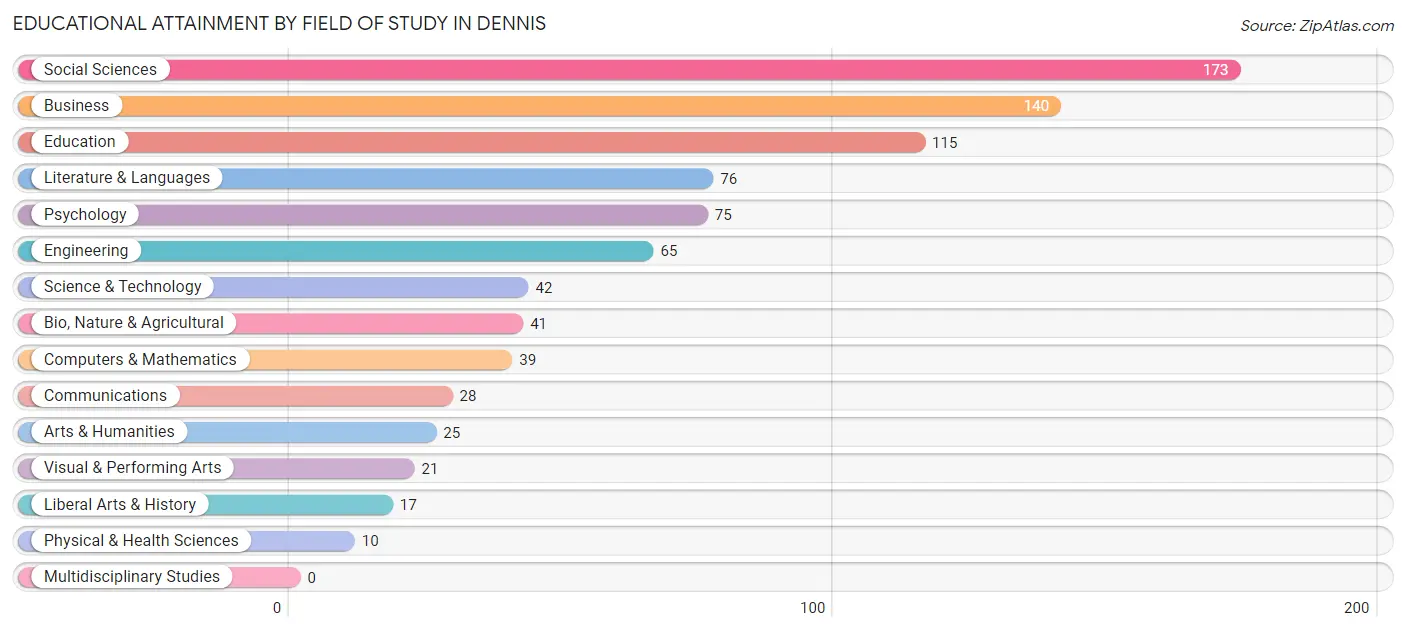
| Field of Study | # Graduates | % Graduates |
| Computers & Mathematics | 39 | 4.5% |
| Bio, Nature & Agricultural | 41 | 4.7% |
| Physical & Health Sciences | 10 | 1.1% |
| Psychology | 75 | 8.6% |
| Social Sciences | 173 | 20.0% |
| Engineering | 65 | 7.5% |
| Multidisciplinary Studies | 0 | 0.0% |
| Science & Technology | 42 | 4.8% |
| Business | 140 | 16.2% |
| Education | 115 | 13.3% |
| Literature & Languages | 76 | 8.8% |
| Liberal Arts & History | 17 | 2.0% |
| Visual & Performing Arts | 21 | 2.4% |
| Communications | 28 | 3.2% |
| Arts & Humanities | 25 | 2.9% |
| Total | 867 | 100.0% |
Transportation & Commute in Dennis
Vehicle Availability by Sex in Dennis
The most prevalent vehicle ownership categories in Dennis are males with 2 vehicles (186, accounting for 47.7%) and females with 2 vehicles (143, making up 47.4%).
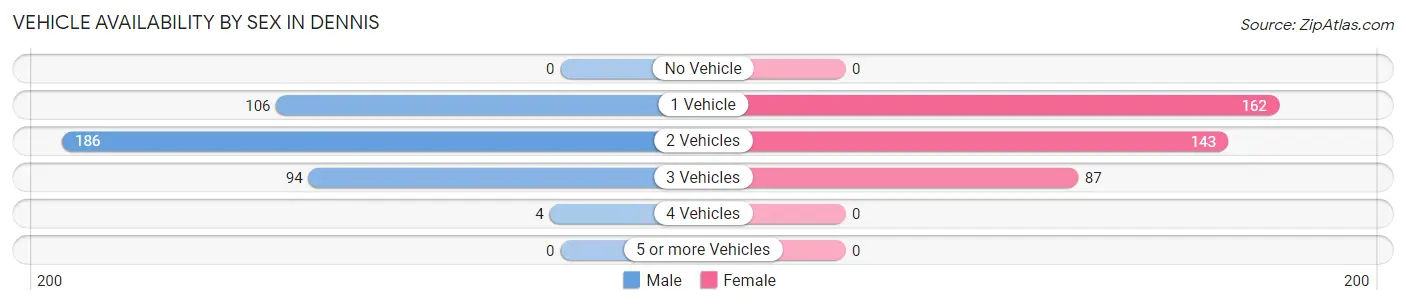
| Vehicles Available | Male | Female |
| No Vehicle | 0 (0.0%) | 0 (0.0%) |
| 1 Vehicle | 106 (27.2%) | 162 (41.3%) |
| 2 Vehicles | 186 (47.7%) | 143 (36.5%) |
| 3 Vehicles | 94 (24.1%) | 87 (22.2%) |
| 4 Vehicles | 4 (1.0%) | 0 (0.0%) |
| 5 or more Vehicles | 0 (0.0%) | 0 (0.0%) |
| Total | 390 (100.0%) | 392 (100.0%) |
Commute Time in Dennis
The most frequently occuring commute durations in Dennis are 20 to 24 minutes (125 commuters, 22.3%), 30 to 34 minutes (87 commuters, 15.5%), and 15 to 19 minutes (84 commuters, 15.0%).
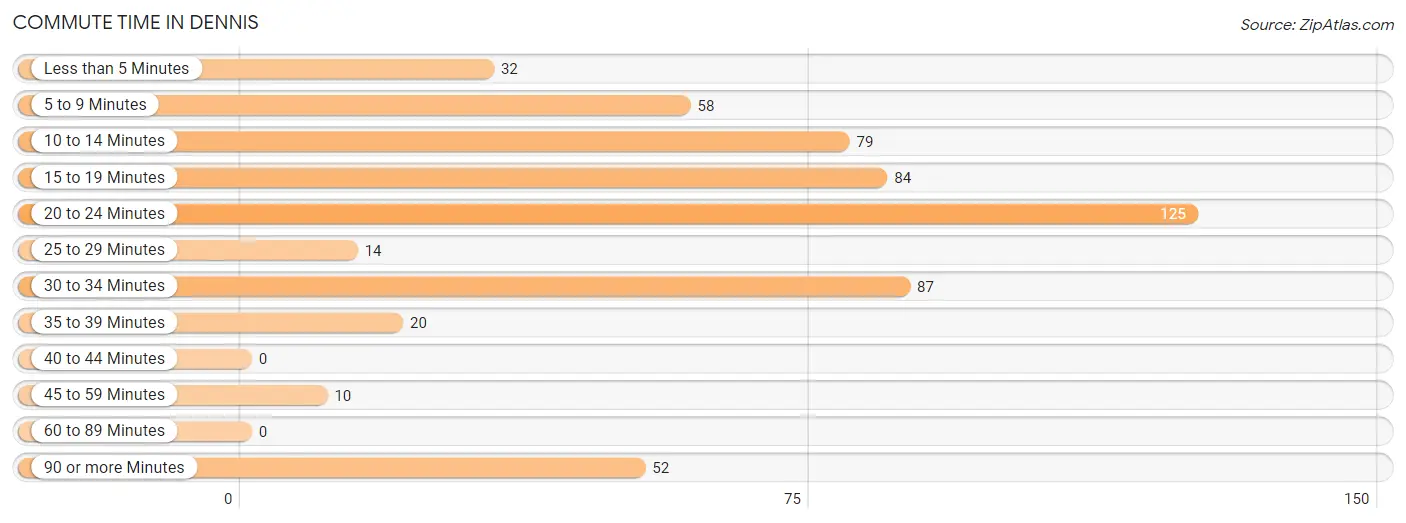
| Commute Time | # Commuters | % Commuters |
| Less than 5 Minutes | 32 | 5.7% |
| 5 to 9 Minutes | 58 | 10.3% |
| 10 to 14 Minutes | 79 | 14.1% |
| 15 to 19 Minutes | 84 | 15.0% |
| 20 to 24 Minutes | 125 | 22.3% |
| 25 to 29 Minutes | 14 | 2.5% |
| 30 to 34 Minutes | 87 | 15.5% |
| 35 to 39 Minutes | 20 | 3.6% |
| 40 to 44 Minutes | 0 | 0.0% |
| 45 to 59 Minutes | 10 | 1.8% |
| 60 to 89 Minutes | 0 | 0.0% |
| 90 or more Minutes | 52 | 9.3% |
Commute Time by Sex in Dennis
The most common commute times in Dennis are 20 to 24 minutes (54 commuters, 18.0%) for males and 20 to 24 minutes (71 commuters, 27.2%) for females.
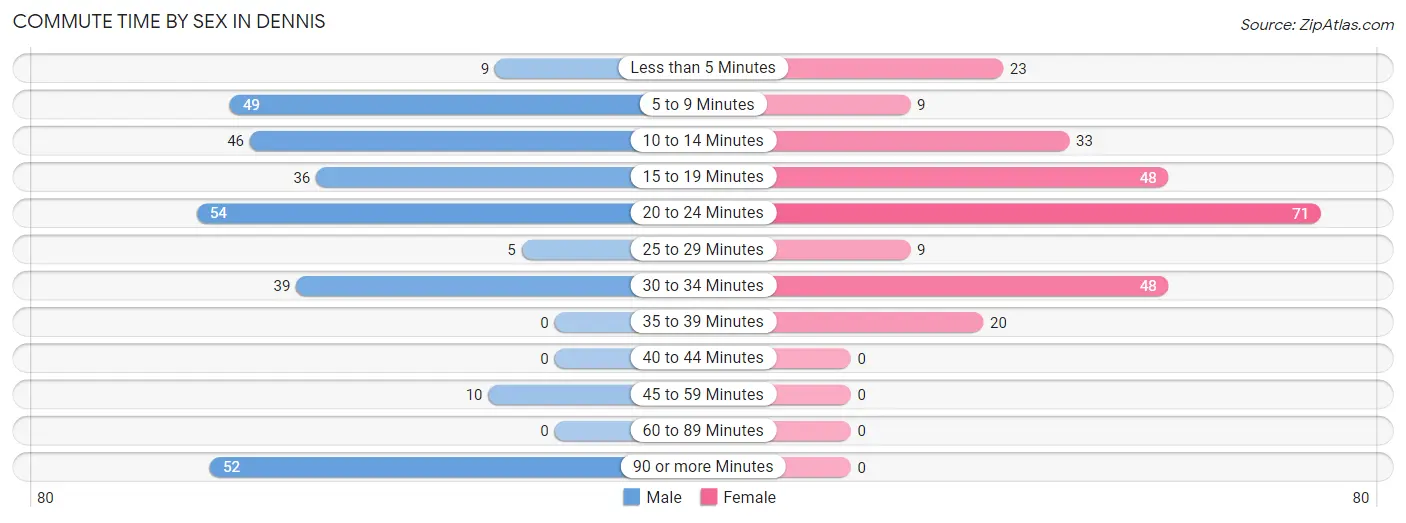
| Commute Time | Male | Female |
| Less than 5 Minutes | 9 (3.0%) | 23 (8.8%) |
| 5 to 9 Minutes | 49 (16.3%) | 9 (3.5%) |
| 10 to 14 Minutes | 46 (15.3%) | 33 (12.6%) |
| 15 to 19 Minutes | 36 (12.0%) | 48 (18.4%) |
| 20 to 24 Minutes | 54 (18.0%) | 71 (27.2%) |
| 25 to 29 Minutes | 5 (1.7%) | 9 (3.5%) |
| 30 to 34 Minutes | 39 (13.0%) | 48 (18.4%) |
| 35 to 39 Minutes | 0 (0.0%) | 20 (7.7%) |
| 40 to 44 Minutes | 0 (0.0%) | 0 (0.0%) |
| 45 to 59 Minutes | 10 (3.3%) | 0 (0.0%) |
| 60 to 89 Minutes | 0 (0.0%) | 0 (0.0%) |
| 90 or more Minutes | 52 (17.3%) | 0 (0.0%) |
Time of Departure to Work by Sex in Dennis
The most frequent times of departure to work in Dennis are 7:00 AM to 7:29 AM (113, 37.7%) for males and 8:00 AM to 8:29 AM (98, 37.6%) for females.
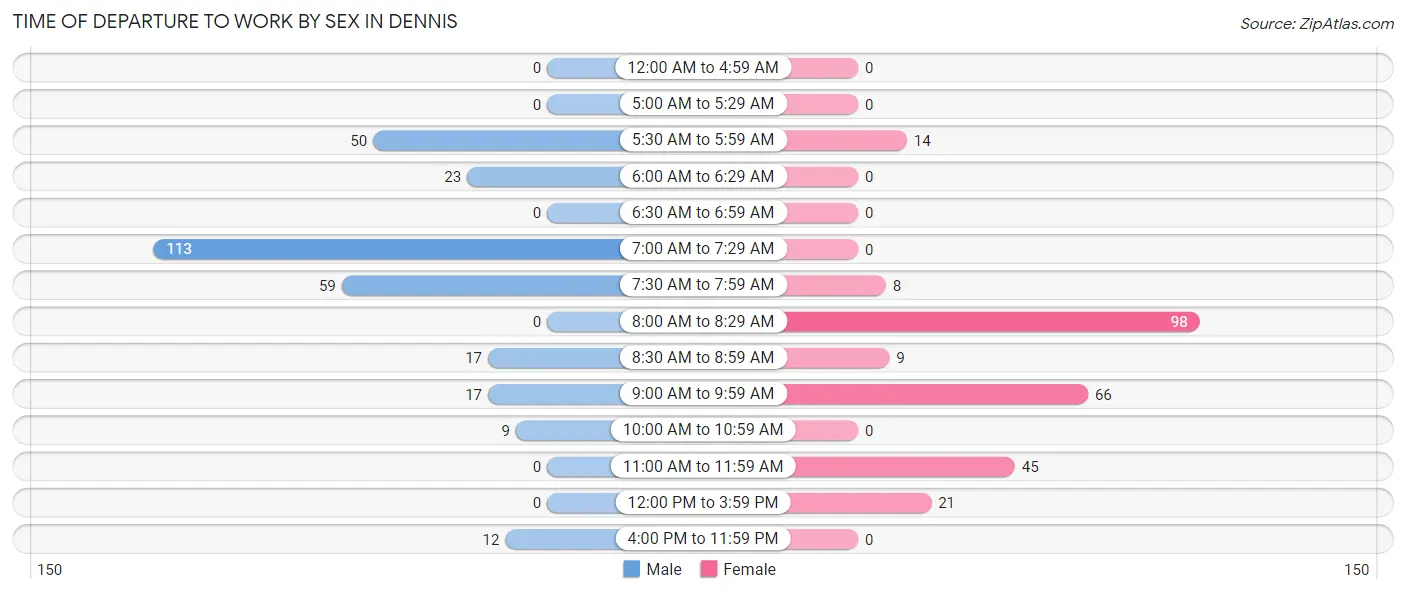
| Time of Departure | Male | Female |
| 12:00 AM to 4:59 AM | 0 (0.0%) | 0 (0.0%) |
| 5:00 AM to 5:29 AM | 0 (0.0%) | 0 (0.0%) |
| 5:30 AM to 5:59 AM | 50 (16.7%) | 14 (5.4%) |
| 6:00 AM to 6:29 AM | 23 (7.7%) | 0 (0.0%) |
| 6:30 AM to 6:59 AM | 0 (0.0%) | 0 (0.0%) |
| 7:00 AM to 7:29 AM | 113 (37.7%) | 0 (0.0%) |
| 7:30 AM to 7:59 AM | 59 (19.7%) | 8 (3.1%) |
| 8:00 AM to 8:29 AM | 0 (0.0%) | 98 (37.6%) |
| 8:30 AM to 8:59 AM | 17 (5.7%) | 9 (3.5%) |
| 9:00 AM to 9:59 AM | 17 (5.7%) | 66 (25.3%) |
| 10:00 AM to 10:59 AM | 9 (3.0%) | 0 (0.0%) |
| 11:00 AM to 11:59 AM | 0 (0.0%) | 45 (17.2%) |
| 12:00 PM to 3:59 PM | 0 (0.0%) | 21 (8.1%) |
| 4:00 PM to 11:59 PM | 12 (4.0%) | 0 (0.0%) |
| Total | 300 (100.0%) | 261 (100.0%) |
Housing Occupancy in Dennis
Occupancy by Ownership in Dennis
Of the total 986 dwellings in Dennis, owner-occupied units account for 830 (84.2%), while renter-occupied units make up 156 (15.8%).
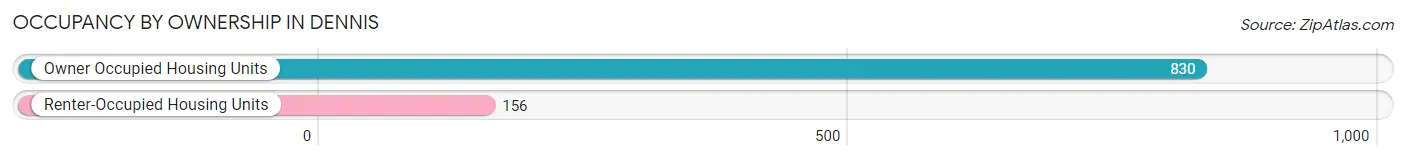
| Occupancy | # Housing Units | % Housing Units |
| Owner Occupied Housing Units | 830 | 84.2% |
| Renter-Occupied Housing Units | 156 | 15.8% |
| Total Occupied Housing Units | 986 | 100.0% |
Occupancy by Household Size in Dennis
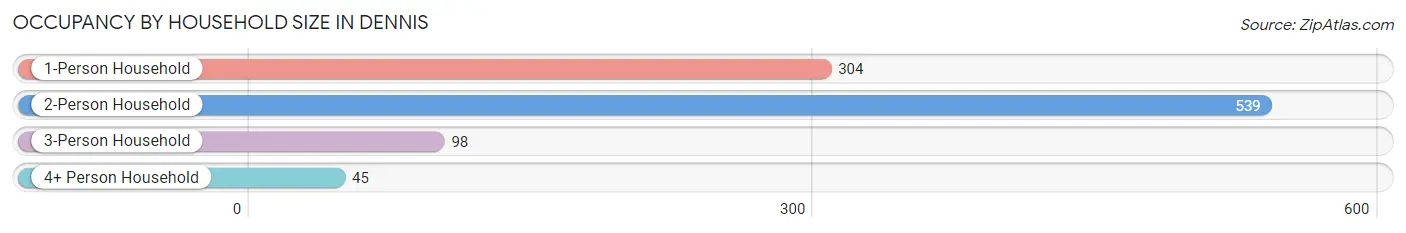
| Household Size | # Housing Units | % Housing Units |
| 1-Person Household | 304 | 30.8% |
| 2-Person Household | 539 | 54.7% |
| 3-Person Household | 98 | 9.9% |
| 4+ Person Household | 45 | 4.6% |
| Total Housing Units | 986 | 100.0% |
Occupancy by Ownership by Household Size in Dennis
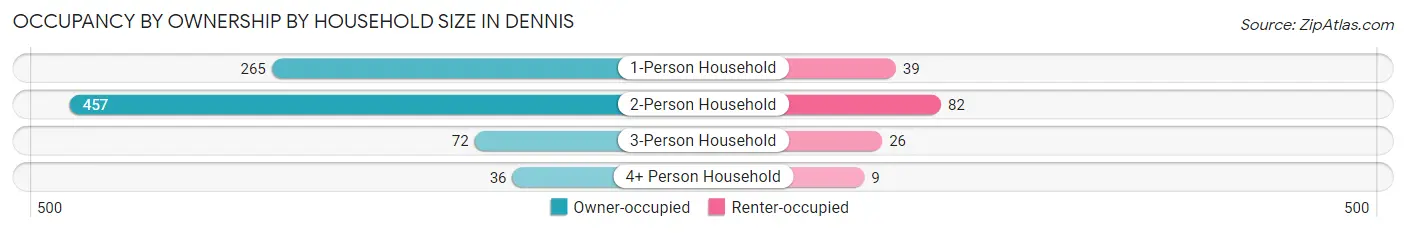
| Household Size | Owner-occupied | Renter-occupied |
| 1-Person Household | 265 (87.2%) | 39 (12.8%) |
| 2-Person Household | 457 (84.8%) | 82 (15.2%) |
| 3-Person Household | 72 (73.5%) | 26 (26.5%) |
| 4+ Person Household | 36 (80.0%) | 9 (20.0%) |
| Total Housing Units | 830 (84.2%) | 156 (15.8%) |
Occupancy by Educational Attainment in Dennis
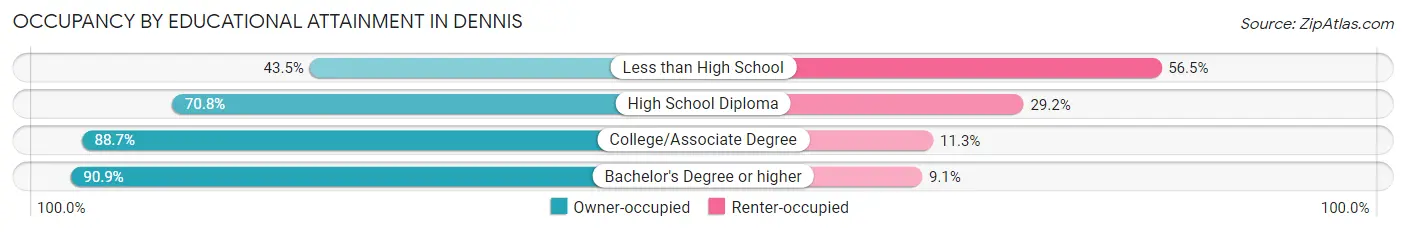
| Household Size | Owner-occupied | Renter-occupied |
| Less than High School | 20 (43.5%) | 26 (56.5%) |
| High School Diploma | 143 (70.8%) | 59 (29.2%) |
| College/Associate Degree | 157 (88.7%) | 20 (11.3%) |
| Bachelor's Degree or higher | 510 (90.9%) | 51 (9.1%) |
Occupancy by Age of Householder in Dennis
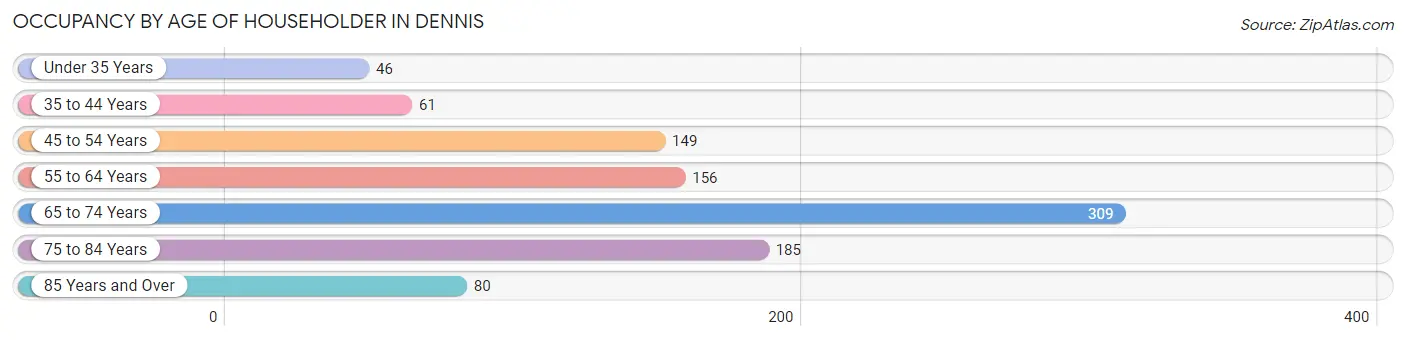
| Age Bracket | # Households | % Households |
| Under 35 Years | 46 | 4.7% |
| 35 to 44 Years | 61 | 6.2% |
| 45 to 54 Years | 149 | 15.1% |
| 55 to 64 Years | 156 | 15.8% |
| 65 to 74 Years | 309 | 31.3% |
| 75 to 84 Years | 185 | 18.8% |
| 85 Years and Over | 80 | 8.1% |
| Total | 986 | 100.0% |
Housing Finances in Dennis
Median Income by Occupancy in Dennis
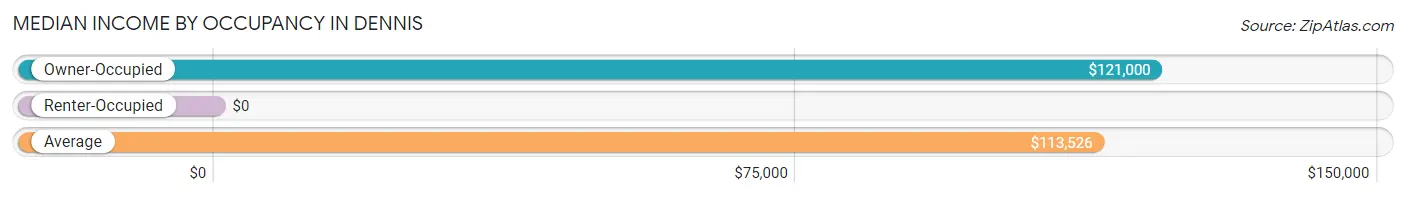
| Occupancy Type | # Households | Median Income |
| Owner-Occupied | 830 (84.2%) | $121,000 |
| Renter-Occupied | 156 (15.8%) | $0 |
| Average | 986 (100.0%) | $113,526 |
Occupancy by Householder Income Bracket in Dennis
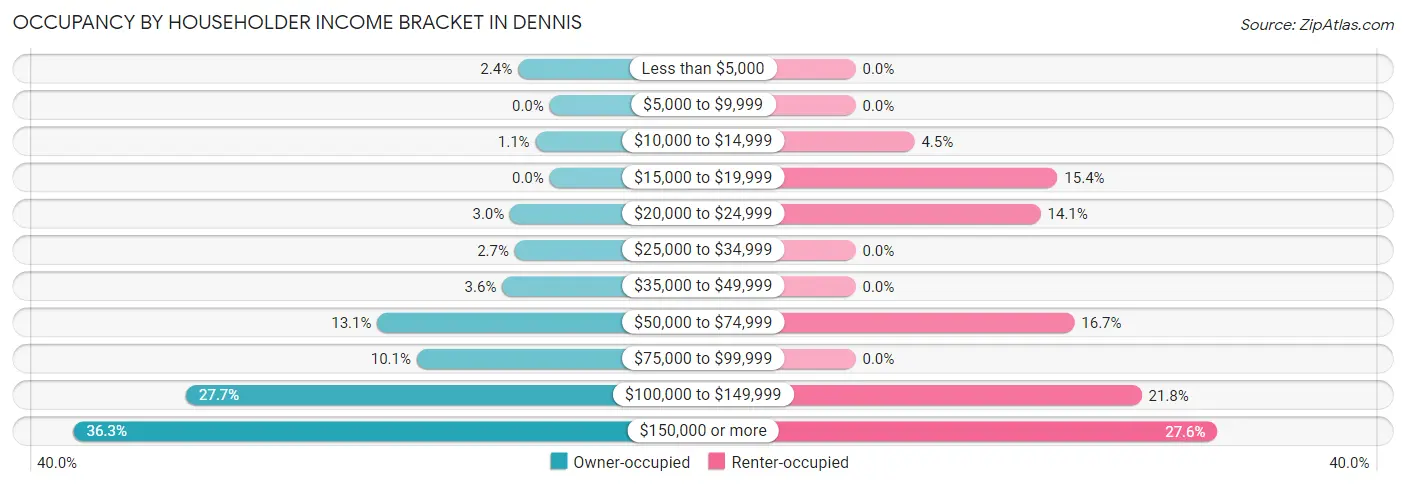
| Income Bracket | Owner-occupied | Renter-occupied |
| Less than $5,000 | 20 (2.4%) | 0 (0.0%) |
| $5,000 to $9,999 | 0 (0.0%) | 0 (0.0%) |
| $10,000 to $14,999 | 9 (1.1%) | 7 (4.5%) |
| $15,000 to $19,999 | 0 (0.0%) | 24 (15.4%) |
| $20,000 to $24,999 | 25 (3.0%) | 22 (14.1%) |
| $25,000 to $34,999 | 22 (2.6%) | 0 (0.0%) |
| $35,000 to $49,999 | 30 (3.6%) | 0 (0.0%) |
| $50,000 to $74,999 | 109 (13.1%) | 26 (16.7%) |
| $75,000 to $99,999 | 84 (10.1%) | 0 (0.0%) |
| $100,000 to $149,999 | 230 (27.7%) | 34 (21.8%) |
| $150,000 or more | 301 (36.3%) | 43 (27.6%) |
| Total | 830 (100.0%) | 156 (100.0%) |
Monthly Housing Cost Tiers in Dennis
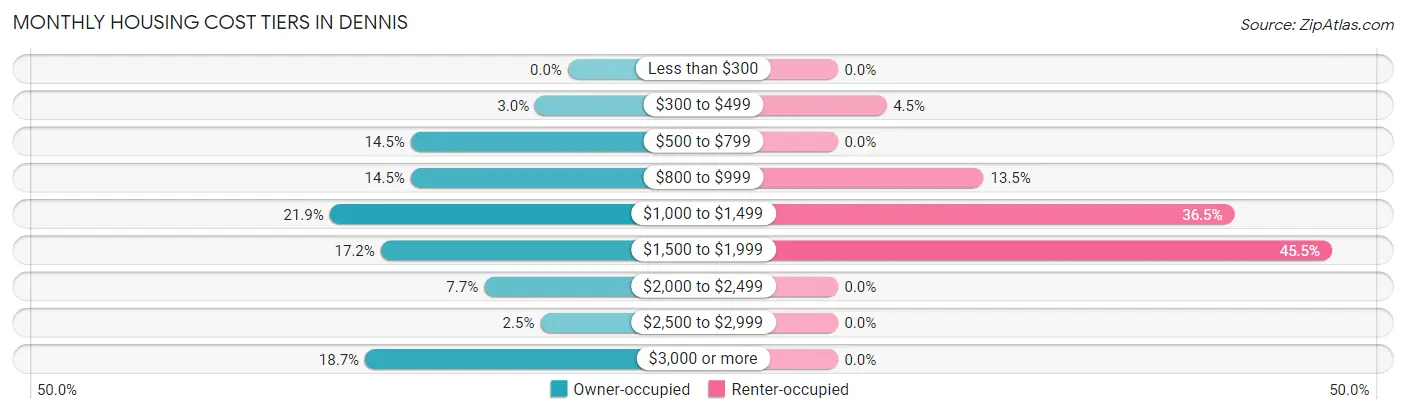
| Monthly Cost | Owner-occupied | Renter-occupied |
| Less than $300 | 0 (0.0%) | 0 (0.0%) |
| $300 to $499 | 25 (3.0%) | 7 (4.5%) |
| $500 to $799 | 120 (14.5%) | 0 (0.0%) |
| $800 to $999 | 120 (14.5%) | 21 (13.5%) |
| $1,000 to $1,499 | 182 (21.9%) | 57 (36.5%) |
| $1,500 to $1,999 | 143 (17.2%) | 71 (45.5%) |
| $2,000 to $2,499 | 64 (7.7%) | 0 (0.0%) |
| $2,500 to $2,999 | 21 (2.5%) | 0 (0.0%) |
| $3,000 or more | 155 (18.7%) | 0 (0.0%) |
| Total | 830 (100.0%) | 156 (100.0%) |
Physical Housing Characteristics in Dennis
Housing Structures in Dennis
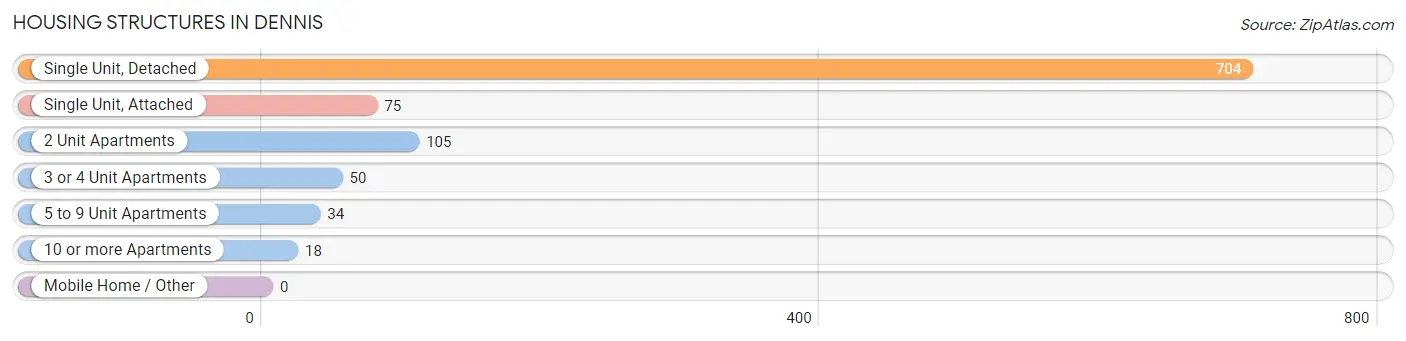
| Structure Type | # Housing Units | % Housing Units |
| Single Unit, Detached | 704 | 71.4% |
| Single Unit, Attached | 75 | 7.6% |
| 2 Unit Apartments | 105 | 10.6% |
| 3 or 4 Unit Apartments | 50 | 5.1% |
| 5 to 9 Unit Apartments | 34 | 3.5% |
| 10 or more Apartments | 18 | 1.8% |
| Mobile Home / Other | 0 | 0.0% |
| Total | 986 | 100.0% |
Housing Structures by Occupancy in Dennis
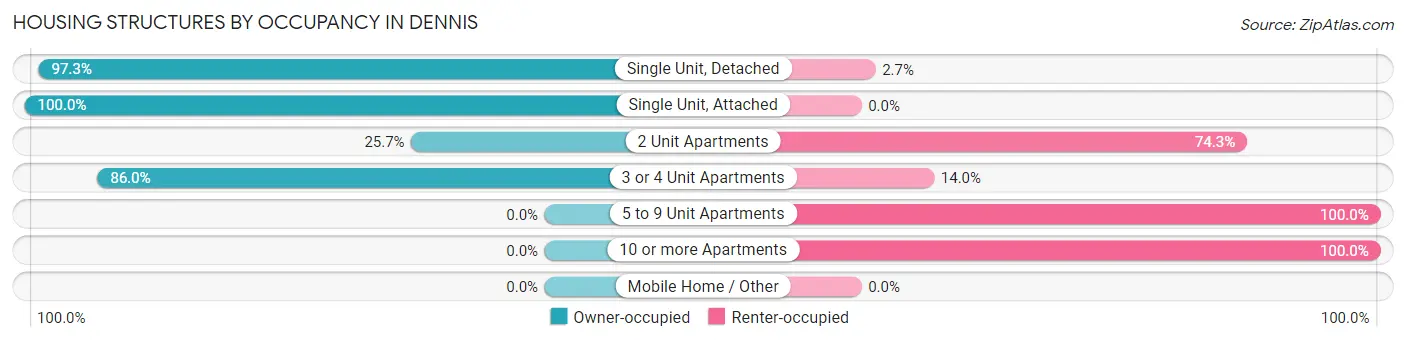
| Structure Type | Owner-occupied | Renter-occupied |
| Single Unit, Detached | 685 (97.3%) | 19 (2.7%) |
| Single Unit, Attached | 75 (100.0%) | 0 (0.0%) |
| 2 Unit Apartments | 27 (25.7%) | 78 (74.3%) |
| 3 or 4 Unit Apartments | 43 (86.0%) | 7 (14.0%) |
| 5 to 9 Unit Apartments | 0 (0.0%) | 34 (100.0%) |
| 10 or more Apartments | 0 (0.0%) | 18 (100.0%) |
| Mobile Home / Other | 0 (0.0%) | 0 (0.0%) |
| Total | 830 (84.2%) | 156 (15.8%) |
Housing Structures by Number of Rooms in Dennis
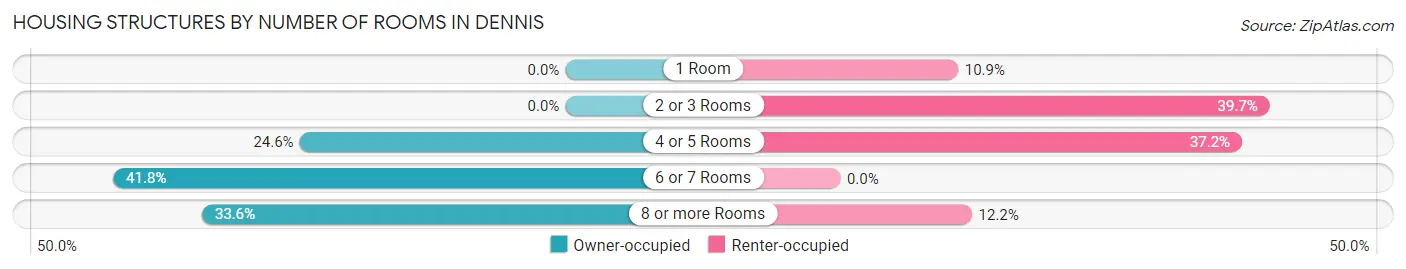
| Number of Rooms | Owner-occupied | Renter-occupied |
| 1 Room | 0 (0.0%) | 17 (10.9%) |
| 2 or 3 Rooms | 0 (0.0%) | 62 (39.7%) |
| 4 or 5 Rooms | 204 (24.6%) | 58 (37.2%) |
| 6 or 7 Rooms | 347 (41.8%) | 0 (0.0%) |
| 8 or more Rooms | 279 (33.6%) | 19 (12.2%) |
| Total | 830 (100.0%) | 156 (100.0%) |
Housing Structure by Heating Type in Dennis
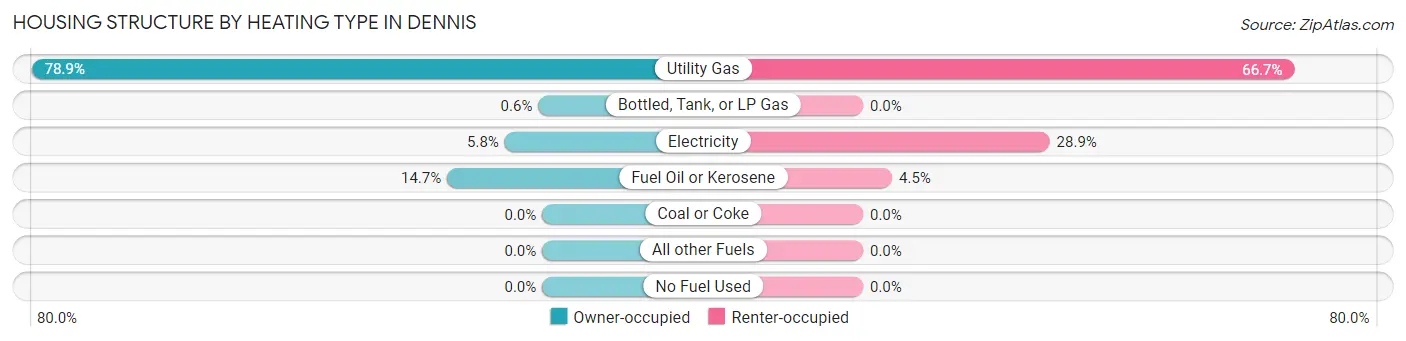
| Heating Type | Owner-occupied | Renter-occupied |
| Utility Gas | 655 (78.9%) | 104 (66.7%) |
| Bottled, Tank, or LP Gas | 5 (0.6%) | 0 (0.0%) |
| Electricity | 48 (5.8%) | 45 (28.8%) |
| Fuel Oil or Kerosene | 122 (14.7%) | 7 (4.5%) |
| Coal or Coke | 0 (0.0%) | 0 (0.0%) |
| All other Fuels | 0 (0.0%) | 0 (0.0%) |
| No Fuel Used | 0 (0.0%) | 0 (0.0%) |
| Total | 830 (100.0%) | 156 (100.0%) |
Household Vehicle Usage in Dennis
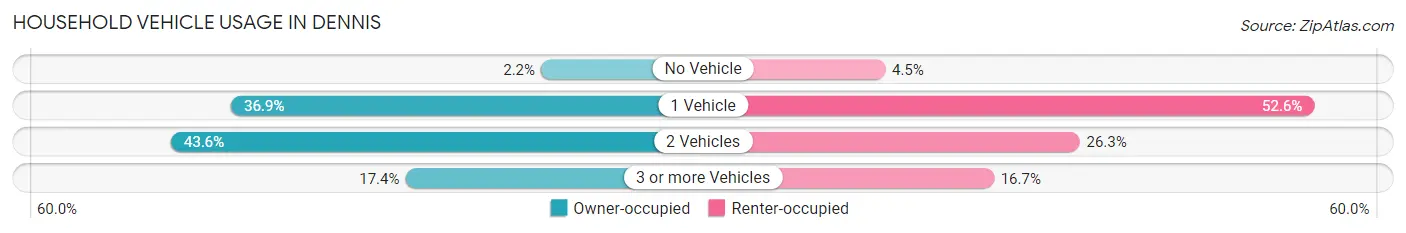
| Vehicles per Household | Owner-occupied | Renter-occupied |
| No Vehicle | 18 (2.2%) | 7 (4.5%) |
| 1 Vehicle | 306 (36.9%) | 82 (52.6%) |
| 2 Vehicles | 362 (43.6%) | 41 (26.3%) |
| 3 or more Vehicles | 144 (17.3%) | 26 (16.7%) |
| Total | 830 (100.0%) | 156 (100.0%) |
Real Estate & Mortgages in Dennis
Real Estate and Mortgage Overview in Dennis
| Characteristic | Without Mortgage | With Mortgage |
| Housing Units | 415 | 415 |
| Median Property Value | $764,500 | $677,500 |
| Median Household Income | $116,375 | $160 |
| Monthly Housing Costs | $889 | $146 |
| Real Estate Taxes | $3,847 | $0 |
Property Value by Mortgage Status in Dennis
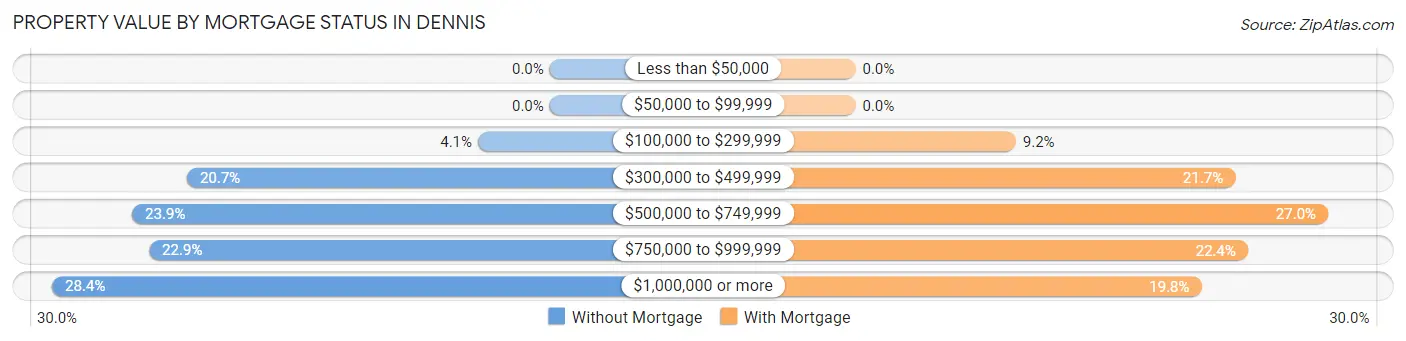
| Property Value | Without Mortgage | With Mortgage |
| Less than $50,000 | 0 (0.0%) | 0 (0.0%) |
| $50,000 to $99,999 | 0 (0.0%) | 0 (0.0%) |
| $100,000 to $299,999 | 17 (4.1%) | 38 (9.2%) |
| $300,000 to $499,999 | 86 (20.7%) | 90 (21.7%) |
| $500,000 to $749,999 | 99 (23.9%) | 112 (27.0%) |
| $750,000 to $999,999 | 95 (22.9%) | 93 (22.4%) |
| $1,000,000 or more | 118 (28.4%) | 82 (19.8%) |
| Total | 415 (100.0%) | 415 (100.0%) |
Household Income by Mortgage Status in Dennis
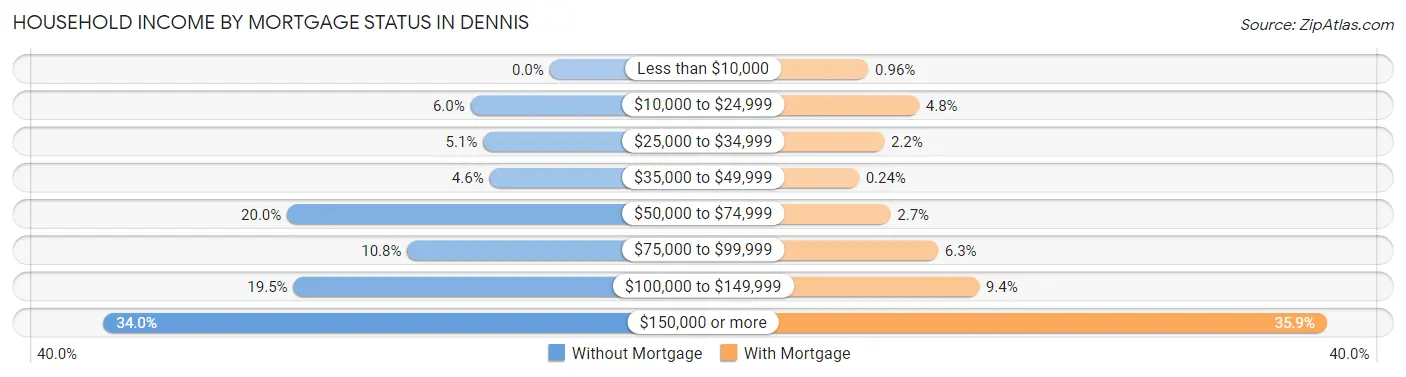
| Household Income | Without Mortgage | With Mortgage |
| Less than $10,000 | 0 (0.0%) | 4 (1.0%) |
| $10,000 to $24,999 | 25 (6.0%) | 20 (4.8%) |
| $25,000 to $34,999 | 21 (5.1%) | 9 (2.2%) |
| $35,000 to $49,999 | 19 (4.6%) | 1 (0.2%) |
| $50,000 to $74,999 | 83 (20.0%) | 11 (2.6%) |
| $75,000 to $99,999 | 45 (10.8%) | 26 (6.3%) |
| $100,000 to $149,999 | 81 (19.5%) | 39 (9.4%) |
| $150,000 or more | 141 (34.0%) | 149 (35.9%) |
| Total | 415 (100.0%) | 415 (100.0%) |
Property Value to Household Income Ratio in Dennis
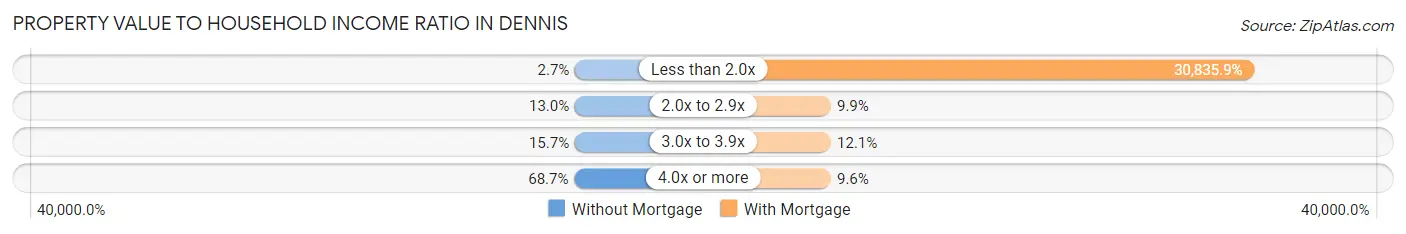
| Value-to-Income Ratio | Without Mortgage | With Mortgage |
| Less than 2.0x | 11 (2.6%) | 127,969 (30,835.9%) |
| 2.0x to 2.9x | 54 (13.0%) | 41 (9.9%) |
| 3.0x to 3.9x | 65 (15.7%) | 50 (12.0%) |
| 4.0x or more | 285 (68.7%) | 40 (9.6%) |
| Total | 415 (100.0%) | 415 (100.0%) |
Real Estate Taxes by Mortgage Status in Dennis
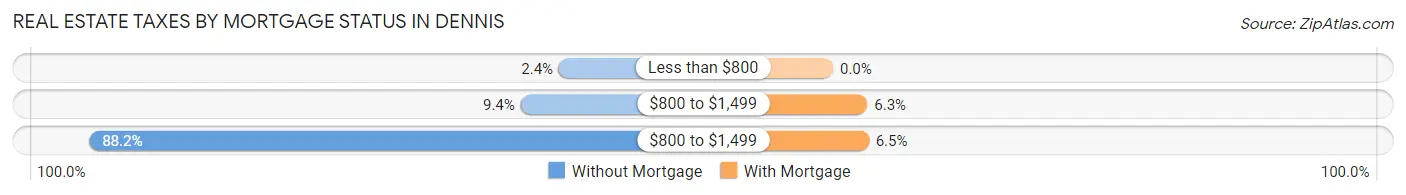
| Property Taxes | Without Mortgage | With Mortgage |
| Less than $800 | 10 (2.4%) | 0 (0.0%) |
| $800 to $1,499 | 39 (9.4%) | 26 (6.3%) |
| $800 to $1,499 | 366 (88.2%) | 27 (6.5%) |
| Total | 415 (100.0%) | 415 (100.0%) |
Health & Disability in Dennis
Health Insurance Coverage by Age in Dennis
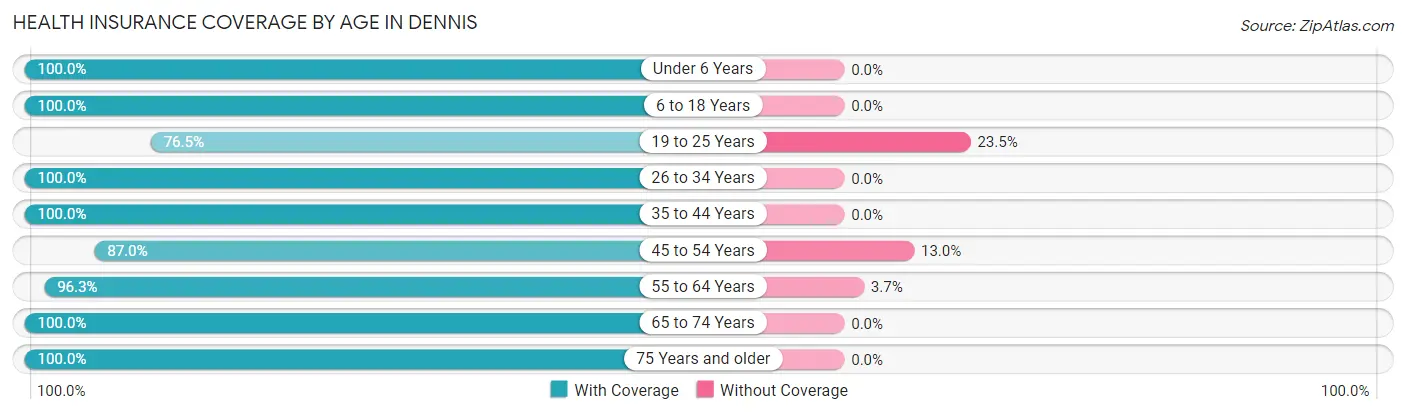
| Age Bracket | With Coverage | Without Coverage |
| Under 6 Years | 24 (100.0%) | 0 (0.0%) |
| 6 to 18 Years | 139 (100.0%) | 0 (0.0%) |
| 19 to 25 Years | 117 (76.5%) | 36 (23.5%) |
| 26 to 34 Years | 42 (100.0%) | 0 (0.0%) |
| 35 to 44 Years | 103 (100.0%) | 0 (0.0%) |
| 45 to 54 Years | 174 (87.0%) | 26 (13.0%) |
| 55 to 64 Years | 316 (96.3%) | 12 (3.7%) |
| 65 to 74 Years | 529 (100.0%) | 0 (0.0%) |
| 75 Years and older | 380 (100.0%) | 0 (0.0%) |
| Total | 1,824 (96.1%) | 74 (3.9%) |
Health Insurance Coverage by Citizenship Status in Dennis
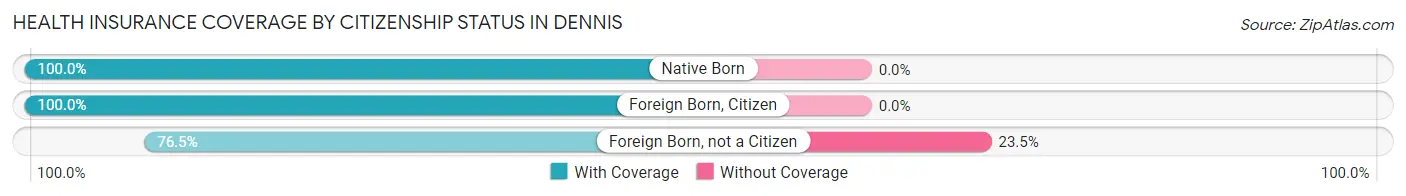
| Citizenship Status | With Coverage | Without Coverage |
| Native Born | 24 (100.0%) | 0 (0.0%) |
| Foreign Born, Citizen | 139 (100.0%) | 0 (0.0%) |
| Foreign Born, not a Citizen | 117 (76.5%) | 36 (23.5%) |
Health Insurance Coverage by Household Income in Dennis
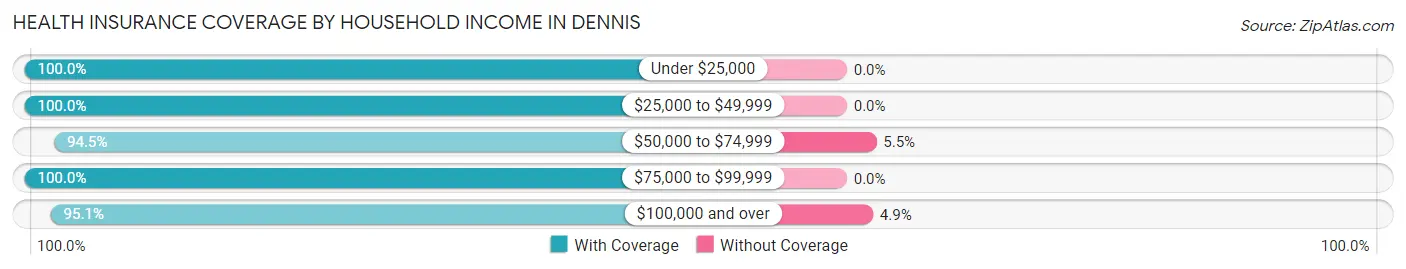
| Household Income | With Coverage | Without Coverage |
| Under $25,000 | 159 (100.0%) | 0 (0.0%) |
| $25,000 to $49,999 | 87 (100.0%) | 0 (0.0%) |
| $50,000 to $74,999 | 205 (94.5%) | 12 (5.5%) |
| $75,000 to $99,999 | 168 (100.0%) | 0 (0.0%) |
| $100,000 and over | 1,205 (95.1%) | 62 (4.9%) |
Public vs Private Health Insurance Coverage by Age in Dennis
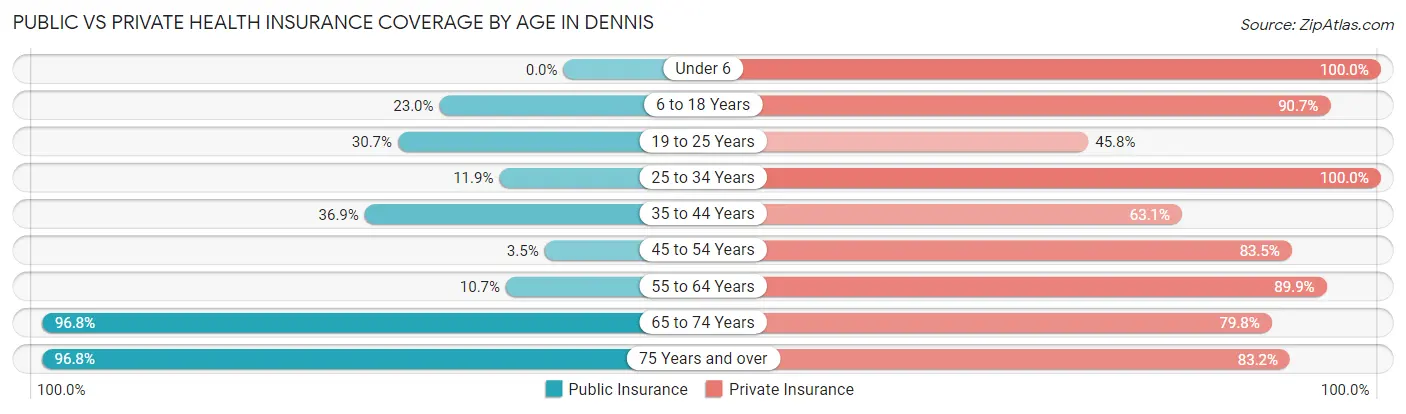
| Age Bracket | Public Insurance | Private Insurance |
| Under 6 | 0 (0.0%) | 24 (100.0%) |
| 6 to 18 Years | 32 (23.0%) | 126 (90.6%) |
| 19 to 25 Years | 47 (30.7%) | 70 (45.8%) |
| 25 to 34 Years | 5 (11.9%) | 42 (100.0%) |
| 35 to 44 Years | 38 (36.9%) | 65 (63.1%) |
| 45 to 54 Years | 7 (3.5%) | 167 (83.5%) |
| 55 to 64 Years | 35 (10.7%) | 295 (89.9%) |
| 65 to 74 Years | 512 (96.8%) | 422 (79.8%) |
| 75 Years and over | 368 (96.8%) | 316 (83.2%) |
| Total | 1,044 (55.0%) | 1,527 (80.4%) |
Disability Status by Sex by Age in Dennis
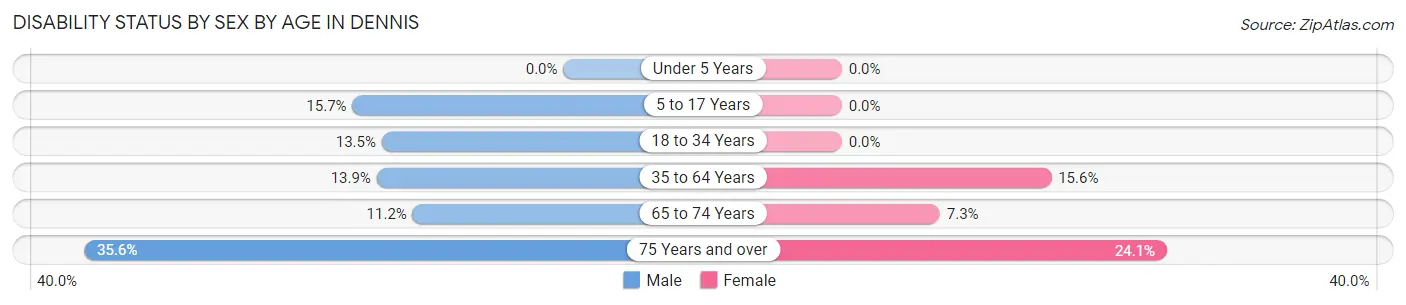
| Age Bracket | Male | Female |
| Under 5 Years | 0 (0.0%) | 0 (0.0%) |
| 5 to 17 Years | 13 (15.7%) | 0 (0.0%) |
| 18 to 34 Years | 12 (13.5%) | 0 (0.0%) |
| 35 to 64 Years | 42 (13.9%) | 51 (15.5%) |
| 65 to 74 Years | 30 (11.2%) | 19 (7.3%) |
| 75 Years and over | 63 (35.6%) | 49 (24.1%) |
Disability Class by Sex by Age in Dennis
Disability Class: Hearing Difficulty
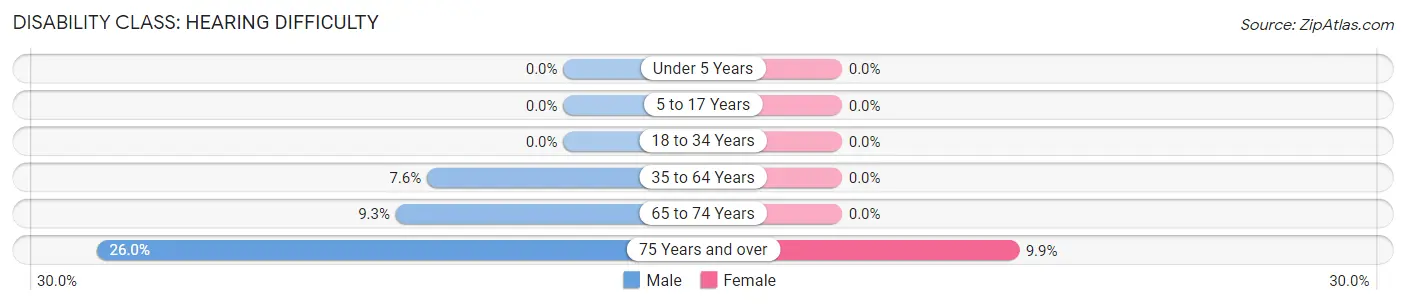
| Age Bracket | Male | Female |
| Under 5 Years | 0 (0.0%) | 0 (0.0%) |
| 5 to 17 Years | 0 (0.0%) | 0 (0.0%) |
| 18 to 34 Years | 0 (0.0%) | 0 (0.0%) |
| 35 to 64 Years | 23 (7.6%) | 0 (0.0%) |
| 65 to 74 Years | 25 (9.3%) | 0 (0.0%) |
| 75 Years and over | 46 (26.0%) | 20 (9.9%) |
Disability Class: Vision Difficulty
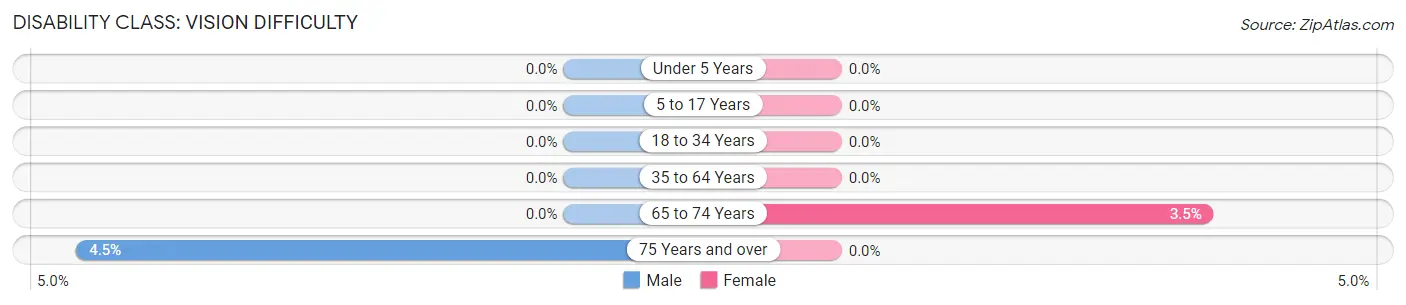
| Age Bracket | Male | Female |
| Under 5 Years | 0 (0.0%) | 0 (0.0%) |
| 5 to 17 Years | 0 (0.0%) | 0 (0.0%) |
| 18 to 34 Years | 0 (0.0%) | 0 (0.0%) |
| 35 to 64 Years | 0 (0.0%) | 0 (0.0%) |
| 65 to 74 Years | 0 (0.0%) | 9 (3.5%) |
| 75 Years and over | 8 (4.5%) | 0 (0.0%) |
Disability Class: Cognitive Difficulty
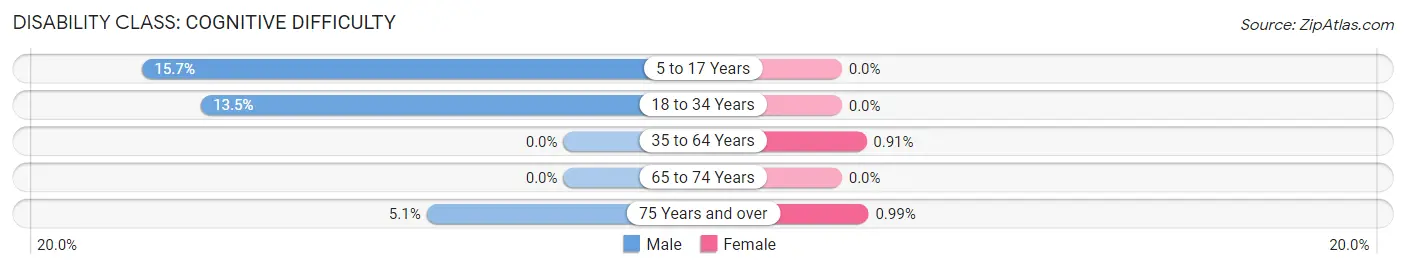
| Age Bracket | Male | Female |
| 5 to 17 Years | 13 (15.7%) | 0 (0.0%) |
| 18 to 34 Years | 12 (13.5%) | 0 (0.0%) |
| 35 to 64 Years | 0 (0.0%) | 3 (0.9%) |
| 65 to 74 Years | 0 (0.0%) | 0 (0.0%) |
| 75 Years and over | 9 (5.1%) | 2 (1.0%) |
Disability Class: Ambulatory Difficulty
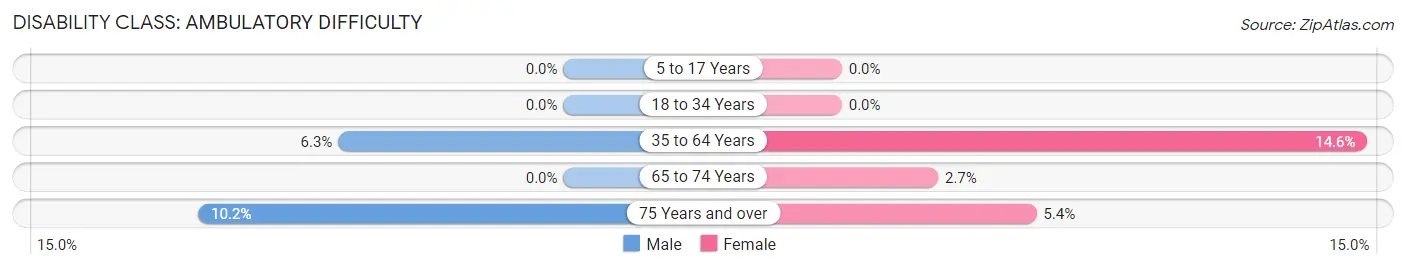
| Age Bracket | Male | Female |
| 5 to 17 Years | 0 (0.0%) | 0 (0.0%) |
| 18 to 34 Years | 0 (0.0%) | 0 (0.0%) |
| 35 to 64 Years | 19 (6.3%) | 48 (14.6%) |
| 65 to 74 Years | 0 (0.0%) | 7 (2.7%) |
| 75 Years and over | 18 (10.2%) | 11 (5.4%) |
Disability Class: Self-Care Difficulty
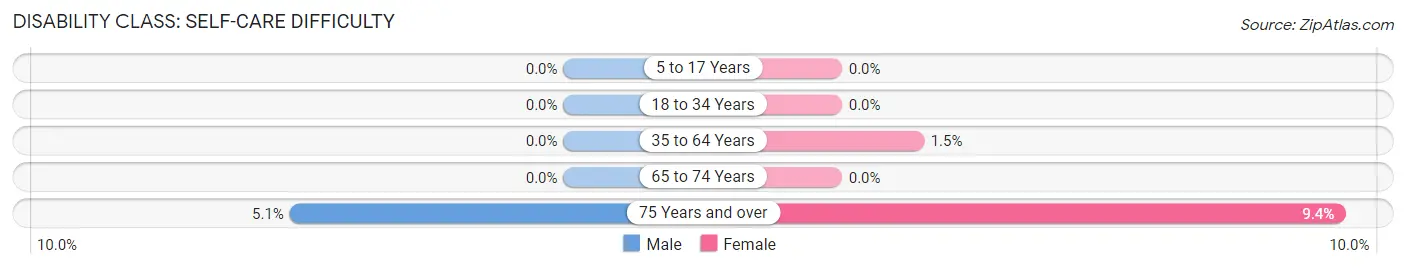
| Age Bracket | Male | Female |
| 5 to 17 Years | 0 (0.0%) | 0 (0.0%) |
| 18 to 34 Years | 0 (0.0%) | 0 (0.0%) |
| 35 to 64 Years | 0 (0.0%) | 5 (1.5%) |
| 65 to 74 Years | 0 (0.0%) | 0 (0.0%) |
| 75 Years and over | 9 (5.1%) | 19 (9.4%) |
Technology Access in Dennis
Computing Device Access in Dennis
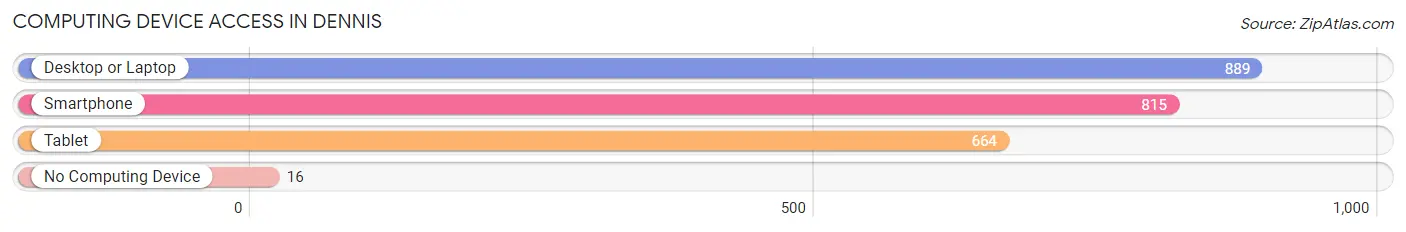
| Device Type | # Households | % Households |
| Desktop or Laptop | 889 | 90.2% |
| Smartphone | 815 | 82.7% |
| Tablet | 664 | 67.3% |
| No Computing Device | 16 | 1.6% |
| Total | 986 | 100.0% |
Internet Access in Dennis
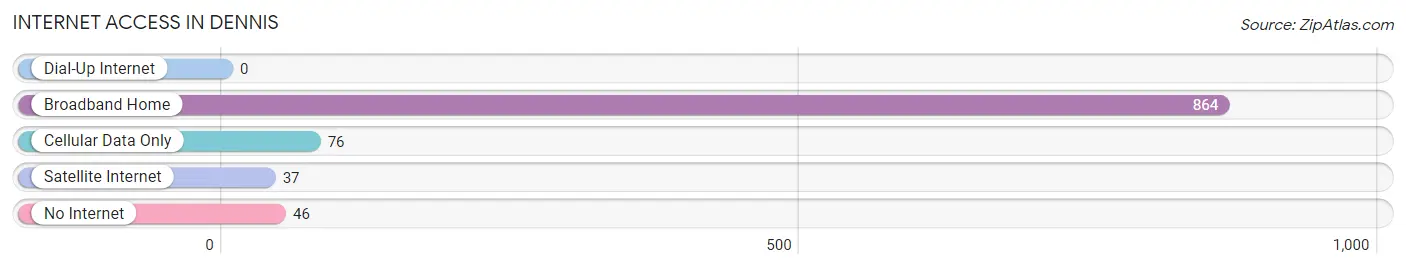
| Internet Type | # Households | % Households |
| Dial-Up Internet | 0 | 0.0% |
| Broadband Home | 864 | 87.6% |
| Cellular Data Only | 76 | 7.7% |
| Satellite Internet | 37 | 3.7% |
| No Internet | 46 | 4.7% |
| Total | 986 | 100.0% |
Dennis Summary
Dennis, Massachusetts is a town located in Barnstable County on Cape Cod. It is bordered by the towns of Brewster, Harwich, Yarmouth, and Barnstable. The town has a population of 14,207 as of the 2010 census.
History
The area that is now Dennis was originally inhabited by the Nauset tribe of Native Americans. The first European settlers arrived in the area in 1639, and the town was officially incorporated in 1793. The town was named after resident minister, Rev. Josiah Dennis.
In the 19th century, Dennis was a popular summer resort destination for wealthy Bostonians. The town was home to several large hotels, including the Dennis Hotel, which was built in 1845 and burned down in 1875.
Geography
Dennis is located on the eastern side of Cape Cod, and is bordered by the towns of Brewster, Harwich, Yarmouth, and Barnstable. The town has a total area of 28.2 square miles, of which 25.2 square miles is land and 3.0 square miles is water. The town is located on the Atlantic Ocean, and is home to several beaches, including Mayflower Beach, Corporation Beach, and Chapin Beach.
Economy
Dennis is a popular tourist destination, and the town’s economy is largely based on tourism. The town is home to several restaurants, hotels, and other businesses that cater to tourists. The town is also home to several cranberry bogs, and cranberry farming is an important part of the local economy.
Demographics
As of the 2010 census, there were 14,207 people, 6,072 households, and 4,072 families residing in the town. The population density was 564.2 people per square mile. The racial makeup of the town was 97.2% White, 0.7% African American, 0.3% Native American, 0.6% Asian, 0.1% Pacific Islander, 0.4% from other races, and 0.7% from two or more races. Hispanic or Latino of any race were 1.3% of the population.
The median income for a household in the town was $60,945, and the median income for a family was $71,917. The per capita income for the town was $31,945. About 4.2% of families and 6.2% of the population were below the poverty line, including 8.2% of those under age 18 and 4.2% of those age 65 or over.
Common Questions
What is Per Capita Income in Dennis?
Per Capita income in Dennis is $74,784.
What is the Median Family Income in Dennis?
Median Family Income in Dennis is $129,531.
What is the Median Household income in Dennis?
Median Household Income in Dennis is $113,526.
What is Income or Wage Gap in Dennis?
Income or Wage Gap in Dennis is 47.8%.
Women in Dennis earn 52.2 cents for every dollar earned by a man.
What is Inequality or Gini Index in Dennis?
Inequality or Gini Index in Dennis is 0.42.
What is the Total Population of Dennis?
Total Population of Dennis is 1,898.
What is the Total Male Population of Dennis?
Total Male Population of Dennis is 940.
What is the Total Female Population of Dennis?
Total Female Population of Dennis is 958.
What is the Ratio of Males per 100 Females in Dennis?
There are 98.12 Males per 100 Females in Dennis.
What is the Ratio of Females per 100 Males in Dennis?
There are 101.91 Females per 100 Males in Dennis.
What is the Median Population Age in Dennis?
Median Population Age in Dennis is 64.1 Years.
What is the Average Family Size in Dennis
Average Family Size in Dennis is 2.3 People.
What is the Average Household Size in Dennis
Average Household Size in Dennis is 1.9 People.
How Large is the Labor Force in Dennis?
There are 834 People in the Labor Forcein in Dennis.
What is the Percentage of People in the Labor Force in Dennis?
47.7% of People are in the Labor Force in Dennis.
What is the Unemployment Rate in Dennis?
Unemployment Rate in Dennis is 5.5%.