Turners Falls, MA Map & Demographics
Turners Falls Map
Turners Falls Overview
$38,156
PER CAPITA INCOME
$80,368
AVG FAMILY INCOME
$53,306
AVG HOUSEHOLD INCOME
25.8%
WAGE / INCOME GAP [ % ]
74.2¢/ $1
WAGE / INCOME GAP [ $ ]
0.44
INEQUALITY / GINI INDEX
3,838
TOTAL POPULATION
1,910
MALE POPULATION
1,928
FEMALE POPULATION
99.07
MALES / 100 FEMALES
100.94
FEMALES / 100 MALES
47.7
MEDIAN AGE
2.6
AVG FAMILY SIZE
2.0
AVG HOUSEHOLD SIZE
2,204
LABOR FORCE [ PEOPLE ]
66.7%
PERCENT IN LABOR FORCE
2.9%
UNEMPLOYMENT RATE
Turners Falls Zip Codes
Turners Falls Area Codes
Income in Turners Falls
Income Overview in Turners Falls
Per Capita Income in Turners Falls is $38,156, while median incomes of families and households are $80,368 and $53,306 respectively.
| Characteristic | Number | Measure |
| Per Capita Income | 3,838 | $38,156 |
| Median Family Income | 989 | $80,368 |
| Mean Family Income | 989 | $88,650 |
| Median Household Income | 1,947 | $53,306 |
| Mean Household Income | 1,947 | $73,298 |
| Income Deficit | 989 | $0 |
| Wage / Income Gap (%) | 3,838 | 25.83% |
| Wage / Income Gap ($) | 3,838 | 74.17¢ per $1 |
| Gini / Inequality Index | 3,838 | 0.44 |
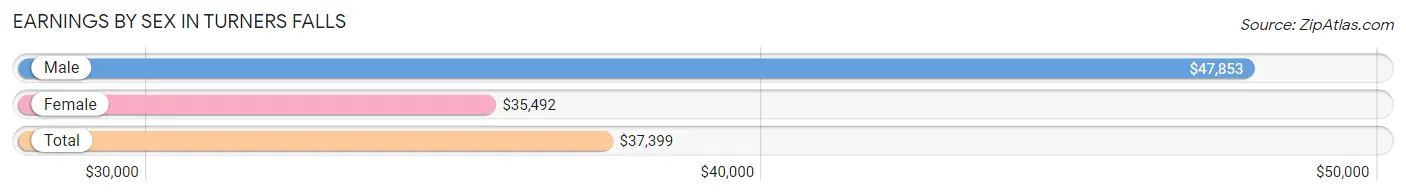
Earnings by Sex in Turners Falls
Average Earnings in Turners Falls are $37,399, $47,853 for men and $35,492 for women, a difference of 25.8%.
| Sex | Number | Average Earnings |
| Male | 1,199 (51.7%) | $47,853 |
| Female | 1,120 (48.3%) | $35,492 |
| Total | 2,319 (100.0%) | $37,399 |
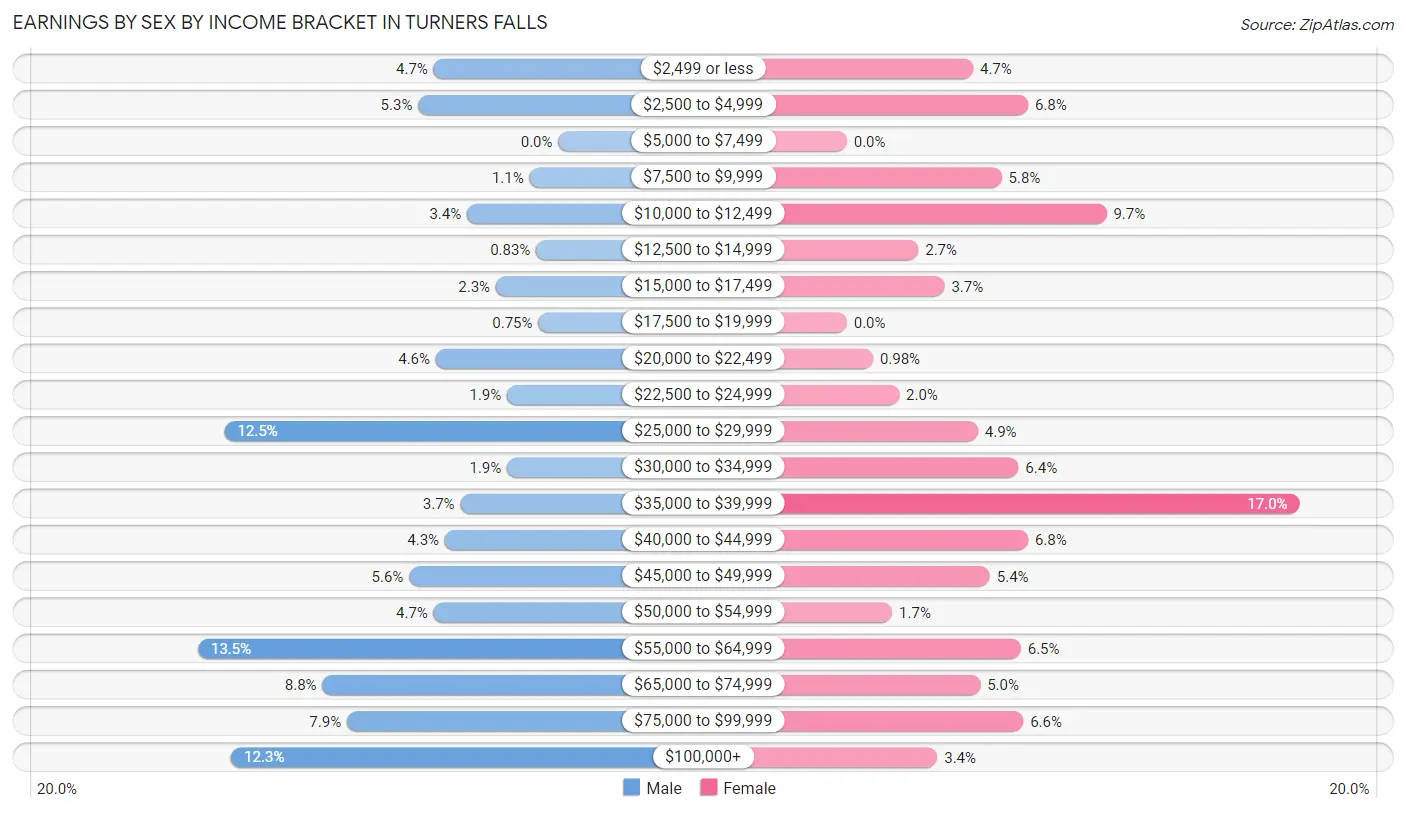
Earnings by Sex by Income Bracket in Turners Falls
The most common earnings brackets in Turners Falls are $55,000 to $64,999 for men (162 | 13.5%) and $35,000 to $39,999 for women (190 | 17.0%).
| Income | Male | Female |
| $2,499 or less | 56 (4.7%) | 53 (4.7%) |
| $2,500 to $4,999 | 63 (5.2%) | 76 (6.8%) |
| $5,000 to $7,499 | 0 (0.0%) | 0 (0.0%) |
| $7,500 to $9,999 | 13 (1.1%) | 65 (5.8%) |
| $10,000 to $12,499 | 41 (3.4%) | 109 (9.7%) |
| $12,500 to $14,999 | 10 (0.8%) | 30 (2.7%) |
| $15,000 to $17,499 | 28 (2.3%) | 41 (3.7%) |
| $17,500 to $19,999 | 9 (0.7%) | 0 (0.0%) |
| $20,000 to $22,499 | 55 (4.6%) | 11 (1.0%) |
| $22,500 to $24,999 | 23 (1.9%) | 22 (2.0%) |
| $25,000 to $29,999 | 150 (12.5%) | 55 (4.9%) |
| $30,000 to $34,999 | 23 (1.9%) | 72 (6.4%) |
| $35,000 to $39,999 | 44 (3.7%) | 190 (17.0%) |
| $40,000 to $44,999 | 51 (4.3%) | 76 (6.8%) |
| $45,000 to $49,999 | 67 (5.6%) | 60 (5.4%) |
| $50,000 to $54,999 | 56 (4.7%) | 19 (1.7%) |
| $55,000 to $64,999 | 162 (13.5%) | 73 (6.5%) |
| $65,000 to $74,999 | 106 (8.8%) | 56 (5.0%) |
| $75,000 to $99,999 | 95 (7.9%) | 74 (6.6%) |
| $100,000+ | 147 (12.3%) | 38 (3.4%) |
| Total | 1,199 (100.0%) | 1,120 (100.0%) |
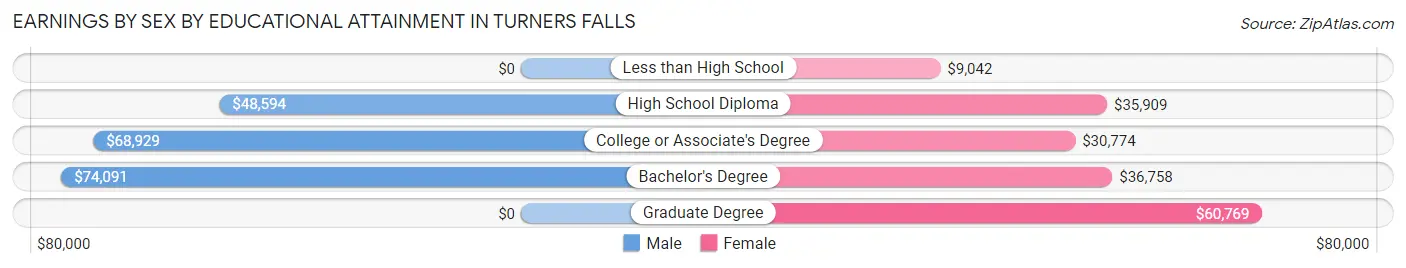
Earnings by Sex by Educational Attainment in Turners Falls
Average earnings in Turners Falls are $49,295 for men and $36,363 for women, a difference of 26.2%. Men with an educational attainment of bachelor's degree enjoy the highest average annual earnings of $74,091, while those with high school diploma education earn the least with $48,594. Women with an educational attainment of graduate degree earn the most with the average annual earnings of $60,769, while those with less than high school education have the smallest earnings of $9,042.
| Educational Attainment | Male Income | Female Income |
| Less than High School | - | - |
| High School Diploma | $48,594 | $35,909 |
| College or Associate's Degree | $68,929 | $30,774 |
| Bachelor's Degree | $74,091 | $36,758 |
| Graduate Degree | - | - |
| Total | $49,295 | $36,363 |
Family Income in Turners Falls
Family Income Brackets in Turners Falls
According to the Turners Falls family income data, there are 229 families falling into the $100,000 to $149,999 income range, which is the most common income bracket and makes up 23.2% of all families. Conversely, the less than $10,000 income bracket is the least frequent group with only 17 families (1.7%) belonging to this category.
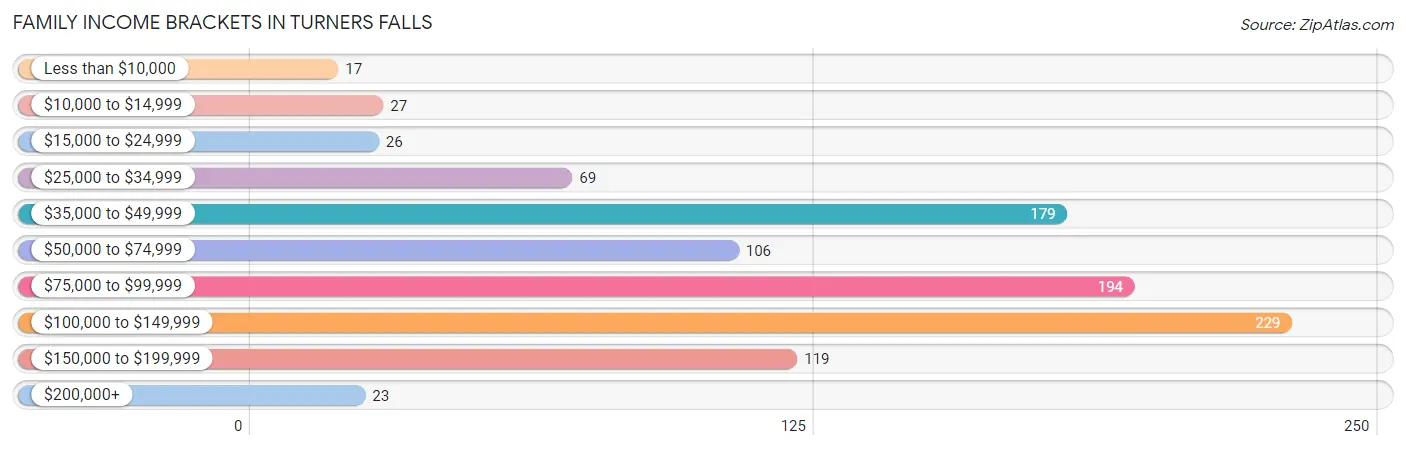
| Income Bracket | # Families | % Families |
| Less than $10,000 | 17 | 1.7% |
| $10,000 to $14,999 | 27 | 2.7% |
| $15,000 to $24,999 | 26 | 2.6% |
| $25,000 to $34,999 | 69 | 7.0% |
| $35,000 to $49,999 | 179 | 18.1% |
| $50,000 to $74,999 | 106 | 10.7% |
| $75,000 to $99,999 | 194 | 19.6% |
| $100,000 to $149,999 | 229 | 23.2% |
| $150,000 to $199,999 | 119 | 12.0% |
| $200,000+ | 23 | 2.3% |
Family Income by Famaliy Size in Turners Falls
3-person families (252 | 25.5%) account for the highest median family income in Turners Falls with $125,523 per family, while 3-person families (252 | 25.5%) have the highest median income of $41,841 per family member.
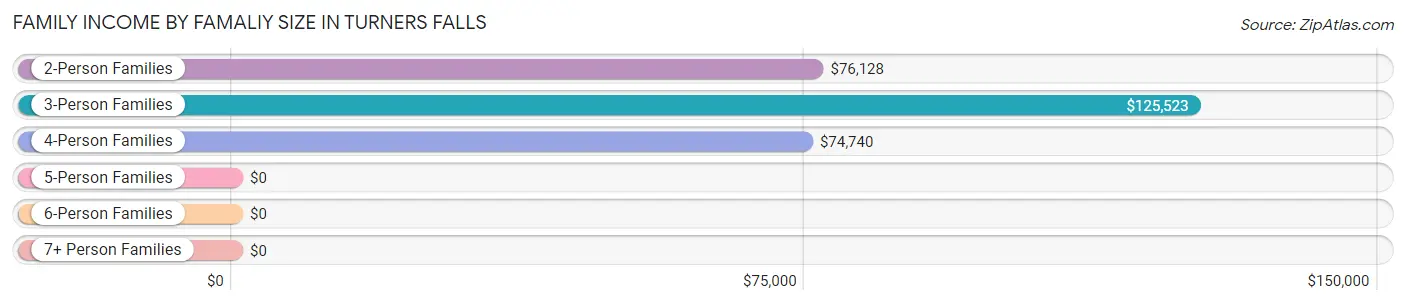
| Income Bracket | # Families | Median Income |
| 2-Person Families | 581 (58.8%) | $76,128 |
| 3-Person Families | 252 (25.5%) | $125,523 |
| 4-Person Families | 137 (13.9%) | $74,740 |
| 5-Person Families | 19 (1.9%) | $0 |
| 6-Person Families | 0 (0.0%) | $0 |
| 7+ Person Families | 0 (0.0%) | $0 |
| Total | 989 (100.0%) | $80,368 |
Family Income by Number of Earners in Turners Falls
The median family income in Turners Falls is $80,368, with families comprising 3+ earners (122) having the highest median family income of $126,105, while families with 1 earner (300) have the lowest median family income of $40,929, accounting for 12.3% and 30.3% of families, respectively.
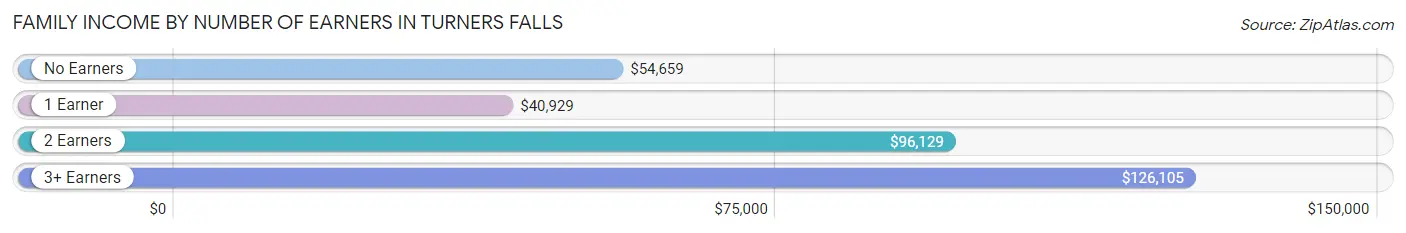
| Number of Earners | # Families | Median Income |
| No Earners | 177 (17.9%) | $54,659 |
| 1 Earner | 300 (30.3%) | $40,929 |
| 2 Earners | 390 (39.4%) | $96,129 |
| 3+ Earners | 122 (12.3%) | $126,105 |
| Total | 989 (100.0%) | $80,368 |
Household Income in Turners Falls
Household Income Brackets in Turners Falls
With 308 households falling in the category, the $100,000 to $149,999 income range is the most frequent in Turners Falls, accounting for 15.8% of all households. In contrast, only 56 households (2.9%) fall into the less than $10,000 income bracket, making it the least populous group.
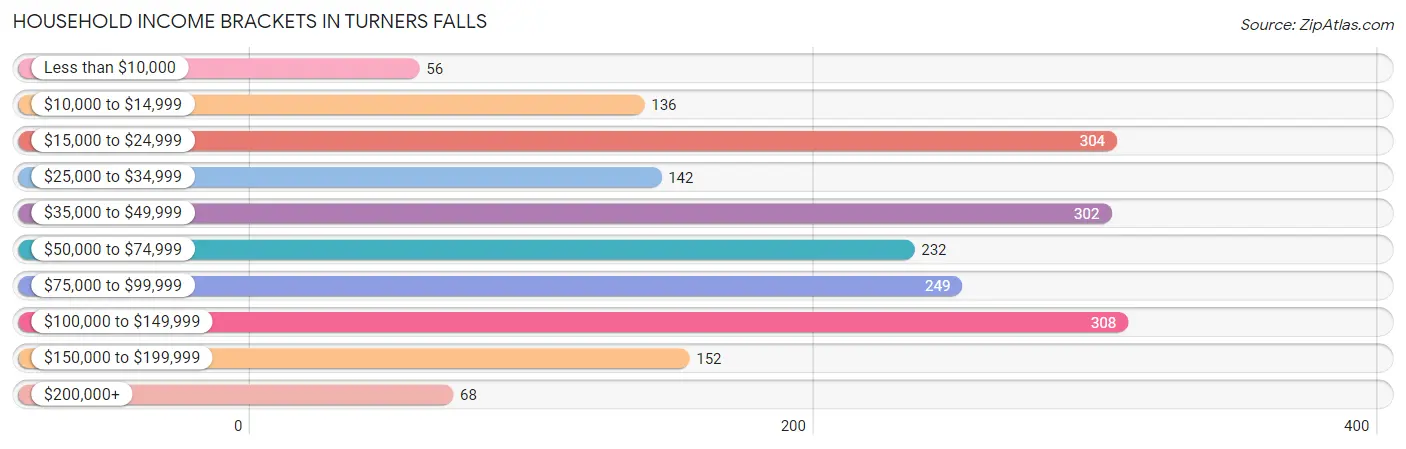
| Income Bracket | # Households | % Households |
| Less than $10,000 | 56 | 2.9% |
| $10,000 to $14,999 | 136 | 7.0% |
| $15,000 to $24,999 | 304 | 15.6% |
| $25,000 to $34,999 | 142 | 7.3% |
| $35,000 to $49,999 | 302 | 15.5% |
| $50,000 to $74,999 | 232 | 11.9% |
| $75,000 to $99,999 | 249 | 12.8% |
| $100,000 to $149,999 | 308 | 15.8% |
| $150,000 to $199,999 | 152 | 7.8% |
| $200,000+ | 68 | 3.5% |
Household Income by Householder Age in Turners Falls
The median household income in Turners Falls is $53,306, with the highest median household income of $76,302 found in the 45 to 64 years age bracket for the primary householder. A total of 693 households (35.6%) fall into this category. Meanwhile, the 15 to 24 years age bracket for the primary householder has the lowest median household income of $0, with 90 households (4.6%) in this group.
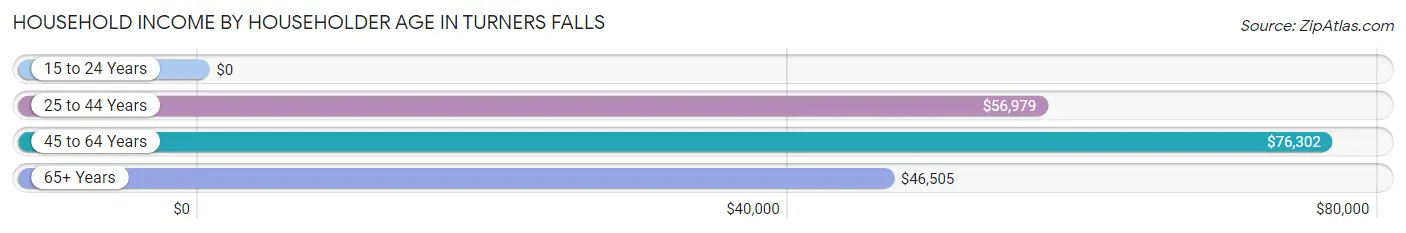
| Income Bracket | # Households | Median Income |
| 15 to 24 Years | 90 (4.6%) | $0 |
| 25 to 44 Years | 463 (23.8%) | $56,979 |
| 45 to 64 Years | 693 (35.6%) | $76,302 |
| 65+ Years | 701 (36.0%) | $46,505 |
| Total | 1,947 (100.0%) | $53,306 |
Poverty in Turners Falls
Income Below Poverty by Sex and Age in Turners Falls
With 7.2% poverty level for males and 10.1% for females among the residents of Turners Falls, 5 year old males and 25 to 34 year old females are the most vulnerable to poverty, with 27 males (71.1%) and 72 females (27.6%) in their respective age groups living below the poverty level.
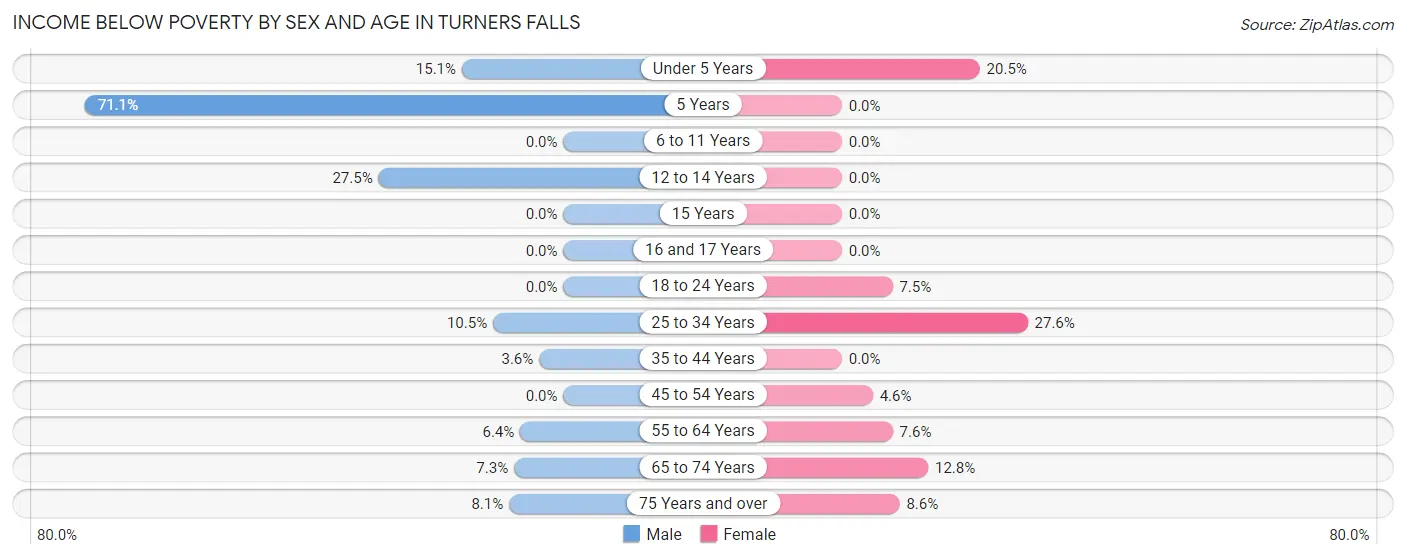
| Age Bracket | Male | Female |
| Under 5 Years | 11 (15.1%) | 26 (20.5%) |
| 5 Years | 27 (71.1%) | 0 (0.0%) |
| 6 to 11 Years | 0 (0.0%) | 0 (0.0%) |
| 12 to 14 Years | 14 (27.5%) | 0 (0.0%) |
| 15 Years | 0 (0.0%) | 0 (0.0%) |
| 16 and 17 Years | 0 (0.0%) | 0 (0.0%) |
| 18 to 24 Years | 0 (0.0%) | 10 (7.5%) |
| 25 to 34 Years | 21 (10.4%) | 72 (27.6%) |
| 35 to 44 Years | 10 (3.6%) | 0 (0.0%) |
| 45 to 54 Years | 0 (0.0%) | 14 (4.6%) |
| 55 to 64 Years | 24 (6.4%) | 20 (7.5%) |
| 65 to 74 Years | 20 (7.3%) | 31 (12.8%) |
| 75 Years and over | 10 (8.1%) | 21 (8.6%) |
| Total | 137 (7.2%) | 194 (10.1%) |
Income Above Poverty by Sex and Age in Turners Falls
According to the poverty statistics in Turners Falls, males aged 6 to 11 years and females aged 5 years are the age groups that are most secure financially, with 100.0% of males and 100.0% of females in these age groups living above the poverty line.
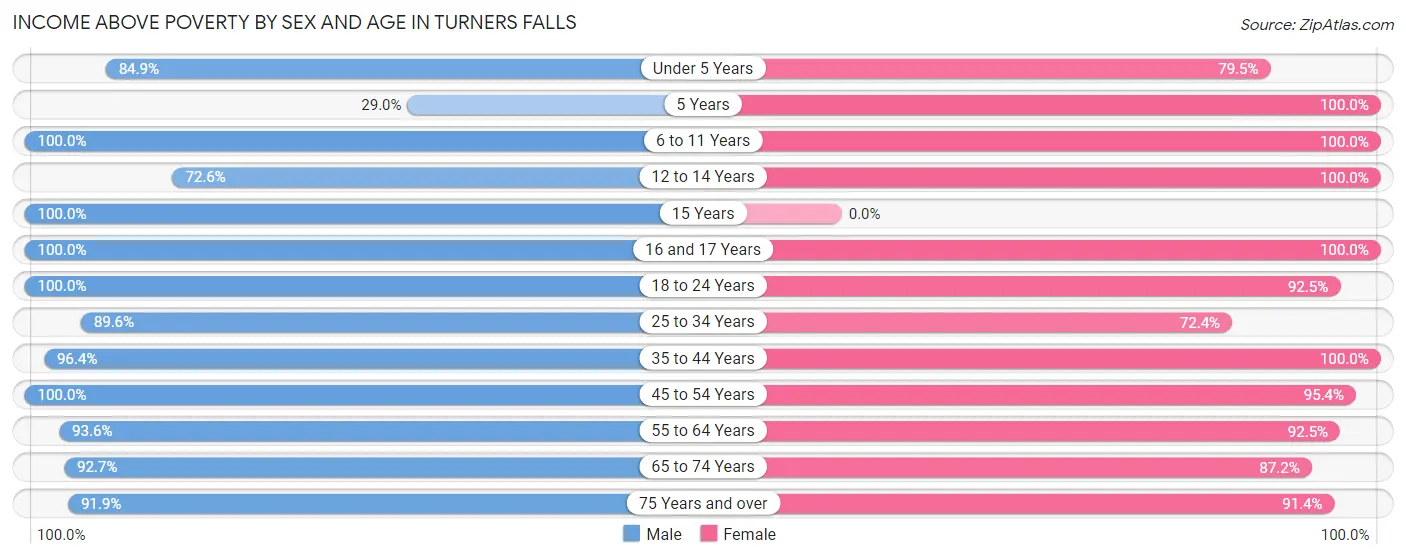
| Age Bracket | Male | Female |
| Under 5 Years | 62 (84.9%) | 101 (79.5%) |
| 5 Years | 11 (28.9%) | 9 (100.0%) |
| 6 to 11 Years | 56 (100.0%) | 101 (100.0%) |
| 12 to 14 Years | 37 (72.6%) | 29 (100.0%) |
| 15 Years | 49 (100.0%) | 0 (0.0%) |
| 16 and 17 Years | 23 (100.0%) | 13 (100.0%) |
| 18 to 24 Years | 147 (100.0%) | 123 (92.5%) |
| 25 to 34 Years | 180 (89.5%) | 189 (72.4%) |
| 35 to 44 Years | 268 (96.4%) | 198 (100.0%) |
| 45 to 54 Years | 223 (100.0%) | 291 (95.4%) |
| 55 to 64 Years | 350 (93.6%) | 245 (92.4%) |
| 65 to 74 Years | 253 (92.7%) | 211 (87.2%) |
| 75 Years and over | 114 (91.9%) | 224 (91.4%) |
| Total | 1,773 (92.8%) | 1,734 (89.9%) |
Income Below Poverty Among Married-Couple Families in Turners Falls
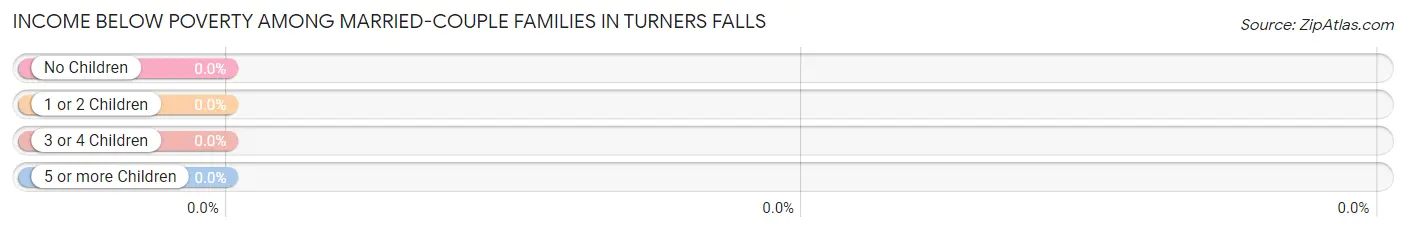
| Children | Above Poverty | Below Poverty |
| No Children | 457 (100.0%) | 0 (0.0%) |
| 1 or 2 Children | 206 (100.0%) | 0 (0.0%) |
| 3 or 4 Children | 0 (0.0%) | 0 (0.0%) |
| 5 or more Children | 0 (0.0%) | 0 (0.0%) |
| Total | 663 (100.0%) | 0 (0.0%) |
Income Below Poverty Among Single-Parent Households in Turners Falls
According to the poverty data in Turners Falls, 19.8% or 18 single-father households and 18.7% or 44 single-mother households are living below the poverty line. Among single-father households, those with 1 or 2 children have the highest poverty rate, with 18 households (36.0%) experiencing poverty. Likewise, among single-mother households, those with 1 or 2 children have the highest poverty rate, with 44 households (34.4%) falling below the poverty line.
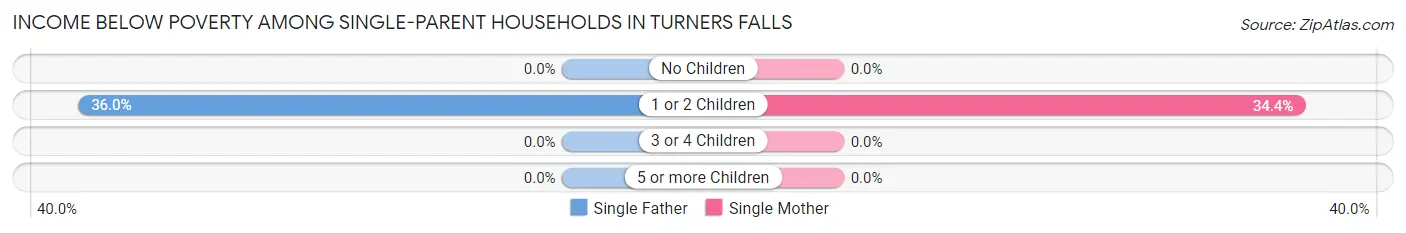
| Children | Single Father | Single Mother |
| No Children | 0 (0.0%) | 0 (0.0%) |
| 1 or 2 Children | 18 (36.0%) | 44 (34.4%) |
| 3 or 4 Children | 0 (0.0%) | 0 (0.0%) |
| 5 or more Children | 0 (0.0%) | 0 (0.0%) |
| Total | 18 (19.8%) | 44 (18.7%) |
Income Below Poverty Among Married-Couple vs Single-Parent Households in Turners Falls
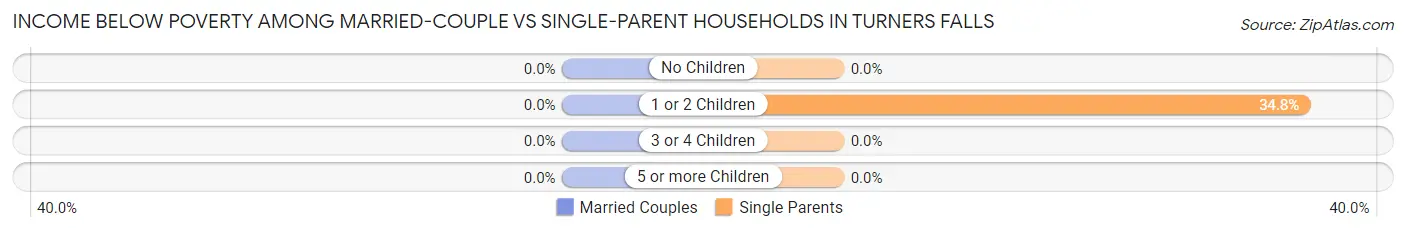
| Children | Married-Couple Families | Single-Parent Households |
| No Children | 0 (0.0%) | 0 (0.0%) |
| 1 or 2 Children | 0 (0.0%) | 62 (34.8%) |
| 3 or 4 Children | 0 (0.0%) | 0 (0.0%) |
| 5 or more Children | 0 (0.0%) | 0 (0.0%) |
| Total | 0 (0.0%) | 62 (19.0%) |
Race in Turners Falls
The most populous races in Turners Falls are White / Caucasian (3,462 | 90.2%), Two or more Races (188 | 4.9%), and Hispanic or Latino (185 | 4.8%).
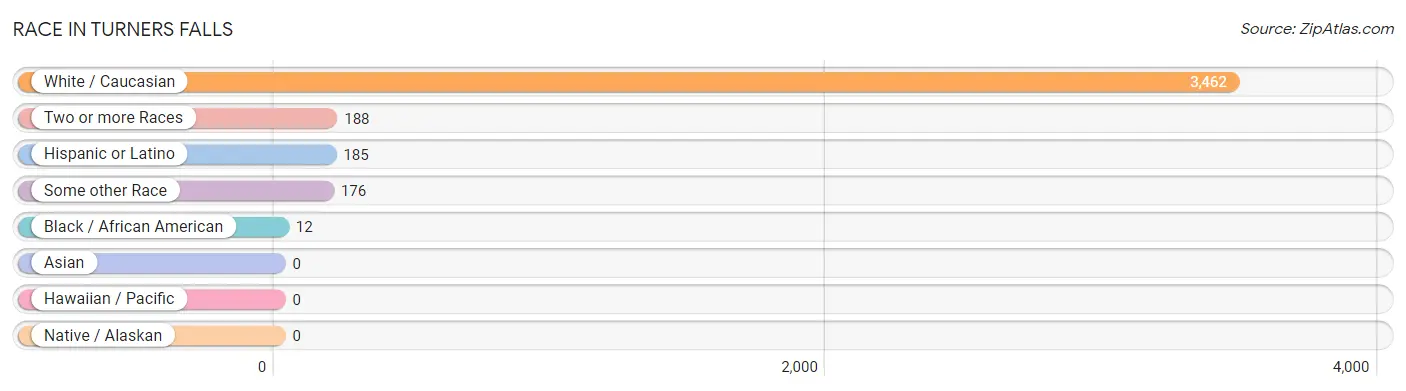
| Race | # Population | % Population |
| Asian | 0 | 0.0% |
| Black / African American | 12 | 0.3% |
| Hawaiian / Pacific | 0 | 0.0% |
| Hispanic or Latino | 185 | 4.8% |
| Native / Alaskan | 0 | 0.0% |
| White / Caucasian | 3,462 | 90.2% |
| Two or more Races | 188 | 4.9% |
| Some other Race | 176 | 4.6% |
| Total | 3,838 | 100.0% |
Ancestry in Turners Falls
The most populous ancestries reported in Turners Falls are Irish (689 | 17.9%), English (615 | 16.0%), Polish (513 | 13.4%), French (397 | 10.3%), and German (337 | 8.8%), together accounting for 66.5% of all Turners Falls residents.
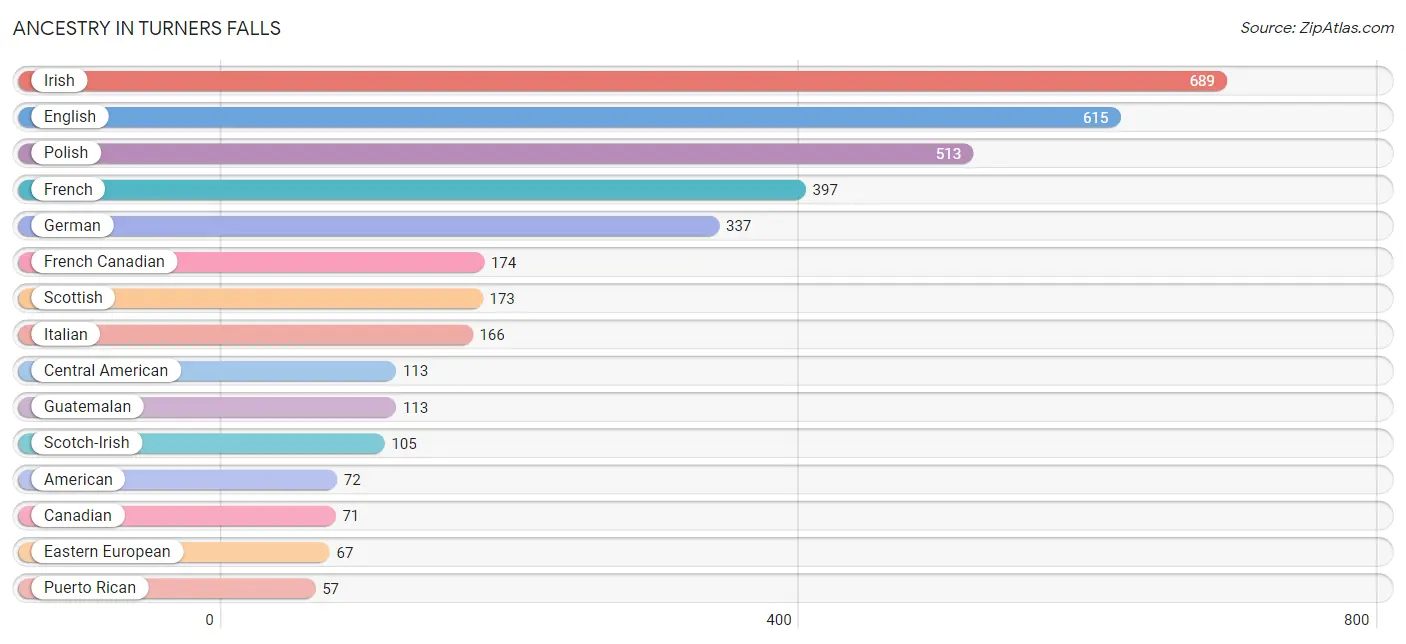
| Ancestry | # Population | % Population |
| American | 72 | 1.9% |
| Brazilian | 23 | 0.6% |
| British | 28 | 0.7% |
| Canadian | 71 | 1.8% |
| Celtic | 13 | 0.3% |
| Central American | 113 | 2.9% |
| Croatian | 9 | 0.2% |
| Czech | 24 | 0.6% |
| Dutch | 11 | 0.3% |
| Eastern European | 67 | 1.8% |
| English | 615 | 16.0% |
| European | 10 | 0.3% |
| French | 397 | 10.3% |
| French Canadian | 174 | 4.5% |
| German | 337 | 8.8% |
| Greek | 42 | 1.1% |
| Guatemalan | 113 | 2.9% |
| Iranian | 9 | 0.2% |
| Irish | 689 | 17.9% |
| Italian | 166 | 4.3% |
| Korean | 24 | 0.6% |
| Latvian | 7 | 0.2% |
| Maltese | 10 | 0.3% |
| Mexican | 9 | 0.2% |
| Northern European | 11 | 0.3% |
| Polish | 513 | 13.4% |
| Portuguese | 41 | 1.1% |
| Puerto Rican | 57 | 1.5% |
| Scotch-Irish | 105 | 2.7% |
| Scottish | 173 | 4.5% |
| Swedish | 18 | 0.5% |
| Ukrainian | 8 | 0.2% |
| Welsh | 37 | 1.0% | View All 33 Rows |
Immigrants in Turners Falls
The most numerous immigrant groups reported in Turners Falls came from Latin America (99 | 2.6%), Central America (73 | 1.9%), Guatemala (73 | 1.9%), Europe (28 | 0.7%), and Brazil (26 | 0.7%), together accounting for 7.8% of all Turners Falls residents.
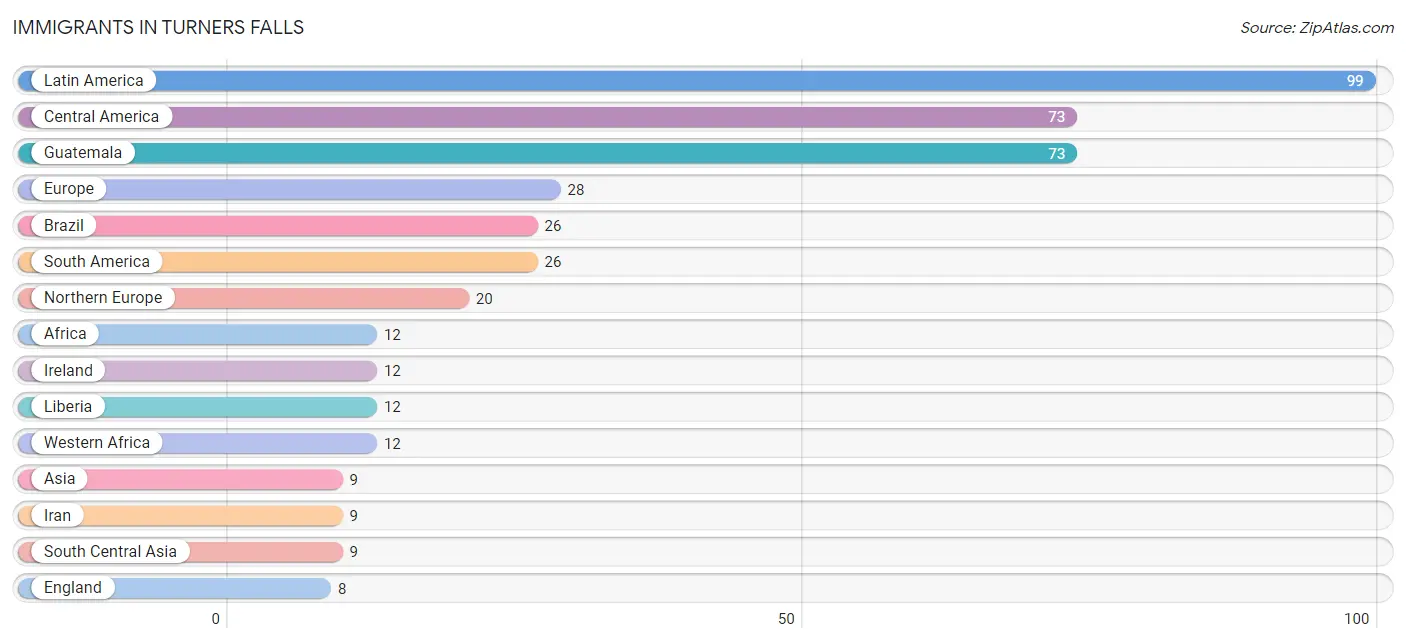
| Immigration Origin | # Population | % Population |
| Africa | 12 | 0.3% |
| Asia | 9 | 0.2% |
| Brazil | 26 | 0.7% |
| Central America | 73 | 1.9% |
| England | 8 | 0.2% |
| Europe | 28 | 0.7% |
| Germany | 8 | 0.2% |
| Guatemala | 73 | 1.9% |
| Iran | 9 | 0.2% |
| Ireland | 12 | 0.3% |
| Latin America | 99 | 2.6% |
| Liberia | 12 | 0.3% |
| Northern Europe | 20 | 0.5% |
| South America | 26 | 0.7% |
| South Central Asia | 9 | 0.2% |
| Western Africa | 12 | 0.3% |
| Western Europe | 8 | 0.2% | View All 17 Rows |
Sex and Age in Turners Falls
Sex and Age in Turners Falls
The most populous age groups in Turners Falls are 60 to 64 Years (230 | 12.0%) for men and 60 to 64 Years (177 | 9.2%) for women.
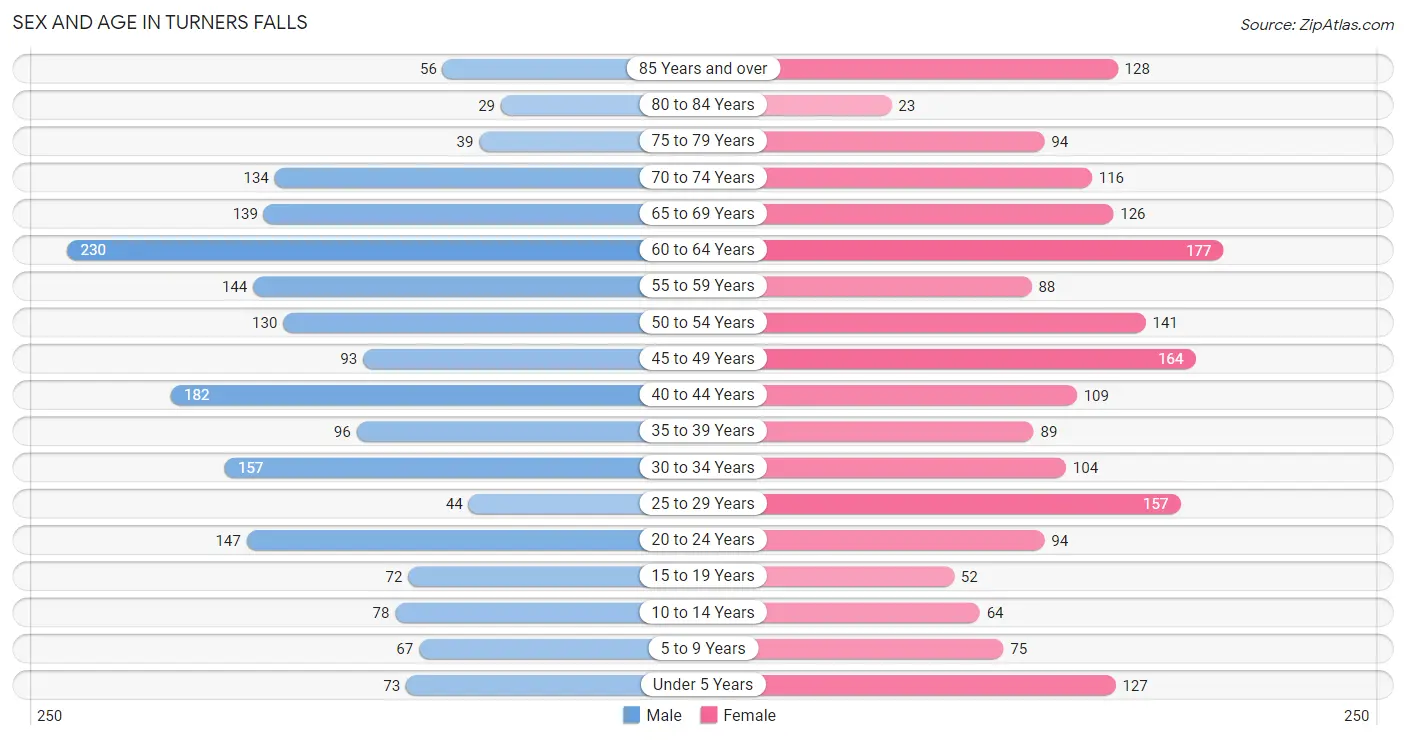
| Age Bracket | Male | Female |
| Under 5 Years | 73 (3.8%) | 127 (6.6%) |
| 5 to 9 Years | 67 (3.5%) | 75 (3.9%) |
| 10 to 14 Years | 78 (4.1%) | 64 (3.3%) |
| 15 to 19 Years | 72 (3.8%) | 52 (2.7%) |
| 20 to 24 Years | 147 (7.7%) | 94 (4.9%) |
| 25 to 29 Years | 44 (2.3%) | 157 (8.1%) |
| 30 to 34 Years | 157 (8.2%) | 104 (5.4%) |
| 35 to 39 Years | 96 (5.0%) | 89 (4.6%) |
| 40 to 44 Years | 182 (9.5%) | 109 (5.7%) |
| 45 to 49 Years | 93 (4.9%) | 164 (8.5%) |
| 50 to 54 Years | 130 (6.8%) | 141 (7.3%) |
| 55 to 59 Years | 144 (7.5%) | 88 (4.6%) |
| 60 to 64 Years | 230 (12.0%) | 177 (9.2%) |
| 65 to 69 Years | 139 (7.3%) | 126 (6.5%) |
| 70 to 74 Years | 134 (7.0%) | 116 (6.0%) |
| 75 to 79 Years | 39 (2.0%) | 94 (4.9%) |
| 80 to 84 Years | 29 (1.5%) | 23 (1.2%) |
| 85 Years and over | 56 (2.9%) | 128 (6.6%) |
| Total | 1,910 (100.0%) | 1,928 (100.0%) |
Families and Households in Turners Falls
Median Family Size in Turners Falls
The median family size in Turners Falls is 2.62 persons per family, with single male/father families (91 | 9.2%) accounting for the largest median family size of 2.75 persons per family. On the other hand, single female/mother families (235 | 23.8%) represent the smallest median family size with 2.49 persons per family.
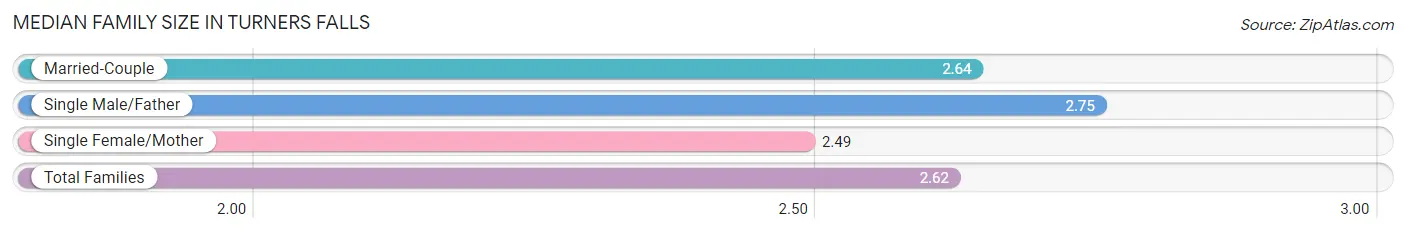
| Family Type | # Families | Family Size |
| Married-Couple | 663 (67.0%) | 2.64 |
| Single Male/Father | 91 (9.2%) | 2.75 |
| Single Female/Mother | 235 (23.8%) | 2.49 |
| Total Families | 989 (100.0%) | 2.62 |
Median Household Size in Turners Falls
The median household size in Turners Falls is 1.97 persons per household, with single female/mother households (235 | 12.1%) accounting for the largest median household size of 3.11 persons per household. non-family households (958 | 49.2%) represent the smallest median household size with 1.11 persons per household.
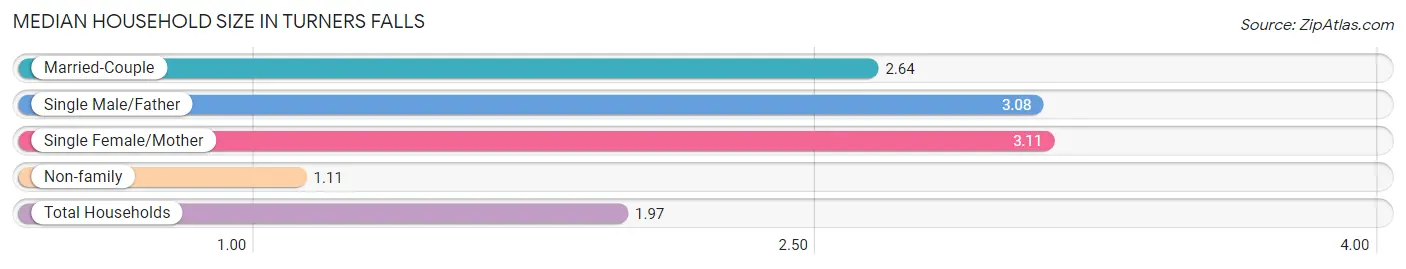
| Household Type | # Households | Household Size |
| Married-Couple | 663 (34.1%) | 2.64 |
| Single Male/Father | 91 (4.7%) | 3.08 |
| Single Female/Mother | 235 (12.1%) | 3.11 |
| Non-family | 958 (49.2%) | 1.11 |
| Total Households | 1,947 (100.0%) | 1.97 |
Household Size by Marriage Status in Turners Falls
Out of a total of 1,947 households in Turners Falls, 989 (50.8%) are family households, while 958 (49.2%) are nonfamily households. The most numerous type of family households are 2-person households, comprising 541, and the most common type of nonfamily households are 1-person households, comprising 848.
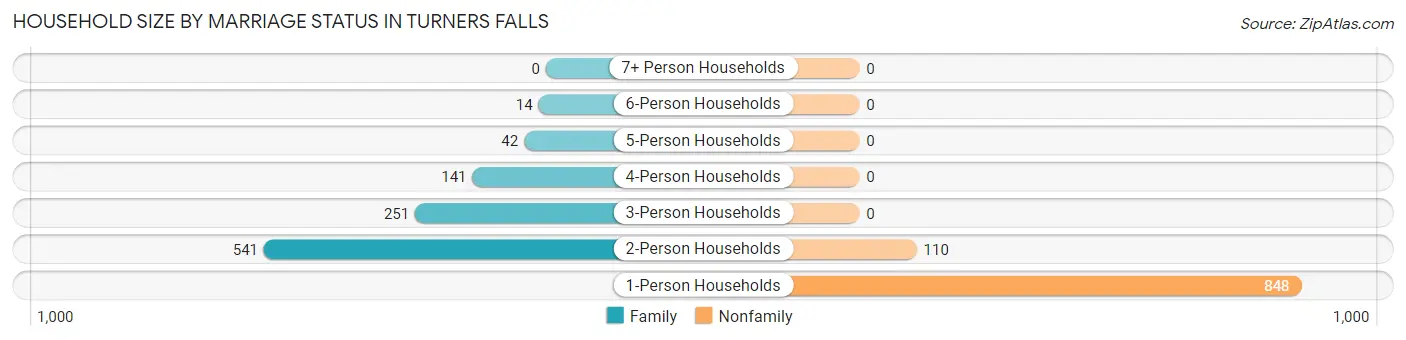
| Household Size | Family Households | Nonfamily Households |
| 1-Person Households | - | 848 (43.5%) |
| 2-Person Households | 541 (27.8%) | 110 (5.7%) |
| 3-Person Households | 251 (12.9%) | 0 (0.0%) |
| 4-Person Households | 141 (7.2%) | 0 (0.0%) |
| 5-Person Households | 42 (2.2%) | 0 (0.0%) |
| 6-Person Households | 14 (0.7%) | 0 (0.0%) |
| 7+ Person Households | 0 (0.0%) | 0 (0.0%) |
| Total | 989 (50.8%) | 958 (49.2%) |
Female Fertility in Turners Falls
Fertility by Age in Turners Falls
Average fertility rate in Turners Falls is 50.0 births per 1,000 women. Women in the age bracket of 35 to 50 years have the highest fertility rate with 59.0 births per 1,000 women. Women in the age bracket of 35 to 50 years acount for 56.4% of all women with births.
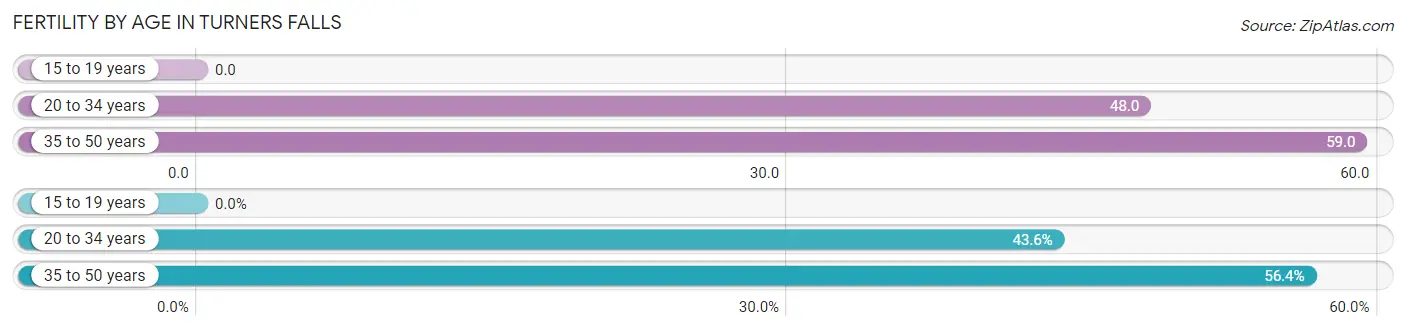
| Age Bracket | Women with Births | Births / 1,000 Women |
| 15 to 19 years | 0 (0.0%) | 0.0 |
| 20 to 34 years | 17 (43.6%) | 48.0 |
| 35 to 50 years | 22 (56.4%) | 59.0 |
| Total | 39 (100.0%) | 50.0 |
Fertility by Age by Marriage Status in Turners Falls
43.6% of women with births (39) in Turners Falls are married. The highest percentage of unmarried women with births falls into 20 to 34 years age bracket with 58.8% of them unmarried at the time of birth, while the lowest percentage of unmarried women with births belong to 35 to 50 years age bracket with 54.5% of them unmarried.
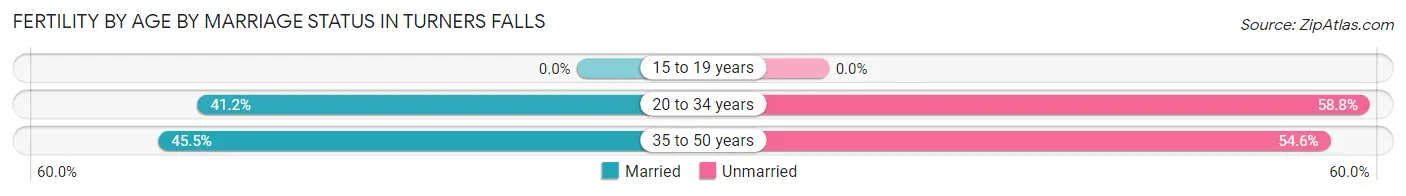
| Age Bracket | Married | Unmarried |
| 15 to 19 years | 0 (0.0%) | 0 (0.0%) |
| 20 to 34 years | 7 (41.2%) | 10 (58.8%) |
| 35 to 50 years | 10 (45.5%) | 12 (54.5%) |
| Total | 17 (43.6%) | 22 (56.4%) |
Fertility by Education in Turners Falls
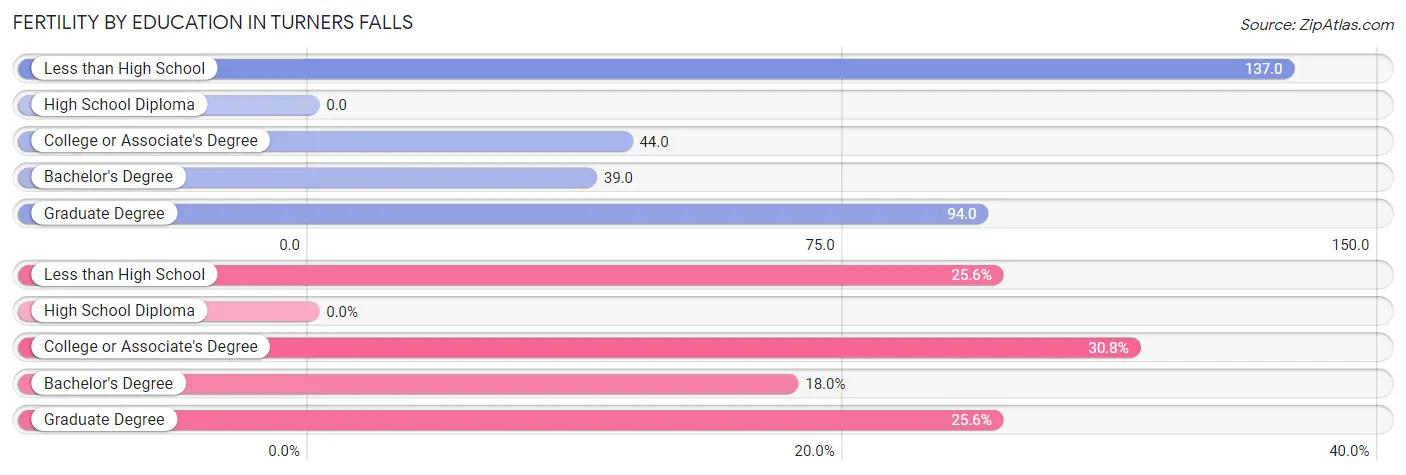
| Educational Attainment | Women with Births | Births / 1,000 Women |
| Less than High School | 10 (25.6%) | 137.0 |
| High School Diploma | 0 (0.0%) | 0.0 |
| College or Associate's Degree | 12 (30.8%) | 44.0 |
| Bachelor's Degree | 7 (17.9%) | 39.0 |
| Graduate Degree | 10 (25.6%) | 94.0 |
| Total | 39 (100.0%) | 50.0 |
Fertility by Education by Marriage Status in Turners Falls
56.4% of women with births in Turners Falls are unmarried. Women with the educational attainment of bachelor's degree are most likely to be married with 100.0% of them married at childbirth, while women with the educational attainment of less than high school are least likely to be married with 100.0% of them unmarried at childbirth.
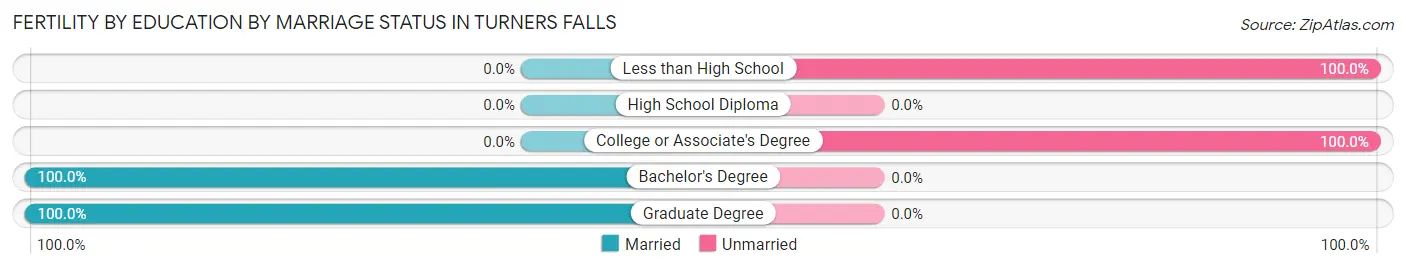
| Educational Attainment | Married | Unmarried |
| Less than High School | 0 (0.0%) | 10 (100.0%) |
| High School Diploma | 0 (0.0%) | 0 (0.0%) |
| College or Associate's Degree | 0 (0.0%) | 12 (100.0%) |
| Bachelor's Degree | 7 (100.0%) | 0 (0.0%) |
| Graduate Degree | 10 (100.0%) | 0 (0.0%) |
| Total | 17 (43.6%) | 22 (56.4%) |
Employment Characteristics in Turners Falls
Employment by Class of Employer in Turners Falls
Among the 2,140 employed individuals in Turners Falls, private company employees (1,400 | 65.4%), not-for-profit organizations (267 | 12.5%), and local government employees (187 | 8.7%) make up the most common classes of employment.
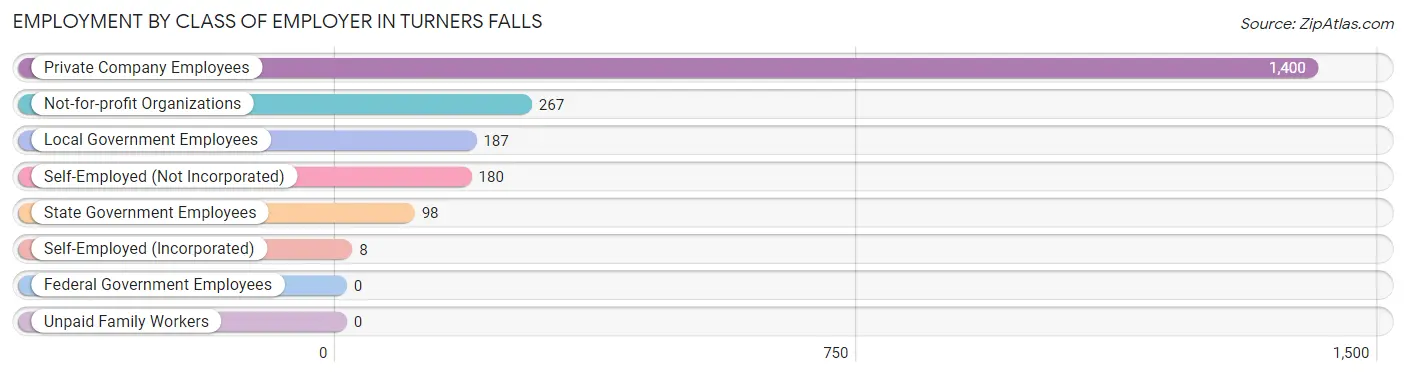
| Employer Class | # Employees | % Employees |
| Private Company Employees | 1,400 | 65.4% |
| Self-Employed (Incorporated) | 8 | 0.4% |
| Self-Employed (Not Incorporated) | 180 | 8.4% |
| Not-for-profit Organizations | 267 | 12.5% |
| Local Government Employees | 187 | 8.7% |
| State Government Employees | 98 | 4.6% |
| Federal Government Employees | 0 | 0.0% |
| Unpaid Family Workers | 0 | 0.0% |
| Total | 2,140 | 100.0% |
Employment Status by Age in Turners Falls
According to the labor force statistics for Turners Falls, out of the total population over 16 years of age (3,305), 66.7% or 2,204 individuals are in the labor force, with 2.9% or 64 of them unemployed. The age group with the highest labor force participation rate is 30 to 34 years, with 95.8% or 250 individuals in the labor force. Within the labor force, the 65 to 74 years age range has the highest percentage of unemployed individuals, with 10.1% or 17 of them being unemployed.
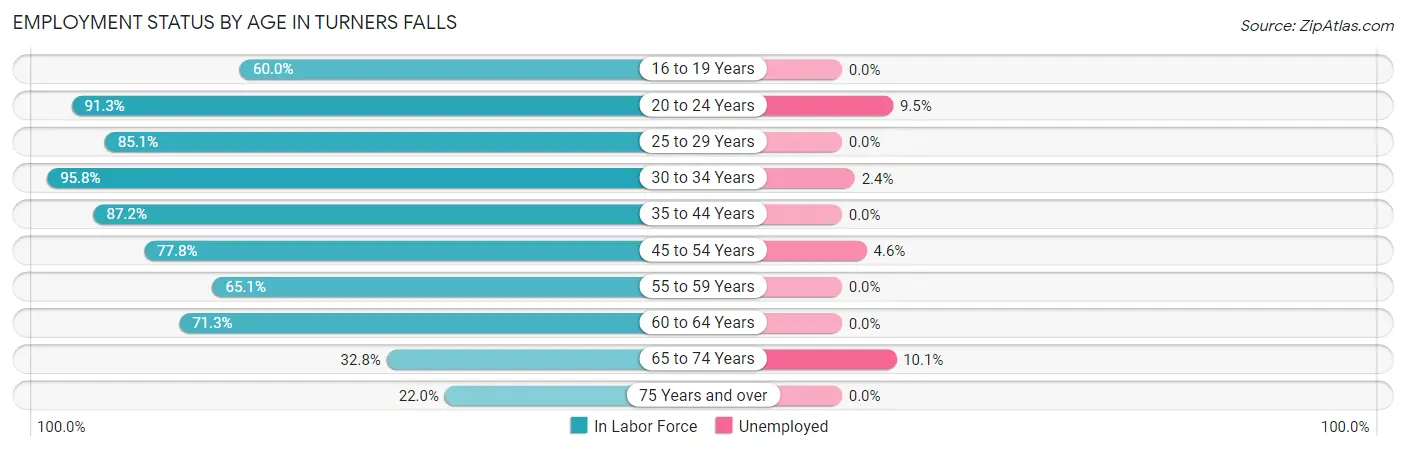
| Age Bracket | In Labor Force | Unemployed |
| 16 to 19 Years | 45 (60.0%) | 0 (0.0%) |
| 20 to 24 Years | 220 (91.3%) | 21 (9.5%) |
| 25 to 29 Years | 171 (85.1%) | 0 (0.0%) |
| 30 to 34 Years | 250 (95.8%) | 6 (2.4%) |
| 35 to 44 Years | 415 (87.2%) | 0 (0.0%) |
| 45 to 54 Years | 411 (77.8%) | 19 (4.6%) |
| 55 to 59 Years | 151 (65.1%) | 0 (0.0%) |
| 60 to 64 Years | 290 (71.3%) | 0 (0.0%) |
| 65 to 74 Years | 169 (32.8%) | 17 (10.1%) |
| 75 Years and over | 81 (22.0%) | 0 (0.0%) |
| Total | 2,204 (66.7%) | 64 (2.9%) |
Employment Status by Educational Attainment in Turners Falls
According to labor force statistics for Turners Falls, 80.2% of individuals (1,688) out of the total population between 25 and 64 years of age (2,105) are in the labor force, with 1.5% or 25 of them being unemployed. The group with the highest labor force participation rate are those with the educational attainment of high school diploma, with 83.2% or 637 individuals in the labor force. Within the labor force, individuals with college / associate degree education have the highest percentage of unemployment, with 2.8% or 13 of them being unemployed.
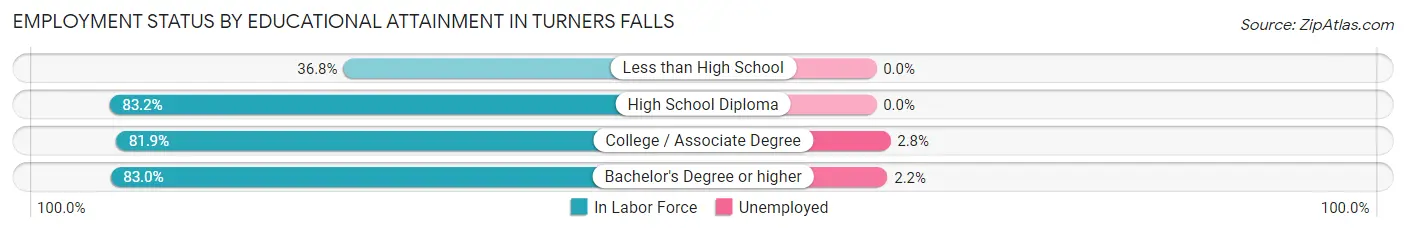
| Educational Attainment | In Labor Force | Unemployed |
| Less than High School | 43 (36.8%) | 0 (0.0%) |
| High School Diploma | 637 (83.2%) | 0 (0.0%) |
| College / Associate Degree | 467 (81.9%) | 16 (2.8%) |
| Bachelor's Degree or higher | 541 (83.0%) | 14 (2.2%) |
| Total | 1,688 (80.2%) | 32 (1.5%) |
Employment Occupations by Sex in Turners Falls
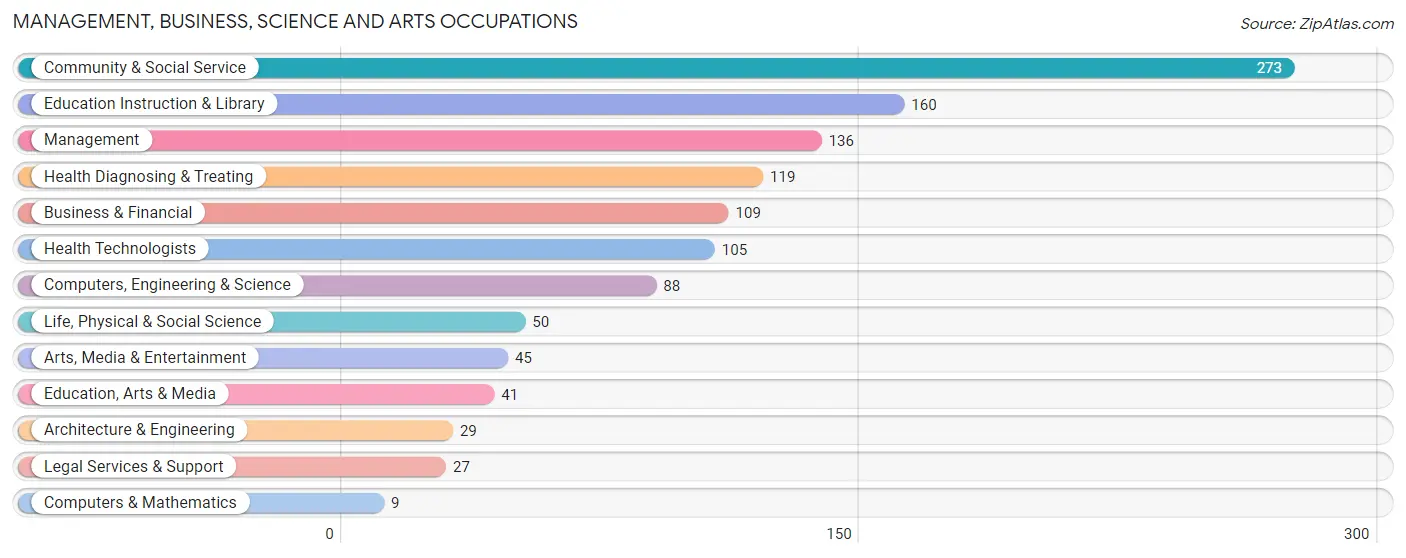
Management, Business, Science and Arts Occupations
The most common Management, Business, Science and Arts occupations in Turners Falls are Community & Social Service (273 | 12.8%), Education Instruction & Library (160 | 7.5%), Management (136 | 6.4%), Health Diagnosing & Treating (119 | 5.6%), and Business & Financial (109 | 5.1%).
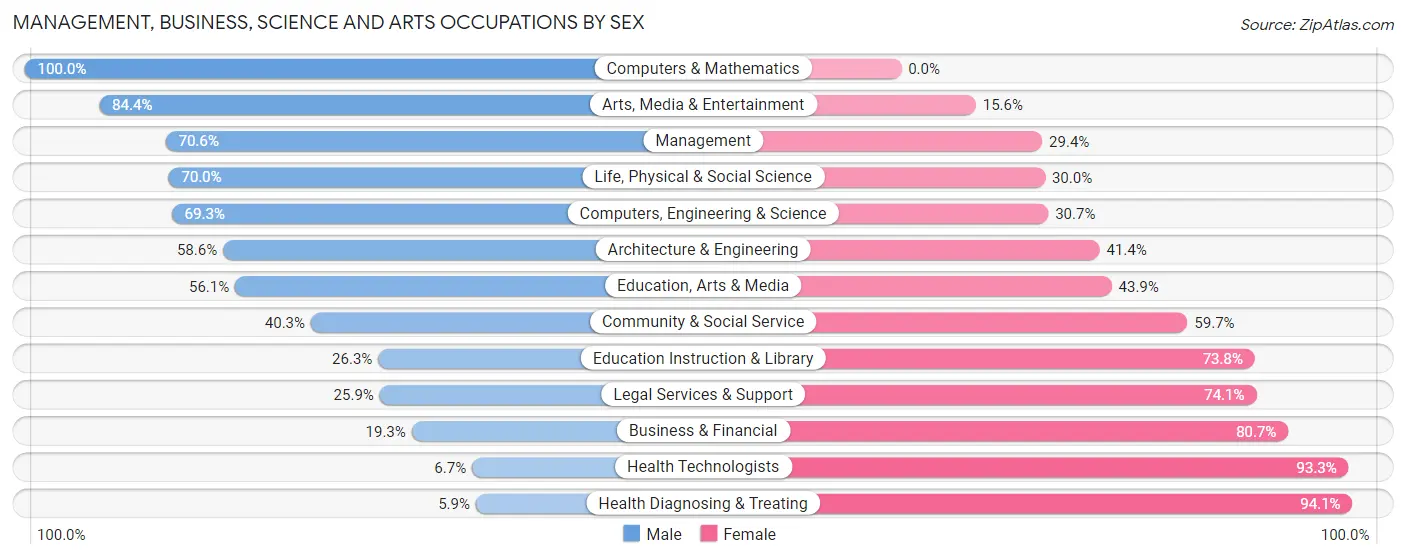
Management, Business, Science and Arts Occupations by Sex
Within the Management, Business, Science and Arts occupations in Turners Falls, the most male-oriented occupations are Computers & Mathematics (100.0%), Arts, Media & Entertainment (84.4%), and Management (70.6%), while the most female-oriented occupations are Health Diagnosing & Treating (94.1%), Health Technologists (93.3%), and Business & Financial (80.7%).
| Occupation | Male | Female |
| Management | 96 (70.6%) | 40 (29.4%) |
| Business & Financial | 21 (19.3%) | 88 (80.7%) |
| Computers, Engineering & Science | 61 (69.3%) | 27 (30.7%) |
| Computers & Mathematics | 9 (100.0%) | 0 (0.0%) |
| Architecture & Engineering | 17 (58.6%) | 12 (41.4%) |
| Life, Physical & Social Science | 35 (70.0%) | 15 (30.0%) |
| Community & Social Service | 110 (40.3%) | 163 (59.7%) |
| Education, Arts & Media | 23 (56.1%) | 18 (43.9%) |
| Legal Services & Support | 7 (25.9%) | 20 (74.1%) |
| Education Instruction & Library | 42 (26.3%) | 118 (73.8%) |
| Arts, Media & Entertainment | 38 (84.4%) | 7 (15.6%) |
| Health Diagnosing & Treating | 7 (5.9%) | 112 (94.1%) |
| Health Technologists | 7 (6.7%) | 98 (93.3%) |
| Total (Category) | 295 (40.7%) | 430 (59.3%) |
| Total (Overall) | 1,129 (52.8%) | 1,011 (47.2%) |
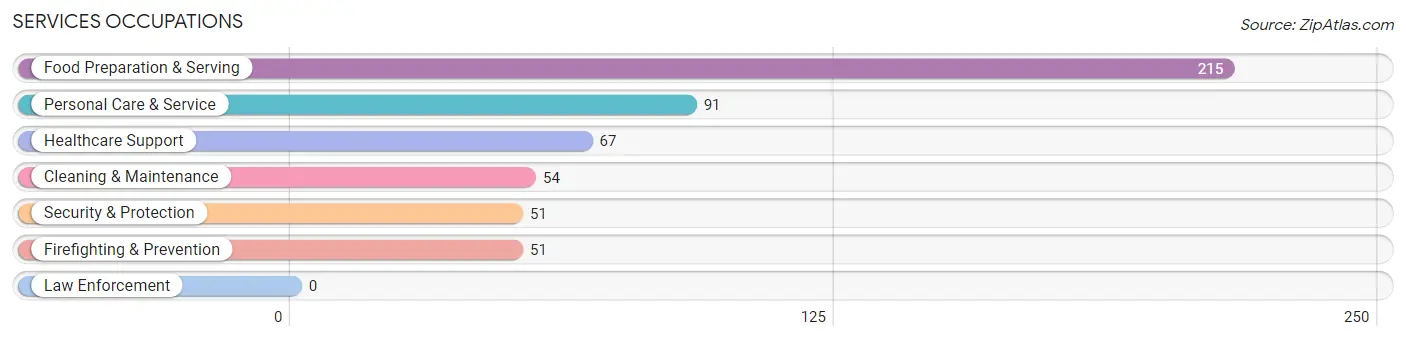
Services Occupations
The most common Services occupations in Turners Falls are Food Preparation & Serving (215 | 10.1%), Personal Care & Service (91 | 4.3%), Healthcare Support (67 | 3.1%), Cleaning & Maintenance (54 | 2.5%), and Security & Protection (51 | 2.4%).
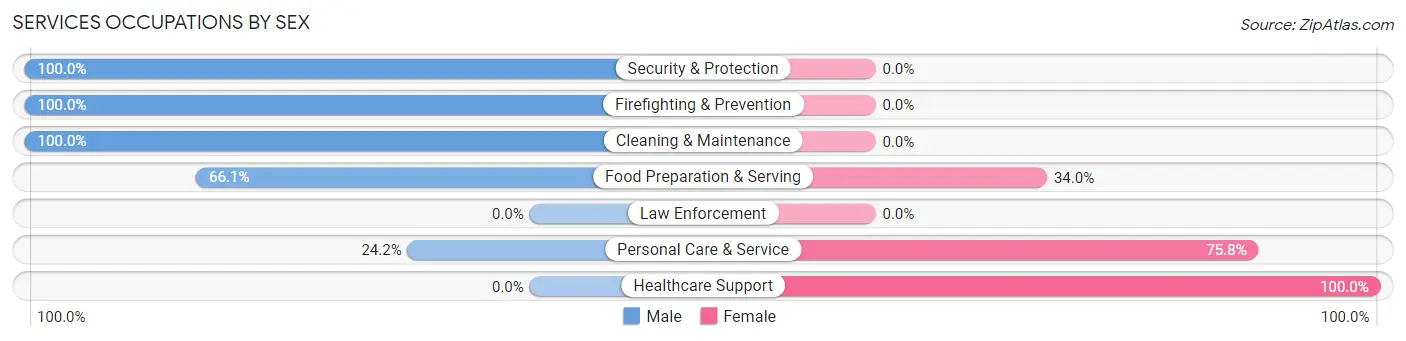
Services Occupations by Sex
Within the Services occupations in Turners Falls, the most male-oriented occupations are Security & Protection (100.0%), Firefighting & Prevention (100.0%), and Cleaning & Maintenance (100.0%), while the most female-oriented occupations are Healthcare Support (100.0%), Personal Care & Service (75.8%), and Food Preparation & Serving (34.0%).
| Occupation | Male | Female |
| Healthcare Support | 0 (0.0%) | 67 (100.0%) |
| Security & Protection | 51 (100.0%) | 0 (0.0%) |
| Firefighting & Prevention | 51 (100.0%) | 0 (0.0%) |
| Law Enforcement | 0 (0.0%) | 0 (0.0%) |
| Food Preparation & Serving | 142 (66.0%) | 73 (34.0%) |
| Cleaning & Maintenance | 54 (100.0%) | 0 (0.0%) |
| Personal Care & Service | 22 (24.2%) | 69 (75.8%) |
| Total (Category) | 269 (56.3%) | 209 (43.7%) |
| Total (Overall) | 1,129 (52.8%) | 1,011 (47.2%) |
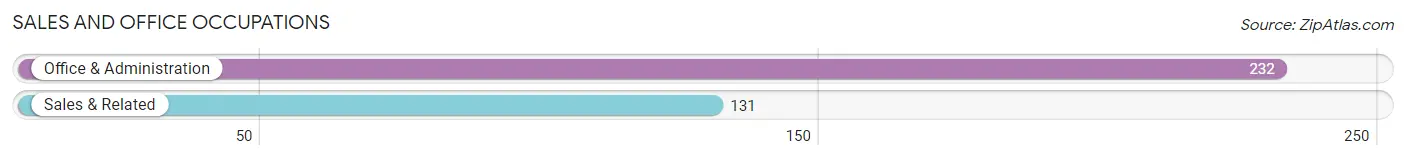
Sales and Office Occupations
The most common Sales and Office occupations in Turners Falls are Office & Administration (232 | 10.8%), and Sales & Related (131 | 6.1%).
Sales and Office Occupations by Sex
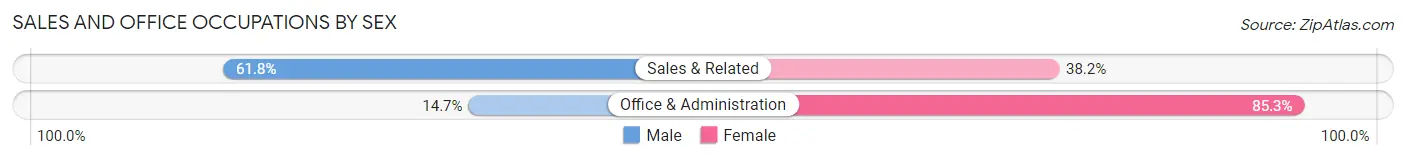
| Occupation | Male | Female |
| Sales & Related | 81 (61.8%) | 50 (38.2%) |
| Office & Administration | 34 (14.7%) | 198 (85.3%) |
| Total (Category) | 115 (31.7%) | 248 (68.3%) |
| Total (Overall) | 1,129 (52.8%) | 1,011 (47.2%) |
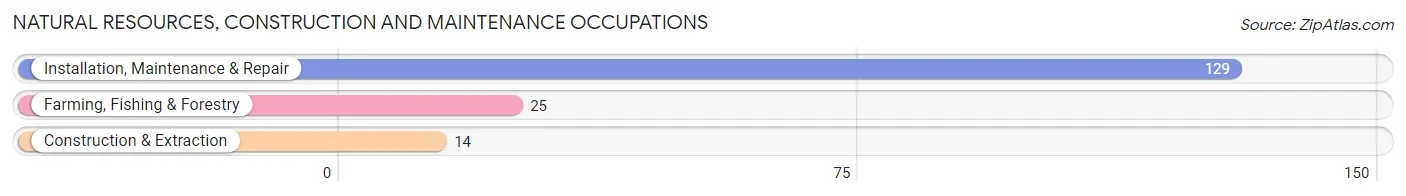
Natural Resources, Construction and Maintenance Occupations
The most common Natural Resources, Construction and Maintenance occupations in Turners Falls are Installation, Maintenance & Repair (129 | 6.0%), Farming, Fishing & Forestry (25 | 1.2%), and Construction & Extraction (14 | 0.6%).
Natural Resources, Construction and Maintenance Occupations by Sex
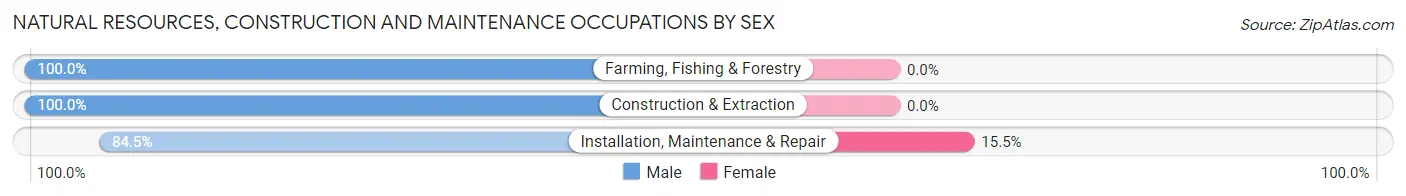
| Occupation | Male | Female |
| Farming, Fishing & Forestry | 25 (100.0%) | 0 (0.0%) |
| Construction & Extraction | 14 (100.0%) | 0 (0.0%) |
| Installation, Maintenance & Repair | 109 (84.5%) | 20 (15.5%) |
| Total (Category) | 148 (88.1%) | 20 (11.9%) |
| Total (Overall) | 1,129 (52.8%) | 1,011 (47.2%) |
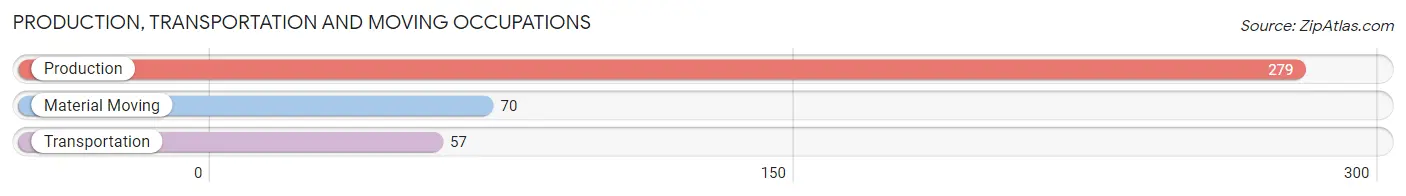
Production, Transportation and Moving Occupations
The most common Production, Transportation and Moving occupations in Turners Falls are Production (279 | 13.0%), Material Moving (70 | 3.3%), and Transportation (57 | 2.7%).
Production, Transportation and Moving Occupations by Sex
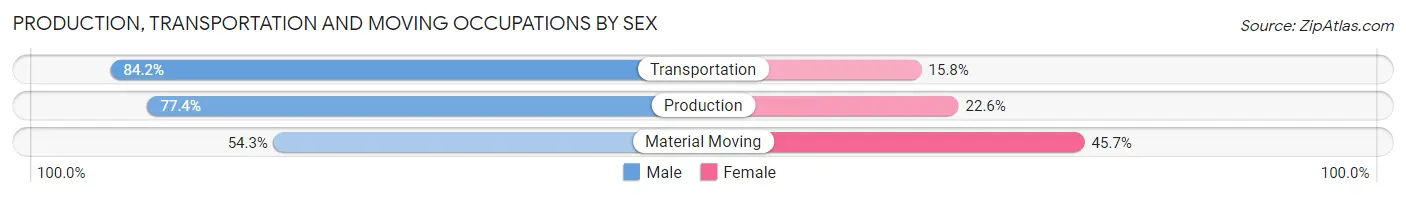
| Occupation | Male | Female |
| Production | 216 (77.4%) | 63 (22.6%) |
| Transportation | 48 (84.2%) | 9 (15.8%) |
| Material Moving | 38 (54.3%) | 32 (45.7%) |
| Total (Category) | 302 (74.4%) | 104 (25.6%) |
| Total (Overall) | 1,129 (52.8%) | 1,011 (47.2%) |
Employment Industries by Sex in Turners Falls
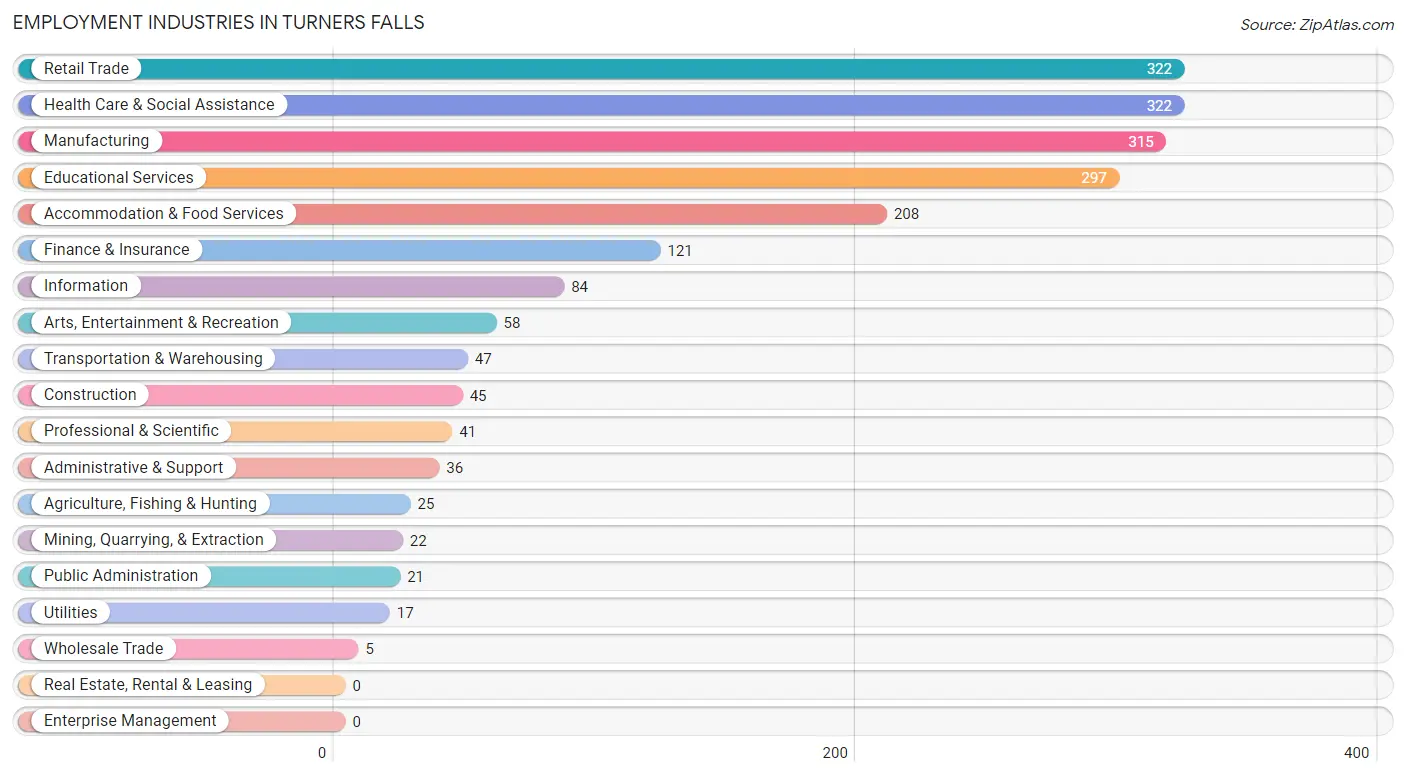
Employment Industries in Turners Falls
The major employment industries in Turners Falls include Retail Trade (322 | 15.0%), Health Care & Social Assistance (322 | 15.0%), Manufacturing (315 | 14.7%), Educational Services (297 | 13.9%), and Accommodation & Food Services (208 | 9.7%).
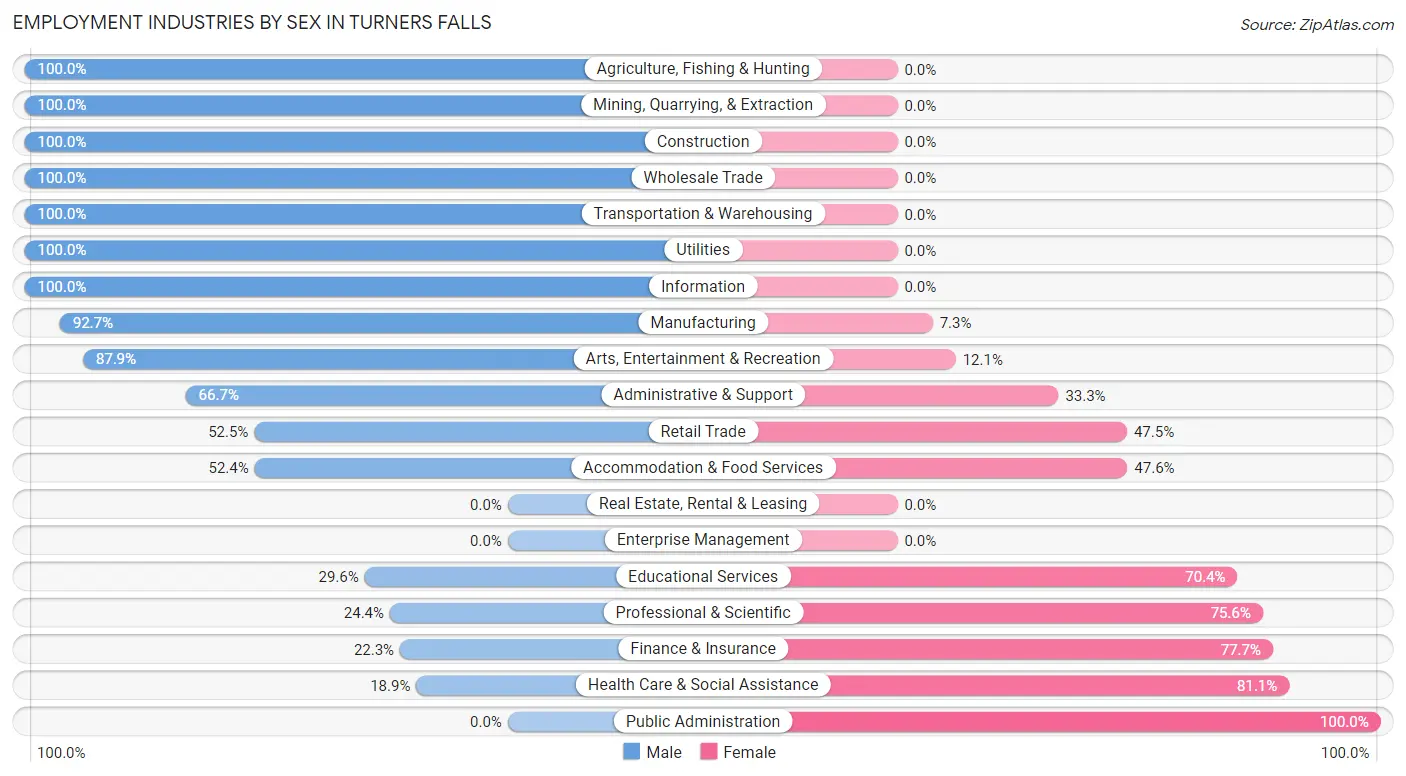
Employment Industries by Sex in Turners Falls
The Turners Falls industries that see more men than women are Agriculture, Fishing & Hunting (100.0%), Mining, Quarrying, & Extraction (100.0%), and Construction (100.0%), whereas the industries that tend to have a higher number of women are Public Administration (100.0%), Health Care & Social Assistance (81.1%), and Finance & Insurance (77.7%).
| Industry | Male | Female |
| Agriculture, Fishing & Hunting | 25 (100.0%) | 0 (0.0%) |
| Mining, Quarrying, & Extraction | 22 (100.0%) | 0 (0.0%) |
| Construction | 45 (100.0%) | 0 (0.0%) |
| Manufacturing | 292 (92.7%) | 23 (7.3%) |
| Wholesale Trade | 5 (100.0%) | 0 (0.0%) |
| Retail Trade | 169 (52.5%) | 153 (47.5%) |
| Transportation & Warehousing | 47 (100.0%) | 0 (0.0%) |
| Utilities | 17 (100.0%) | 0 (0.0%) |
| Information | 84 (100.0%) | 0 (0.0%) |
| Finance & Insurance | 27 (22.3%) | 94 (77.7%) |
| Real Estate, Rental & Leasing | 0 (0.0%) | 0 (0.0%) |
| Professional & Scientific | 10 (24.4%) | 31 (75.6%) |
| Enterprise Management | 0 (0.0%) | 0 (0.0%) |
| Administrative & Support | 24 (66.7%) | 12 (33.3%) |
| Educational Services | 88 (29.6%) | 209 (70.4%) |
| Health Care & Social Assistance | 61 (18.9%) | 261 (81.1%) |
| Arts, Entertainment & Recreation | 51 (87.9%) | 7 (12.1%) |
| Accommodation & Food Services | 109 (52.4%) | 99 (47.6%) |
| Public Administration | 0 (0.0%) | 21 (100.0%) |
| Total | 1,129 (52.8%) | 1,011 (47.2%) |
Education in Turners Falls
School Enrollment in Turners Falls
The most common levels of schooling among the 541 students in Turners Falls are middle school (135 | 24.9%), high school (112 | 20.7%), and graduate / professional (95 | 17.6%).
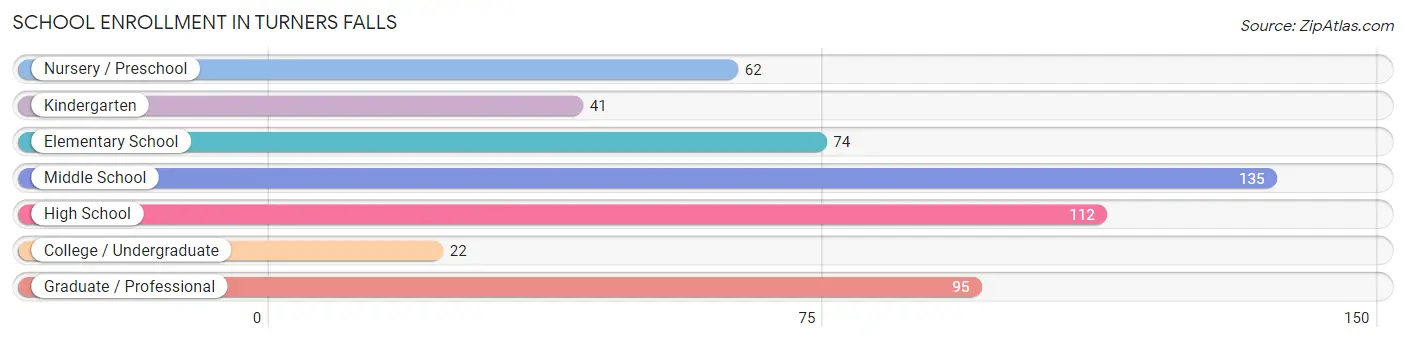
| School Level | # Students | % Students |
| Nursery / Preschool | 62 | 11.5% |
| Kindergarten | 41 | 7.6% |
| Elementary School | 74 | 13.7% |
| Middle School | 135 | 24.9% |
| High School | 112 | 20.7% |
| College / Undergraduate | 22 | 4.1% |
| Graduate / Professional | 95 | 17.6% |
| Total | 541 | 100.0% |
School Enrollment by Age by Funding Source in Turners Falls
Out of a total of 541 students who are enrolled in schools in Turners Falls, 78 (14.4%) attend a private institution, while the remaining 463 (85.6%) are enrolled in public schools. The age group of 20 to 24 year olds has the highest likelihood of being enrolled in private schools, with 26 (63.4% in the age bracket) enrolled. Conversely, the age group of 10 to 14 year olds has the lowest likelihood of being enrolled in a private school, with 142 (100.0% in the age bracket) attending a public institution.
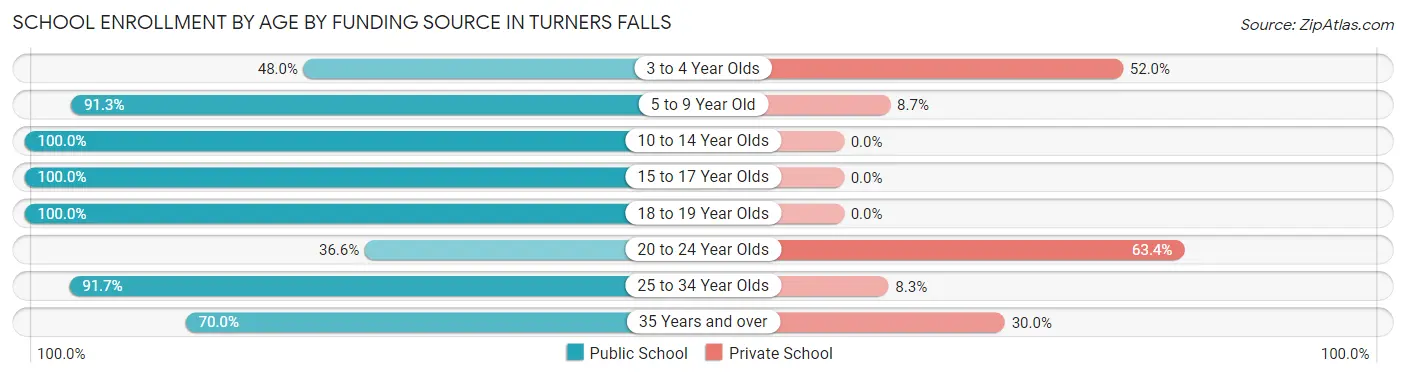
| Age Bracket | Public School | Private School |
| 3 to 4 Year Olds | 24 (48.0%) | 26 (52.0%) |
| 5 to 9 Year Old | 116 (91.3%) | 11 (8.7%) |
| 10 to 14 Year Olds | 142 (100.0%) | 0 (0.0%) |
| 15 to 17 Year Olds | 85 (100.0%) | 0 (0.0%) |
| 18 to 19 Year Olds | 20 (100.0%) | 0 (0.0%) |
| 20 to 24 Year Olds | 15 (36.6%) | 26 (63.4%) |
| 25 to 34 Year Olds | 33 (91.7%) | 3 (8.3%) |
| 35 Years and over | 28 (70.0%) | 12 (30.0%) |
| Total | 463 (85.6%) | 78 (14.4%) |
Educational Attainment by Field of Study in Turners Falls
Social sciences (179 | 16.7%), education (148 | 13.8%), literature & languages (129 | 12.1%), business (112 | 10.5%), and psychology (96 | 9.0%) are the most common fields of study among 1,070 individuals in Turners Falls who have obtained a bachelor's degree or higher.
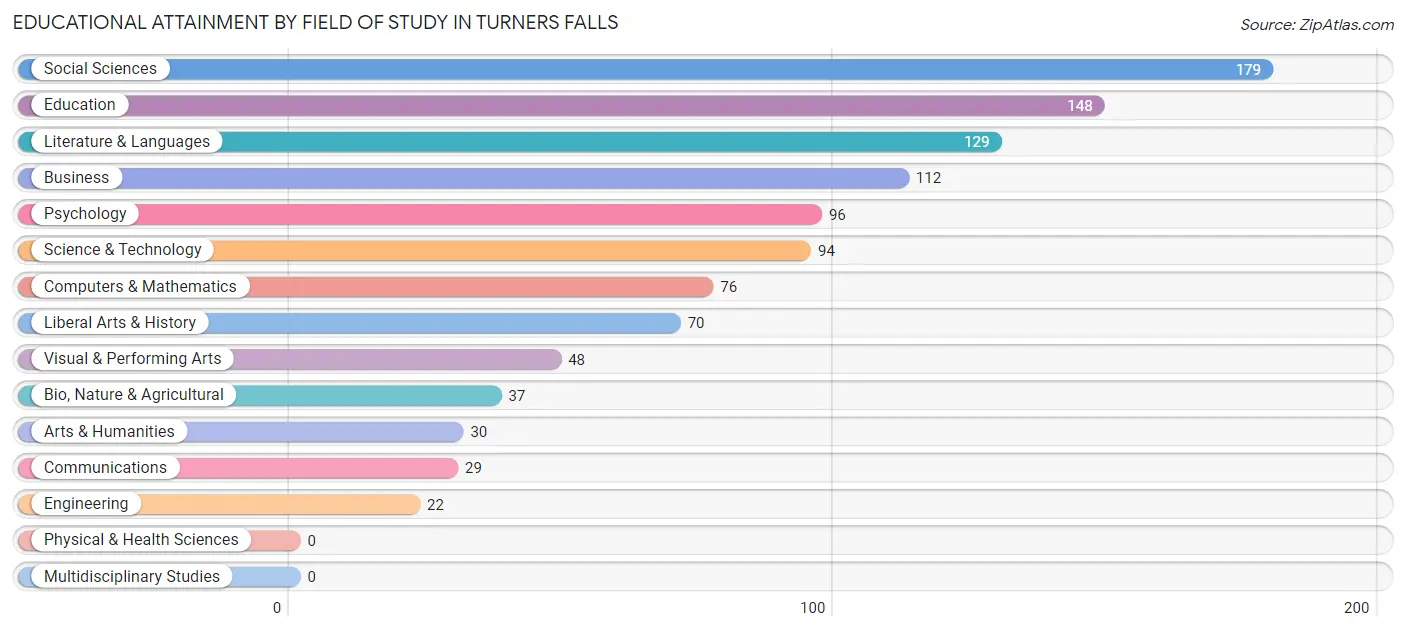
| Field of Study | # Graduates | % Graduates |
| Computers & Mathematics | 76 | 7.1% |
| Bio, Nature & Agricultural | 37 | 3.5% |
| Physical & Health Sciences | 0 | 0.0% |
| Psychology | 96 | 9.0% |
| Social Sciences | 179 | 16.7% |
| Engineering | 22 | 2.1% |
| Multidisciplinary Studies | 0 | 0.0% |
| Science & Technology | 94 | 8.8% |
| Business | 112 | 10.5% |
| Education | 148 | 13.8% |
| Literature & Languages | 129 | 12.1% |
| Liberal Arts & History | 70 | 6.5% |
| Visual & Performing Arts | 48 | 4.5% |
| Communications | 29 | 2.7% |
| Arts & Humanities | 30 | 2.8% |
| Total | 1,070 | 100.0% |
Transportation & Commute in Turners Falls
Vehicle Availability by Sex in Turners Falls
The most prevalent vehicle ownership categories in Turners Falls are males with 2 vehicles (479, accounting for 42.4%) and females with 2 vehicles (414, making up 47.4%).
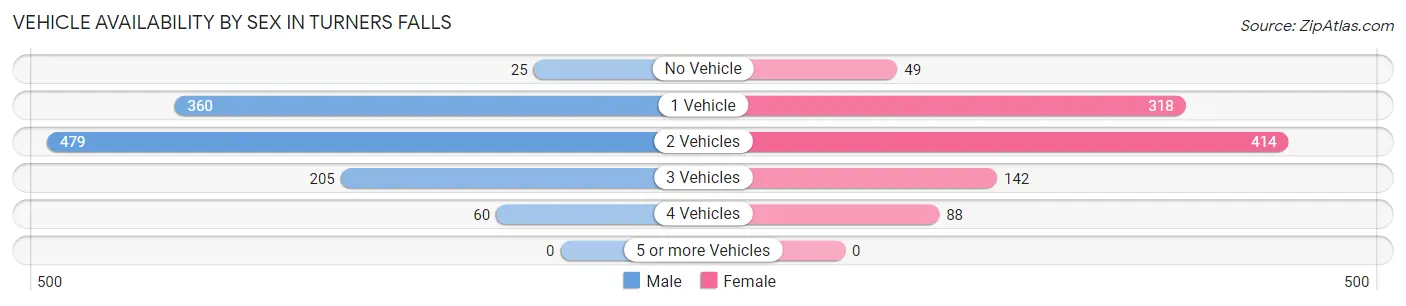
| Vehicles Available | Male | Female |
| No Vehicle | 25 (2.2%) | 49 (4.9%) |
| 1 Vehicle | 360 (31.9%) | 318 (31.5%) |
| 2 Vehicles | 479 (42.4%) | 414 (40.9%) |
| 3 Vehicles | 205 (18.2%) | 142 (14.1%) |
| 4 Vehicles | 60 (5.3%) | 88 (8.7%) |
| 5 or more Vehicles | 0 (0.0%) | 0 (0.0%) |
| Total | 1,129 (100.0%) | 1,011 (100.0%) |
Commute Time in Turners Falls
The most frequently occuring commute durations in Turners Falls are 5 to 9 minutes (406 commuters, 19.9%), 15 to 19 minutes (344 commuters, 16.9%), and 20 to 24 minutes (236 commuters, 11.6%).
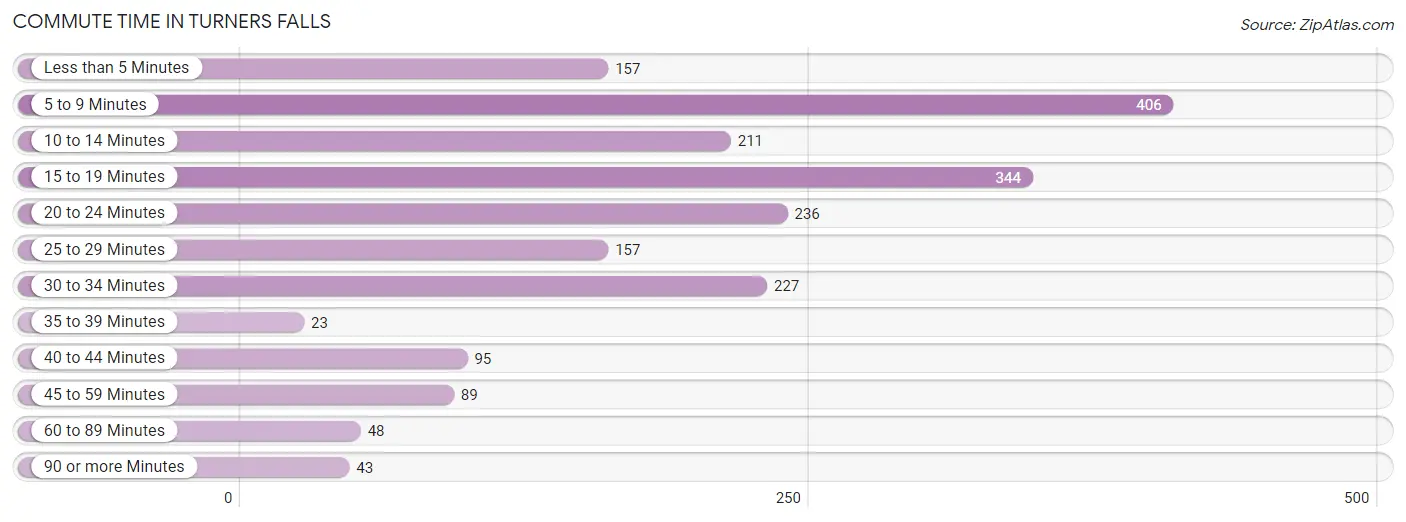
| Commute Time | # Commuters | % Commuters |
| Less than 5 Minutes | 157 | 7.7% |
| 5 to 9 Minutes | 406 | 19.9% |
| 10 to 14 Minutes | 211 | 10.4% |
| 15 to 19 Minutes | 344 | 16.9% |
| 20 to 24 Minutes | 236 | 11.6% |
| 25 to 29 Minutes | 157 | 7.7% |
| 30 to 34 Minutes | 227 | 11.2% |
| 35 to 39 Minutes | 23 | 1.1% |
| 40 to 44 Minutes | 95 | 4.7% |
| 45 to 59 Minutes | 89 | 4.4% |
| 60 to 89 Minutes | 48 | 2.4% |
| 90 or more Minutes | 43 | 2.1% |
Commute Time by Sex in Turners Falls
The most common commute times in Turners Falls are 5 to 9 minutes (222 commuters, 20.4%) for males and 15 to 19 minutes (185 commuters, 19.5%) for females.
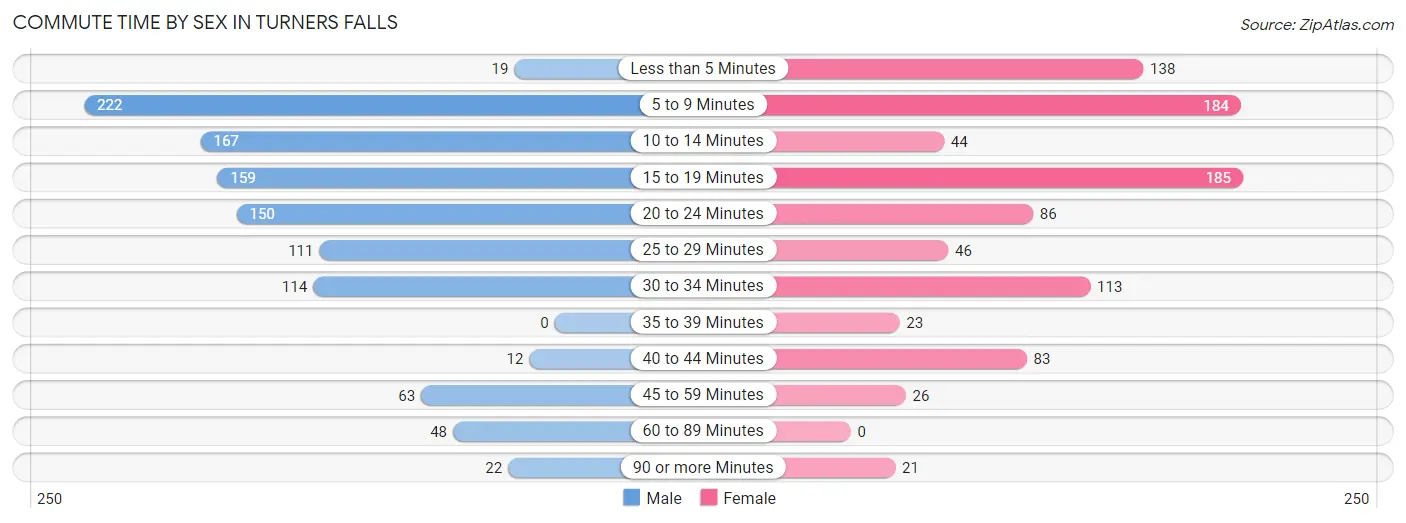
| Commute Time | Male | Female |
| Less than 5 Minutes | 19 (1.8%) | 138 (14.5%) |
| 5 to 9 Minutes | 222 (20.4%) | 184 (19.4%) |
| 10 to 14 Minutes | 167 (15.4%) | 44 (4.6%) |
| 15 to 19 Minutes | 159 (14.6%) | 185 (19.5%) |
| 20 to 24 Minutes | 150 (13.8%) | 86 (9.1%) |
| 25 to 29 Minutes | 111 (10.2%) | 46 (4.9%) |
| 30 to 34 Minutes | 114 (10.5%) | 113 (11.9%) |
| 35 to 39 Minutes | 0 (0.0%) | 23 (2.4%) |
| 40 to 44 Minutes | 12 (1.1%) | 83 (8.7%) |
| 45 to 59 Minutes | 63 (5.8%) | 26 (2.7%) |
| 60 to 89 Minutes | 48 (4.4%) | 0 (0.0%) |
| 90 or more Minutes | 22 (2.0%) | 21 (2.2%) |
Time of Departure to Work by Sex in Turners Falls
The most frequent times of departure to work in Turners Falls are 5:30 AM to 5:59 AM (159, 14.6%) for males and 8:00 AM to 8:29 AM (235, 24.8%) for females.
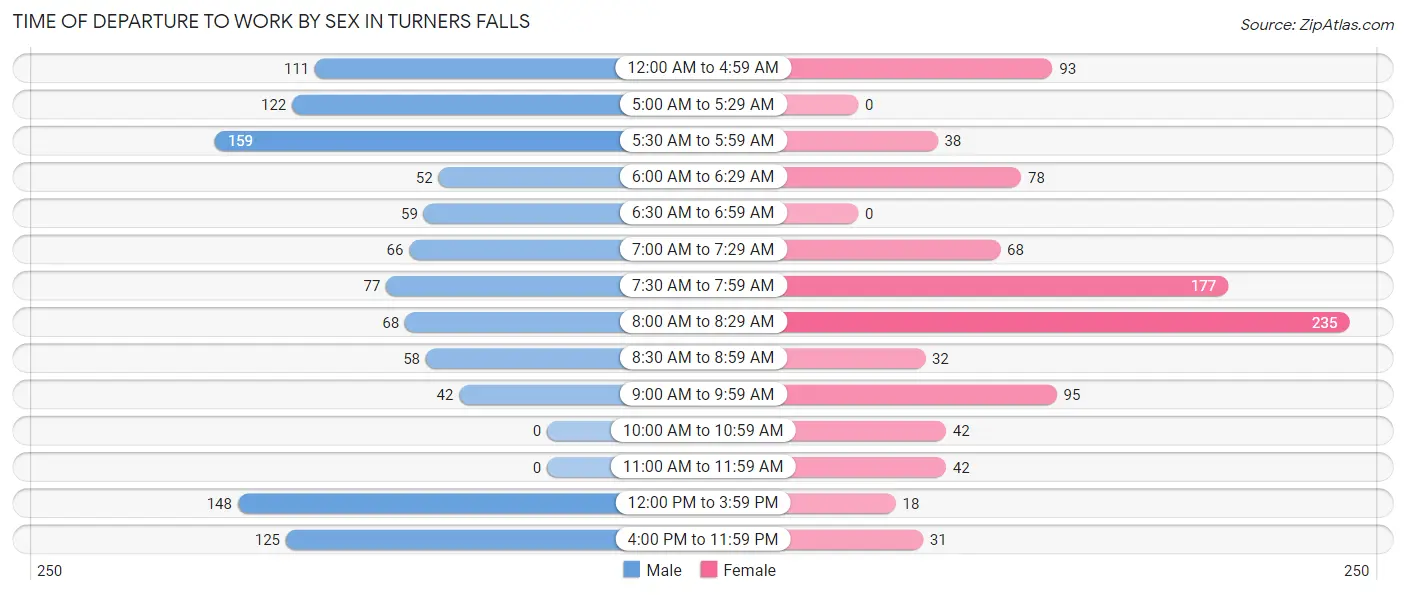
| Time of Departure | Male | Female |
| 12:00 AM to 4:59 AM | 111 (10.2%) | 93 (9.8%) |
| 5:00 AM to 5:29 AM | 122 (11.2%) | 0 (0.0%) |
| 5:30 AM to 5:59 AM | 159 (14.6%) | 38 (4.0%) |
| 6:00 AM to 6:29 AM | 52 (4.8%) | 78 (8.2%) |
| 6:30 AM to 6:59 AM | 59 (5.4%) | 0 (0.0%) |
| 7:00 AM to 7:29 AM | 66 (6.1%) | 68 (7.2%) |
| 7:30 AM to 7:59 AM | 77 (7.1%) | 177 (18.6%) |
| 8:00 AM to 8:29 AM | 68 (6.3%) | 235 (24.8%) |
| 8:30 AM to 8:59 AM | 58 (5.3%) | 32 (3.4%) |
| 9:00 AM to 9:59 AM | 42 (3.9%) | 95 (10.0%) |
| 10:00 AM to 10:59 AM | 0 (0.0%) | 42 (4.4%) |
| 11:00 AM to 11:59 AM | 0 (0.0%) | 42 (4.4%) |
| 12:00 PM to 3:59 PM | 148 (13.6%) | 18 (1.9%) |
| 4:00 PM to 11:59 PM | 125 (11.5%) | 31 (3.3%) |
| Total | 1,087 (100.0%) | 949 (100.0%) |
Housing Occupancy in Turners Falls
Occupancy by Ownership in Turners Falls
Of the total 1,947 dwellings in Turners Falls, owner-occupied units account for 1,016 (52.2%), while renter-occupied units make up 931 (47.8%).
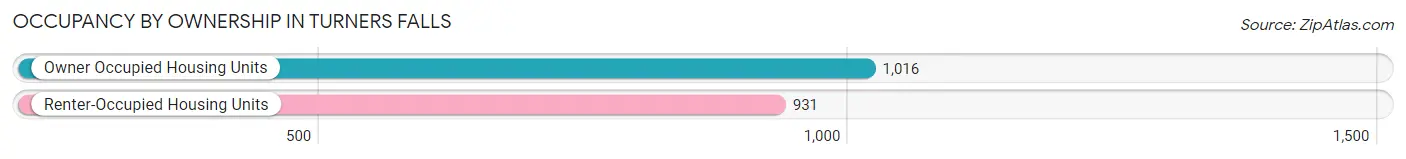
| Occupancy | # Housing Units | % Housing Units |
| Owner Occupied Housing Units | 1,016 | 52.2% |
| Renter-Occupied Housing Units | 931 | 47.8% |
| Total Occupied Housing Units | 1,947 | 100.0% |
Occupancy by Household Size in Turners Falls
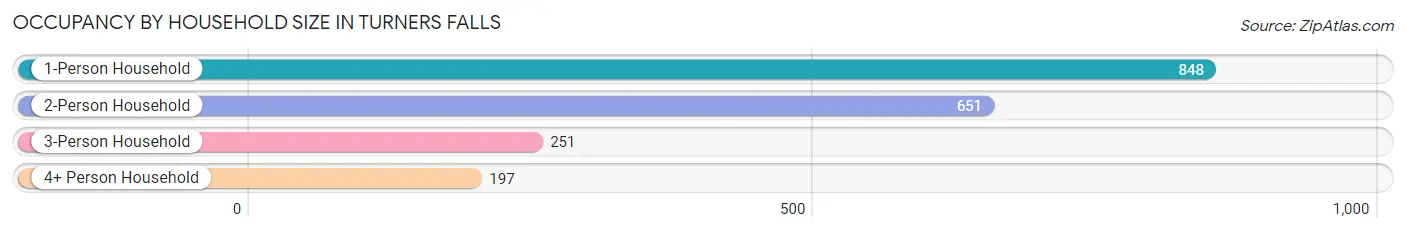
| Household Size | # Housing Units | % Housing Units |
| 1-Person Household | 848 | 43.5% |
| 2-Person Household | 651 | 33.4% |
| 3-Person Household | 251 | 12.9% |
| 4+ Person Household | 197 | 10.1% |
| Total Housing Units | 1,947 | 100.0% |
Occupancy by Ownership by Household Size in Turners Falls
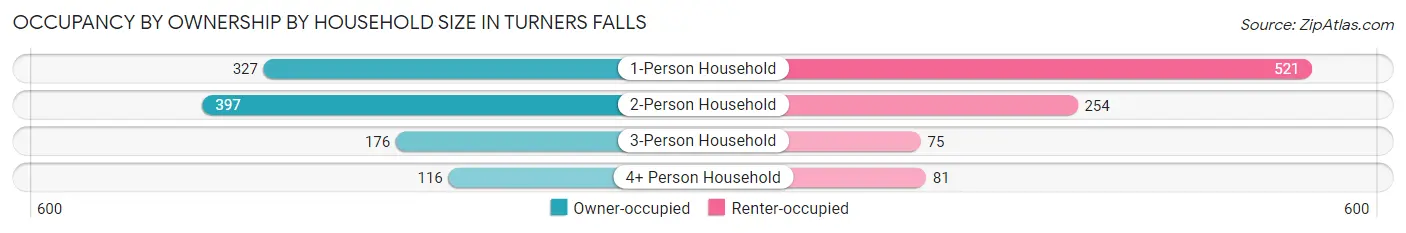
| Household Size | Owner-occupied | Renter-occupied |
| 1-Person Household | 327 (38.6%) | 521 (61.4%) |
| 2-Person Household | 397 (61.0%) | 254 (39.0%) |
| 3-Person Household | 176 (70.1%) | 75 (29.9%) |
| 4+ Person Household | 116 (58.9%) | 81 (41.1%) |
| Total Housing Units | 1,016 (52.2%) | 931 (47.8%) |
Occupancy by Educational Attainment in Turners Falls
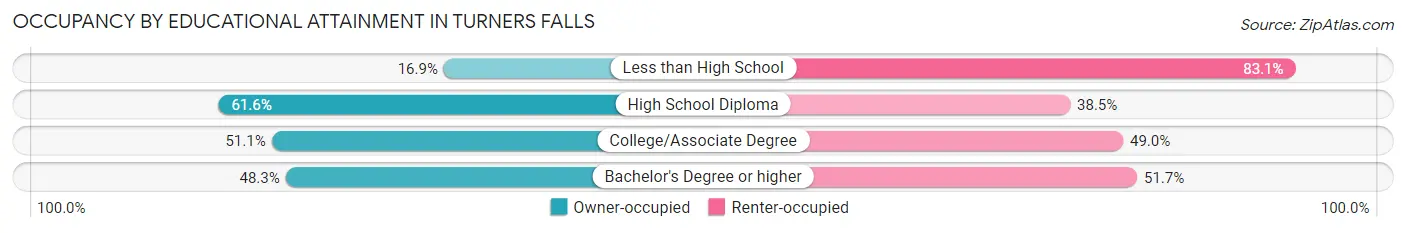
| Household Size | Owner-occupied | Renter-occupied |
| Less than High School | 12 (16.9%) | 59 (83.1%) |
| High School Diploma | 389 (61.6%) | 243 (38.5%) |
| College/Associate Degree | 267 (51.0%) | 256 (48.9%) |
| Bachelor's Degree or higher | 348 (48.3%) | 373 (51.7%) |
Occupancy by Age of Householder in Turners Falls
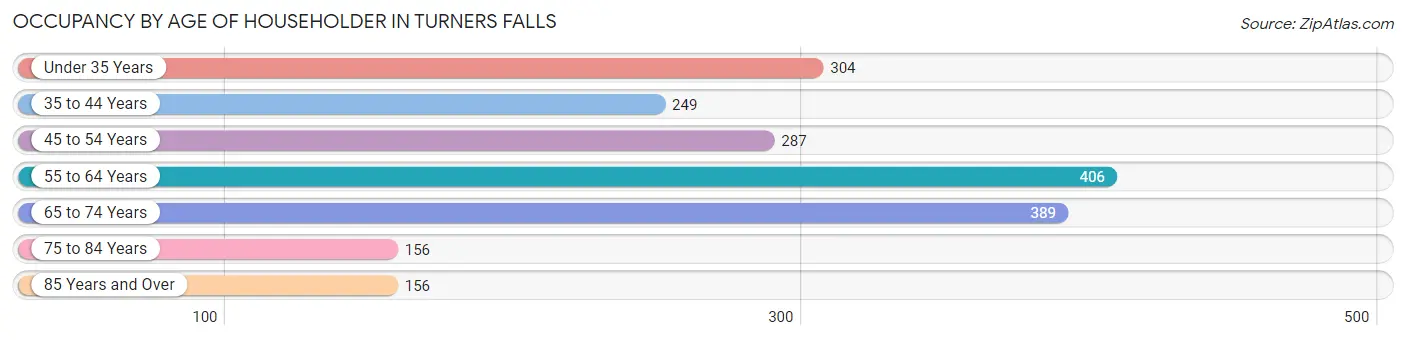
| Age Bracket | # Households | % Households |
| Under 35 Years | 304 | 15.6% |
| 35 to 44 Years | 249 | 12.8% |
| 45 to 54 Years | 287 | 14.7% |
| 55 to 64 Years | 406 | 20.8% |
| 65 to 74 Years | 389 | 20.0% |
| 75 to 84 Years | 156 | 8.0% |
| 85 Years and Over | 156 | 8.0% |
| Total | 1,947 | 100.0% |
Housing Finances in Turners Falls
Median Income by Occupancy in Turners Falls
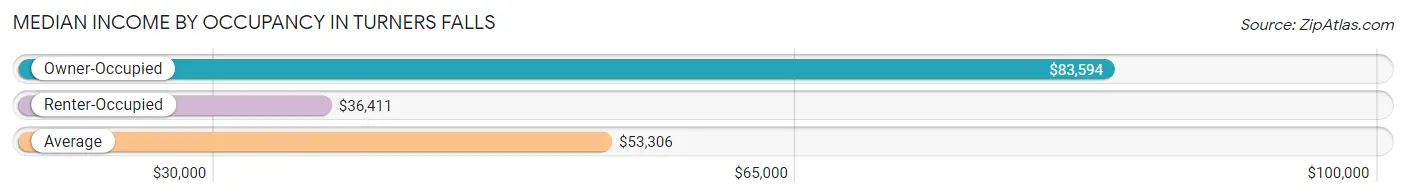
| Occupancy Type | # Households | Median Income |
| Owner-Occupied | 1,016 (52.2%) | $83,594 |
| Renter-Occupied | 931 (47.8%) | $36,411 |
| Average | 1,947 (100.0%) | $53,306 |
Occupancy by Householder Income Bracket in Turners Falls
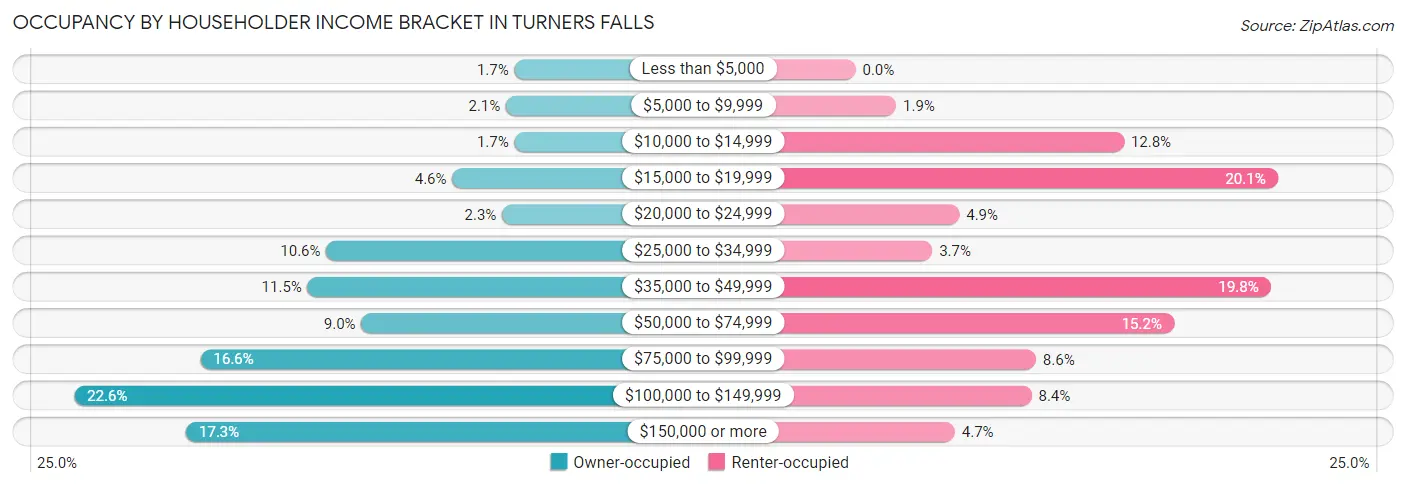
| Income Bracket | Owner-occupied | Renter-occupied |
| Less than $5,000 | 17 (1.7%) | 0 (0.0%) |
| $5,000 to $9,999 | 21 (2.1%) | 18 (1.9%) |
| $10,000 to $14,999 | 17 (1.7%) | 119 (12.8%) |
| $15,000 to $19,999 | 47 (4.6%) | 187 (20.1%) |
| $20,000 to $24,999 | 23 (2.3%) | 46 (4.9%) |
| $25,000 to $34,999 | 108 (10.6%) | 34 (3.6%) |
| $35,000 to $49,999 | 117 (11.5%) | 184 (19.8%) |
| $50,000 to $74,999 | 91 (9.0%) | 141 (15.1%) |
| $75,000 to $99,999 | 169 (16.6%) | 80 (8.6%) |
| $100,000 to $149,999 | 230 (22.6%) | 78 (8.4%) |
| $150,000 or more | 176 (17.3%) | 44 (4.7%) |
| Total | 1,016 (100.0%) | 931 (100.0%) |
Monthly Housing Cost Tiers in Turners Falls
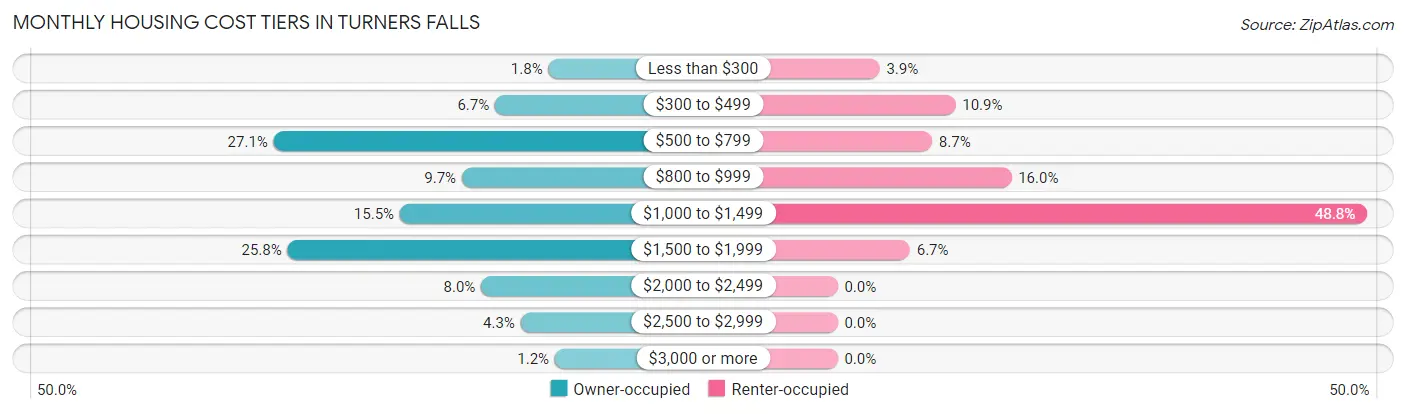
| Monthly Cost | Owner-occupied | Renter-occupied |
| Less than $300 | 18 (1.8%) | 36 (3.9%) |
| $300 to $499 | 68 (6.7%) | 101 (10.8%) |
| $500 to $799 | 275 (27.1%) | 81 (8.7%) |
| $800 to $999 | 99 (9.7%) | 149 (16.0%) |
| $1,000 to $1,499 | 157 (15.4%) | 454 (48.8%) |
| $1,500 to $1,999 | 262 (25.8%) | 62 (6.7%) |
| $2,000 to $2,499 | 81 (8.0%) | 0 (0.0%) |
| $2,500 to $2,999 | 44 (4.3%) | 0 (0.0%) |
| $3,000 or more | 12 (1.2%) | 0 (0.0%) |
| Total | 1,016 (100.0%) | 931 (100.0%) |
Physical Housing Characteristics in Turners Falls
Housing Structures in Turners Falls
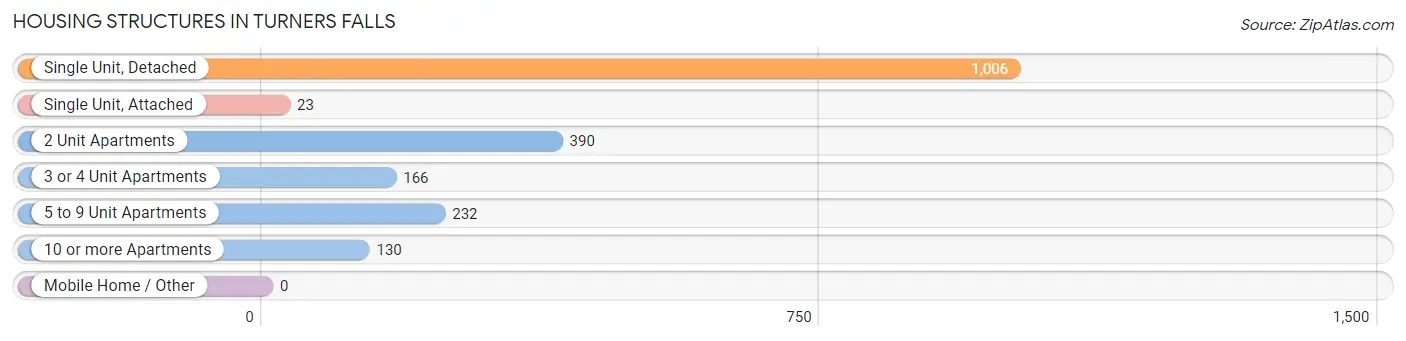
| Structure Type | # Housing Units | % Housing Units |
| Single Unit, Detached | 1,006 | 51.7% |
| Single Unit, Attached | 23 | 1.2% |
| 2 Unit Apartments | 390 | 20.0% |
| 3 or 4 Unit Apartments | 166 | 8.5% |
| 5 to 9 Unit Apartments | 232 | 11.9% |
| 10 or more Apartments | 130 | 6.7% |
| Mobile Home / Other | 0 | 0.0% |
| Total | 1,947 | 100.0% |
Housing Structures by Occupancy in Turners Falls
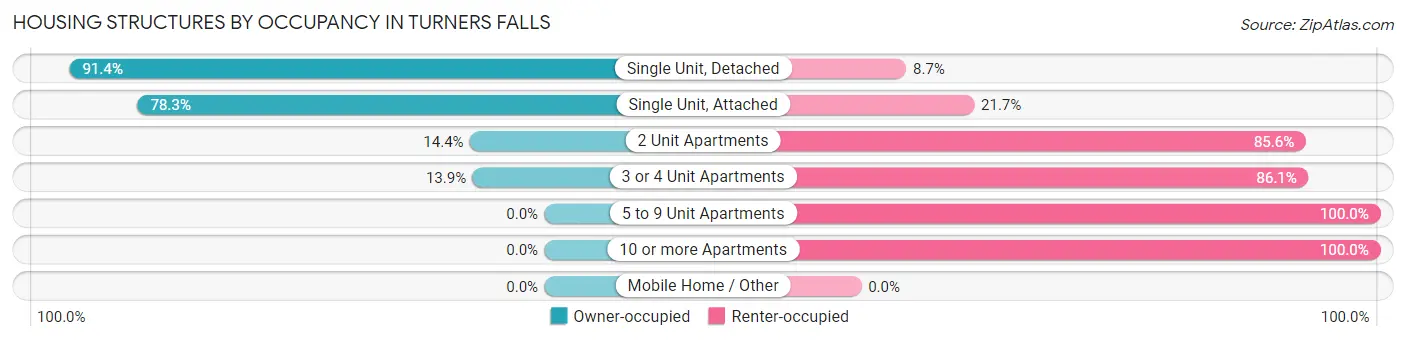
| Structure Type | Owner-occupied | Renter-occupied |
| Single Unit, Detached | 919 (91.3%) | 87 (8.6%) |
| Single Unit, Attached | 18 (78.3%) | 5 (21.7%) |
| 2 Unit Apartments | 56 (14.4%) | 334 (85.6%) |
| 3 or 4 Unit Apartments | 23 (13.9%) | 143 (86.1%) |
| 5 to 9 Unit Apartments | 0 (0.0%) | 232 (100.0%) |
| 10 or more Apartments | 0 (0.0%) | 130 (100.0%) |
| Mobile Home / Other | 0 (0.0%) | 0 (0.0%) |
| Total | 1,016 (52.2%) | 931 (47.8%) |
Housing Structures by Number of Rooms in Turners Falls
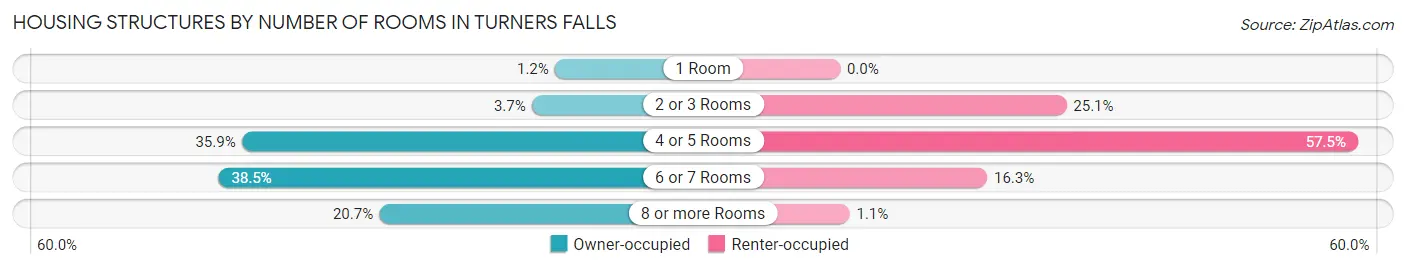
| Number of Rooms | Owner-occupied | Renter-occupied |
| 1 Room | 12 (1.2%) | 0 (0.0%) |
| 2 or 3 Rooms | 38 (3.7%) | 234 (25.1%) |
| 4 or 5 Rooms | 365 (35.9%) | 535 (57.5%) |
| 6 or 7 Rooms | 391 (38.5%) | 152 (16.3%) |
| 8 or more Rooms | 210 (20.7%) | 10 (1.1%) |
| Total | 1,016 (100.0%) | 931 (100.0%) |
Housing Structure by Heating Type in Turners Falls
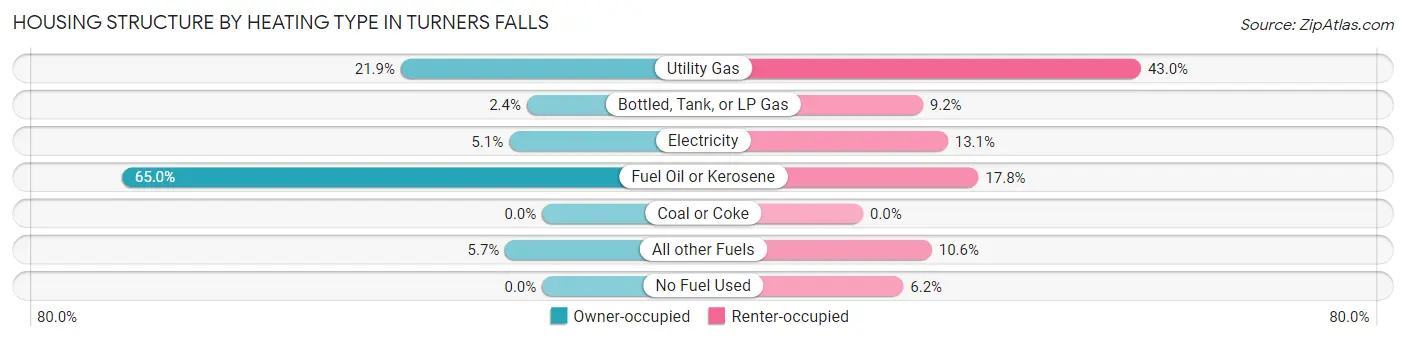
| Heating Type | Owner-occupied | Renter-occupied |
| Utility Gas | 222 (21.8%) | 400 (43.0%) |
| Bottled, Tank, or LP Gas | 24 (2.4%) | 86 (9.2%) |
| Electricity | 52 (5.1%) | 122 (13.1%) |
| Fuel Oil or Kerosene | 660 (65.0%) | 166 (17.8%) |
| Coal or Coke | 0 (0.0%) | 0 (0.0%) |
| All other Fuels | 58 (5.7%) | 99 (10.6%) |
| No Fuel Used | 0 (0.0%) | 58 (6.2%) |
| Total | 1,016 (100.0%) | 931 (100.0%) |
Household Vehicle Usage in Turners Falls
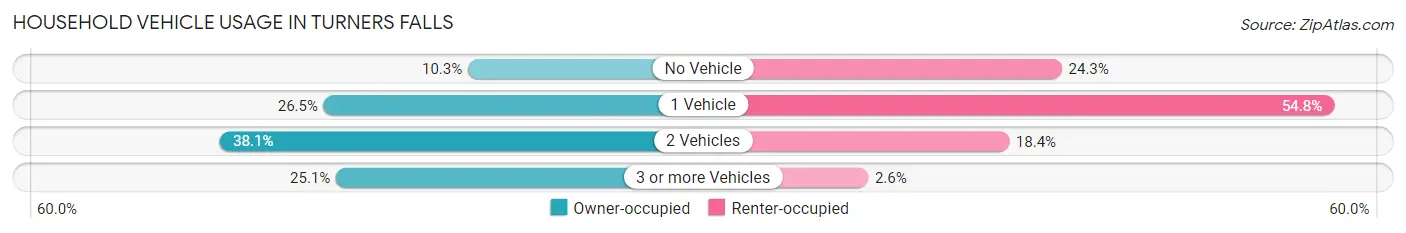
| Vehicles per Household | Owner-occupied | Renter-occupied |
| No Vehicle | 105 (10.3%) | 226 (24.3%) |
| 1 Vehicle | 269 (26.5%) | 510 (54.8%) |
| 2 Vehicles | 387 (38.1%) | 171 (18.4%) |
| 3 or more Vehicles | 255 (25.1%) | 24 (2.6%) |
| Total | 1,016 (100.0%) | 931 (100.0%) |
Real Estate & Mortgages in Turners Falls
Real Estate and Mortgage Overview in Turners Falls
| Characteristic | Without Mortgage | With Mortgage |
| Housing Units | 407 | 609 |
| Median Property Value | $230,000 | $229,600 |
| Median Household Income | $76,125 | $135 |
| Monthly Housing Costs | $631 | $12 |
| Real Estate Taxes | $3,693 | $0 |
Property Value by Mortgage Status in Turners Falls
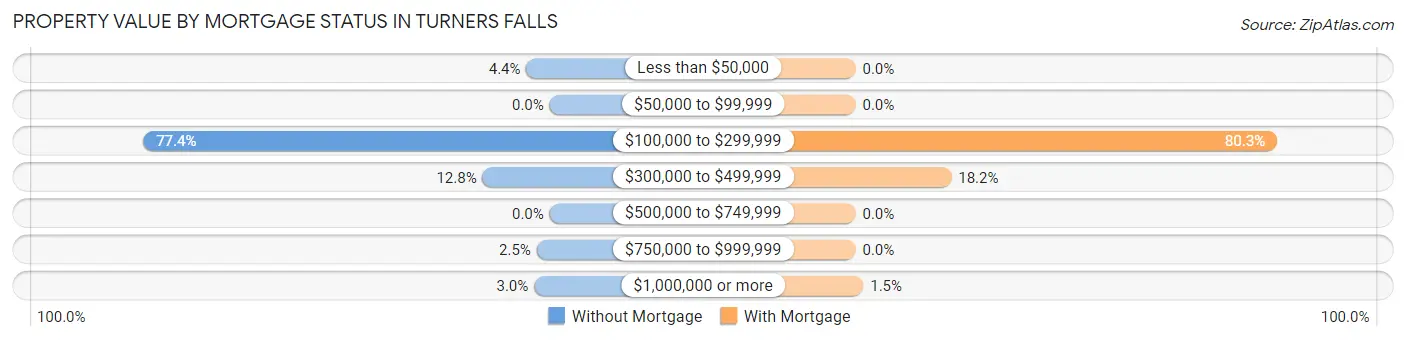
| Property Value | Without Mortgage | With Mortgage |
| Less than $50,000 | 18 (4.4%) | 0 (0.0%) |
| $50,000 to $99,999 | 0 (0.0%) | 0 (0.0%) |
| $100,000 to $299,999 | 315 (77.4%) | 489 (80.3%) |
| $300,000 to $499,999 | 52 (12.8%) | 111 (18.2%) |
| $500,000 to $749,999 | 0 (0.0%) | 0 (0.0%) |
| $750,000 to $999,999 | 10 (2.5%) | 0 (0.0%) |
| $1,000,000 or more | 12 (2.9%) | 9 (1.5%) |
| Total | 407 (100.0%) | 609 (100.0%) |
Household Income by Mortgage Status in Turners Falls
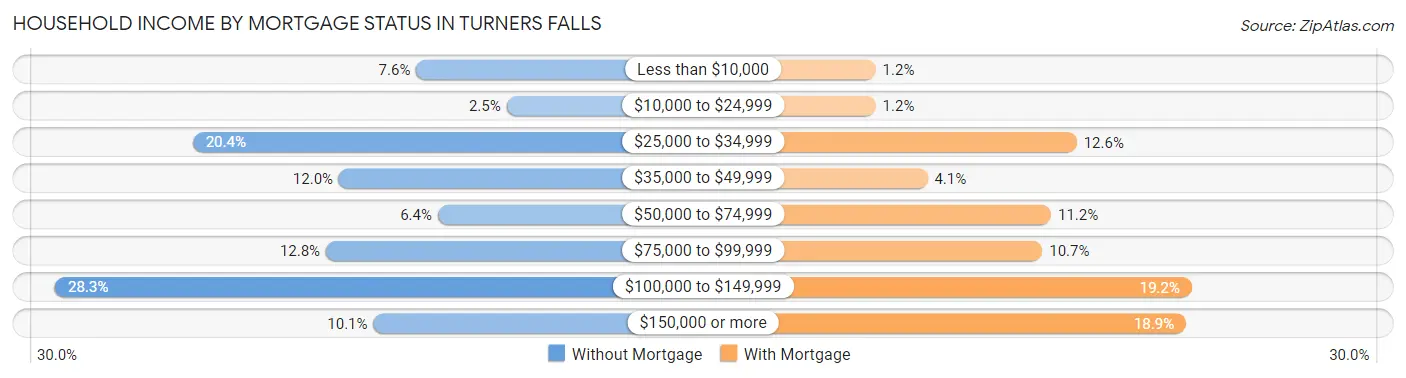
| Household Income | Without Mortgage | With Mortgage |
| Less than $10,000 | 31 (7.6%) | 7 (1.1%) |
| $10,000 to $24,999 | 10 (2.5%) | 7 (1.1%) |
| $25,000 to $34,999 | 83 (20.4%) | 77 (12.6%) |
| $35,000 to $49,999 | 49 (12.0%) | 25 (4.1%) |
| $50,000 to $74,999 | 26 (6.4%) | 68 (11.2%) |
| $75,000 to $99,999 | 52 (12.8%) | 65 (10.7%) |
| $100,000 to $149,999 | 115 (28.3%) | 117 (19.2%) |
| $150,000 or more | 41 (10.1%) | 115 (18.9%) |
| Total | 407 (100.0%) | 609 (100.0%) |
Property Value to Household Income Ratio in Turners Falls
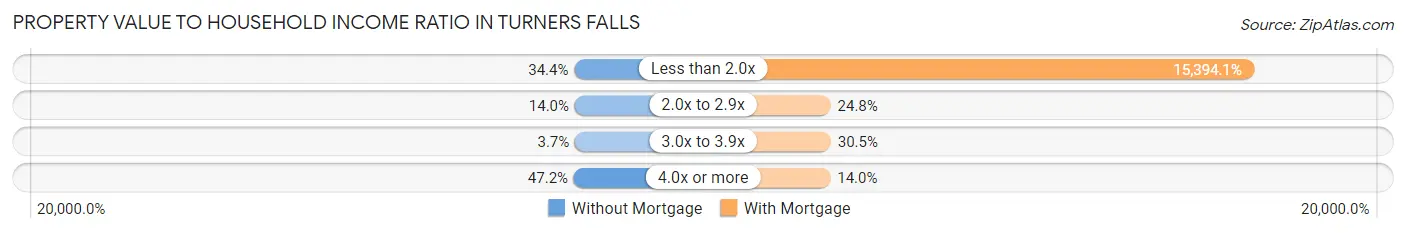
| Value-to-Income Ratio | Without Mortgage | With Mortgage |
| Less than 2.0x | 140 (34.4%) | 93,750 (15,394.1%) |
| 2.0x to 2.9x | 57 (14.0%) | 151 (24.8%) |
| 3.0x to 3.9x | 15 (3.7%) | 186 (30.5%) |
| 4.0x or more | 192 (47.2%) | 85 (14.0%) |
| Total | 407 (100.0%) | 609 (100.0%) |
Real Estate Taxes by Mortgage Status in Turners Falls
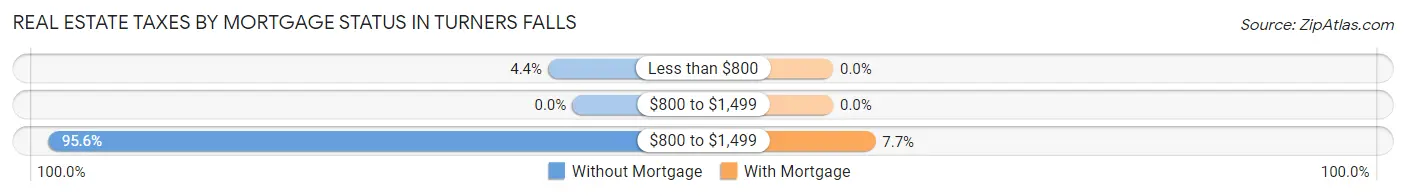
| Property Taxes | Without Mortgage | With Mortgage |
| Less than $800 | 18 (4.4%) | 0 (0.0%) |
| $800 to $1,499 | 0 (0.0%) | 0 (0.0%) |
| $800 to $1,499 | 389 (95.6%) | 47 (7.7%) |
| Total | 407 (100.0%) | 609 (100.0%) |
Health & Disability in Turners Falls
Health Insurance Coverage by Age in Turners Falls
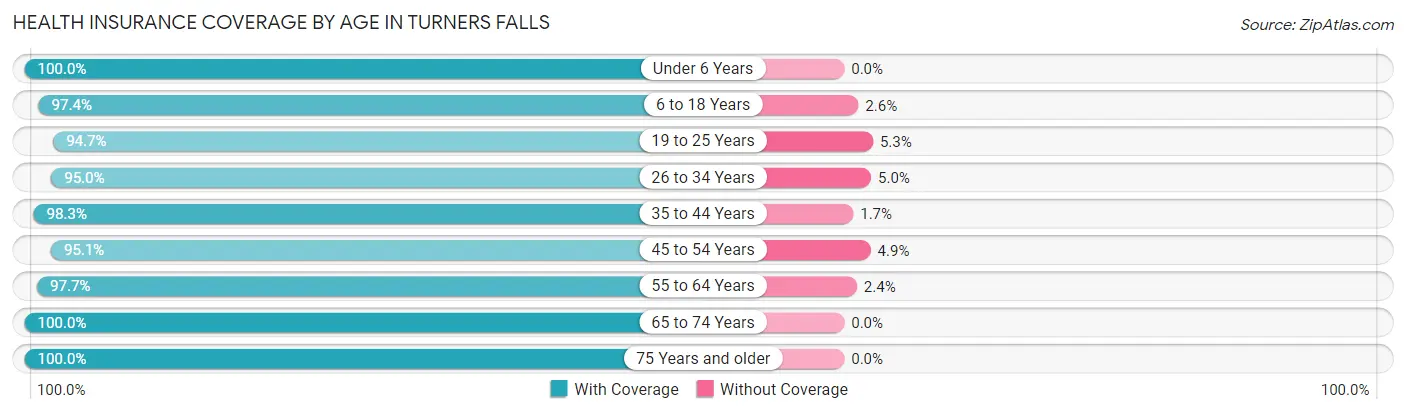
| Age Bracket | With Coverage | Without Coverage |
| Under 6 Years | 247 (100.0%) | 0 (0.0%) |
| 6 to 18 Years | 333 (97.4%) | 9 (2.6%) |
| 19 to 25 Years | 266 (94.7%) | 15 (5.3%) |
| 26 to 34 Years | 419 (95.0%) | 22 (5.0%) |
| 35 to 44 Years | 468 (98.3%) | 8 (1.7%) |
| 45 to 54 Years | 502 (95.1%) | 26 (4.9%) |
| 55 to 64 Years | 624 (97.7%) | 15 (2.4%) |
| 65 to 74 Years | 515 (100.0%) | 0 (0.0%) |
| 75 Years and older | 369 (100.0%) | 0 (0.0%) |
| Total | 3,743 (97.5%) | 95 (2.5%) |
Health Insurance Coverage by Citizenship Status in Turners Falls
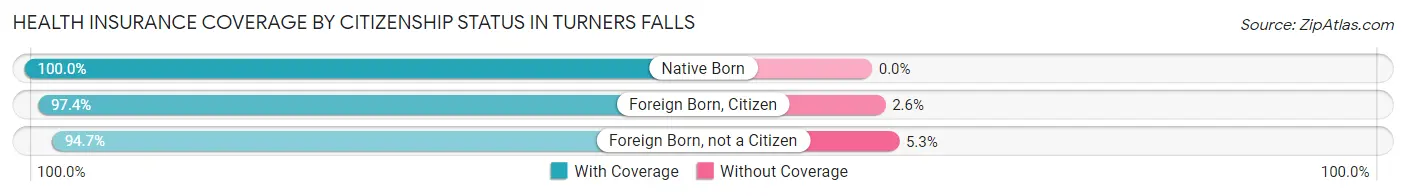
| Citizenship Status | With Coverage | Without Coverage |
| Native Born | 247 (100.0%) | 0 (0.0%) |
| Foreign Born, Citizen | 333 (97.4%) | 9 (2.6%) |
| Foreign Born, not a Citizen | 266 (94.7%) | 15 (5.3%) |
Health Insurance Coverage by Household Income in Turners Falls
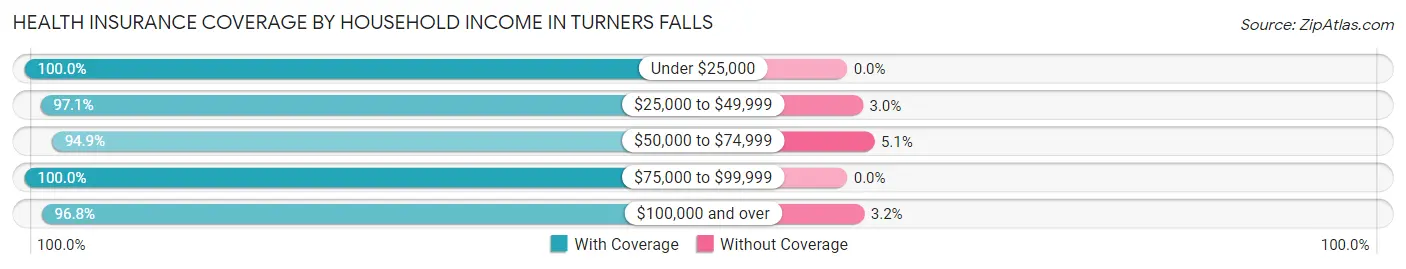
| Household Income | With Coverage | Without Coverage |
| Under $25,000 | 581 (100.0%) | 0 (0.0%) |
| $25,000 to $49,999 | 789 (97.1%) | 24 (2.9%) |
| $50,000 to $74,999 | 522 (94.9%) | 28 (5.1%) |
| $75,000 to $99,999 | 543 (100.0%) | 0 (0.0%) |
| $100,000 and over | 1,300 (96.8%) | 43 (3.2%) |
Public vs Private Health Insurance Coverage by Age in Turners Falls
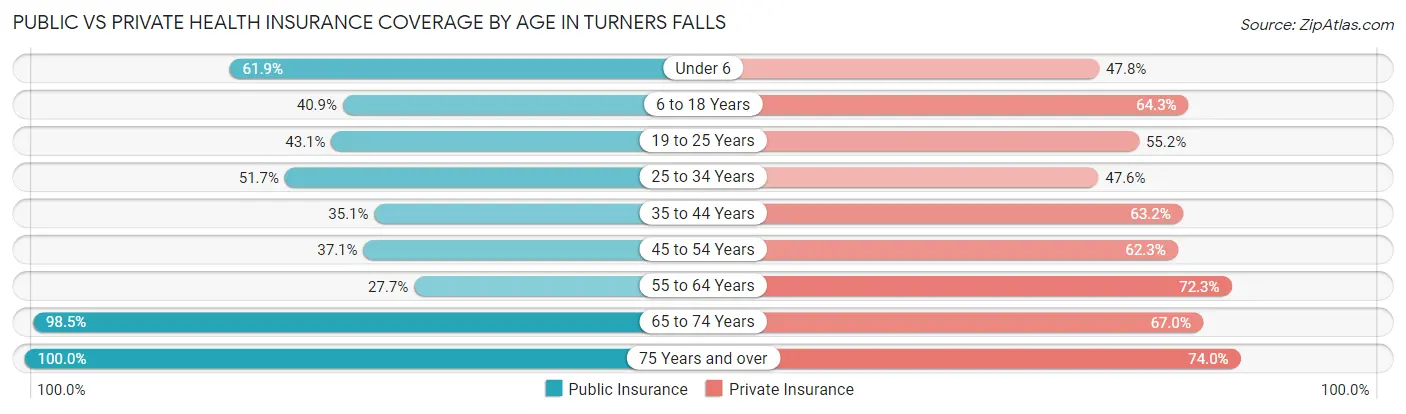
| Age Bracket | Public Insurance | Private Insurance |
| Under 6 | 153 (61.9%) | 118 (47.8%) |
| 6 to 18 Years | 140 (40.9%) | 220 (64.3%) |
| 19 to 25 Years | 121 (43.1%) | 155 (55.2%) |
| 25 to 34 Years | 228 (51.7%) | 210 (47.6%) |
| 35 to 44 Years | 167 (35.1%) | 301 (63.2%) |
| 45 to 54 Years | 196 (37.1%) | 329 (62.3%) |
| 55 to 64 Years | 177 (27.7%) | 462 (72.3%) |
| 65 to 74 Years | 507 (98.5%) | 345 (67.0%) |
| 75 Years and over | 369 (100.0%) | 273 (74.0%) |
| Total | 2,058 (53.6%) | 2,413 (62.9%) |
Disability Status by Sex by Age in Turners Falls
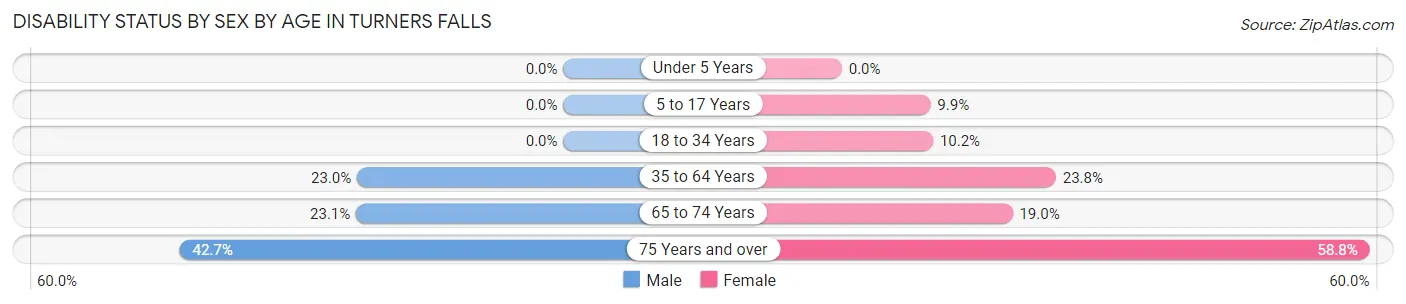
| Age Bracket | Male | Female |
| Under 5 Years | 0 (0.0%) | 0 (0.0%) |
| 5 to 17 Years | 0 (0.0%) | 15 (9.9%) |
| 18 to 34 Years | 0 (0.0%) | 40 (10.2%) |
| 35 to 64 Years | 201 (23.0%) | 183 (23.8%) |
| 65 to 74 Years | 63 (23.1%) | 46 (19.0%) |
| 75 Years and over | 53 (42.7%) | 144 (58.8%) |
Disability Class by Sex by Age in Turners Falls
Disability Class: Hearing Difficulty
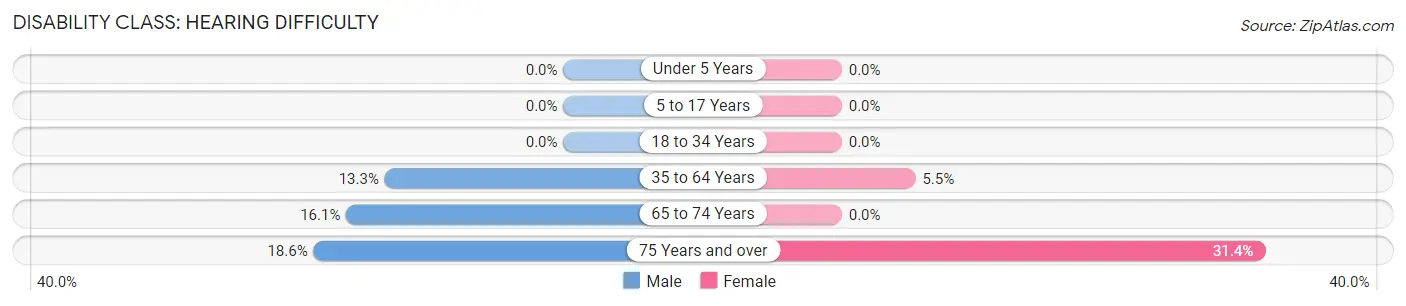
| Age Bracket | Male | Female |
| Under 5 Years | 0 (0.0%) | 0 (0.0%) |
| 5 to 17 Years | 0 (0.0%) | 0 (0.0%) |
| 18 to 34 Years | 0 (0.0%) | 0 (0.0%) |
| 35 to 64 Years | 116 (13.3%) | 42 (5.5%) |
| 65 to 74 Years | 44 (16.1%) | 0 (0.0%) |
| 75 Years and over | 23 (18.5%) | 77 (31.4%) |
Disability Class: Vision Difficulty
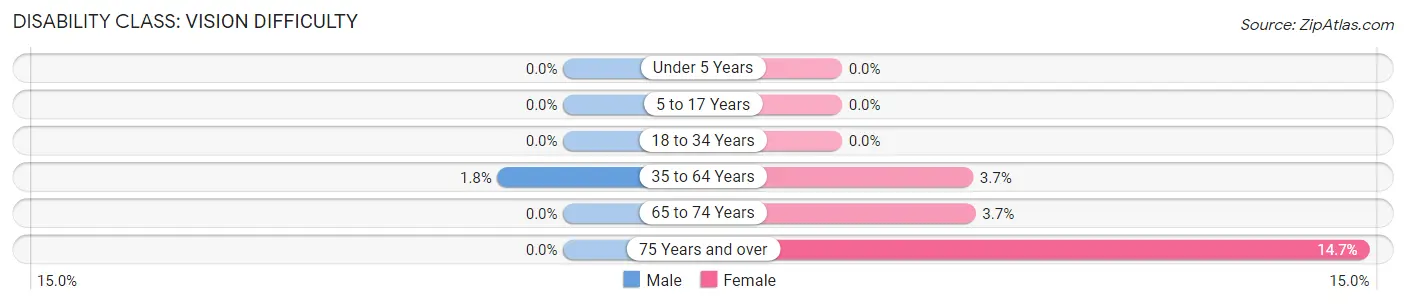
| Age Bracket | Male | Female |
| Under 5 Years | 0 (0.0%) | 0 (0.0%) |
| 5 to 17 Years | 0 (0.0%) | 0 (0.0%) |
| 18 to 34 Years | 0 (0.0%) | 0 (0.0%) |
| 35 to 64 Years | 16 (1.8%) | 28 (3.6%) |
| 65 to 74 Years | 0 (0.0%) | 9 (3.7%) |
| 75 Years and over | 0 (0.0%) | 36 (14.7%) |
Disability Class: Cognitive Difficulty
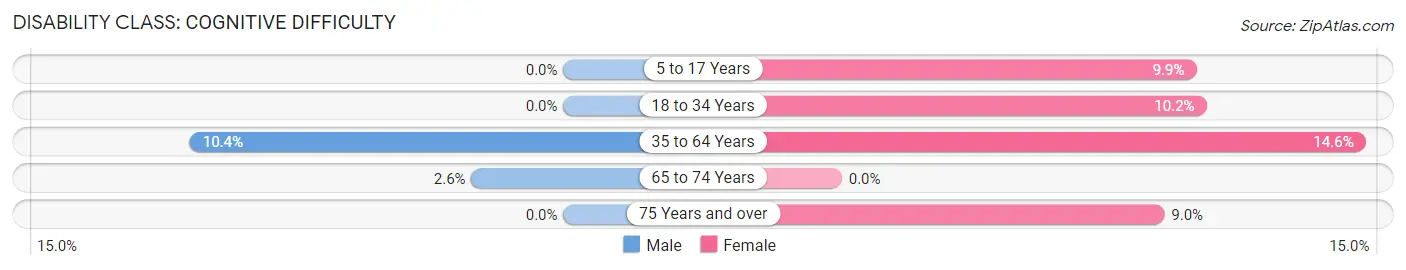
| Age Bracket | Male | Female |
| 5 to 17 Years | 0 (0.0%) | 15 (9.9%) |
| 18 to 34 Years | 0 (0.0%) | 40 (10.2%) |
| 35 to 64 Years | 91 (10.4%) | 112 (14.6%) |
| 65 to 74 Years | 7 (2.6%) | 0 (0.0%) |
| 75 Years and over | 0 (0.0%) | 22 (9.0%) |
Disability Class: Ambulatory Difficulty
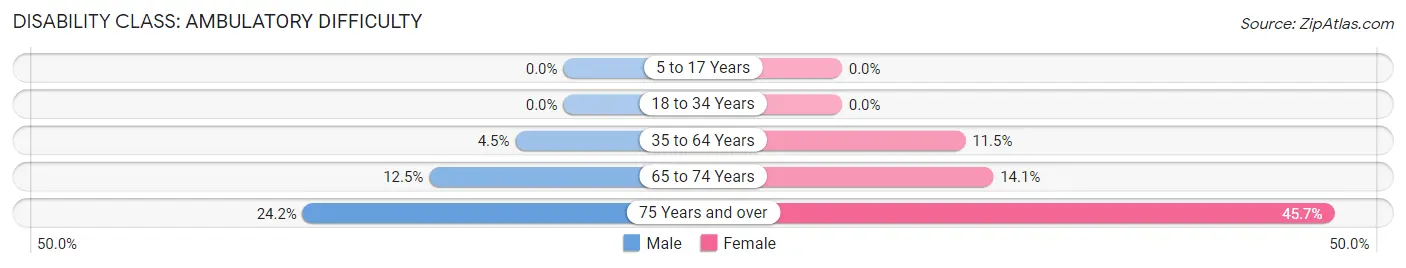
| Age Bracket | Male | Female |
| 5 to 17 Years | 0 (0.0%) | 0 (0.0%) |
| 18 to 34 Years | 0 (0.0%) | 0 (0.0%) |
| 35 to 64 Years | 39 (4.5%) | 88 (11.5%) |
| 65 to 74 Years | 34 (12.4%) | 34 (14.1%) |
| 75 Years and over | 30 (24.2%) | 112 (45.7%) |
Disability Class: Self-Care Difficulty
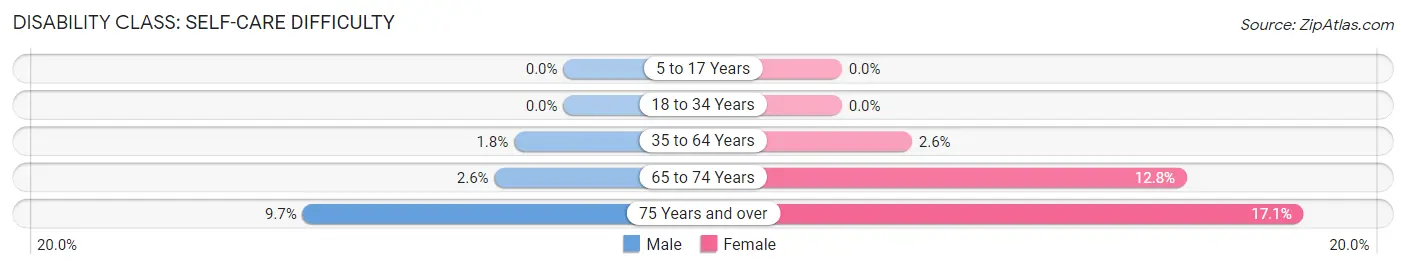
| Age Bracket | Male | Female |
| 5 to 17 Years | 0 (0.0%) | 0 (0.0%) |
| 18 to 34 Years | 0 (0.0%) | 0 (0.0%) |
| 35 to 64 Years | 16 (1.8%) | 20 (2.6%) |
| 65 to 74 Years | 7 (2.6%) | 31 (12.8%) |
| 75 Years and over | 12 (9.7%) | 42 (17.1%) |
Technology Access in Turners Falls
Computing Device Access in Turners Falls
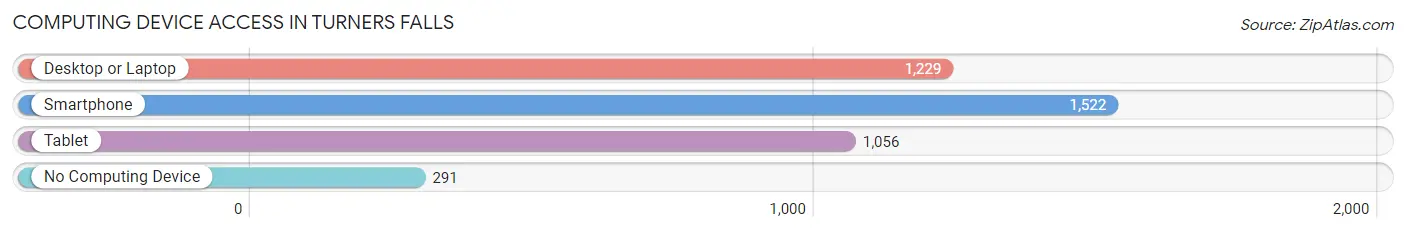
| Device Type | # Households | % Households |
| Desktop or Laptop | 1,229 | 63.1% |
| Smartphone | 1,522 | 78.2% |
| Tablet | 1,056 | 54.2% |
| No Computing Device | 291 | 14.9% |
| Total | 1,947 | 100.0% |
Internet Access in Turners Falls
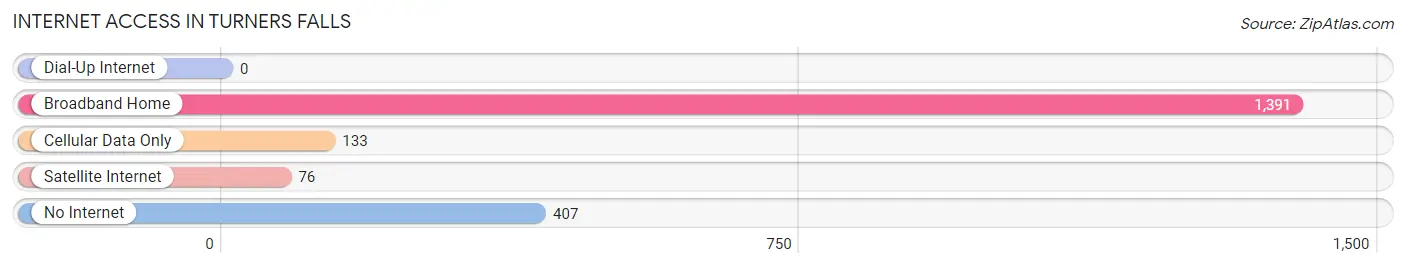
| Internet Type | # Households | % Households |
| Dial-Up Internet | 0 | 0.0% |
| Broadband Home | 1,391 | 71.4% |
| Cellular Data Only | 133 | 6.8% |
| Satellite Internet | 76 | 3.9% |
| No Internet | 407 | 20.9% |
| Total | 1,947 | 100.0% |
Turners Falls Summary
Turners Falls is a small town located in Franklin County, Massachusetts. It is situated on the Connecticut River, and is part of the Pioneer Valley region. The town was originally settled in 1719, and was named after Captain William Turner, who was a leader of the local militia during the French and Indian War. The town has a population of approximately 4,500 people, and is home to a variety of businesses, including a paper mill, a hydroelectric plant, and a number of small businesses.
History
Turners Falls was originally settled in 1719 by settlers from Deerfield, Massachusetts. The town was named after Captain William Turner, who was a leader of the local militia during the French and Indian War. The town was incorporated in 1786, and was an important industrial center in the 19th century. The town was home to a number of paper mills, a hydroelectric plant, and a variety of other businesses.
In the late 19th century, the town was home to a number of immigrants, including French Canadians, Irish, and Italians. The town was also home to a number of Native American tribes, including the Nipmuc, Pocumtuc, and Wampanoag.
Geography
Turners Falls is located in Franklin County, Massachusetts. It is situated on the Connecticut River, and is part of the Pioneer Valley region. The town is bordered by the towns of Montague to the north, Gill to the east, and Erving to the south. The town is approximately 25 miles north of Springfield, and is about 90 miles west of Boston.
The town has a total area of 4.2 square miles, of which 4.1 square miles is land and 0.1 square miles is water. The town is located in the Connecticut River Valley, and is surrounded by hills and mountains. The town is home to a number of parks and recreational areas, including the Great Falls Discovery Center, the Turners Falls Fish Ladder, and the Turners Falls Canal.
Economy
Turners Falls is home to a variety of businesses, including a paper mill, a hydroelectric plant, and a number of small businesses. The town is also home to a number of educational institutions, including the Turners Falls High School, the Pioneer Valley Performing Arts Charter Public School, and the Montague Center for Education.
The town is also home to a number of cultural and recreational attractions, including the Great Falls Discovery Center, the Turners Falls Fish Ladder, and the Turners Falls Canal. The town is also home to a number of festivals and events, including the Turners Falls Riverfest, the Turners Falls Summer Festival, and the Turners Falls Harvest Festival.
Demographics
As of the 2010 census, the town had a population of 4,470 people. The racial makeup of the town was 94.3% White, 1.2% African American, 0.5% Native American, 0.7% Asian, 0.1% Pacific Islander, 1.2% from other races, and 2.1% from two or more races. Hispanic or Latino of any race were 3.2% of the population.
The median income for a household in the town was $41,944, and the median income for a family was $50,917. The per capita income for the town was $20,945. About 11.2% of families and 14.2% of the population were below the poverty line, including 19.2% of those under age 18 and 8.2% of those age 65 or over.
Common Questions
What is Per Capita Income in Turners Falls?
Per Capita income in Turners Falls is $38,156.
What is the Median Family Income in Turners Falls?
Median Family Income in Turners Falls is $80,368.
What is the Median Household income in Turners Falls?
Median Household Income in Turners Falls is $53,306.
What is Income or Wage Gap in Turners Falls?
Income or Wage Gap in Turners Falls is 25.8%.
Women in Turners Falls earn 74.2 cents for every dollar earned by a man.
What is Inequality or Gini Index in Turners Falls?
Inequality or Gini Index in Turners Falls is 0.44.
What is the Total Population of Turners Falls?
Total Population of Turners Falls is 3,838.
What is the Total Male Population of Turners Falls?
Total Male Population of Turners Falls is 1,910.
What is the Total Female Population of Turners Falls?
Total Female Population of Turners Falls is 1,928.
What is the Ratio of Males per 100 Females in Turners Falls?
There are 99.07 Males per 100 Females in Turners Falls.
What is the Ratio of Females per 100 Males in Turners Falls?
There are 100.94 Females per 100 Males in Turners Falls.
What is the Median Population Age in Turners Falls?
Median Population Age in Turners Falls is 47.7 Years.
What is the Average Family Size in Turners Falls
Average Family Size in Turners Falls is 2.6 People.
What is the Average Household Size in Turners Falls
Average Household Size in Turners Falls is 2.0 People.
How Large is the Labor Force in Turners Falls?
There are 2,204 People in the Labor Forcein in Turners Falls.
What is the Percentage of People in the Labor Force in Turners Falls?
66.7% of People are in the Labor Force in Turners Falls.
What is the Unemployment Rate in Turners Falls?
Unemployment Rate in Turners Falls is 2.9%.