Cities with the Highest Percentage of Immigrants from Western Europe in Massachusetts
RELATED REPORTS & OPTIONS
Western Europe
Massachusetts
Compare Cities
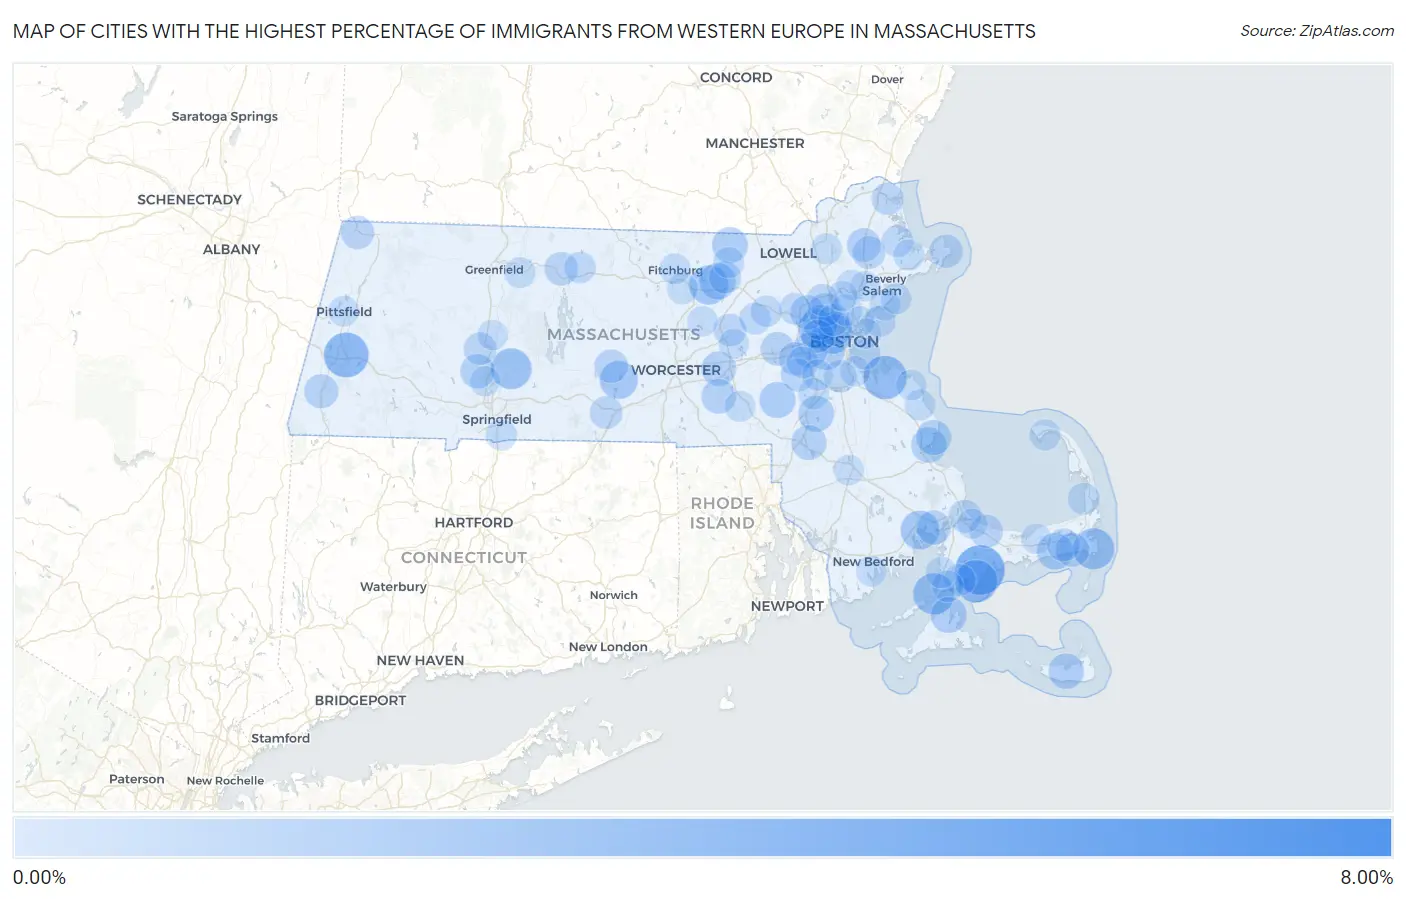
Map of Cities with the Highest Percentage of Immigrants from Western Europe in Massachusetts
0.00%
8.00%
Cities with the Highest Percentage of Immigrants from Western Europe in Massachusetts
| City | Western Europe | vs State | vs National | |
| 1. | West Warren | 6.17% | 0.37%(+5.80)#1 | 0.28%(+5.90)#86 |
| 2. | Mashpee Neck | 3.70% | 0.37%(+3.33)#2 | 0.28%(+3.42)#185 |
| 3. | Lee | 2.85% | 0.37%(+2.48)#3 | 0.28%(+2.57)#276 |
| 4. | Hingham | 2.62% | 0.37%(+2.25)#4 | 0.28%(+2.34)#329 |
| 5. | New Seabury | 2.44% | 0.37%(+2.07)#5 | 0.28%(+2.16)#366 |
| 6. | Woods Hole | 2.22% | 0.37%(+1.85)#6 | 0.28%(+1.94)#433 |
| 7. | Chatham | 2.20% | 0.37%(+1.83)#7 | 0.28%(+1.92)#440 |
| 8. | Granby | 2.13% | 0.37%(+1.75)#8 | 0.28%(+1.85)#464 |
| 9. | Cambridge | 1.99% | 0.37%(+1.61)#9 | 0.28%(+1.71)#519 |
| 10. | Shirley | 1.84% | 0.37%(+1.47)#10 | 0.28%(+1.56)#585 |
| 11. | Weweantic | 1.76% | 0.37%(+1.39)#11 | 0.28%(+1.48)#632 |
| 12. | Belmont | 1.74% | 0.37%(+1.37)#12 | 0.28%(+1.46)#636 |
| 13. | East Brookfield | 1.64% | 0.37%(+1.26)#13 | 0.28%(+1.36)#701 |
| 14. | Brookline | 1.47% | 0.37%(+1.09)#14 | 0.28%(+1.19)#814 |
| 15. | Dennis Port | 1.36% | 0.37%(+0.992)#15 | 0.28%(+1.08)#910 |
| 16. | Devens | 1.36% | 0.37%(+0.990)#16 | 0.28%(+1.08)#913 |
| 17. | Millis Clicquot | 1.29% | 0.37%(+0.921)#17 | 0.28%(+1.01)#989 |
| 18. | Sharon | 1.27% | 0.37%(+0.899)#18 | 0.28%(+0.991)#1,017 |
| 19. | Vineyard Haven | 1.27% | 0.37%(+0.896)#19 | 0.28%(+0.988)#1,019 |
| 20. | East Pepperell | 1.25% | 0.37%(+0.879)#20 | 0.28%(+0.971)#1,035 |
| 21. | Nantucket | 1.18% | 0.37%(+0.812)#21 | 0.28%(+0.904)#1,118 |
| 22. | South Duxbury | 1.14% | 0.37%(+0.773)#22 | 0.28%(+0.865)#1,181 |
| 23. | Duxbury | 1.14% | 0.37%(+0.764)#23 | 0.28%(+0.856)#1,190 |
| 24. | Newton | 1.11% | 0.37%(+0.735)#24 | 0.28%(+0.828)#1,233 |
| 25. | Mansfield Center | 1.11% | 0.37%(+0.734)#25 | 0.28%(+0.826)#1,235 |
| 26. | Arlington | 1.07% | 0.37%(+0.698)#26 | 0.28%(+0.790)#1,291 |
| 27. | Westborough | 1.05% | 0.37%(+0.678)#27 | 0.28%(+0.771)#1,326 |
| 28. | Upton | 1.04% | 0.37%(+0.669)#28 | 0.28%(+0.761)#1,353 |
| 29. | Somerville | 1.00% | 0.37%(+0.631)#29 | 0.28%(+0.724)#1,427 |
| 30. | Onset | 0.98% | 0.37%(+0.609)#30 | 0.28%(+0.701)#1,468 |
| 31. | Easthampton Town | 0.98% | 0.37%(+0.608)#31 | 0.28%(+0.700)#1,471 |
| 32. | Lexington | 0.97% | 0.37%(+0.599)#32 | 0.28%(+0.691)#1,489 |
| 33. | Great Barrington | 0.95% | 0.37%(+0.581)#33 | 0.28%(+0.673)#1,525 |
| 34. | Harwich Port | 0.93% | 0.37%(+0.561)#34 | 0.28%(+0.653)#1,570 |
| 35. | Boxford | 0.88% | 0.37%(+0.513)#35 | 0.28%(+0.605)#1,704 |
| 36. | Cochituate | 0.88% | 0.37%(+0.508)#36 | 0.28%(+0.600)#1,717 |
| 37. | Winchester | 0.87% | 0.37%(+0.501)#37 | 0.28%(+0.593)#1,735 |
| 38. | North Brookfield | 0.86% | 0.37%(+0.490)#38 | 0.28%(+0.582)#1,768 |
| 39. | Orange | 0.86% | 0.37%(+0.486)#39 | 0.28%(+0.578)#1,772 |
| 40. | Rockport | 0.83% | 0.37%(+0.458)#40 | 0.28%(+0.550)#1,840 |
| 41. | Williamstown | 0.80% | 0.37%(+0.429)#41 | 0.28%(+0.521)#1,927 |
| 42. | East Sandwich | 0.79% | 0.37%(+0.421)#42 | 0.28%(+0.513)#1,955 |
| 43. | Wellesley | 0.79% | 0.37%(+0.415)#43 | 0.28%(+0.508)#1,968 |
| 44. | Dover | 0.76% | 0.37%(+0.385)#44 | 0.28%(+0.477)#2,067 |
| 45. | Topsfield | 0.75% | 0.37%(+0.379)#45 | 0.28%(+0.471)#2,082 |
| 46. | Amherst | 0.74% | 0.37%(+0.371)#46 | 0.28%(+0.463)#2,107 |
| 47. | Northwest Harwich | 0.74% | 0.37%(+0.365)#47 | 0.28%(+0.457)#2,136 |
| 48. | Watertown Town | 0.73% | 0.37%(+0.362)#48 | 0.28%(+0.454)#2,146 |
| 49. | Sagamore | 0.73% | 0.37%(+0.360)#49 | 0.28%(+0.452)#2,156 |
| 50. | Fiskdale | 0.71% | 0.37%(+0.336)#50 | 0.28%(+0.428)#2,242 |
| 51. | Hudson | 0.67% | 0.37%(+0.300)#51 | 0.28%(+0.392)#2,372 |
| 52. | Northampton | 0.67% | 0.37%(+0.298)#52 | 0.28%(+0.390)#2,384 |
| 53. | Milton | 0.67% | 0.37%(+0.296)#53 | 0.28%(+0.389)#2,390 |
| 54. | Ayer | 0.61% | 0.37%(+0.235)#54 | 0.28%(+0.327)#2,720 |
| 55. | Woburn | 0.60% | 0.37%(+0.226)#55 | 0.28%(+0.318)#2,763 |
| 56. | Newburyport | 0.59% | 0.37%(+0.217)#56 | 0.28%(+0.309)#2,803 |
| 57. | Medford | 0.57% | 0.37%(+0.202)#57 | 0.28%(+0.294)#2,875 |
| 58. | North Eastham | 0.56% | 0.37%(+0.187)#58 | 0.28%(+0.279)#2,962 |
| 59. | Melrose | 0.54% | 0.37%(+0.168)#59 | 0.28%(+0.260)#3,066 |
| 60. | Ipswich | 0.53% | 0.37%(+0.162)#60 | 0.28%(+0.254)#3,104 |
| 61. | Maynard | 0.52% | 0.37%(+0.153)#61 | 0.28%(+0.246)#3,158 |
| 62. | Boston | 0.52% | 0.37%(+0.144)#62 | 0.28%(+0.236)#3,218 |
| 63. | Needham | 0.51% | 0.37%(+0.135)#63 | 0.28%(+0.228)#3,279 |
| 64. | Hanscom Afb | 0.50% | 0.37%(+0.133)#64 | 0.28%(+0.225)#3,297 |
| 65. | East Falmouth | 0.50% | 0.37%(+0.132)#65 | 0.28%(+0.224)#3,304 |
| 66. | Athol | 0.50% | 0.37%(+0.131)#66 | 0.28%(+0.224)#3,306 |
| 67. | West Concord | 0.50% | 0.37%(+0.125)#67 | 0.28%(+0.217)#3,355 |
| 68. | Falmouth | 0.49% | 0.37%(+0.118)#68 | 0.28%(+0.210)#3,405 |
| 69. | Norwood | 0.46% | 0.37%(+0.085)#69 | 0.28%(+0.177)#3,641 |
| 70. | Longmeadow | 0.45% | 0.37%(+0.078)#70 | 0.28%(+0.170)#3,691 |
| 71. | West Falmouth | 0.45% | 0.37%(+0.075)#71 | 0.28%(+0.167)#3,716 |
| 72. | Provincetown | 0.44% | 0.37%(+0.065)#72 | 0.28%(+0.158)#3,796 |
| 73. | Essex | 0.43% | 0.37%(+0.054)#73 | 0.28%(+0.146)#3,882 |
| 74. | Nahant | 0.42% | 0.37%(+0.048)#74 | 0.28%(+0.140)#3,929 |
| 75. | Leominster | 0.41% | 0.37%(+0.041)#75 | 0.28%(+0.133)#3,992 |
| 76. | Groton | 0.41% | 0.37%(+0.036)#76 | 0.28%(+0.128)#4,041 |
| 77. | Andover | 0.40% | 0.37%(+0.032)#77 | 0.28%(+0.124)#4,090 |
| 78. | Dedham | 0.40% | 0.37%(+0.030)#78 | 0.28%(+0.122)#4,102 |
| 79. | Swampscott | 0.39% | 0.37%(+0.019)#79 | 0.28%(+0.111)#4,230 |
| 80. | Marblehead | 0.38% | 0.37%(+0.007)#80 | 0.28%(+0.099)#4,348 |
| 81. | Millers Falls | 0.38% | 0.37%(+0.005)#81 | 0.28%(+0.098)#4,365 |
| 82. | Milford | 0.37% | 0.37%(-0.002)#82 | 0.28%(+0.091)#4,442 |
| 83. | Marshfield Hills | 0.37% | 0.37%(-0.005)#83 | 0.28%(+0.087)#4,477 |
| 84. | Fitchburg | 0.37% | 0.37%(-0.006)#84 | 0.28%(+0.086)#4,488 |
| 85. | Raynham Center | 0.35% | 0.37%(-0.017)#85 | 0.28%(+0.075)#4,620 |
| 86. | North Scituate | 0.33% | 0.37%(-0.037)#86 | 0.28%(+0.056)#4,835 |
| 87. | Quincy | 0.32% | 0.37%(-0.050)#87 | 0.28%(+0.043)#4,965 |
| 88. | Pittsfield | 0.32% | 0.37%(-0.054)#88 | 0.28%(+0.039)#5,010 |
| 89. | Clinton | 0.31% | 0.37%(-0.059)#89 | 0.28%(+0.033)#5,076 |
| 90. | Bliss Corner | 0.30% | 0.37%(-0.067)#90 | 0.28%(+0.025)#5,175 |
| 91. | Lynnfield | 0.30% | 0.37%(-0.070)#91 | 0.28%(+0.022)#5,194 |
| 92. | Hatfield | 0.30% | 0.37%(-0.071)#92 | 0.28%(+0.021)#5,216 |
| 93. | Peabody | 0.30% | 0.37%(-0.073)#93 | 0.28%(+0.020)#5,239 |
| 94. | Wakefield | 0.29% | 0.37%(-0.080)#94 | 0.28%(+0.013)#5,334 |
| 95. | Holyoke | 0.29% | 0.37%(-0.081)#95 | 0.28%(+0.011)#5,353 |
| 96. | Sandwich | 0.27% | 0.37%(-0.100)#96 | 0.28%(-0.008)#5,595 |
| 97. | Winthrop Town | 0.27% | 0.37%(-0.104)#97 | 0.28%(-0.011)#5,637 |
| 98. | Yarmouth Port | 0.27% | 0.37%(-0.104)#98 | 0.28%(-0.011)#5,638 |
| 99. | Revere | 0.27% | 0.37%(-0.104)#99 | 0.28%(-0.012)#5,646 |
| 100. | Marlborough | 0.26% | 0.37%(-0.108)#100 | 0.28%(-0.016)#5,700 |
Common Questions
What are the Top 10 Cities with the Highest Percentage of Immigrants from Western Europe in Massachusetts?
Top 10 Cities with the Highest Percentage of Immigrants from Western Europe in Massachusetts are:
#1
3.70%
#2
2.85%
#3
2.62%
#4
2.44%
#5
2.22%
#6
2.20%
#7
2.13%
#8
1.99%
#9
1.84%
#10
1.76%
What city has the Highest Percentage of Immigrants from Western Europe in Massachusetts?
Mashpee Neck has the Highest Percentage of Immigrants from Western Europe in Massachusetts with 3.70%.
What is the Percentage of Immigrants from Western Europe in the State of Massachusetts?
Percentage of Immigrants from Western Europe in Massachusetts is 0.37%.
What is the Percentage of Immigrants from Western Europe in the United States?
Percentage of Immigrants from Western Europe in the United States is 0.28%.