Cities with the Highest Percentage of Population Employed in Arts, Media & Entertainment in Massachusetts
RELATED REPORTS & OPTIONS
Arts, Media & Entertainment
Massachusetts
Compare Cities
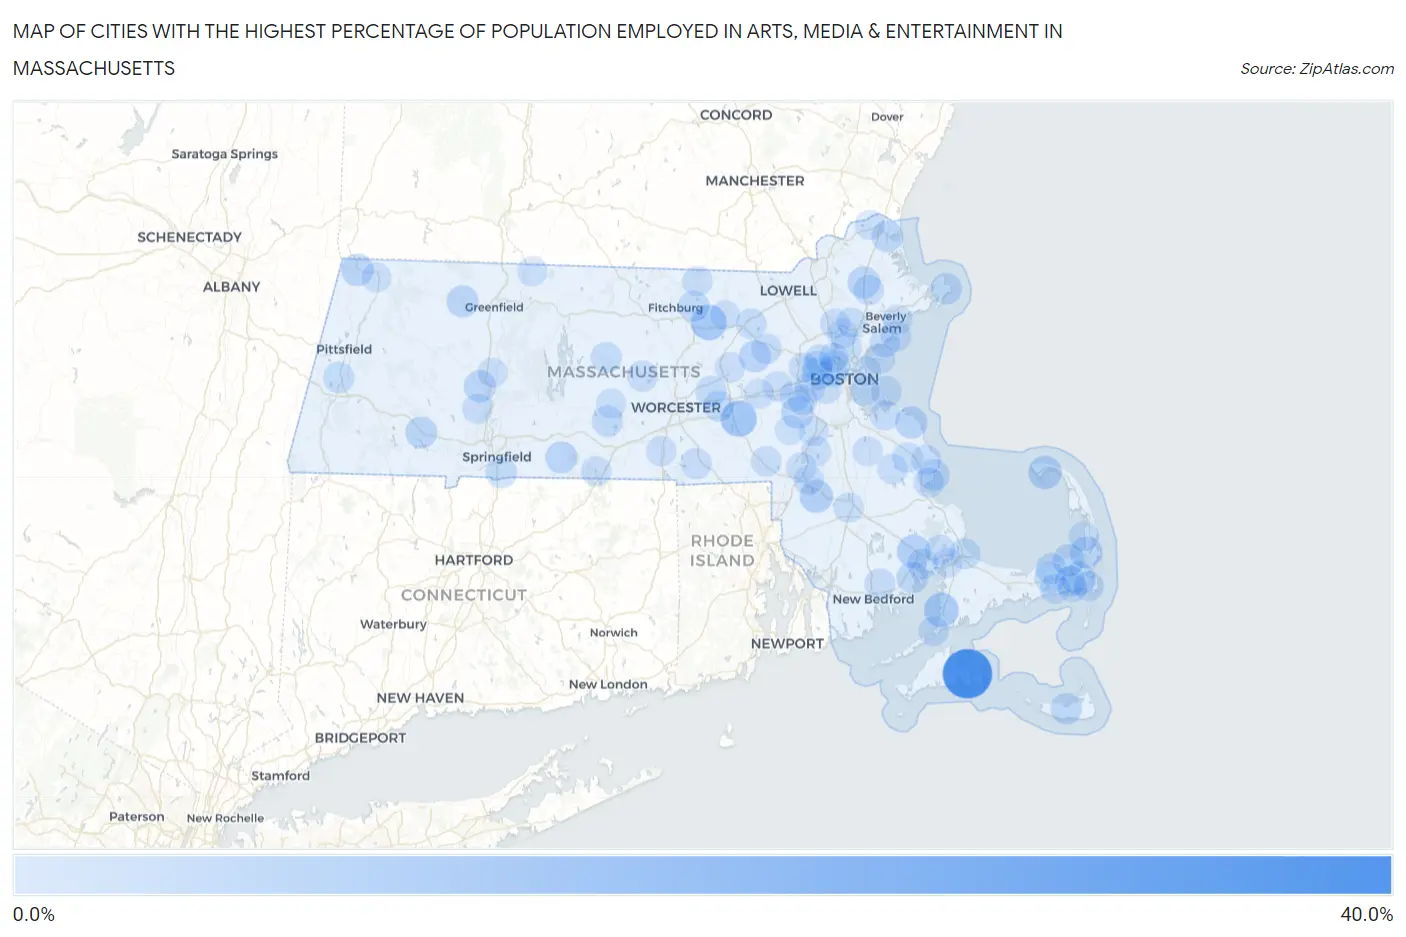
Map of Cities with the Highest Percentage of Population Employed in Arts, Media & Entertainment in Massachusetts
0.0%
40.0%
Cities with the Highest Percentage of Population Employed in Arts, Media & Entertainment in Massachusetts
| City | % Employed | vs State | vs National | |
| 1. | Edgartown | 35.9% | 2.4%(+33.5)#1 | 2.1%(+33.8)#35 |
| 2. | Hopkinton | 12.4% | 2.4%(+9.99)#2 | 2.1%(+10.3)#271 |
| 3. | Shirley | 11.6% | 2.4%(+9.27)#3 | 2.1%(+9.57)#303 |
| 4. | West Falmouth | 10.0% | 2.4%(+7.65)#4 | 2.1%(+7.95)#379 |
| 5. | West Wareham | 8.3% | 2.4%(+5.93)#5 | 2.1%(+6.23)#552 |
| 6. | Provincetown | 8.1% | 2.4%(+5.73)#6 | 2.1%(+6.03)#578 |
| 7. | East Harwich | 7.9% | 2.4%(+5.58)#7 | 2.1%(+5.88)#603 |
| 8. | Norton Center | 7.9% | 2.4%(+5.50)#8 | 2.1%(+5.80)#614 |
| 9. | Orleans | 6.6% | 2.4%(+4.29)#9 | 2.1%(+4.59)#865 |
| 10. | Williamstown | 6.5% | 2.4%(+4.10)#10 | 2.1%(+4.40)#918 |
| 11. | North Scituate | 6.4% | 2.4%(+4.00)#11 | 2.1%(+4.30)#950 |
| 12. | Boxford | 6.2% | 2.4%(+3.89)#12 | 2.1%(+4.19)#976 |
| 13. | Dover | 6.0% | 2.4%(+3.63)#13 | 2.1%(+3.93)#1,056 |
| 14. | Brewster | 5.9% | 2.4%(+3.57)#14 | 2.1%(+3.87)#1,082 |
| 15. | Northampton | 5.9% | 2.4%(+3.56)#15 | 2.1%(+3.86)#1,087 |
| 16. | Blandford | 5.6% | 2.4%(+3.26)#16 | 2.1%(+3.56)#1,197 |
| 17. | Monson Center | 5.6% | 2.4%(+3.25)#17 | 2.1%(+3.55)#1,203 |
| 18. | Shelburne Falls | 5.6% | 2.4%(+3.22)#18 | 2.1%(+3.52)#1,216 |
| 19. | Maynard | 5.6% | 2.4%(+3.21)#19 | 2.1%(+3.51)#1,220 |
| 20. | Marion Center | 5.4% | 2.4%(+3.05)#20 | 2.1%(+3.35)#1,308 |
| 21. | Duxbury | 5.4% | 2.4%(+3.05)#21 | 2.1%(+3.35)#1,309 |
| 22. | Newburyport | 5.3% | 2.4%(+2.92)#22 | 2.1%(+3.22)#1,374 |
| 23. | Nantucket | 5.1% | 2.4%(+2.75)#23 | 2.1%(+3.05)#1,456 |
| 24. | Rockport | 5.1% | 2.4%(+2.72)#24 | 2.1%(+3.02)#1,472 |
| 25. | Longmeadow | 5.0% | 2.4%(+2.63)#25 | 2.1%(+2.93)#1,527 |
| 26. | South Dennis | 4.9% | 2.4%(+2.50)#26 | 2.1%(+2.79)#1,609 |
| 27. | East Dennis | 4.8% | 2.4%(+2.48)#27 | 2.1%(+2.78)#1,631 |
| 28. | Lunenburg | 4.7% | 2.4%(+2.34)#28 | 2.1%(+2.64)#1,716 |
| 29. | Brookfield | 4.6% | 2.4%(+2.23)#29 | 2.1%(+2.52)#1,791 |
| 30. | Watertown Town | 4.5% | 2.4%(+2.18)#30 | 2.1%(+2.48)#1,830 |
| 31. | Somerville | 4.4% | 2.4%(+2.05)#31 | 2.1%(+2.35)#1,920 |
| 32. | Arlington | 4.4% | 2.4%(+2.03)#32 | 2.1%(+2.33)#1,941 |
| 33. | Lenox | 4.4% | 2.4%(+1.99)#33 | 2.1%(+2.29)#1,962 |
| 34. | Cambridge | 4.3% | 2.4%(+1.95)#34 | 2.1%(+2.25)#1,989 |
| 35. | Sagamore | 4.3% | 2.4%(+1.95)#35 | 2.1%(+2.25)#1,992 |
| 36. | Westborough | 4.3% | 2.4%(+1.95)#36 | 2.1%(+2.24)#1,994 |
| 37. | Northborough | 4.3% | 2.4%(+1.94)#37 | 2.1%(+2.24)#2,000 |
| 38. | Barre | 4.3% | 2.4%(+1.93)#38 | 2.1%(+2.23)#2,003 |
| 39. | Wareham Center | 4.2% | 2.4%(+1.83)#39 | 2.1%(+2.13)#2,092 |
| 40. | Belmont | 4.0% | 2.4%(+1.67)#40 | 2.1%(+1.97)#2,240 |
| 41. | Harwich Center | 3.9% | 2.4%(+1.55)#41 | 2.1%(+1.85)#2,356 |
| 42. | East Douglas | 3.9% | 2.4%(+1.53)#42 | 2.1%(+1.83)#2,376 |
| 43. | White Island Shores | 3.8% | 2.4%(+1.48)#43 | 2.1%(+1.78)#2,422 |
| 44. | Acushnet Center | 3.8% | 2.4%(+1.47)#44 | 2.1%(+1.77)#2,427 |
| 45. | Melrose | 3.8% | 2.4%(+1.45)#45 | 2.1%(+1.75)#2,452 |
| 46. | Hull | 3.8% | 2.4%(+1.41)#46 | 2.1%(+1.70)#2,518 |
| 47. | Littleton Common | 3.8% | 2.4%(+1.39)#47 | 2.1%(+1.69)#2,536 |
| 48. | Wellesley | 3.7% | 2.4%(+1.36)#48 | 2.1%(+1.66)#2,573 |
| 49. | Rutland | 3.7% | 2.4%(+1.34)#49 | 2.1%(+1.64)#2,598 |
| 50. | Hingham | 3.7% | 2.4%(+1.31)#50 | 2.1%(+1.60)#2,644 |
| 51. | Newton | 3.6% | 2.4%(+1.28)#51 | 2.1%(+1.58)#2,665 |
| 52. | Marblehead | 3.6% | 2.4%(+1.21)#52 | 2.1%(+1.51)#2,759 |
| 53. | Greenfield | 3.4% | 2.4%(+1.08)#53 | 2.1%(+1.37)#2,946 |
| 54. | West Concord | 3.4% | 2.4%(+1.03)#54 | 2.1%(+1.33)#3,009 |
| 55. | Franklin Town | 3.4% | 2.4%(+1.01)#55 | 2.1%(+1.31)#3,044 |
| 56. | Wakefield | 3.3% | 2.4%(+0.970)#56 | 2.1%(+1.27)#3,102 |
| 57. | North Pembroke | 3.3% | 2.4%(+0.944)#57 | 2.1%(+1.24)#3,148 |
| 58. | Foxborough | 3.3% | 2.4%(+0.943)#58 | 2.1%(+1.24)#3,151 |
| 59. | Hanson | 3.3% | 2.4%(+0.934)#59 | 2.1%(+1.23)#3,168 |
| 60. | Hudson | 3.2% | 2.4%(+0.876)#60 | 2.1%(+1.17)#3,273 |
| 61. | Nahant | 3.2% | 2.4%(+0.873)#61 | 2.1%(+1.17)#3,276 |
| 62. | West Chatham | 3.2% | 2.4%(+0.861)#62 | 2.1%(+1.16)#3,298 |
| 63. | Marshfield | 3.2% | 2.4%(+0.856)#63 | 2.1%(+1.15)#3,310 |
| 64. | Brookline | 3.2% | 2.4%(+0.855)#64 | 2.1%(+1.15)#3,316 |
| 65. | South Duxbury | 3.2% | 2.4%(+0.848)#65 | 2.1%(+1.15)#3,328 |
| 66. | Topsfield | 3.2% | 2.4%(+0.840)#66 | 2.1%(+1.14)#3,345 |
| 67. | Easthampton Town | 3.2% | 2.4%(+0.830)#67 | 2.1%(+1.13)#3,366 |
| 68. | Oxford | 3.2% | 2.4%(+0.819)#68 | 2.1%(+1.12)#3,383 |
| 69. | Dennis Port | 3.2% | 2.4%(+0.807)#69 | 2.1%(+1.11)#3,417 |
| 70. | Woods Hole | 3.1% | 2.4%(+0.773)#70 | 2.1%(+1.07)#3,465 |
| 71. | North Eastham | 3.1% | 2.4%(+0.761)#71 | 2.1%(+1.06)#3,491 |
| 72. | Boston | 3.1% | 2.4%(+0.703)#72 | 2.1%(+1.00)#3,591 |
| 73. | Needham | 3.0% | 2.4%(+0.658)#73 | 2.1%(+0.957)#3,675 |
| 74. | Holland | 3.0% | 2.4%(+0.597)#74 | 2.1%(+0.895)#3,793 |
| 75. | North Brookfield | 2.9% | 2.4%(+0.545)#75 | 2.1%(+0.844)#3,906 |
| 76. | Reading | 2.9% | 2.4%(+0.524)#76 | 2.1%(+0.823)#3,958 |
| 77. | Swampscott | 2.9% | 2.4%(+0.524)#77 | 2.1%(+0.823)#3,959 |
| 78. | Lynnfield | 2.9% | 2.4%(+0.519)#78 | 2.1%(+0.818)#3,970 |
| 79. | Raynham Center | 2.9% | 2.4%(+0.513)#79 | 2.1%(+0.812)#3,978 |
| 80. | Mansfield Center | 2.9% | 2.4%(+0.491)#80 | 2.1%(+0.790)#4,046 |
| 81. | Waltham | 2.8% | 2.4%(+0.486)#81 | 2.1%(+0.784)#4,058 |
| 82. | Winthrop Town | 2.8% | 2.4%(+0.450)#82 | 2.1%(+0.749)#4,154 |
| 83. | Townsend | 2.8% | 2.4%(+0.444)#83 | 2.1%(+0.743)#4,165 |
| 84. | Northfield | 2.8% | 2.4%(+0.408)#84 | 2.1%(+0.707)#4,243 |
| 85. | Cedar Crest | 2.7% | 2.4%(+0.390)#85 | 2.1%(+0.689)#4,287 |
| 86. | Beverly | 2.7% | 2.4%(+0.375)#86 | 2.1%(+0.673)#4,328 |
| 87. | Cochituate | 2.7% | 2.4%(+0.372)#87 | 2.1%(+0.671)#4,338 |
| 88. | Abington | 2.7% | 2.4%(+0.369)#88 | 2.1%(+0.668)#4,348 |
| 89. | Amherst | 2.7% | 2.4%(+0.353)#89 | 2.1%(+0.652)#4,389 |
| 90. | Sharon | 2.7% | 2.4%(+0.349)#90 | 2.1%(+0.647)#4,401 |
| 91. | Norwood | 2.7% | 2.4%(+0.318)#91 | 2.1%(+0.617)#4,481 |
| 92. | Ayer | 2.7% | 2.4%(+0.299)#92 | 2.1%(+0.598)#4,523 |
| 93. | Buzzards Bay | 2.6% | 2.4%(+0.272)#93 | 2.1%(+0.571)#4,594 |
| 94. | Medfield | 2.6% | 2.4%(+0.238)#94 | 2.1%(+0.537)#4,679 |
| 95. | Framingham | 2.6% | 2.4%(+0.231)#95 | 2.1%(+0.529)#4,710 |
| 96. | Harwich Port | 2.6% | 2.4%(+0.222)#96 | 2.1%(+0.520)#4,737 |
| 97. | Hatfield | 2.6% | 2.4%(+0.201)#97 | 2.1%(+0.500)#4,799 |
| 98. | Medford | 2.5% | 2.4%(+0.171)#98 | 2.1%(+0.469)#4,874 |
| 99. | Amesbury Town | 2.5% | 2.4%(+0.154)#99 | 2.1%(+0.453)#4,936 |
| 100. | North Adams | 2.5% | 2.4%(+0.143)#100 | 2.1%(+0.442)#4,968 |
Common Questions
What are the Top 10 Cities with the Highest Percentage of Population Employed in Arts, Media & Entertainment in Massachusetts?
Top 10 Cities with the Highest Percentage of Population Employed in Arts, Media & Entertainment in Massachusetts are:
#1
35.9%
#2
12.4%
#3
11.6%
#4
10.0%
#5
8.3%
#6
8.1%
#7
7.9%
#8
7.9%
#9
6.6%
#10
6.5%
What city has the Highest Percentage of Population Employed in Arts, Media & Entertainment in Massachusetts?
Edgartown has the Highest Percentage of Population Employed in Arts, Media & Entertainment in Massachusetts with 35.9%.
What is the Percentage of Population Employed in Arts, Media & Entertainment in the State of Massachusetts?
Percentage of Population Employed in Arts, Media & Entertainment in Massachusetts is 2.4%.
What is the Percentage of Population Employed in Arts, Media & Entertainment in the United States?
Percentage of Population Employed in Arts, Media & Entertainment in the United States is 2.1%.