Wilbraham, MA Map & Demographics
Wilbraham Map
Wilbraham Overview
$45,039
PER CAPITA INCOME
$121,000
AVG FAMILY INCOME
$97,891
AVG HOUSEHOLD INCOME
8.2%
WAGE / INCOME GAP [ % ]
91.8¢/ $1
WAGE / INCOME GAP [ $ ]
0.44
INEQUALITY / GINI INDEX
3,839
TOTAL POPULATION
1,829
MALE POPULATION
2,010
FEMALE POPULATION
91.00
MALES / 100 FEMALES
109.90
FEMALES / 100 MALES
54.3
MEDIAN AGE
3.0
AVG FAMILY SIZE
2.5
AVG HOUSEHOLD SIZE
1,693
LABOR FORCE [ PEOPLE ]
52.5%
PERCENT IN LABOR FORCE
3.8%
UNEMPLOYMENT RATE
Wilbraham Zip Codes
Wilbraham Area Codes
Income in Wilbraham
Income Overview in Wilbraham
Per Capita Income in Wilbraham is $45,039, while median incomes of families and households are $121,000 and $97,891 respectively.
| Characteristic | Number | Measure |
| Per Capita Income | 3,839 | $45,039 |
| Median Family Income | 1,016 | $121,000 |
| Mean Family Income | 1,016 | $142,928 |
| Median Household Income | 1,402 | $97,891 |
| Mean Household Income | 1,402 | $119,427 |
| Income Deficit | 1,016 | $0 |
| Wage / Income Gap (%) | 3,839 | 8.20% |
| Wage / Income Gap ($) | 3,839 | 91.80¢ per $1 |
| Gini / Inequality Index | 3,839 | 0.44 |
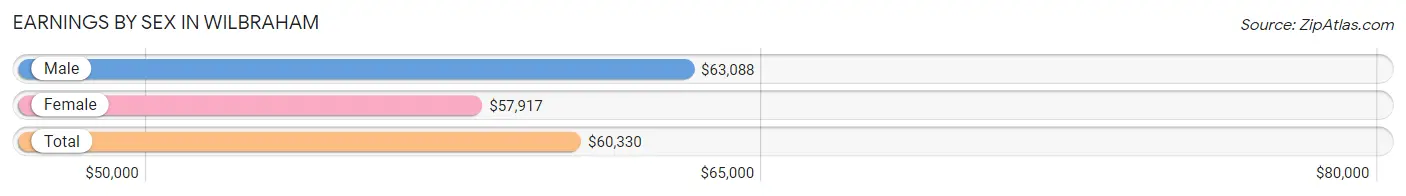
Earnings by Sex in Wilbraham
Average Earnings in Wilbraham are $60,330, $63,088 for men and $57,917 for women, a difference of 8.2%.
| Sex | Number | Average Earnings |
| Male | 806 (45.2%) | $63,088 |
| Female | 978 (54.8%) | $57,917 |
| Total | 1,784 (100.0%) | $60,330 |
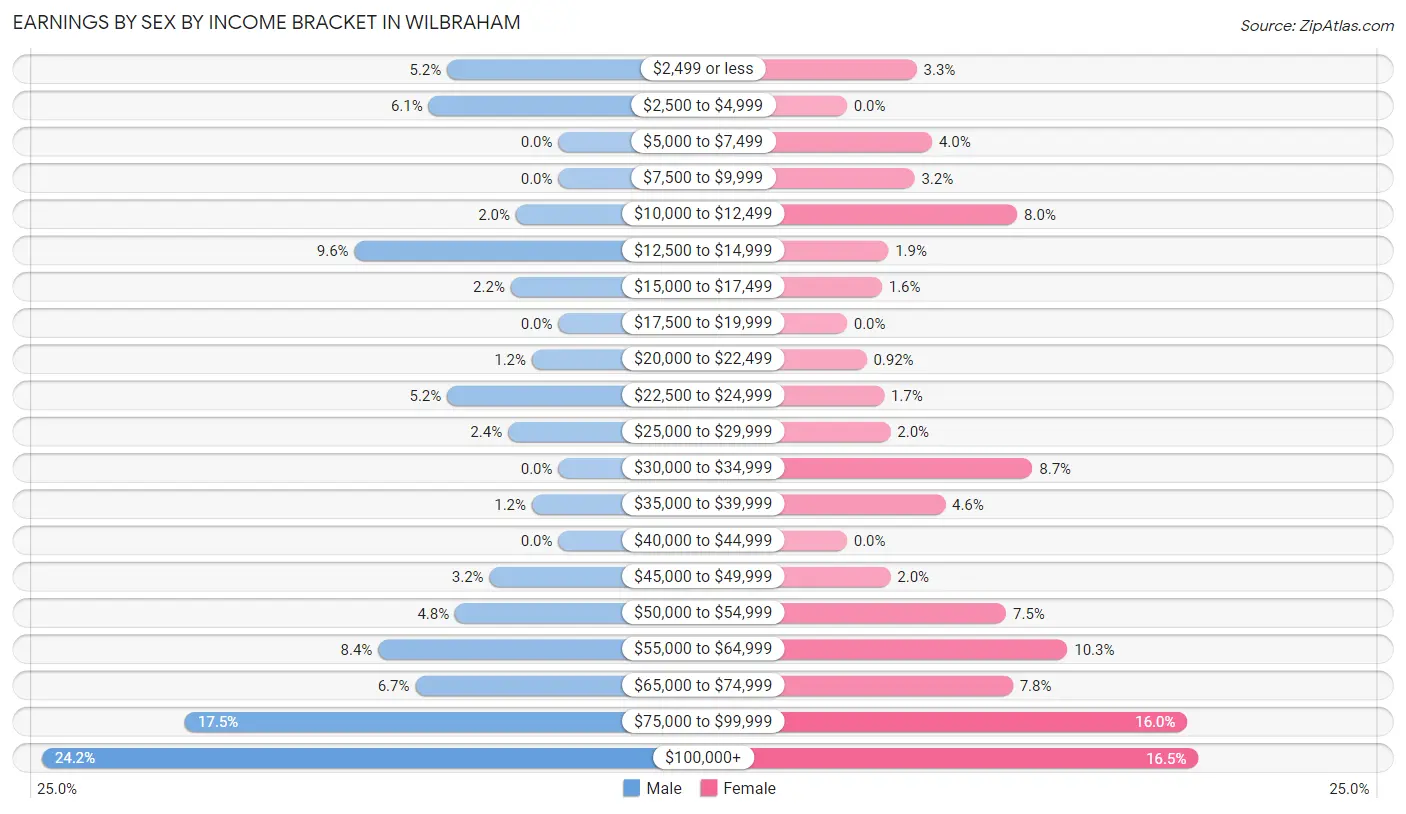
Earnings by Sex by Income Bracket in Wilbraham
The most common earnings brackets in Wilbraham are $100,000+ for men (195 | 24.2%) and $100,000+ for women (161 | 16.5%).
| Income | Male | Female |
| $2,499 or less | 42 (5.2%) | 32 (3.3%) |
| $2,500 to $4,999 | 49 (6.1%) | 0 (0.0%) |
| $5,000 to $7,499 | 0 (0.0%) | 39 (4.0%) |
| $7,500 to $9,999 | 0 (0.0%) | 31 (3.2%) |
| $10,000 to $12,499 | 16 (2.0%) | 78 (8.0%) |
| $12,500 to $14,999 | 77 (9.6%) | 19 (1.9%) |
| $15,000 to $17,499 | 18 (2.2%) | 16 (1.6%) |
| $17,500 to $19,999 | 0 (0.0%) | 0 (0.0%) |
| $20,000 to $22,499 | 10 (1.2%) | 9 (0.9%) |
| $22,500 to $24,999 | 42 (5.2%) | 17 (1.7%) |
| $25,000 to $29,999 | 19 (2.4%) | 20 (2.0%) |
| $30,000 to $34,999 | 0 (0.0%) | 85 (8.7%) |
| $35,000 to $39,999 | 10 (1.2%) | 45 (4.6%) |
| $40,000 to $44,999 | 0 (0.0%) | 0 (0.0%) |
| $45,000 to $49,999 | 26 (3.2%) | 20 (2.0%) |
| $50,000 to $54,999 | 39 (4.8%) | 73 (7.5%) |
| $55,000 to $64,999 | 68 (8.4%) | 101 (10.3%) |
| $65,000 to $74,999 | 54 (6.7%) | 76 (7.8%) |
| $75,000 to $99,999 | 141 (17.5%) | 156 (16.0%) |
| $100,000+ | 195 (24.2%) | 161 (16.5%) |
| Total | 806 (100.0%) | 978 (100.0%) |
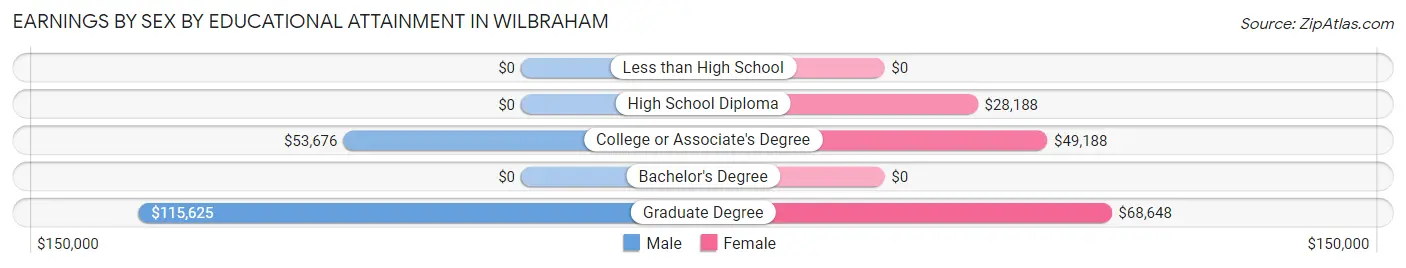
Earnings by Sex by Educational Attainment in Wilbraham
Average earnings in Wilbraham are $69,479 for men and $60,616 for women, a difference of 12.8%. Men with an educational attainment of graduate degree enjoy the highest average annual earnings of $115,625, while those with college or associate's degree education earn the least with $53,676. Women with an educational attainment of graduate degree earn the most with the average annual earnings of $68,648, while those with high school diploma education have the smallest earnings of $28,188.
| Educational Attainment | Male Income | Female Income |
| Less than High School | - | - |
| High School Diploma | - | - |
| College or Associate's Degree | $53,676 | $49,188 |
| Bachelor's Degree | - | - |
| Graduate Degree | $115,625 | $68,648 |
| Total | $69,479 | $60,616 |
Family Income in Wilbraham
Family Income Brackets in Wilbraham
According to the Wilbraham family income data, there are 236 families falling into the $200,000+ income range, which is the most common income bracket and makes up 23.2% of all families.
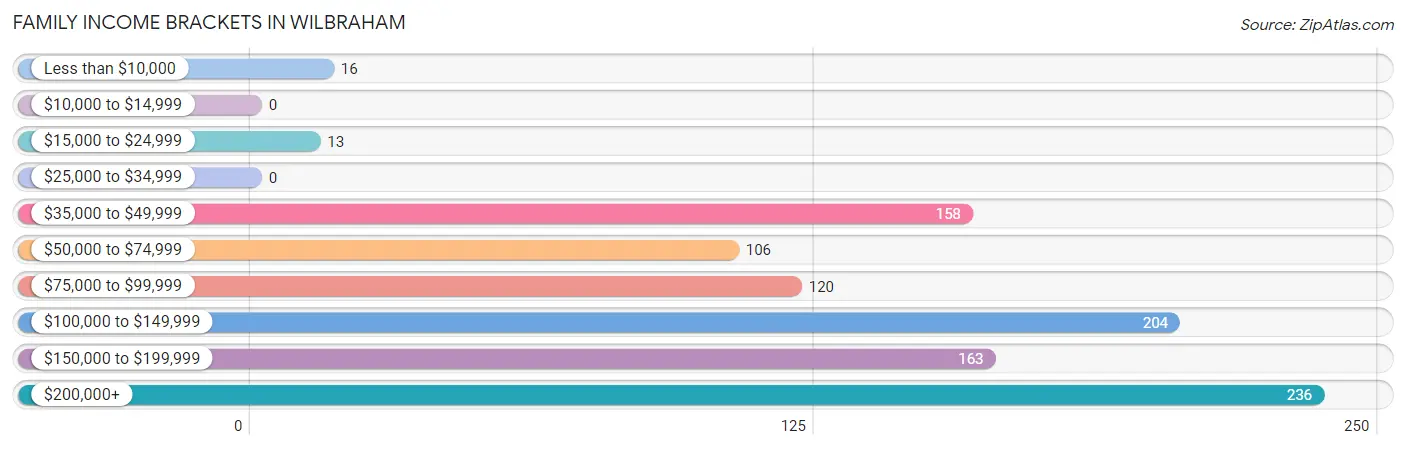
| Income Bracket | # Families | % Families |
| Less than $10,000 | 16 | 1.6% |
| $10,000 to $14,999 | 0 | 0.0% |
| $15,000 to $24,999 | 13 | 1.3% |
| $25,000 to $34,999 | 0 | 0.0% |
| $35,000 to $49,999 | 158 | 15.6% |
| $50,000 to $74,999 | 106 | 10.4% |
| $75,000 to $99,999 | 120 | 11.8% |
| $100,000 to $149,999 | 204 | 20.1% |
| $150,000 to $199,999 | 163 | 16.0% |
| $200,000+ | 236 | 23.2% |
Family Income by Famaliy Size in Wilbraham
5-person families (52 | 5.1%) account for the highest median family income in Wilbraham with $215,833 per family, while 3-person families (308 | 30.3%) have the highest median income of $63,690 per family member.
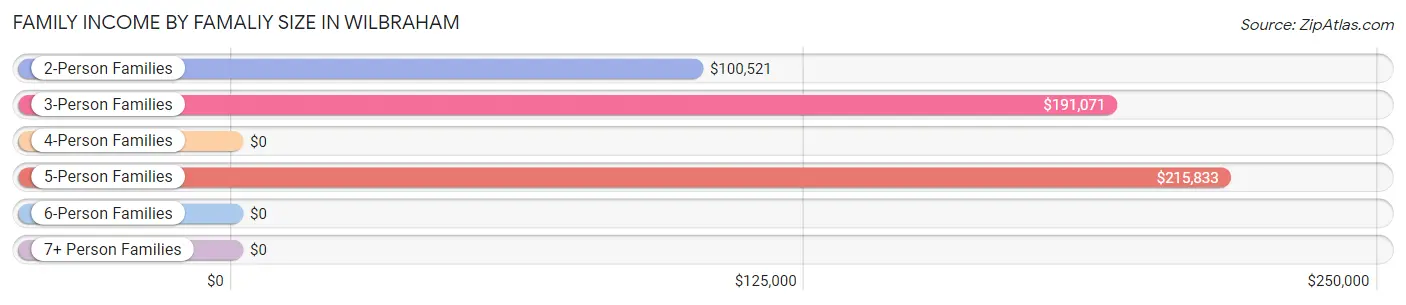
| Income Bracket | # Families | Median Income |
| 2-Person Families | 480 (47.2%) | $100,521 |
| 3-Person Families | 308 (30.3%) | $191,071 |
| 4-Person Families | 163 (16.0%) | $0 |
| 5-Person Families | 52 (5.1%) | $215,833 |
| 6-Person Families | 13 (1.3%) | $0 |
| 7+ Person Families | 0 (0.0%) | $0 |
| Total | 1,016 (100.0%) | $121,000 |
Family Income by Number of Earners in Wilbraham
The median family income in Wilbraham is $121,000, with families comprising 3+ earners (123) having the highest median family income of $216,250, while families with no earners (212) have the lowest median family income of $76,579, accounting for 12.1% and 20.9% of families, respectively.
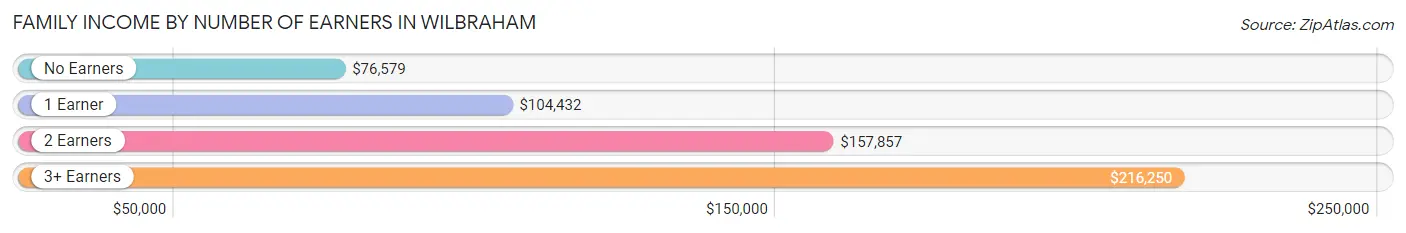
| Number of Earners | # Families | Median Income |
| No Earners | 212 (20.9%) | $76,579 |
| 1 Earner | 247 (24.3%) | $104,432 |
| 2 Earners | 434 (42.7%) | $157,857 |
| 3+ Earners | 123 (12.1%) | $216,250 |
| Total | 1,016 (100.0%) | $121,000 |
Household Income in Wilbraham
Household Income Brackets in Wilbraham
With 250 households falling in the category, the $100,000 to $149,999 income range is the most frequent in Wilbraham, accounting for 17.8% of all households. In contrast, only 15 households (1.1%) fall into the less than $10,000 income bracket, making it the least populous group.
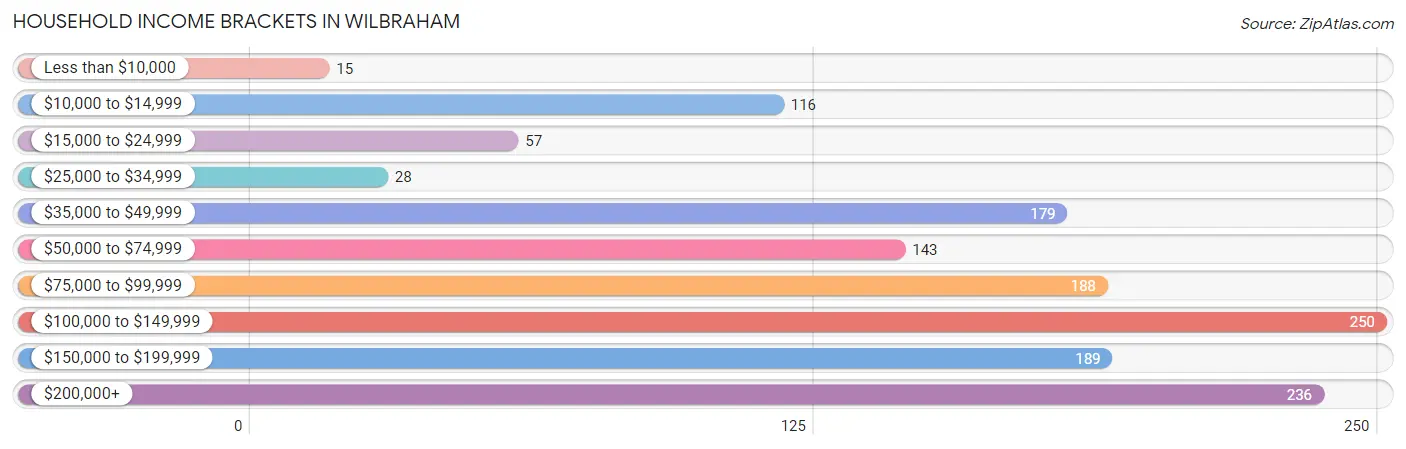
| Income Bracket | # Households | % Households |
| Less than $10,000 | 15 | 1.1% |
| $10,000 to $14,999 | 116 | 8.3% |
| $15,000 to $24,999 | 57 | 4.1% |
| $25,000 to $34,999 | 28 | 2.0% |
| $35,000 to $49,999 | 179 | 12.8% |
| $50,000 to $74,999 | 143 | 10.2% |
| $75,000 to $99,999 | 188 | 13.4% |
| $100,000 to $149,999 | 250 | 17.8% |
| $150,000 to $199,999 | 189 | 13.5% |
| $200,000+ | 236 | 16.8% |
Household Income by Householder Age in Wilbraham
The median household income in Wilbraham is $97,891, with the highest median household income of $124,063 found in the 45 to 64 years age bracket for the primary householder. A total of 561 households (40.0%) fall into this category.

| Income Bracket | # Households | Median Income |
| 15 to 24 Years | 0 (0.0%) | $0 |
| 25 to 44 Years | 315 (22.5%) | $101,861 |
| 45 to 64 Years | 561 (40.0%) | $124,063 |
| 65+ Years | 526 (37.5%) | $60,893 |
| Total | 1,402 (100.0%) | $97,891 |
Poverty in Wilbraham
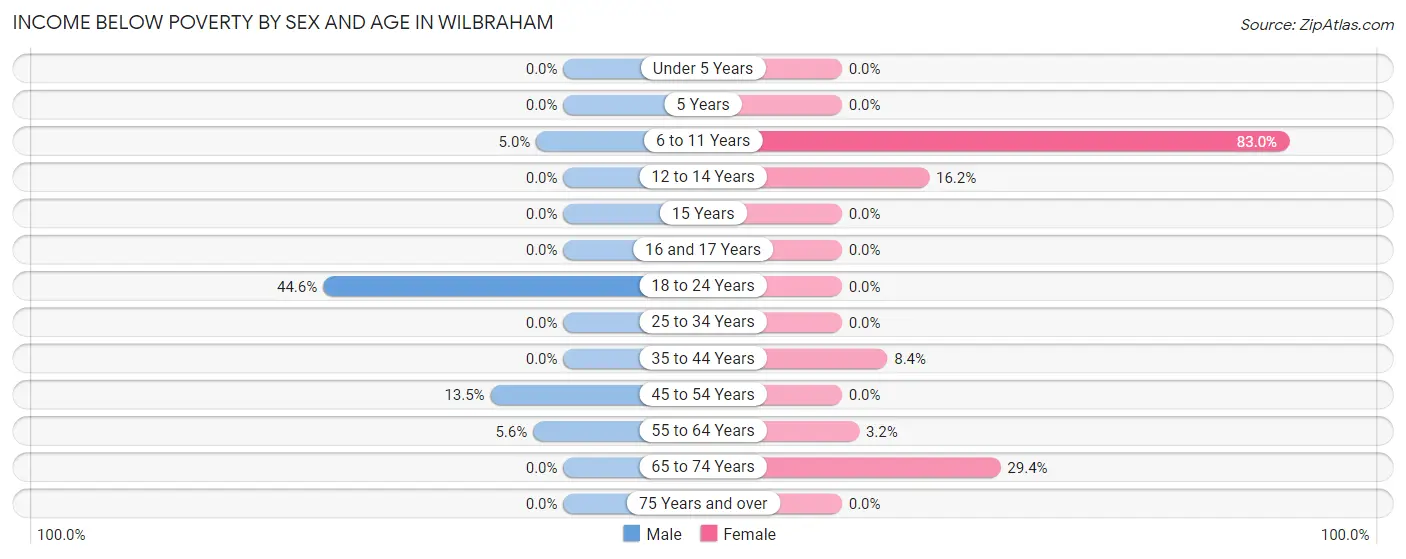
Income Below Poverty by Sex and Age in Wilbraham
With 6.1% poverty level for males and 10.9% for females among the residents of Wilbraham, 18 to 24 year old males and 6 to 11 year old females are the most vulnerable to poverty, with 62 males (44.6%) and 39 females (83.0%) in their respective age groups living below the poverty level.
| Age Bracket | Male | Female |
| Under 5 Years | 0 (0.0%) | 0 (0.0%) |
| 5 Years | 0 (0.0%) | 0 (0.0%) |
| 6 to 11 Years | 12 (5.0%) | 39 (83.0%) |
| 12 to 14 Years | 0 (0.0%) | 17 (16.2%) |
| 15 Years | 0 (0.0%) | 0 (0.0%) |
| 16 and 17 Years | 0 (0.0%) | 0 (0.0%) |
| 18 to 24 Years | 62 (44.6%) | 0 (0.0%) |
| 25 to 34 Years | 0 (0.0%) | 0 (0.0%) |
| 35 to 44 Years | 0 (0.0%) | 13 (8.4%) |
| 45 to 54 Years | 18 (13.5%) | 0 (0.0%) |
| 55 to 64 Years | 16 (5.6%) | 12 (3.2%) |
| 65 to 74 Years | 0 (0.0%) | 116 (29.4%) |
| 75 Years and over | 0 (0.0%) | 0 (0.0%) |
| Total | 108 (6.1%) | 197 (10.9%) |
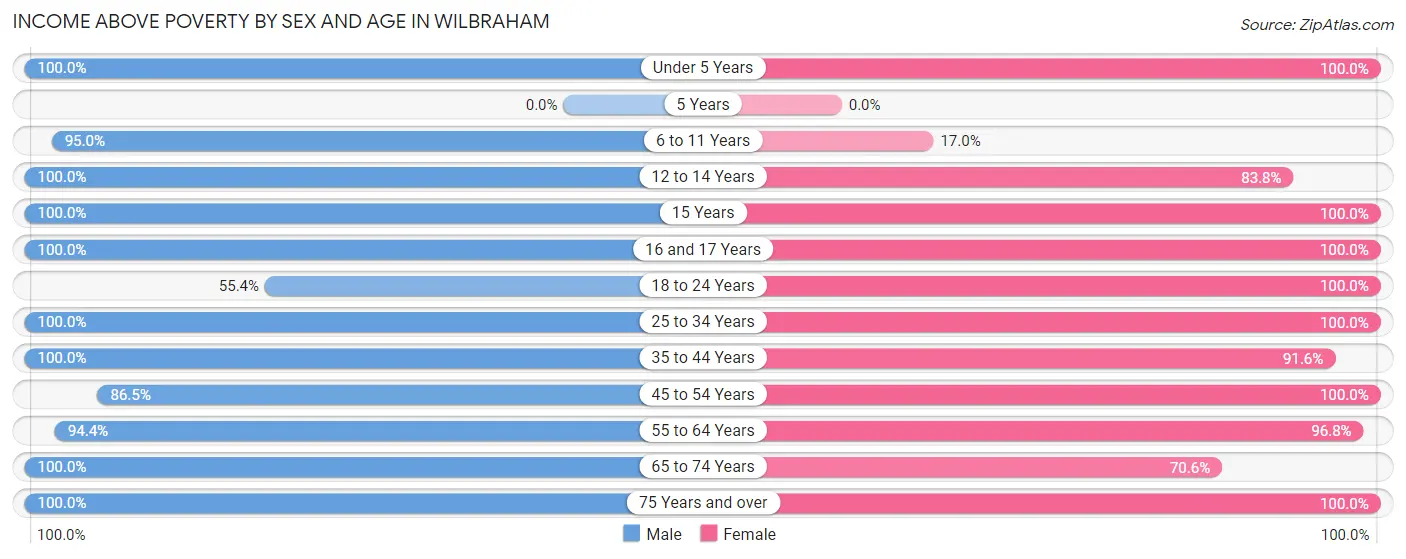
Income Above Poverty by Sex and Age in Wilbraham
According to the poverty statistics in Wilbraham, males aged under 5 years and females aged under 5 years are the age groups that are most secure financially, with 100.0% of males and 100.0% of females in these age groups living above the poverty line.
| Age Bracket | Male | Female |
| Under 5 Years | 111 (100.0%) | 10 (100.0%) |
| 5 Years | 0 (0.0%) | 0 (0.0%) |
| 6 to 11 Years | 226 (95.0%) | 8 (17.0%) |
| 12 to 14 Years | 41 (100.0%) | 88 (83.8%) |
| 15 Years | 19 (100.0%) | 43 (100.0%) |
| 16 and 17 Years | 17 (100.0%) | 43 (100.0%) |
| 18 to 24 Years | 77 (55.4%) | 68 (100.0%) |
| 25 to 34 Years | 113 (100.0%) | 242 (100.0%) |
| 35 to 44 Years | 232 (100.0%) | 141 (91.6%) |
| 45 to 54 Years | 115 (86.5%) | 187 (100.0%) |
| 55 to 64 Years | 268 (94.4%) | 365 (96.8%) |
| 65 to 74 Years | 315 (100.0%) | 278 (70.6%) |
| 75 Years and over | 139 (100.0%) | 131 (100.0%) |
| Total | 1,673 (93.9%) | 1,604 (89.1%) |
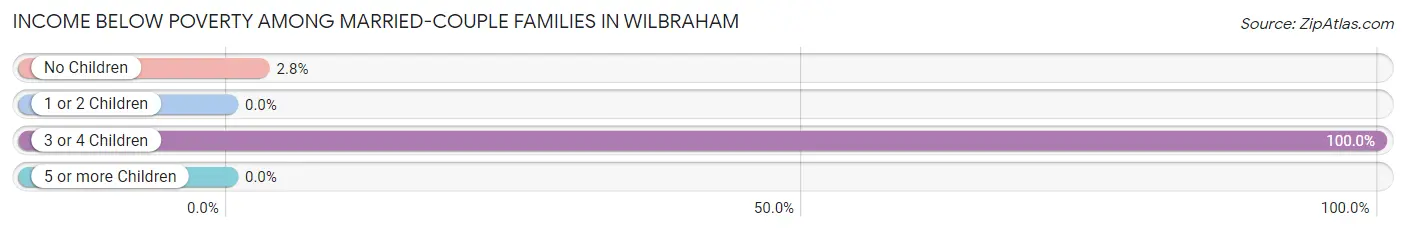
Income Below Poverty Among Married-Couple Families in Wilbraham
The poverty statistics for married-couple families in Wilbraham show that 3.1% or 29 of the total 924 families live below the poverty line. Families with 3 or 4 children have the highest poverty rate of 100.0%, comprising of 13 families. On the other hand, families with 1 or 2 children have the lowest poverty rate of 0.0%, which includes 0 families.
| Children | Above Poverty | Below Poverty |
| No Children | 565 (97.3%) | 16 (2.8%) |
| 1 or 2 Children | 330 (100.0%) | 0 (0.0%) |
| 3 or 4 Children | 0 (0.0%) | 13 (100.0%) |
| 5 or more Children | 0 (0.0%) | 0 (0.0%) |
| Total | 895 (96.9%) | 29 (3.1%) |
Income Below Poverty Among Single-Parent Households in Wilbraham
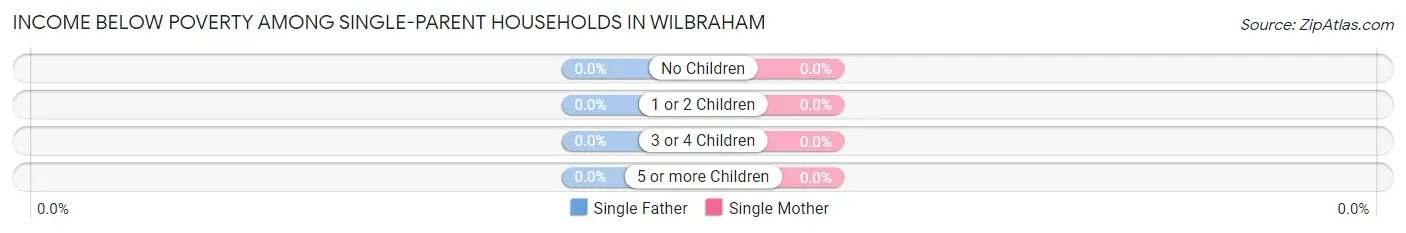
| Children | Single Father | Single Mother |
| No Children | 0 (0.0%) | 0 (0.0%) |
| 1 or 2 Children | 0 (0.0%) | 0 (0.0%) |
| 3 or 4 Children | 0 (0.0%) | 0 (0.0%) |
| 5 or more Children | 0 (0.0%) | 0 (0.0%) |
| Total | 0 (0.0%) | 0 (0.0%) |
Income Below Poverty Among Married-Couple vs Single-Parent Households in Wilbraham
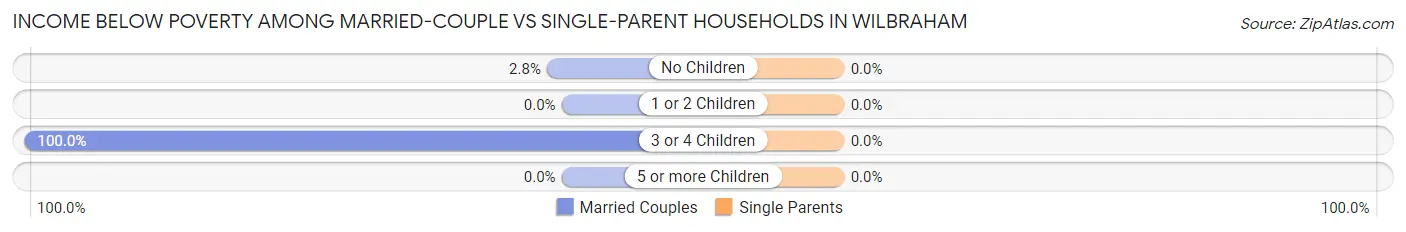
| Children | Married-Couple Families | Single-Parent Households |
| No Children | 16 (2.8%) | 0 (0.0%) |
| 1 or 2 Children | 0 (0.0%) | 0 (0.0%) |
| 3 or 4 Children | 13 (100.0%) | 0 (0.0%) |
| 5 or more Children | 0 (0.0%) | 0 (0.0%) |
| Total | 29 (3.1%) | 0 (0.0%) |
Race in Wilbraham
The most populous races in Wilbraham are White / Caucasian (3,357 | 87.4%), Two or more Races (216 | 5.6%), and Asian (173 | 4.5%).
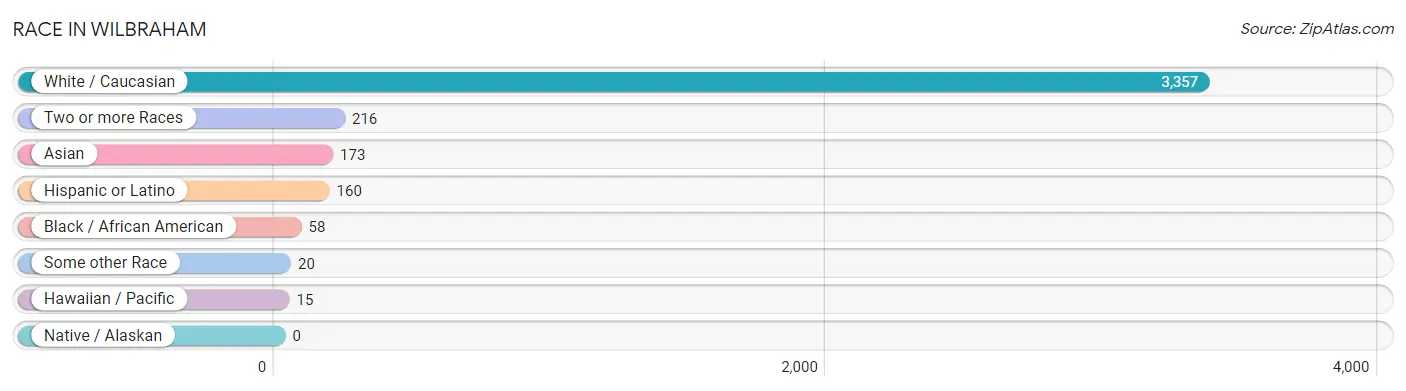
| Race | # Population | % Population |
| Asian | 173 | 4.5% |
| Black / African American | 58 | 1.5% |
| Hawaiian / Pacific | 15 | 0.4% |
| Hispanic or Latino | 160 | 4.2% |
| Native / Alaskan | 0 | 0.0% |
| White / Caucasian | 3,357 | 87.4% |
| Two or more Races | 216 | 5.6% |
| Some other Race | 20 | 0.5% |
| Total | 3,839 | 100.0% |
Ancestry in Wilbraham
The most populous ancestries reported in Wilbraham are Irish (746 | 19.4%), French (644 | 16.8%), German (497 | 13.0%), English (491 | 12.8%), and Polish (450 | 11.7%), together accounting for 73.7% of all Wilbraham residents.
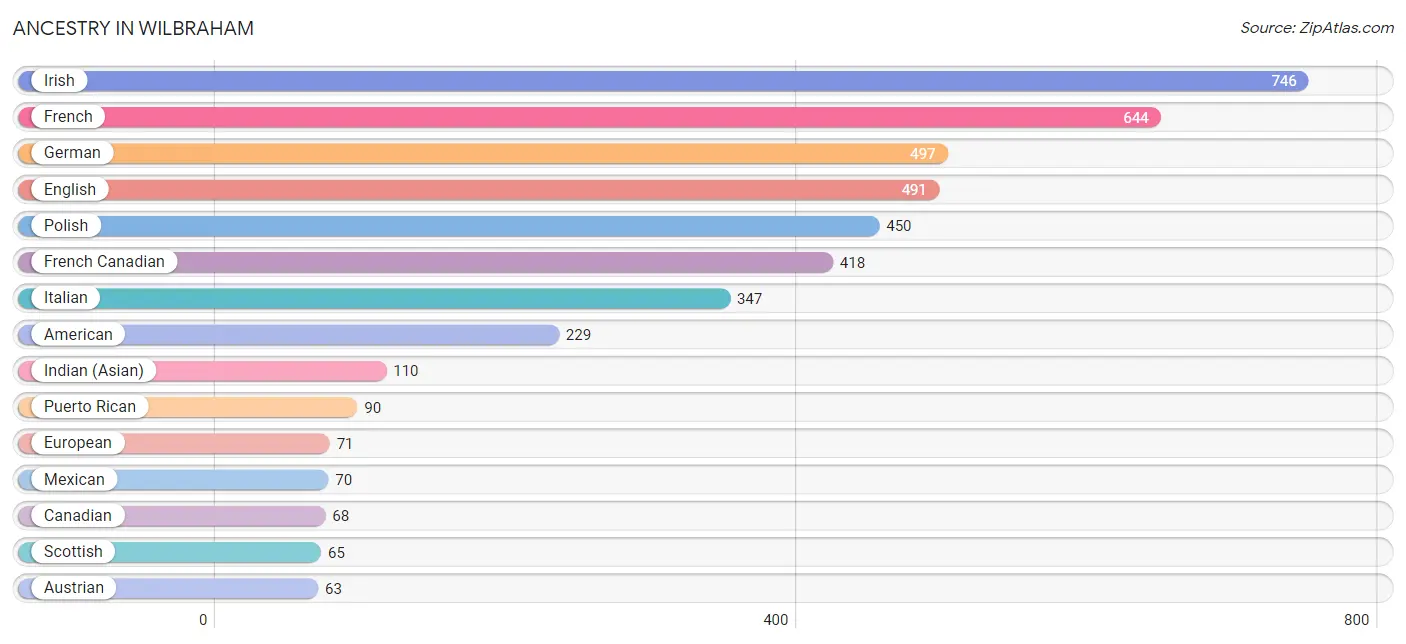
| Ancestry | # Population | % Population |
| American | 229 | 6.0% |
| Armenian | 10 | 0.3% |
| Austrian | 63 | 1.6% |
| Canadian | 68 | 1.8% |
| Dutch | 16 | 0.4% |
| Eastern European | 10 | 0.3% |
| English | 491 | 12.8% |
| European | 71 | 1.8% |
| Finnish | 9 | 0.2% |
| French | 644 | 16.8% |
| French Canadian | 418 | 10.9% |
| German | 497 | 13.0% |
| Greek | 51 | 1.3% |
| Guamanian / Chamorro | 15 | 0.4% |
| Indian (Asian) | 110 | 2.9% |
| Irish | 746 | 19.4% |
| Italian | 347 | 9.0% |
| Latvian | 15 | 0.4% |
| Lithuanian | 49 | 1.3% |
| Mexican | 70 | 1.8% |
| Norwegian | 14 | 0.4% |
| Polish | 450 | 11.7% |
| Portuguese | 44 | 1.1% |
| Puerto Rican | 90 | 2.3% |
| Scandinavian | 19 | 0.5% |
| Scottish | 65 | 1.7% |
| Sri Lankan | 58 | 1.5% |
| Swedish | 16 | 0.4% |
| Thai | 5 | 0.1% | View All 29 Rows |
Immigrants in Wilbraham
The most numerous immigrant groups reported in Wilbraham came from Asia (114 | 3.0%), China (81 | 2.1%), Eastern Asia (81 | 2.1%), South Eastern Asia (33 | 0.9%), and Vietnam (33 | 0.9%), together accounting for 8.9% of all Wilbraham residents.
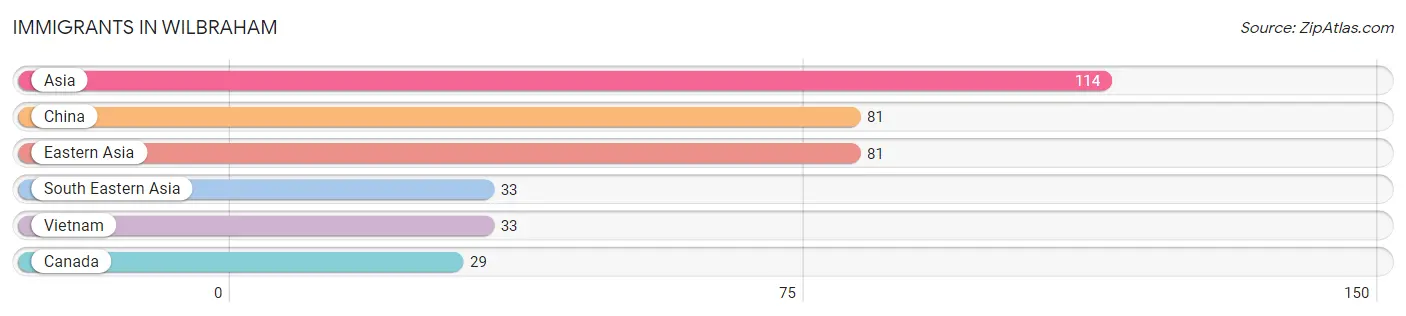
| Immigration Origin | # Population | % Population |
| Asia | 114 | 3.0% |
| Canada | 29 | 0.8% |
| China | 81 | 2.1% |
| Eastern Asia | 81 | 2.1% |
| South Eastern Asia | 33 | 0.9% |
| Vietnam | 33 | 0.9% | View All 6 Rows |
Sex and Age in Wilbraham
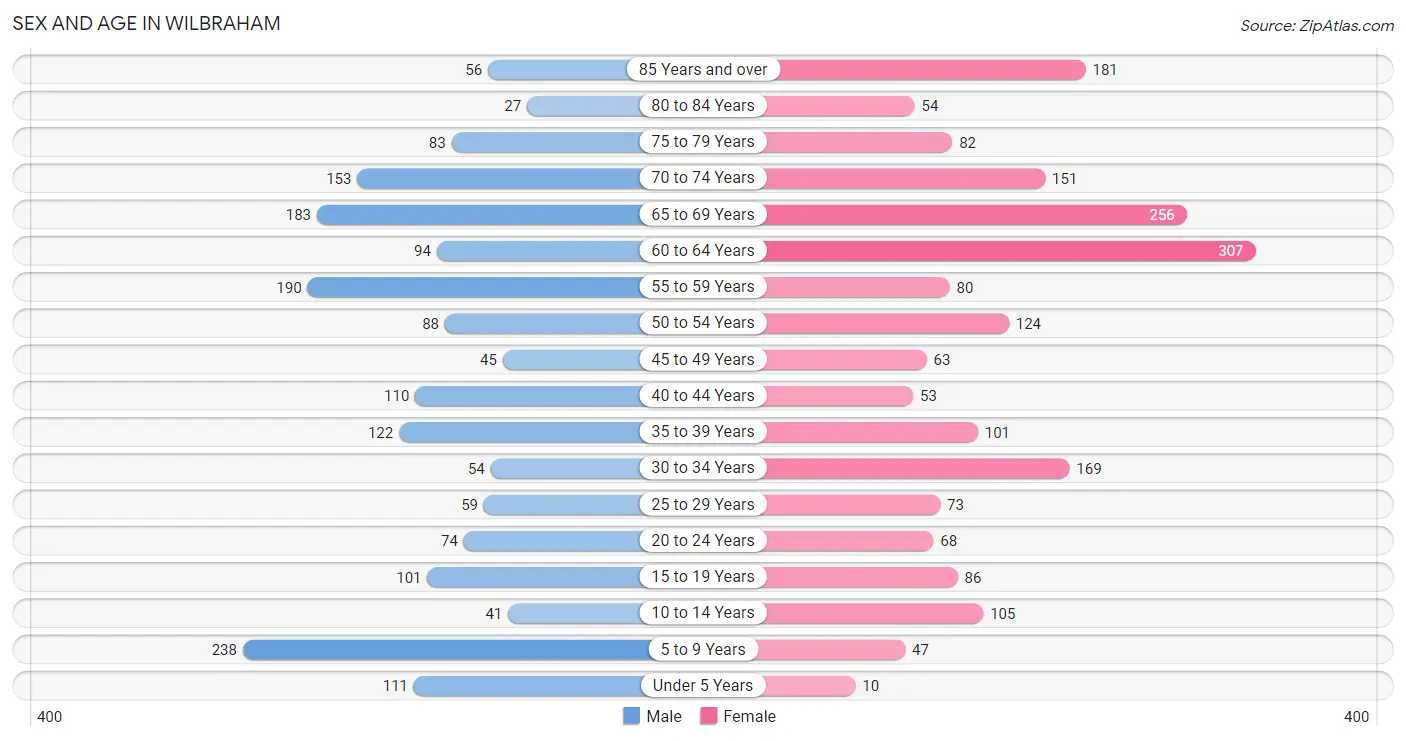
Sex and Age in Wilbraham
The most populous age groups in Wilbraham are 5 to 9 Years (238 | 13.0%) for men and 60 to 64 Years (307 | 15.3%) for women.
| Age Bracket | Male | Female |
| Under 5 Years | 111 (6.1%) | 10 (0.5%) |
| 5 to 9 Years | 238 (13.0%) | 47 (2.3%) |
| 10 to 14 Years | 41 (2.2%) | 105 (5.2%) |
| 15 to 19 Years | 101 (5.5%) | 86 (4.3%) |
| 20 to 24 Years | 74 (4.1%) | 68 (3.4%) |
| 25 to 29 Years | 59 (3.2%) | 73 (3.6%) |
| 30 to 34 Years | 54 (2.9%) | 169 (8.4%) |
| 35 to 39 Years | 122 (6.7%) | 101 (5.0%) |
| 40 to 44 Years | 110 (6.0%) | 53 (2.6%) |
| 45 to 49 Years | 45 (2.5%) | 63 (3.1%) |
| 50 to 54 Years | 88 (4.8%) | 124 (6.2%) |
| 55 to 59 Years | 190 (10.4%) | 80 (4.0%) |
| 60 to 64 Years | 94 (5.1%) | 307 (15.3%) |
| 65 to 69 Years | 183 (10.0%) | 256 (12.7%) |
| 70 to 74 Years | 153 (8.4%) | 151 (7.5%) |
| 75 to 79 Years | 83 (4.5%) | 82 (4.1%) |
| 80 to 84 Years | 27 (1.5%) | 54 (2.7%) |
| 85 Years and over | 56 (3.1%) | 181 (9.0%) |
| Total | 1,829 (100.0%) | 2,010 (100.0%) |
Families and Households in Wilbraham
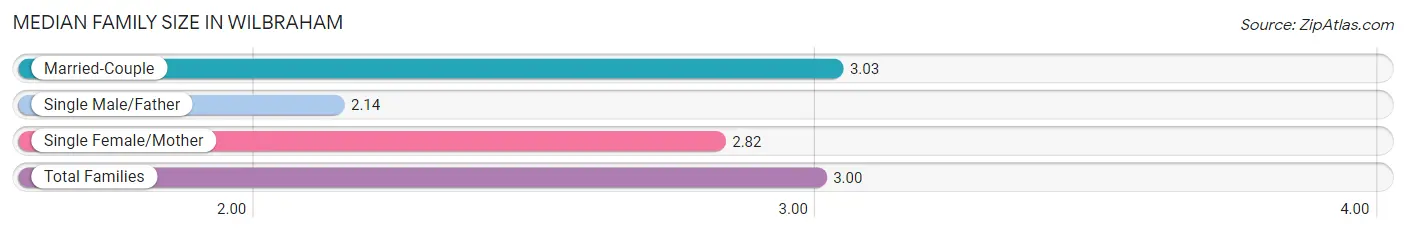
Median Family Size in Wilbraham
The median family size in Wilbraham is 3.00 persons per family, with married-couple families (924 | 90.9%) accounting for the largest median family size of 3.03 persons per family. On the other hand, single male/father families (14 | 1.4%) represent the smallest median family size with 2.14 persons per family.
| Family Type | # Families | Family Size |
| Married-Couple | 924 (90.9%) | 3.03 |
| Single Male/Father | 14 (1.4%) | 2.14 |
| Single Female/Mother | 78 (7.7%) | 2.82 |
| Total Families | 1,016 (100.0%) | 3.00 |
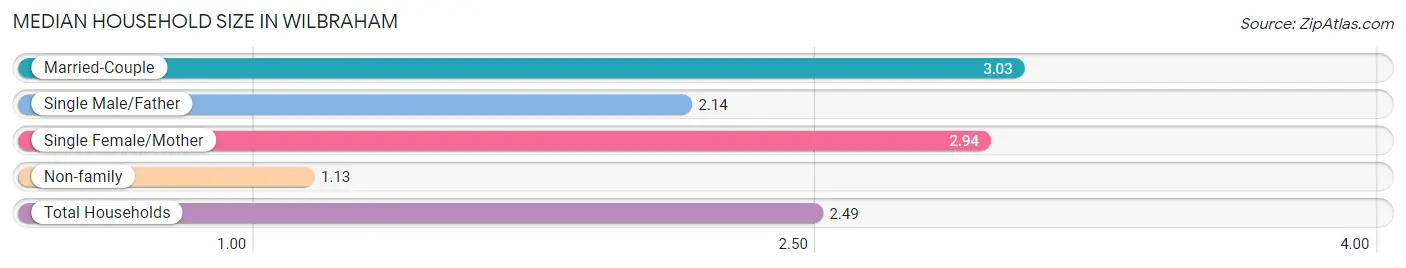
Median Household Size in Wilbraham
The median household size in Wilbraham is 2.49 persons per household, with married-couple households (924 | 65.9%) accounting for the largest median household size of 3.03 persons per household. non-family households (386 | 27.5%) represent the smallest median household size with 1.13 persons per household.
| Household Type | # Households | Household Size |
| Married-Couple | 924 (65.9%) | 3.03 |
| Single Male/Father | 14 (1.0%) | 2.14 |
| Single Female/Mother | 78 (5.6%) | 2.94 |
| Non-family | 386 (27.5%) | 1.13 |
| Total Households | 1,402 (100.0%) | 2.49 |
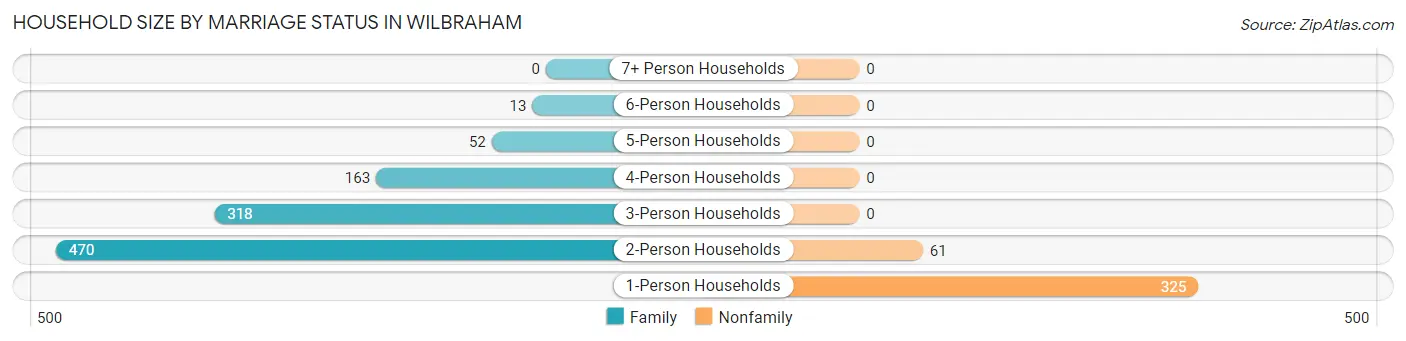
Household Size by Marriage Status in Wilbraham
Out of a total of 1,402 households in Wilbraham, 1,016 (72.5%) are family households, while 386 (27.5%) are nonfamily households. The most numerous type of family households are 2-person households, comprising 470, and the most common type of nonfamily households are 1-person households, comprising 325.
| Household Size | Family Households | Nonfamily Households |
| 1-Person Households | - | 325 (23.2%) |
| 2-Person Households | 470 (33.5%) | 61 (4.3%) |
| 3-Person Households | 318 (22.7%) | 0 (0.0%) |
| 4-Person Households | 163 (11.6%) | 0 (0.0%) |
| 5-Person Households | 52 (3.7%) | 0 (0.0%) |
| 6-Person Households | 13 (0.9%) | 0 (0.0%) |
| 7+ Person Households | 0 (0.0%) | 0 (0.0%) |
| Total | 1,016 (72.5%) | 386 (27.5%) |
Female Fertility in Wilbraham
Fertility by Age in Wilbraham
Average fertility rate in Wilbraham is 27.0 births per 1,000 women. Women in the age bracket of 35 to 50 years have the highest fertility rate with 38.0 births per 1,000 women. Women in the age bracket of 35 to 50 years acount for 52.9% of all women with births.
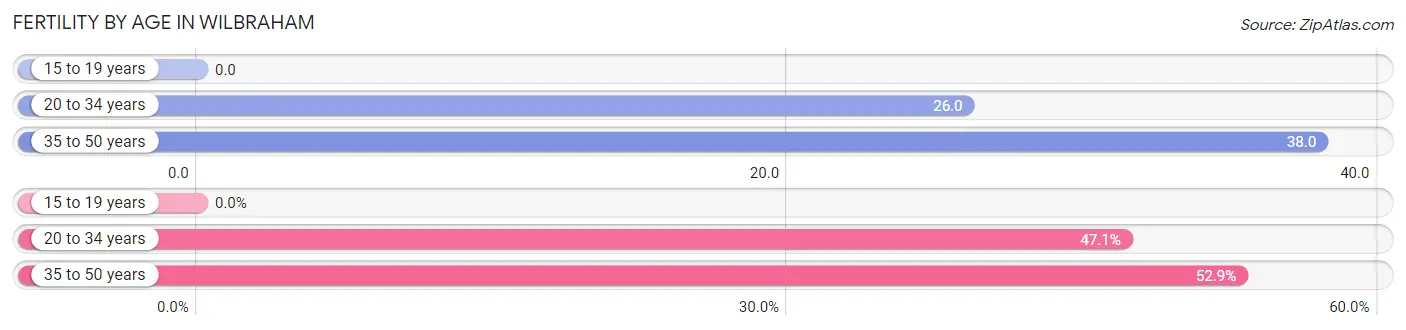
| Age Bracket | Women with Births | Births / 1,000 Women |
| 15 to 19 years | 0 (0.0%) | 0.0 |
| 20 to 34 years | 8 (47.1%) | 26.0 |
| 35 to 50 years | 9 (52.9%) | 38.0 |
| Total | 17 (100.0%) | 27.0 |
Fertility by Age by Marriage Status in Wilbraham
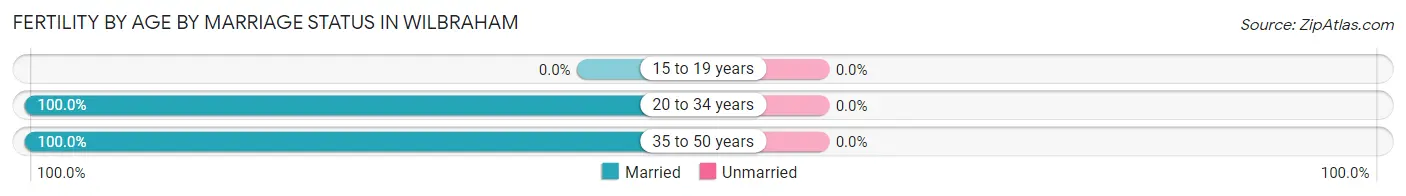
| Age Bracket | Married | Unmarried |
| 15 to 19 years | 0 (0.0%) | 0 (0.0%) |
| 20 to 34 years | 8 (100.0%) | 0 (0.0%) |
| 35 to 50 years | 9 (100.0%) | 0 (0.0%) |
| Total | 17 (100.0%) | 0 (0.0%) |
Fertility by Education in Wilbraham
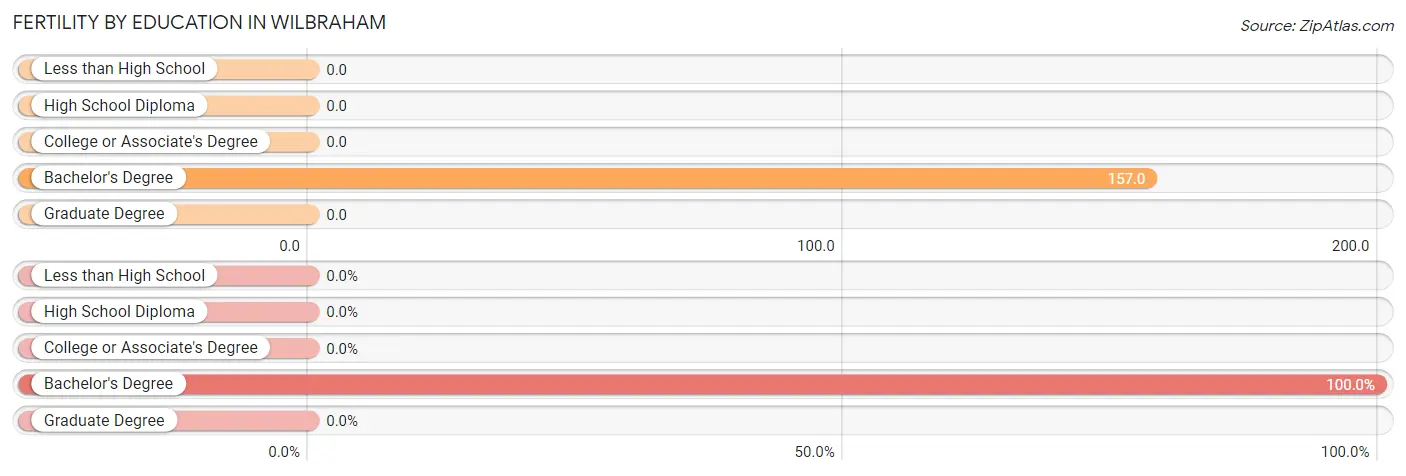
| Educational Attainment | Women with Births | Births / 1,000 Women |
| Less than High School | 0 (0.0%) | 0.0 |
| High School Diploma | 0 (0.0%) | 0.0 |
| College or Associate's Degree | 0 (0.0%) | 0.0 |
| Bachelor's Degree | 17 (100.0%) | 157.0 |
| Graduate Degree | 0 (0.0%) | 0.0 |
| Total | 17 (100.0%) | 27.0 |
Fertility by Education by Marriage Status in Wilbraham
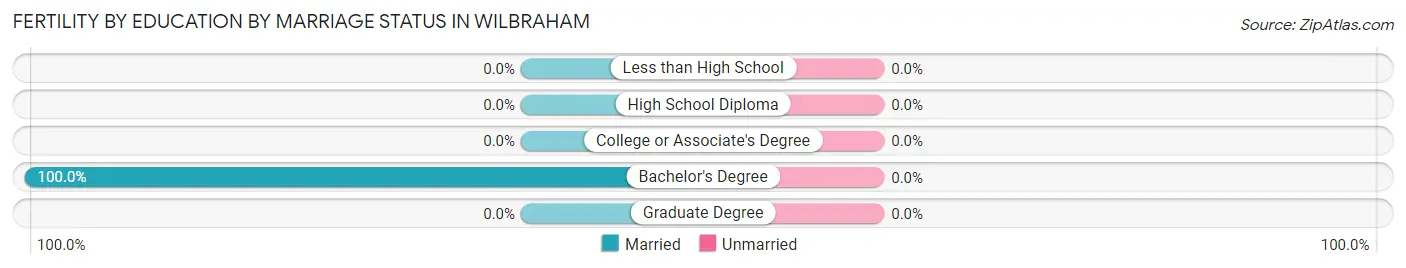
| Educational Attainment | Married | Unmarried |
| Less than High School | 0 (0.0%) | 0 (0.0%) |
| High School Diploma | 0 (0.0%) | 0 (0.0%) |
| College or Associate's Degree | 0 (0.0%) | 0 (0.0%) |
| Bachelor's Degree | 17 (100.0%) | 0 (0.0%) |
| Graduate Degree | 0 (0.0%) | 0 (0.0%) |
| Total | 17 (100.0%) | 0 (0.0%) |
Employment Characteristics in Wilbraham
Employment by Class of Employer in Wilbraham
Among the 1,596 employed individuals in Wilbraham, private company employees (823 | 51.6%), self-employed (not incorporated) (210 | 13.2%), and not-for-profit organizations (139 | 8.7%) make up the most common classes of employment.
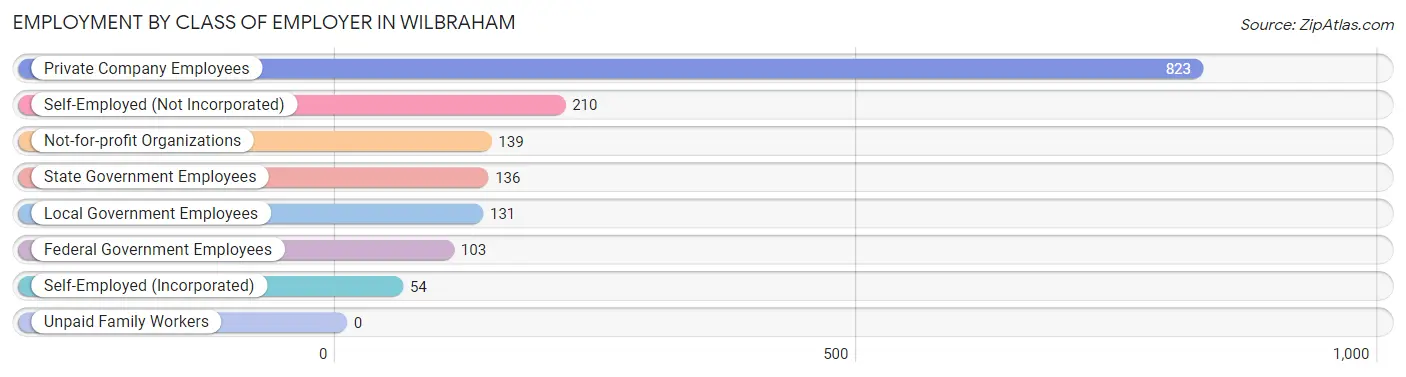
| Employer Class | # Employees | % Employees |
| Private Company Employees | 823 | 51.6% |
| Self-Employed (Incorporated) | 54 | 3.4% |
| Self-Employed (Not Incorporated) | 210 | 13.2% |
| Not-for-profit Organizations | 139 | 8.7% |
| Local Government Employees | 131 | 8.2% |
| State Government Employees | 136 | 8.5% |
| Federal Government Employees | 103 | 6.5% |
| Unpaid Family Workers | 0 | 0.0% |
| Total | 1,596 | 100.0% |
Employment Status by Age in Wilbraham
According to the labor force statistics for Wilbraham, out of the total population over 16 years of age (3,225), 52.5% or 1,693 individuals are in the labor force, with 3.8% or 64 of them unemployed. The age group with the highest labor force participation rate is 30 to 34 years, with 100.0% or 223 individuals in the labor force. Within the labor force, the 16 to 19 years age range has the highest percentage of unemployed individuals, with 31.7% or 20 of them being unemployed.
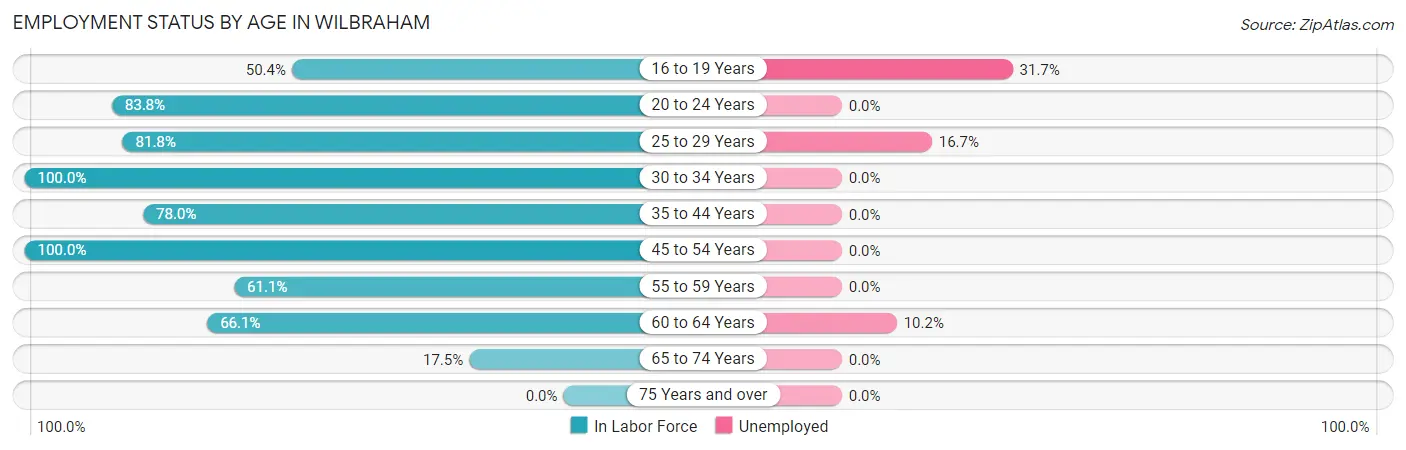
| Age Bracket | In Labor Force | Unemployed |
| 16 to 19 Years | 63 (50.4%) | 20 (31.7%) |
| 20 to 24 Years | 119 (83.8%) | 0 (0.0%) |
| 25 to 29 Years | 108 (81.8%) | 18 (16.7%) |
| 30 to 34 Years | 223 (100.0%) | 0 (0.0%) |
| 35 to 44 Years | 301 (78.0%) | 0 (0.0%) |
| 45 to 54 Years | 320 (100.0%) | 0 (0.0%) |
| 55 to 59 Years | 165 (61.1%) | 0 (0.0%) |
| 60 to 64 Years | 265 (66.1%) | 27 (10.2%) |
| 65 to 74 Years | 130 (17.5%) | 0 (0.0%) |
| 75 Years and over | 0 (0.0%) | 0 (0.0%) |
| Total | 1,693 (52.5%) | 64 (3.8%) |
Employment Status by Educational Attainment in Wilbraham
According to labor force statistics for Wilbraham, 79.8% of individuals (1,382) out of the total population between 25 and 64 years of age (1,732) are in the labor force, with 3.3% or 46 of them being unemployed. The group with the highest labor force participation rate are those with the educational attainment of less than high school, with 100.0% or 28 individuals in the labor force. Within the labor force, individuals with bachelor's degree or higher education have the highest percentage of unemployment, with 5.7% or 45 of them being unemployed.
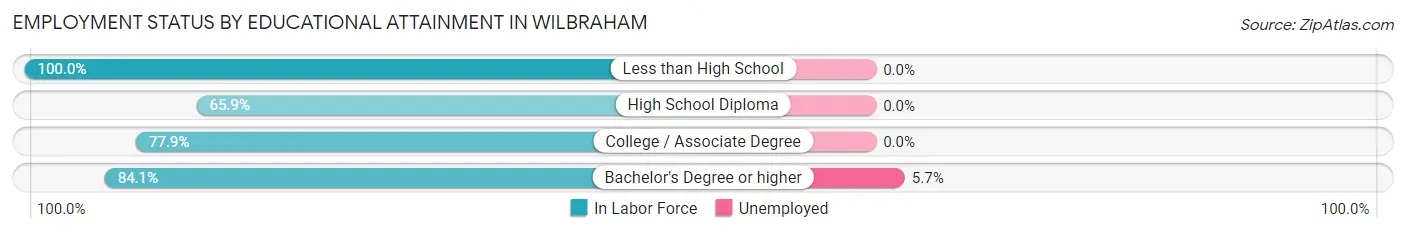
| Educational Attainment | In Labor Force | Unemployed |
| Less than High School | 28 (100.0%) | 0 (0.0%) |
| High School Diploma | 172 (65.9%) | 0 (0.0%) |
| College / Associate Degree | 398 (77.9%) | 0 (0.0%) |
| Bachelor's Degree or higher | 784 (84.1%) | 53 (5.7%) |
| Total | 1,382 (79.8%) | 57 (3.3%) |
Employment Occupations by Sex in Wilbraham
Management, Business, Science and Arts Occupations
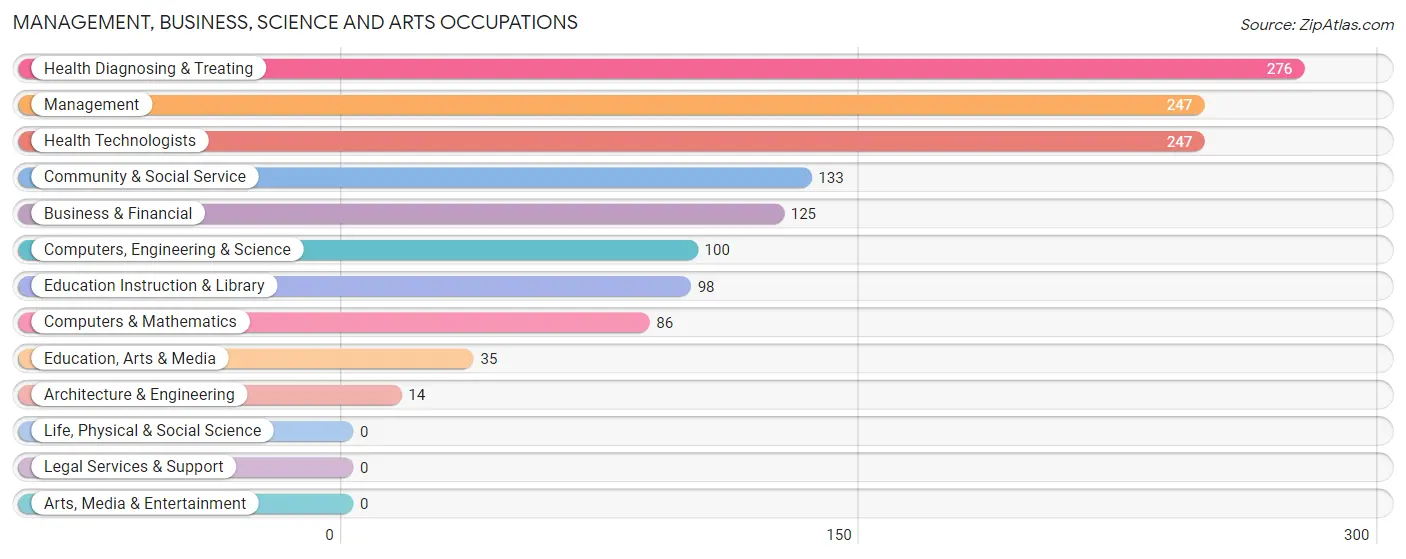
The most common Management, Business, Science and Arts occupations in Wilbraham are Health Diagnosing & Treating (276 | 16.9%), Management (247 | 15.2%), Health Technologists (247 | 15.2%), Community & Social Service (133 | 8.2%), and Business & Financial (125 | 7.7%).
Management, Business, Science and Arts Occupations by Sex
Within the Management, Business, Science and Arts occupations in Wilbraham, the most male-oriented occupations are Computers, Engineering & Science (100.0%), Computers & Mathematics (100.0%), and Architecture & Engineering (100.0%), while the most female-oriented occupations are Education, Arts & Media (100.0%), Business & Financial (89.6%), and Health Technologists (89.1%).
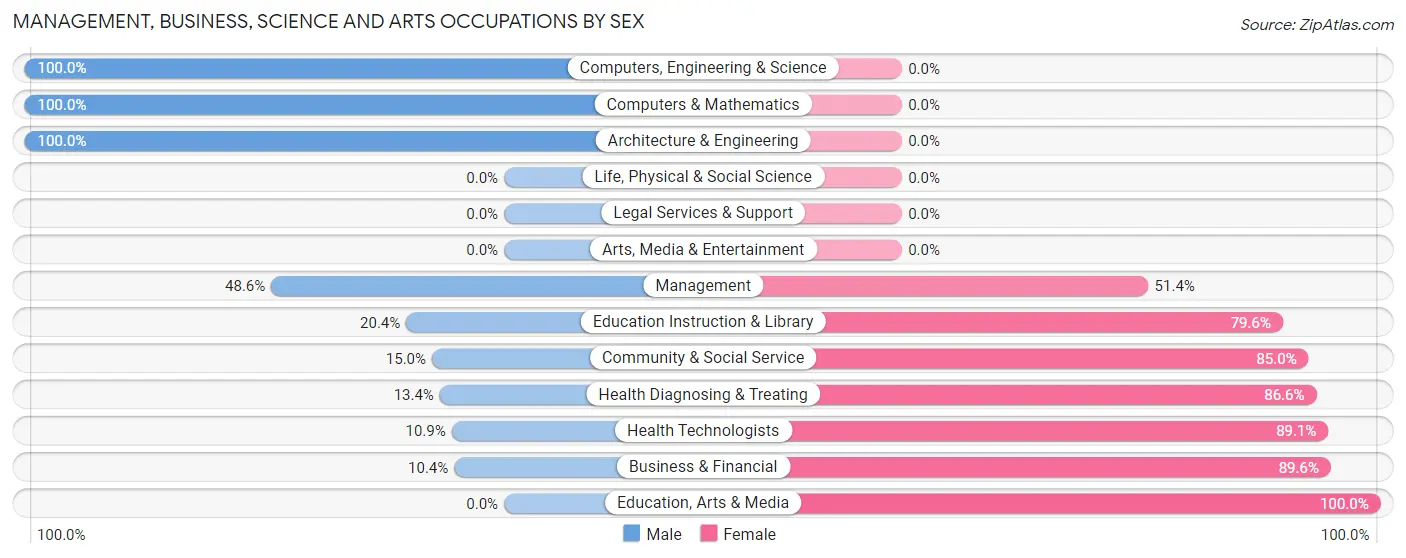
| Occupation | Male | Female |
| Management | 120 (48.6%) | 127 (51.4%) |
| Business & Financial | 13 (10.4%) | 112 (89.6%) |
| Computers, Engineering & Science | 100 (100.0%) | 0 (0.0%) |
| Computers & Mathematics | 86 (100.0%) | 0 (0.0%) |
| Architecture & Engineering | 14 (100.0%) | 0 (0.0%) |
| Life, Physical & Social Science | 0 (0.0%) | 0 (0.0%) |
| Community & Social Service | 20 (15.0%) | 113 (85.0%) |
| Education, Arts & Media | 0 (0.0%) | 35 (100.0%) |
| Legal Services & Support | 0 (0.0%) | 0 (0.0%) |
| Education Instruction & Library | 20 (20.4%) | 78 (79.6%) |
| Arts, Media & Entertainment | 0 (0.0%) | 0 (0.0%) |
| Health Diagnosing & Treating | 37 (13.4%) | 239 (86.6%) |
| Health Technologists | 27 (10.9%) | 220 (89.1%) |
| Total (Category) | 290 (32.9%) | 591 (67.1%) |
| Total (Overall) | 729 (44.8%) | 900 (55.2%) |
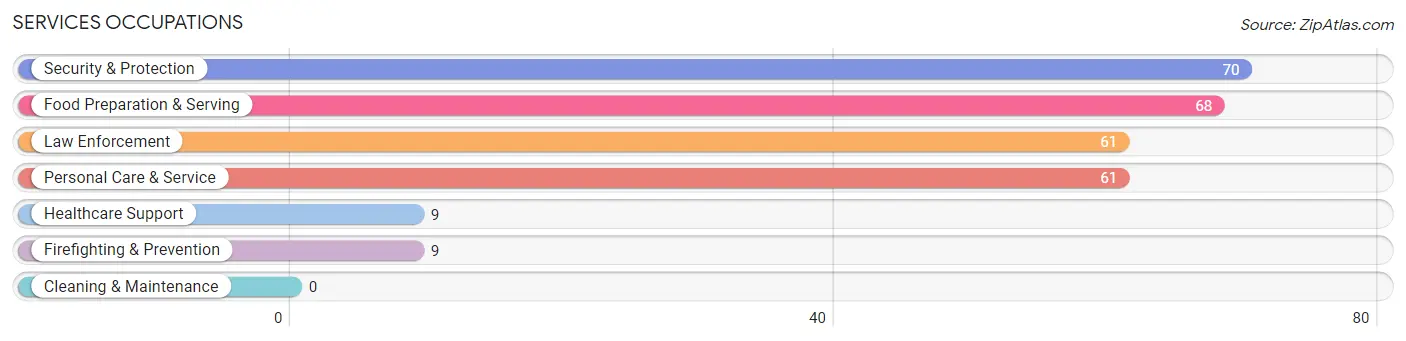
Services Occupations
The most common Services occupations in Wilbraham are Security & Protection (70 | 4.3%), Food Preparation & Serving (68 | 4.2%), Law Enforcement (61 | 3.7%), Personal Care & Service (61 | 3.7%), and Healthcare Support (9 | 0.5%).
Services Occupations by Sex
Within the Services occupations in Wilbraham, the most male-oriented occupations are Firefighting & Prevention (100.0%), Food Preparation & Serving (69.1%), and Personal Care & Service (27.9%), while the most female-oriented occupations are Healthcare Support (100.0%), Law Enforcement (100.0%), and Security & Protection (87.1%).
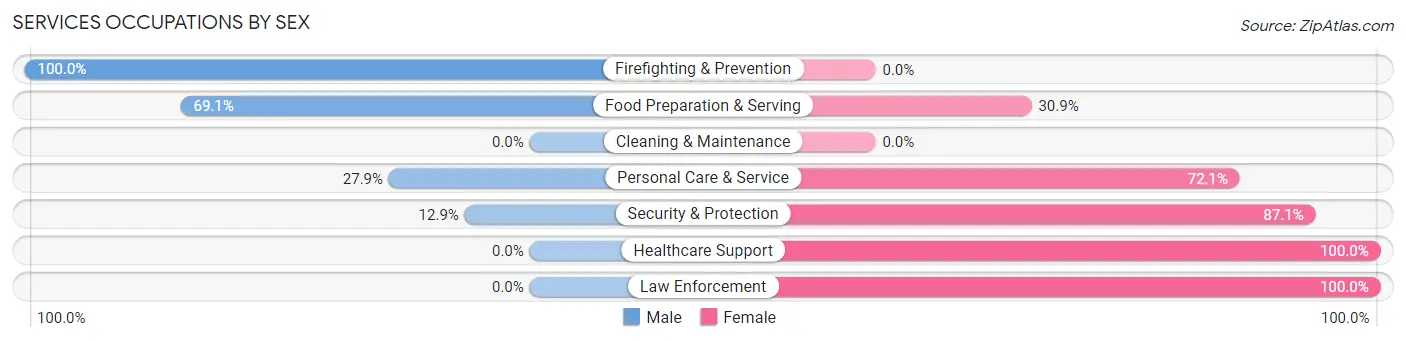
| Occupation | Male | Female |
| Healthcare Support | 0 (0.0%) | 9 (100.0%) |
| Security & Protection | 9 (12.9%) | 61 (87.1%) |
| Firefighting & Prevention | 9 (100.0%) | 0 (0.0%) |
| Law Enforcement | 0 (0.0%) | 61 (100.0%) |
| Food Preparation & Serving | 47 (69.1%) | 21 (30.9%) |
| Cleaning & Maintenance | 0 (0.0%) | 0 (0.0%) |
| Personal Care & Service | 17 (27.9%) | 44 (72.1%) |
| Total (Category) | 73 (35.1%) | 135 (64.9%) |
| Total (Overall) | 729 (44.8%) | 900 (55.2%) |
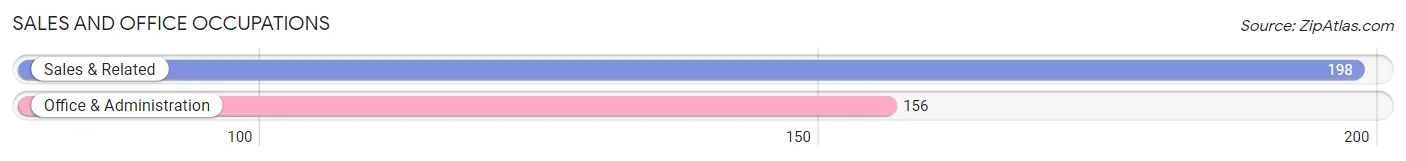
Sales and Office Occupations
The most common Sales and Office occupations in Wilbraham are Sales & Related (198 | 12.1%), and Office & Administration (156 | 9.6%).
Sales and Office Occupations by Sex
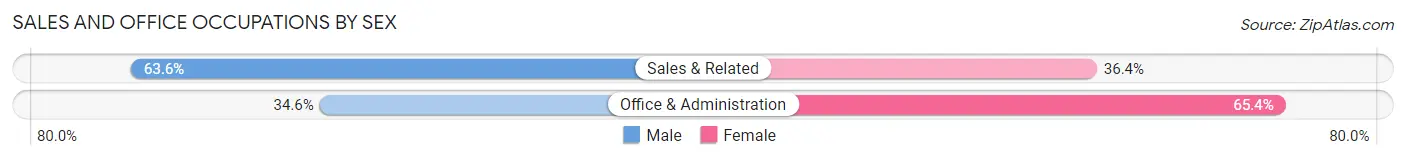
| Occupation | Male | Female |
| Sales & Related | 126 (63.6%) | 72 (36.4%) |
| Office & Administration | 54 (34.6%) | 102 (65.4%) |
| Total (Category) | 180 (50.8%) | 174 (49.1%) |
| Total (Overall) | 729 (44.8%) | 900 (55.2%) |
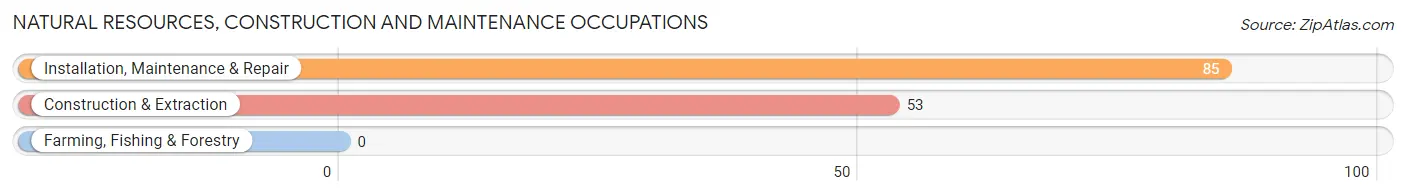
Natural Resources, Construction and Maintenance Occupations
The most common Natural Resources, Construction and Maintenance occupations in Wilbraham are Installation, Maintenance & Repair (85 | 5.2%), and Construction & Extraction (53 | 3.3%).
Natural Resources, Construction and Maintenance Occupations by Sex
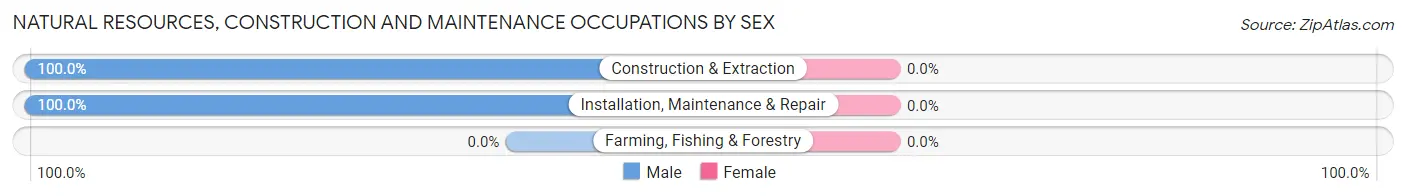
| Occupation | Male | Female |
| Farming, Fishing & Forestry | 0 (0.0%) | 0 (0.0%) |
| Construction & Extraction | 53 (100.0%) | 0 (0.0%) |
| Installation, Maintenance & Repair | 85 (100.0%) | 0 (0.0%) |
| Total (Category) | 138 (100.0%) | 0 (0.0%) |
| Total (Overall) | 729 (44.8%) | 900 (55.2%) |
Production, Transportation and Moving Occupations
The most common Production, Transportation and Moving occupations in Wilbraham are Production (17 | 1.0%), Material Moving (16 | 1.0%), and Transportation (15 | 0.9%).
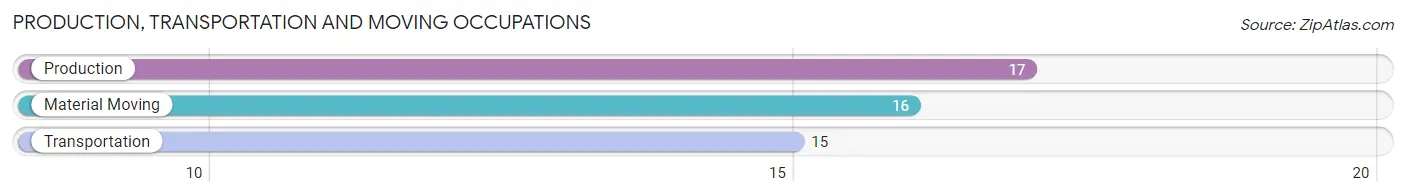
Production, Transportation and Moving Occupations by Sex
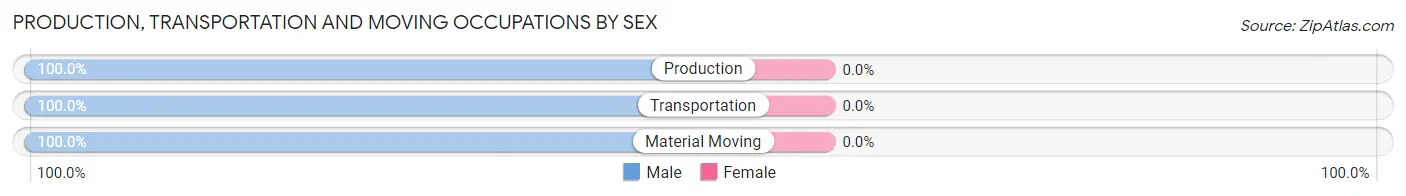
| Occupation | Male | Female |
| Production | 17 (100.0%) | 0 (0.0%) |
| Transportation | 15 (100.0%) | 0 (0.0%) |
| Material Moving | 16 (100.0%) | 0 (0.0%) |
| Total (Category) | 48 (100.0%) | 0 (0.0%) |
| Total (Overall) | 729 (44.8%) | 900 (55.2%) |
Employment Industries by Sex in Wilbraham
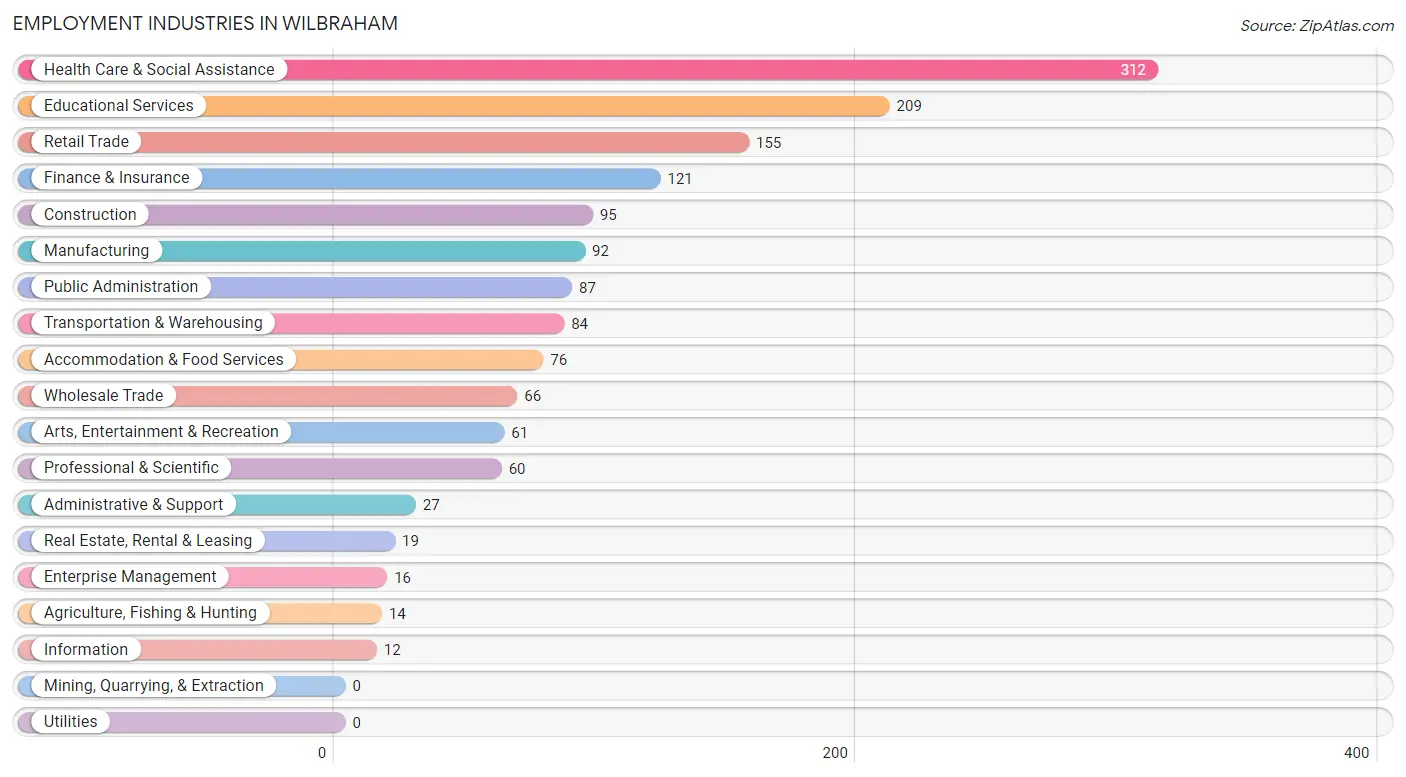
Employment Industries in Wilbraham
The major employment industries in Wilbraham include Health Care & Social Assistance (312 | 19.2%), Educational Services (209 | 12.8%), Retail Trade (155 | 9.5%), Finance & Insurance (121 | 7.4%), and Construction (95 | 5.8%).
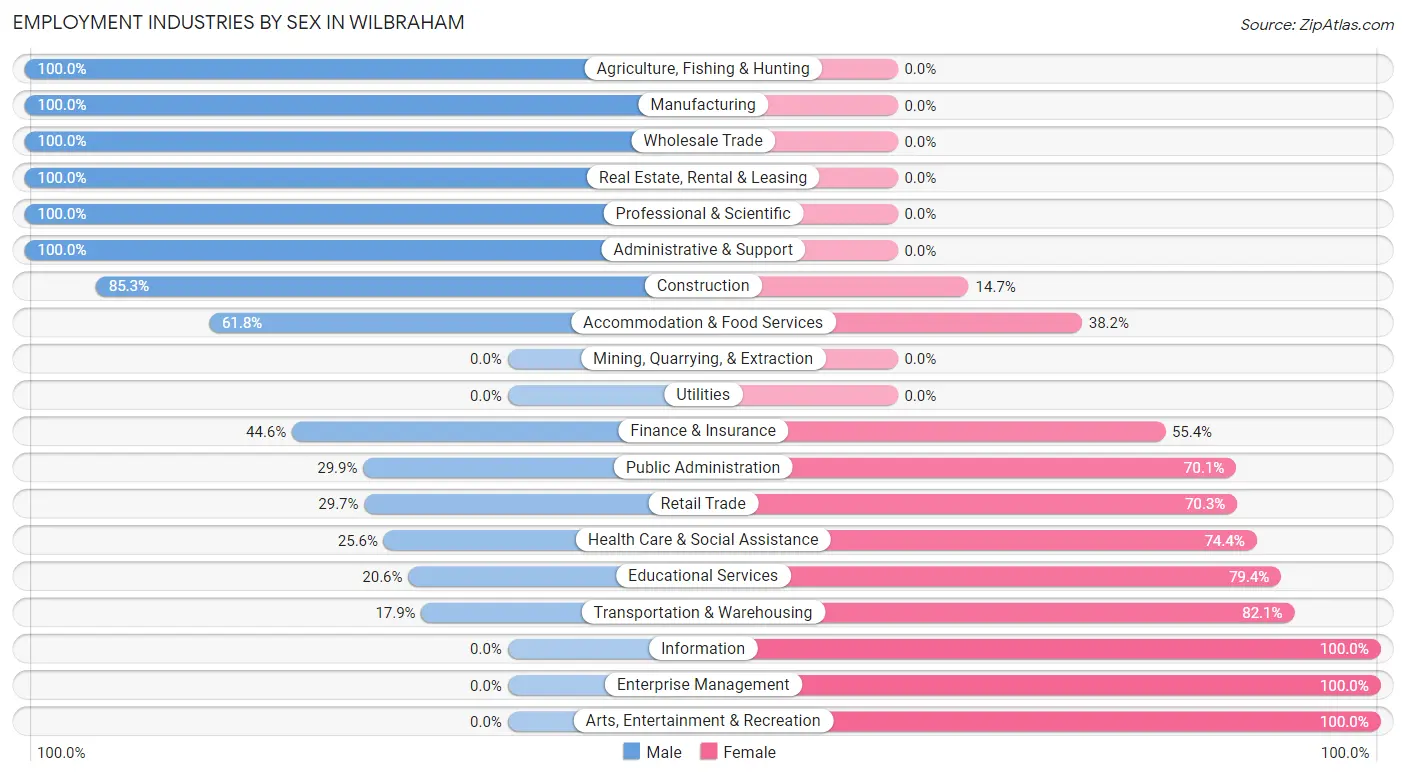
Employment Industries by Sex in Wilbraham
The Wilbraham industries that see more men than women are Agriculture, Fishing & Hunting (100.0%), Manufacturing (100.0%), and Wholesale Trade (100.0%), whereas the industries that tend to have a higher number of women are Information (100.0%), Enterprise Management (100.0%), and Arts, Entertainment & Recreation (100.0%).
| Industry | Male | Female |
| Agriculture, Fishing & Hunting | 14 (100.0%) | 0 (0.0%) |
| Mining, Quarrying, & Extraction | 0 (0.0%) | 0 (0.0%) |
| Construction | 81 (85.3%) | 14 (14.7%) |
| Manufacturing | 92 (100.0%) | 0 (0.0%) |
| Wholesale Trade | 66 (100.0%) | 0 (0.0%) |
| Retail Trade | 46 (29.7%) | 109 (70.3%) |
| Transportation & Warehousing | 15 (17.9%) | 69 (82.1%) |
| Utilities | 0 (0.0%) | 0 (0.0%) |
| Information | 0 (0.0%) | 12 (100.0%) |
| Finance & Insurance | 54 (44.6%) | 67 (55.4%) |
| Real Estate, Rental & Leasing | 19 (100.0%) | 0 (0.0%) |
| Professional & Scientific | 60 (100.0%) | 0 (0.0%) |
| Enterprise Management | 0 (0.0%) | 16 (100.0%) |
| Administrative & Support | 27 (100.0%) | 0 (0.0%) |
| Educational Services | 43 (20.6%) | 166 (79.4%) |
| Health Care & Social Assistance | 80 (25.6%) | 232 (74.4%) |
| Arts, Entertainment & Recreation | 0 (0.0%) | 61 (100.0%) |
| Accommodation & Food Services | 47 (61.8%) | 29 (38.2%) |
| Public Administration | 26 (29.9%) | 61 (70.1%) |
| Total | 729 (44.8%) | 900 (55.2%) |
Education in Wilbraham
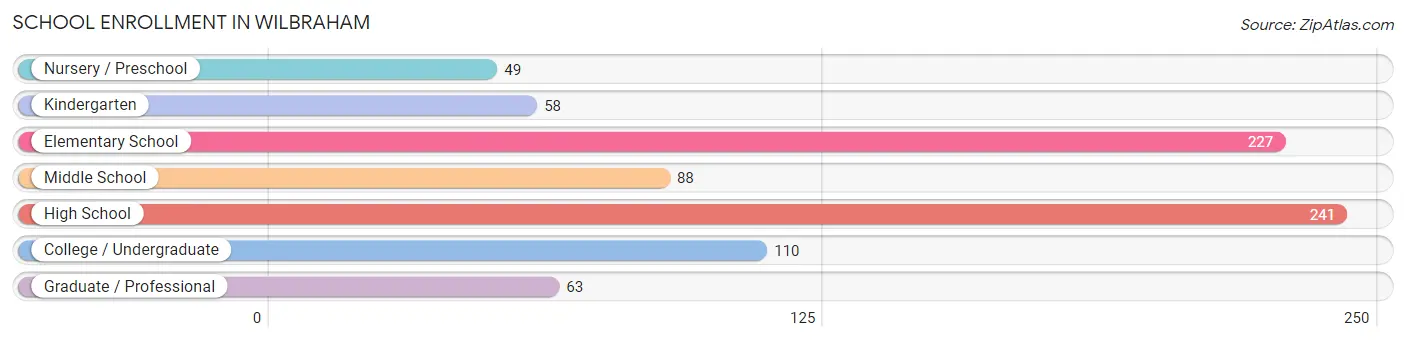
School Enrollment in Wilbraham
The most common levels of schooling among the 836 students in Wilbraham are high school (241 | 28.8%), elementary school (227 | 27.2%), and college / undergraduate (110 | 13.2%).
| School Level | # Students | % Students |
| Nursery / Preschool | 49 | 5.9% |
| Kindergarten | 58 | 6.9% |
| Elementary School | 227 | 27.2% |
| Middle School | 88 | 10.5% |
| High School | 241 | 28.8% |
| College / Undergraduate | 110 | 13.2% |
| Graduate / Professional | 63 | 7.5% |
| Total | 836 | 100.0% |
School Enrollment by Age by Funding Source in Wilbraham
Out of a total of 836 students who are enrolled in schools in Wilbraham, 103 (12.3%) attend a private institution, while the remaining 733 (87.7%) are enrolled in public schools. The age group of 35 years and over has the highest likelihood of being enrolled in private schools, with 18 (100.0% in the age bracket) enrolled. Conversely, the age group of 3 to 4 year olds has the lowest likelihood of being enrolled in a private school, with 49 (100.0% in the age bracket) attending a public institution.
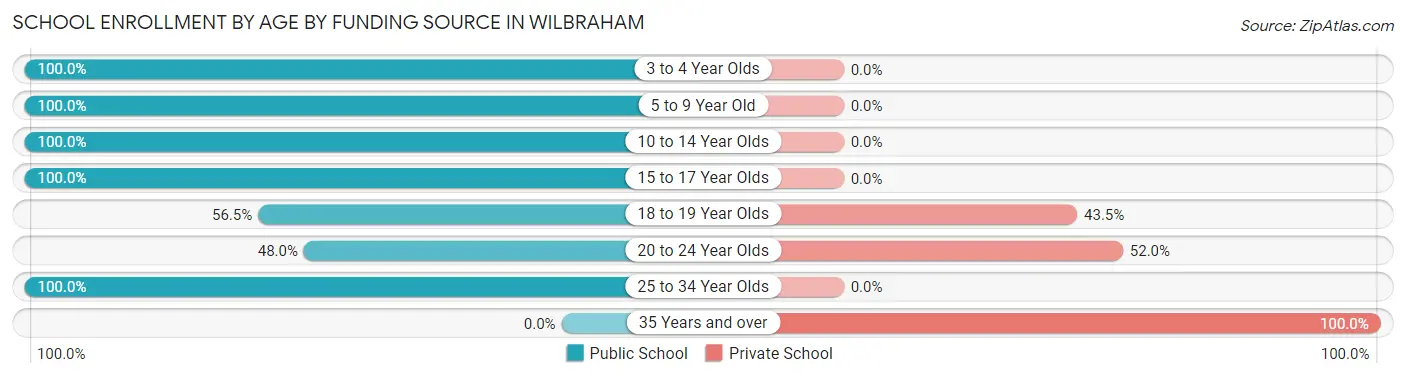
| Age Bracket | Public School | Private School |
| 3 to 4 Year Olds | 49 (100.0%) | 0 (0.0%) |
| 5 to 9 Year Old | 285 (100.0%) | 0 (0.0%) |
| 10 to 14 Year Olds | 146 (100.0%) | 0 (0.0%) |
| 15 to 17 Year Olds | 122 (100.0%) | 0 (0.0%) |
| 18 to 19 Year Olds | 26 (56.5%) | 20 (43.5%) |
| 20 to 24 Year Olds | 60 (48.0%) | 65 (52.0%) |
| 25 to 34 Year Olds | 45 (100.0%) | 0 (0.0%) |
| 35 Years and over | 0 (0.0%) | 18 (100.0%) |
| Total | 733 (87.7%) | 103 (12.3%) |
Educational Attainment by Field of Study in Wilbraham
Education (202 | 15.0%), computers & mathematics (151 | 11.2%), science & technology (151 | 11.2%), business (149 | 11.1%), and psychology (137 | 10.2%) are the most common fields of study among 1,346 individuals in Wilbraham who have obtained a bachelor's degree or higher.
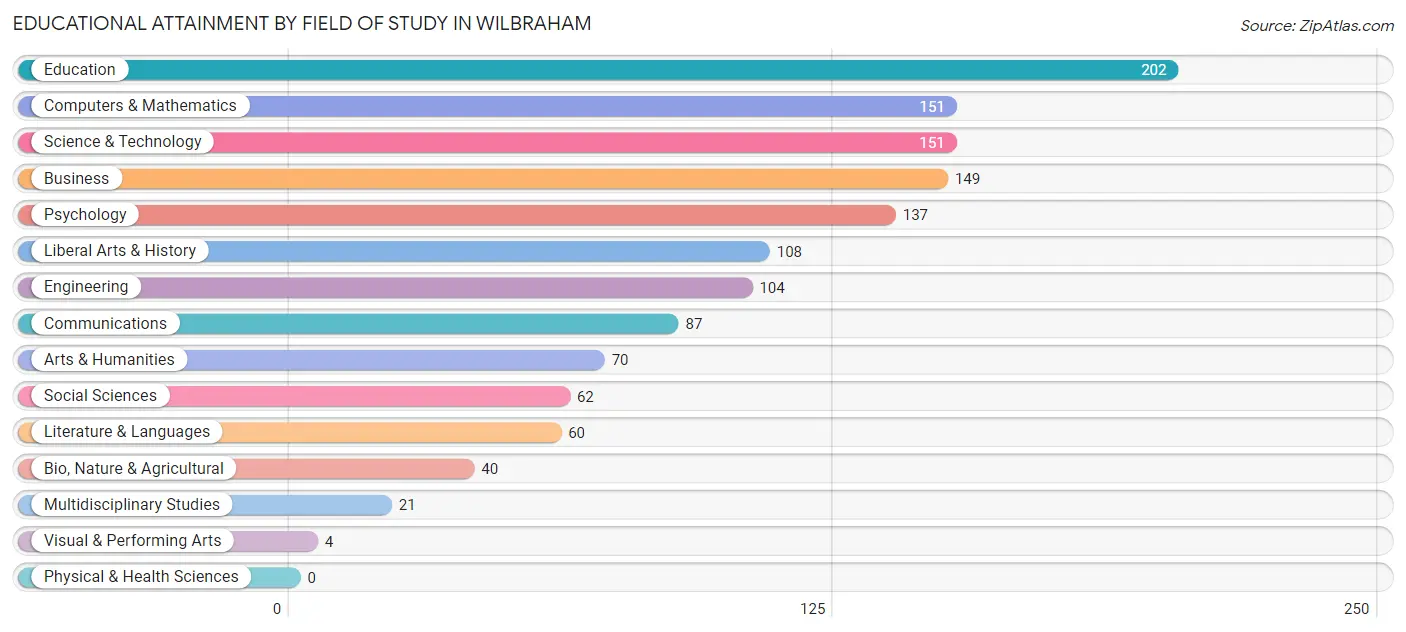
| Field of Study | # Graduates | % Graduates |
| Computers & Mathematics | 151 | 11.2% |
| Bio, Nature & Agricultural | 40 | 3.0% |
| Physical & Health Sciences | 0 | 0.0% |
| Psychology | 137 | 10.2% |
| Social Sciences | 62 | 4.6% |
| Engineering | 104 | 7.7% |
| Multidisciplinary Studies | 21 | 1.6% |
| Science & Technology | 151 | 11.2% |
| Business | 149 | 11.1% |
| Education | 202 | 15.0% |
| Literature & Languages | 60 | 4.5% |
| Liberal Arts & History | 108 | 8.0% |
| Visual & Performing Arts | 4 | 0.3% |
| Communications | 87 | 6.5% |
| Arts & Humanities | 70 | 5.2% |
| Total | 1,346 | 100.0% |
Transportation & Commute in Wilbraham
Vehicle Availability by Sex in Wilbraham
The most prevalent vehicle ownership categories in Wilbraham are males with 2 vehicles (339, accounting for 47.4%) and females with 2 vehicles (573, making up 38.5%).
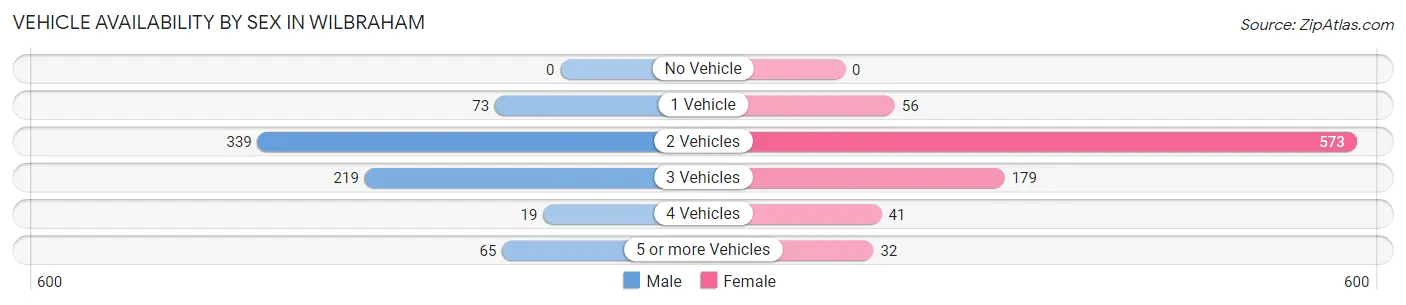
| Vehicles Available | Male | Female |
| No Vehicle | 0 (0.0%) | 0 (0.0%) |
| 1 Vehicle | 73 (10.2%) | 56 (6.4%) |
| 2 Vehicles | 339 (47.4%) | 573 (65.0%) |
| 3 Vehicles | 219 (30.6%) | 179 (20.3%) |
| 4 Vehicles | 19 (2.7%) | 41 (4.6%) |
| 5 or more Vehicles | 65 (9.1%) | 32 (3.6%) |
| Total | 715 (100.0%) | 881 (100.0%) |
Commute Time in Wilbraham
The most frequently occuring commute durations in Wilbraham are 20 to 24 minutes (256 commuters, 17.6%), 30 to 34 minutes (249 commuters, 17.1%), and 5 to 9 minutes (204 commuters, 14.0%).
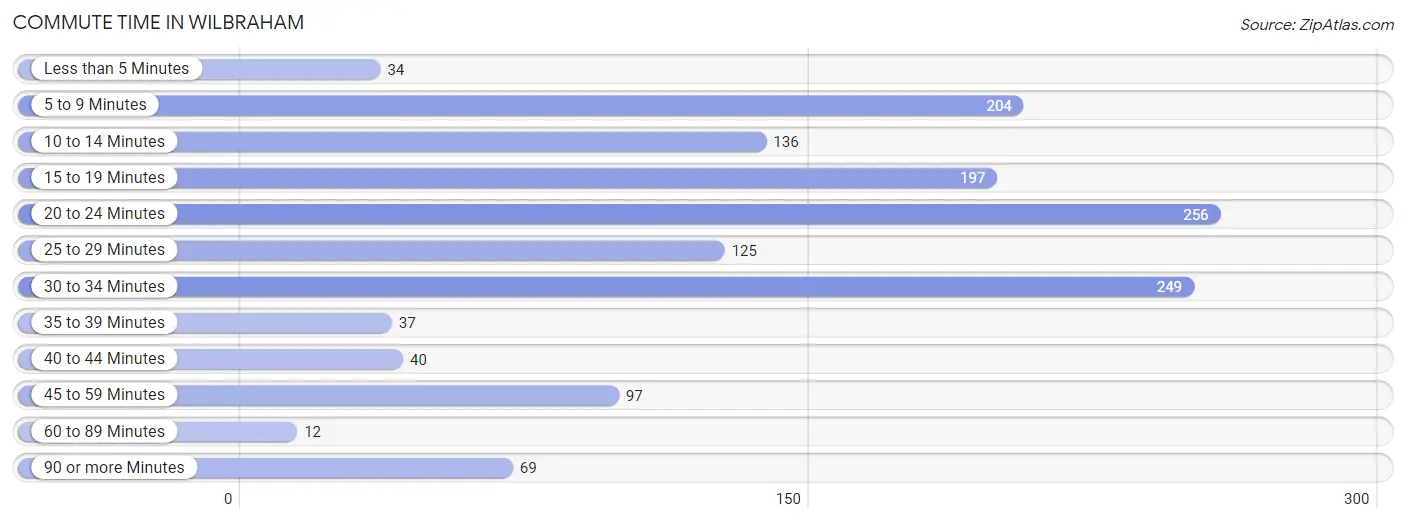
| Commute Time | # Commuters | % Commuters |
| Less than 5 Minutes | 34 | 2.3% |
| 5 to 9 Minutes | 204 | 14.0% |
| 10 to 14 Minutes | 136 | 9.3% |
| 15 to 19 Minutes | 197 | 13.5% |
| 20 to 24 Minutes | 256 | 17.6% |
| 25 to 29 Minutes | 125 | 8.6% |
| 30 to 34 Minutes | 249 | 17.1% |
| 35 to 39 Minutes | 37 | 2.5% |
| 40 to 44 Minutes | 40 | 2.8% |
| 45 to 59 Minutes | 97 | 6.7% |
| 60 to 89 Minutes | 12 | 0.8% |
| 90 or more Minutes | 69 | 4.7% |
Commute Time by Sex in Wilbraham
The most common commute times in Wilbraham are 20 to 24 minutes (122 commuters, 17.7%) for males and 30 to 34 minutes (164 commuters, 21.4%) for females.
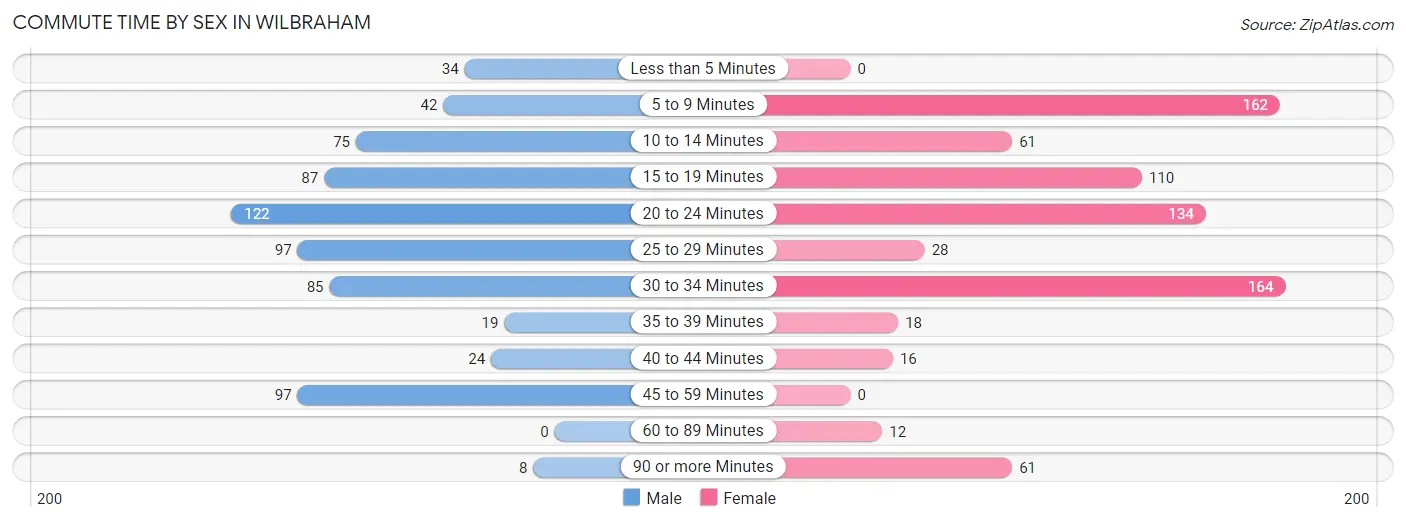
| Commute Time | Male | Female |
| Less than 5 Minutes | 34 (4.9%) | 0 (0.0%) |
| 5 to 9 Minutes | 42 (6.1%) | 162 (21.1%) |
| 10 to 14 Minutes | 75 (10.9%) | 61 (8.0%) |
| 15 to 19 Minutes | 87 (12.6%) | 110 (14.4%) |
| 20 to 24 Minutes | 122 (17.7%) | 134 (17.5%) |
| 25 to 29 Minutes | 97 (14.1%) | 28 (3.7%) |
| 30 to 34 Minutes | 85 (12.3%) | 164 (21.4%) |
| 35 to 39 Minutes | 19 (2.8%) | 18 (2.4%) |
| 40 to 44 Minutes | 24 (3.5%) | 16 (2.1%) |
| 45 to 59 Minutes | 97 (14.1%) | 0 (0.0%) |
| 60 to 89 Minutes | 0 (0.0%) | 12 (1.6%) |
| 90 or more Minutes | 8 (1.2%) | 61 (8.0%) |
Time of Departure to Work by Sex in Wilbraham
The most frequent times of departure to work in Wilbraham are 7:00 AM to 7:29 AM (169, 24.5%) for males and 6:30 AM to 6:59 AM (148, 19.3%) for females.
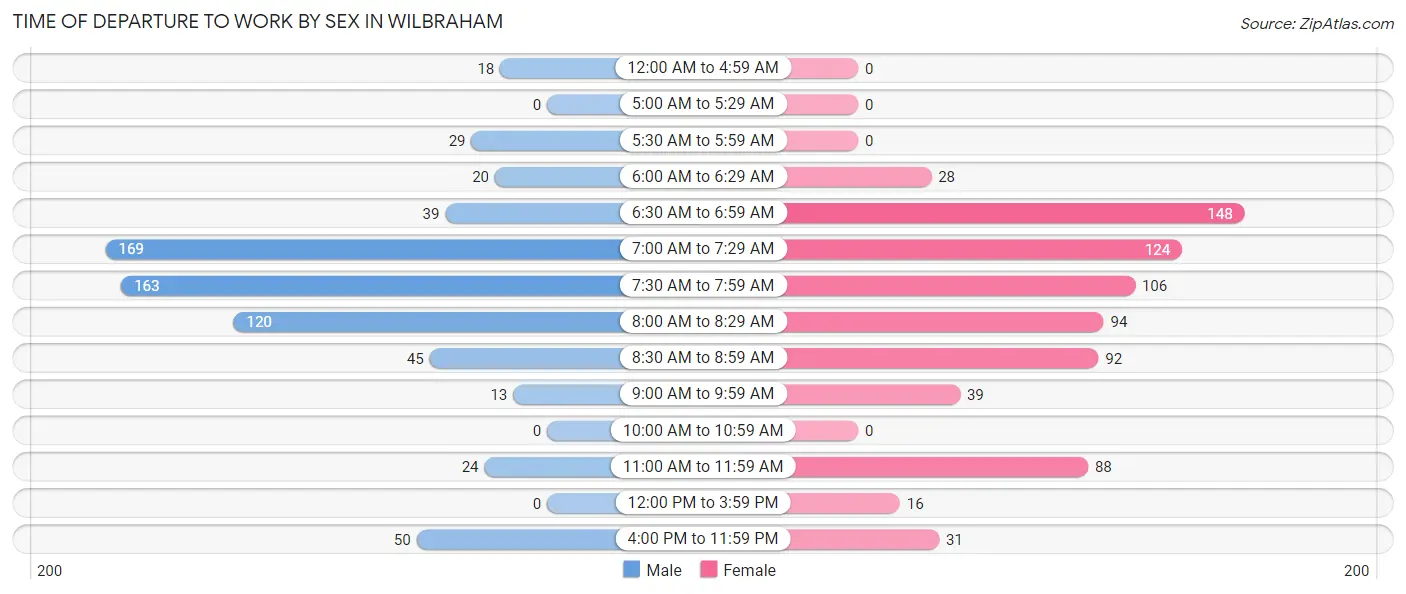
| Time of Departure | Male | Female |
| 12:00 AM to 4:59 AM | 18 (2.6%) | 0 (0.0%) |
| 5:00 AM to 5:29 AM | 0 (0.0%) | 0 (0.0%) |
| 5:30 AM to 5:59 AM | 29 (4.2%) | 0 (0.0%) |
| 6:00 AM to 6:29 AM | 20 (2.9%) | 28 (3.7%) |
| 6:30 AM to 6:59 AM | 39 (5.7%) | 148 (19.3%) |
| 7:00 AM to 7:29 AM | 169 (24.5%) | 124 (16.2%) |
| 7:30 AM to 7:59 AM | 163 (23.6%) | 106 (13.8%) |
| 8:00 AM to 8:29 AM | 120 (17.4%) | 94 (12.3%) |
| 8:30 AM to 8:59 AM | 45 (6.5%) | 92 (12.0%) |
| 9:00 AM to 9:59 AM | 13 (1.9%) | 39 (5.1%) |
| 10:00 AM to 10:59 AM | 0 (0.0%) | 0 (0.0%) |
| 11:00 AM to 11:59 AM | 24 (3.5%) | 88 (11.5%) |
| 12:00 PM to 3:59 PM | 0 (0.0%) | 16 (2.1%) |
| 4:00 PM to 11:59 PM | 50 (7.2%) | 31 (4.1%) |
| Total | 690 (100.0%) | 766 (100.0%) |
Housing Occupancy in Wilbraham
Occupancy by Ownership in Wilbraham
Of the total 1,402 dwellings in Wilbraham, owner-occupied units account for 1,194 (85.2%), while renter-occupied units make up 208 (14.8%).
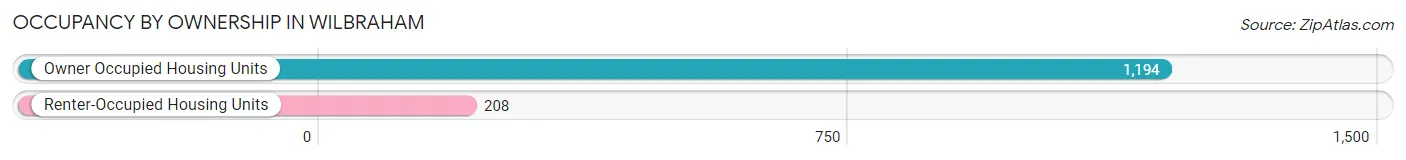
| Occupancy | # Housing Units | % Housing Units |
| Owner Occupied Housing Units | 1,194 | 85.2% |
| Renter-Occupied Housing Units | 208 | 14.8% |
| Total Occupied Housing Units | 1,402 | 100.0% |
Occupancy by Household Size in Wilbraham
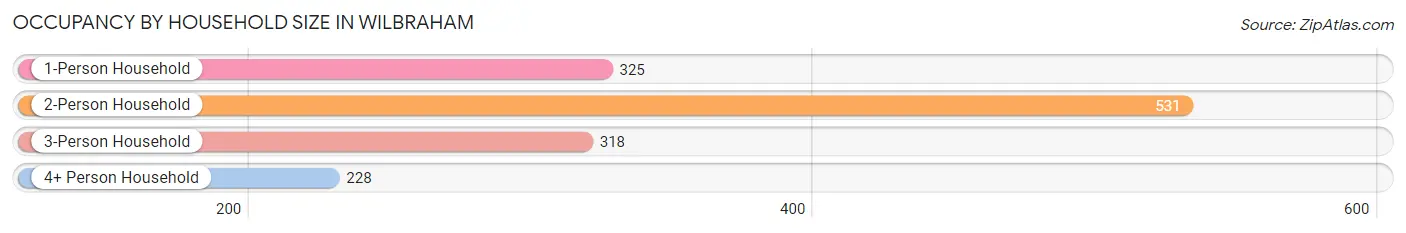
| Household Size | # Housing Units | % Housing Units |
| 1-Person Household | 325 | 23.2% |
| 2-Person Household | 531 | 37.9% |
| 3-Person Household | 318 | 22.7% |
| 4+ Person Household | 228 | 16.3% |
| Total Housing Units | 1,402 | 100.0% |
Occupancy by Ownership by Household Size in Wilbraham
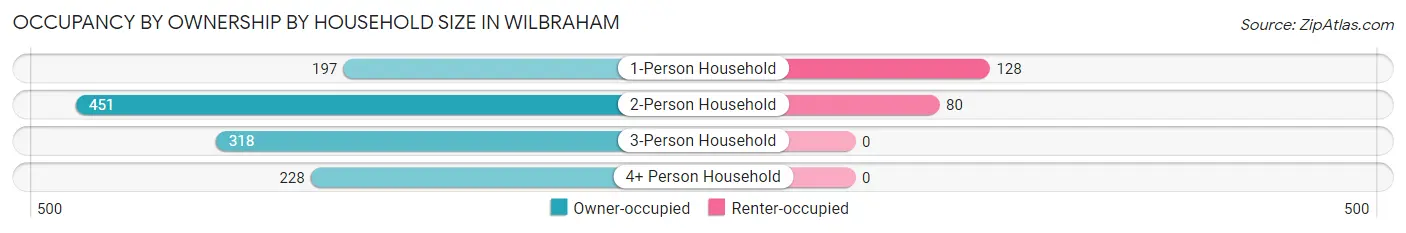
| Household Size | Owner-occupied | Renter-occupied |
| 1-Person Household | 197 (60.6%) | 128 (39.4%) |
| 2-Person Household | 451 (84.9%) | 80 (15.1%) |
| 3-Person Household | 318 (100.0%) | 0 (0.0%) |
| 4+ Person Household | 228 (100.0%) | 0 (0.0%) |
| Total Housing Units | 1,194 (85.2%) | 208 (14.8%) |
Occupancy by Educational Attainment in Wilbraham
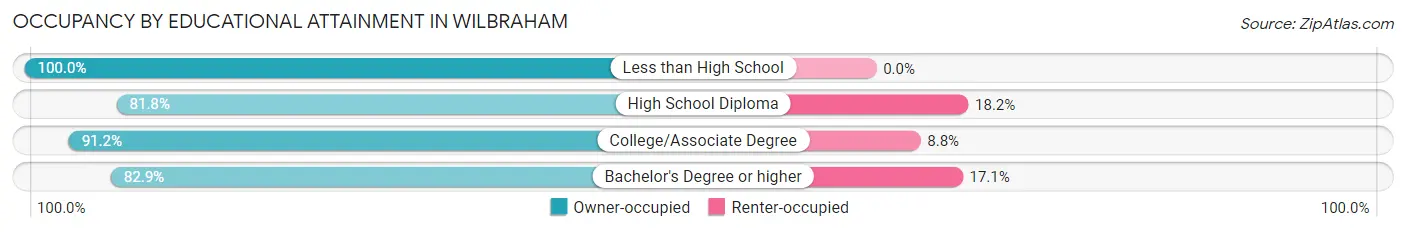
| Household Size | Owner-occupied | Renter-occupied |
| Less than High School | 10 (100.0%) | 0 (0.0%) |
| High School Diploma | 296 (81.8%) | 66 (18.2%) |
| College/Associate Degree | 375 (91.2%) | 36 (8.8%) |
| Bachelor's Degree or higher | 513 (82.9%) | 106 (17.1%) |
Occupancy by Age of Householder in Wilbraham
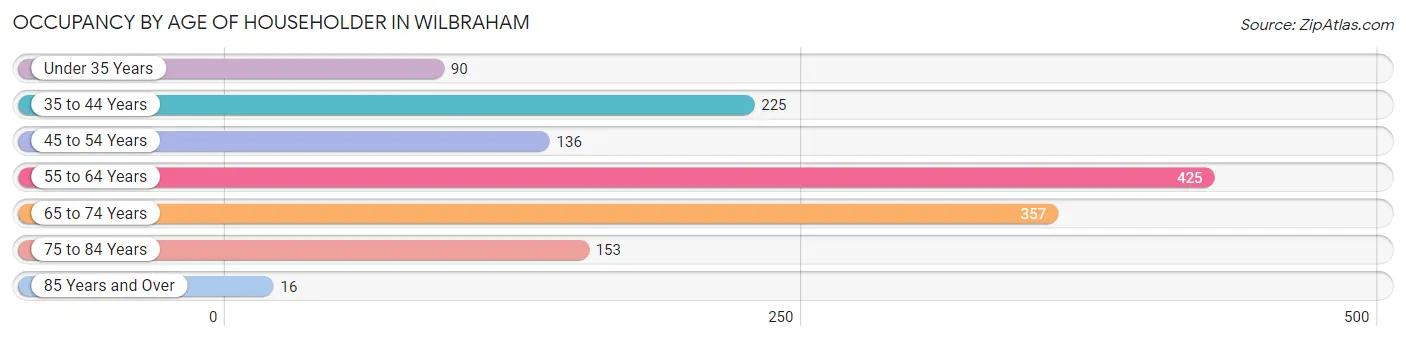
| Age Bracket | # Households | % Households |
| Under 35 Years | 90 | 6.4% |
| 35 to 44 Years | 225 | 16.1% |
| 45 to 54 Years | 136 | 9.7% |
| 55 to 64 Years | 425 | 30.3% |
| 65 to 74 Years | 357 | 25.5% |
| 75 to 84 Years | 153 | 10.9% |
| 85 Years and Over | 16 | 1.1% |
| Total | 1,402 | 100.0% |
Housing Finances in Wilbraham
Median Income by Occupancy in Wilbraham
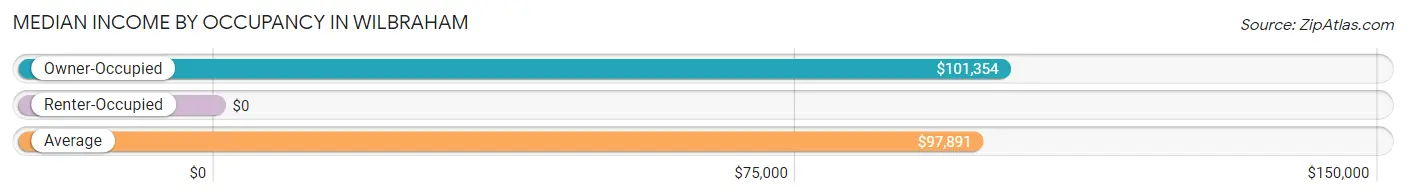
| Occupancy Type | # Households | Median Income |
| Owner-Occupied | 1,194 (85.2%) | $101,354 |
| Renter-Occupied | 208 (14.8%) | $0 |
| Average | 1,402 (100.0%) | $97,891 |
Occupancy by Householder Income Bracket in Wilbraham
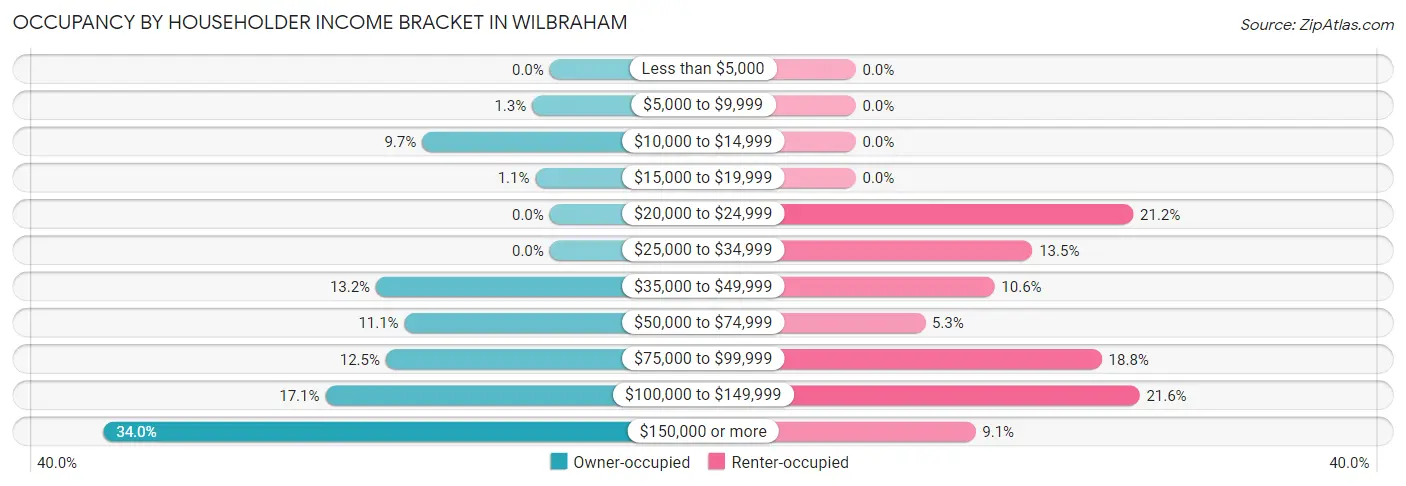
| Income Bracket | Owner-occupied | Renter-occupied |
| Less than $5,000 | 0 (0.0%) | 0 (0.0%) |
| $5,000 to $9,999 | 16 (1.3%) | 0 (0.0%) |
| $10,000 to $14,999 | 116 (9.7%) | 0 (0.0%) |
| $15,000 to $19,999 | 13 (1.1%) | 0 (0.0%) |
| $20,000 to $24,999 | 0 (0.0%) | 44 (21.1%) |
| $25,000 to $34,999 | 0 (0.0%) | 28 (13.5%) |
| $35,000 to $49,999 | 158 (13.2%) | 22 (10.6%) |
| $50,000 to $74,999 | 132 (11.1%) | 11 (5.3%) |
| $75,000 to $99,999 | 149 (12.5%) | 39 (18.8%) |
| $100,000 to $149,999 | 204 (17.1%) | 45 (21.6%) |
| $150,000 or more | 406 (34.0%) | 19 (9.1%) |
| Total | 1,194 (100.0%) | 208 (100.0%) |
Monthly Housing Cost Tiers in Wilbraham
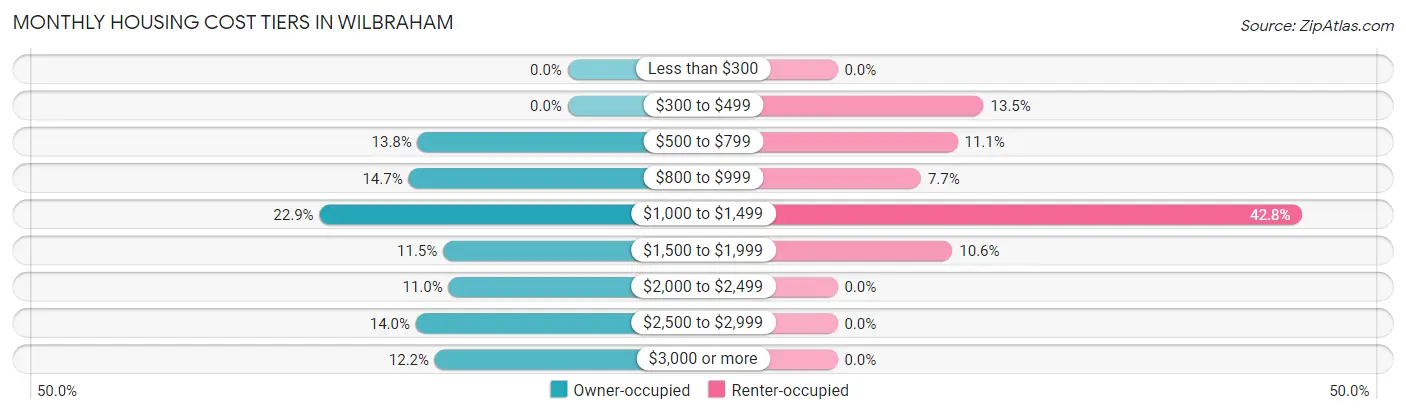
| Monthly Cost | Owner-occupied | Renter-occupied |
| Less than $300 | 0 (0.0%) | 0 (0.0%) |
| $300 to $499 | 0 (0.0%) | 28 (13.5%) |
| $500 to $799 | 165 (13.8%) | 23 (11.1%) |
| $800 to $999 | 175 (14.7%) | 16 (7.7%) |
| $1,000 to $1,499 | 273 (22.9%) | 89 (42.8%) |
| $1,500 to $1,999 | 137 (11.5%) | 22 (10.6%) |
| $2,000 to $2,499 | 131 (11.0%) | 0 (0.0%) |
| $2,500 to $2,999 | 167 (14.0%) | 0 (0.0%) |
| $3,000 or more | 146 (12.2%) | 0 (0.0%) |
| Total | 1,194 (100.0%) | 208 (100.0%) |
Physical Housing Characteristics in Wilbraham
Housing Structures in Wilbraham
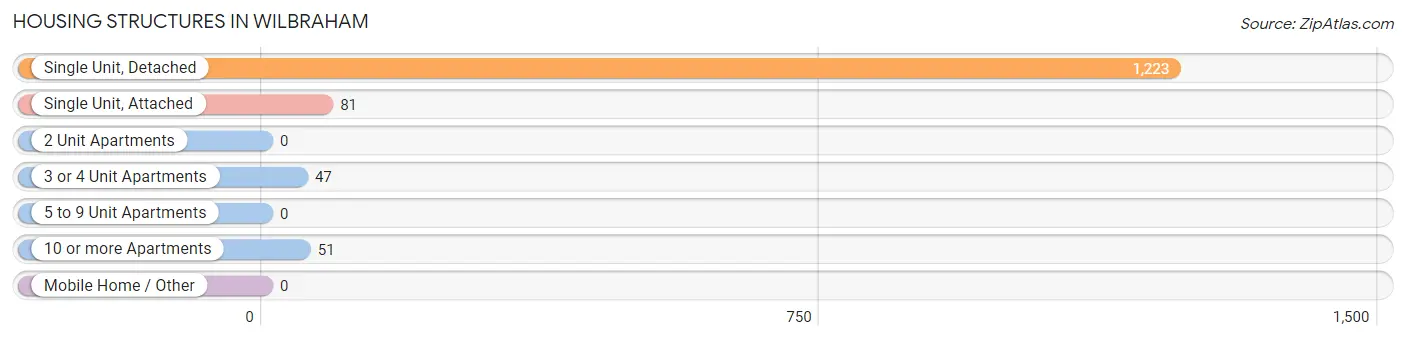
| Structure Type | # Housing Units | % Housing Units |
| Single Unit, Detached | 1,223 | 87.2% |
| Single Unit, Attached | 81 | 5.8% |
| 2 Unit Apartments | 0 | 0.0% |
| 3 or 4 Unit Apartments | 47 | 3.4% |
| 5 to 9 Unit Apartments | 0 | 0.0% |
| 10 or more Apartments | 51 | 3.6% |
| Mobile Home / Other | 0 | 0.0% |
| Total | 1,402 | 100.0% |
Housing Structures by Occupancy in Wilbraham
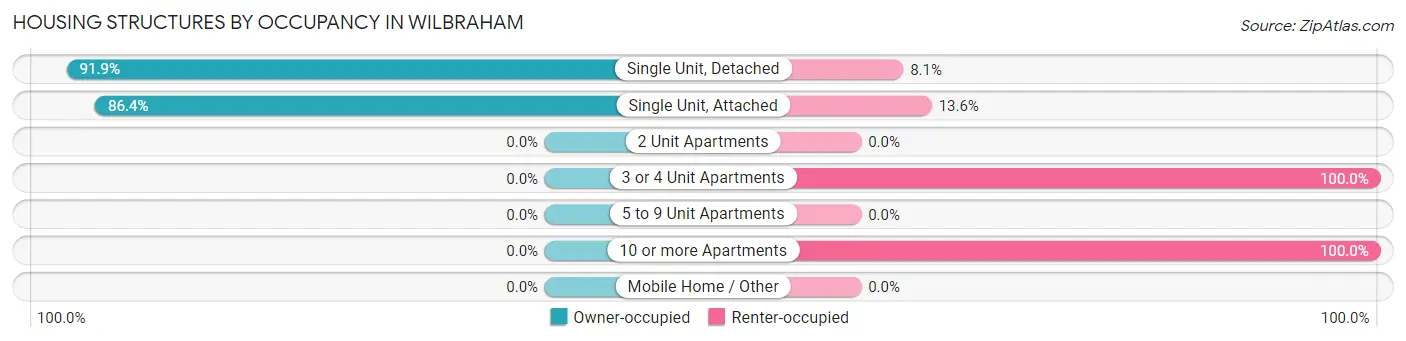
| Structure Type | Owner-occupied | Renter-occupied |
| Single Unit, Detached | 1,124 (91.9%) | 99 (8.1%) |
| Single Unit, Attached | 70 (86.4%) | 11 (13.6%) |
| 2 Unit Apartments | 0 (0.0%) | 0 (0.0%) |
| 3 or 4 Unit Apartments | 0 (0.0%) | 47 (100.0%) |
| 5 to 9 Unit Apartments | 0 (0.0%) | 0 (0.0%) |
| 10 or more Apartments | 0 (0.0%) | 51 (100.0%) |
| Mobile Home / Other | 0 (0.0%) | 0 (0.0%) |
| Total | 1,194 (85.2%) | 208 (14.8%) |
Housing Structures by Number of Rooms in Wilbraham
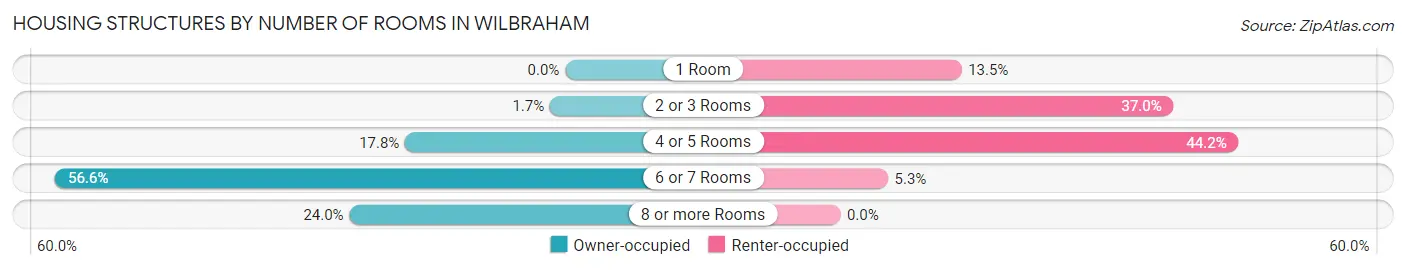
| Number of Rooms | Owner-occupied | Renter-occupied |
| 1 Room | 0 (0.0%) | 28 (13.5%) |
| 2 or 3 Rooms | 20 (1.7%) | 77 (37.0%) |
| 4 or 5 Rooms | 212 (17.8%) | 92 (44.2%) |
| 6 or 7 Rooms | 676 (56.6%) | 11 (5.3%) |
| 8 or more Rooms | 286 (23.9%) | 0 (0.0%) |
| Total | 1,194 (100.0%) | 208 (100.0%) |
Housing Structure by Heating Type in Wilbraham
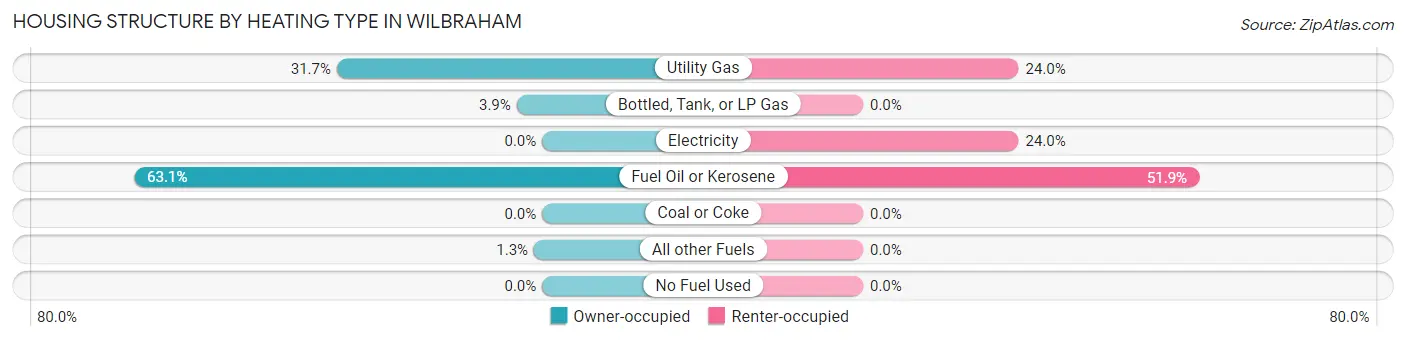
| Heating Type | Owner-occupied | Renter-occupied |
| Utility Gas | 379 (31.7%) | 50 (24.0%) |
| Bottled, Tank, or LP Gas | 47 (3.9%) | 0 (0.0%) |
| Electricity | 0 (0.0%) | 50 (24.0%) |
| Fuel Oil or Kerosene | 753 (63.1%) | 108 (51.9%) |
| Coal or Coke | 0 (0.0%) | 0 (0.0%) |
| All other Fuels | 15 (1.3%) | 0 (0.0%) |
| No Fuel Used | 0 (0.0%) | 0 (0.0%) |
| Total | 1,194 (100.0%) | 208 (100.0%) |
Household Vehicle Usage in Wilbraham
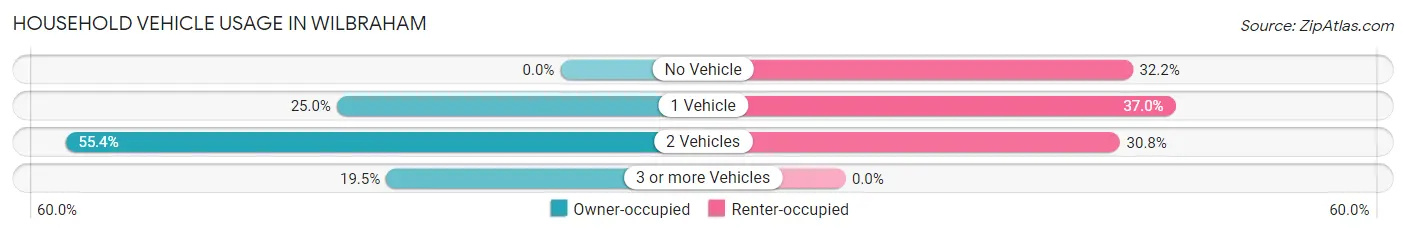
| Vehicles per Household | Owner-occupied | Renter-occupied |
| No Vehicle | 0 (0.0%) | 67 (32.2%) |
| 1 Vehicle | 299 (25.0%) | 77 (37.0%) |
| 2 Vehicles | 662 (55.4%) | 64 (30.8%) |
| 3 or more Vehicles | 233 (19.5%) | 0 (0.0%) |
| Total | 1,194 (100.0%) | 208 (100.0%) |
Real Estate & Mortgages in Wilbraham
Real Estate and Mortgage Overview in Wilbraham
| Characteristic | Without Mortgage | With Mortgage |
| Housing Units | 515 | 679 |
| Median Property Value | $316,200 | $368,600 |
| Median Household Income | - | - |
| Monthly Housing Costs | $885 | $146 |
| Real Estate Taxes | $5,499 | $0 |
Property Value by Mortgage Status in Wilbraham
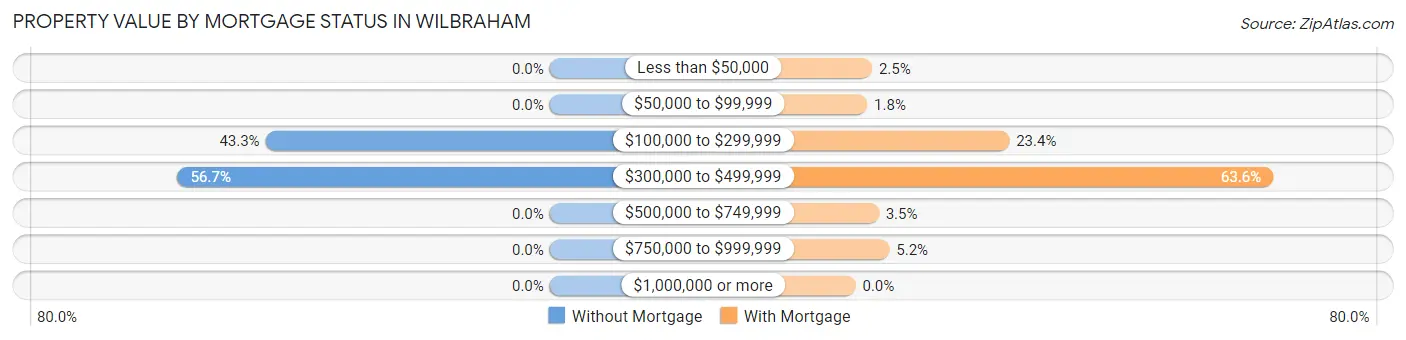
| Property Value | Without Mortgage | With Mortgage |
| Less than $50,000 | 0 (0.0%) | 17 (2.5%) |
| $50,000 to $99,999 | 0 (0.0%) | 12 (1.8%) |
| $100,000 to $299,999 | 223 (43.3%) | 159 (23.4%) |
| $300,000 to $499,999 | 292 (56.7%) | 432 (63.6%) |
| $500,000 to $749,999 | 0 (0.0%) | 24 (3.5%) |
| $750,000 to $999,999 | 0 (0.0%) | 35 (5.1%) |
| $1,000,000 or more | 0 (0.0%) | 0 (0.0%) |
| Total | 515 (100.0%) | 679 (100.0%) |
Household Income by Mortgage Status in Wilbraham
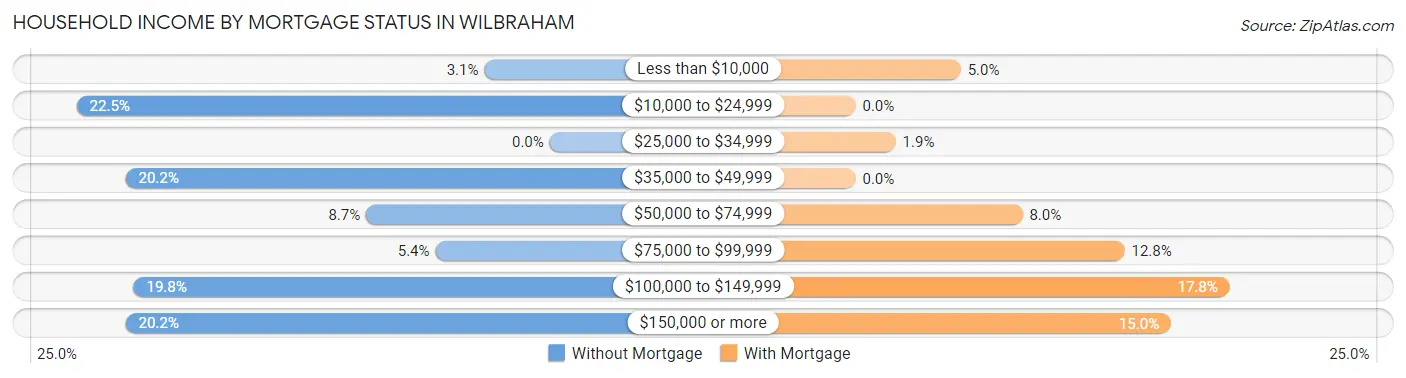
| Household Income | Without Mortgage | With Mortgage |
| Less than $10,000 | 16 (3.1%) | 34 (5.0%) |
| $10,000 to $24,999 | 116 (22.5%) | 0 (0.0%) |
| $25,000 to $34,999 | 0 (0.0%) | 13 (1.9%) |
| $35,000 to $49,999 | 104 (20.2%) | 0 (0.0%) |
| $50,000 to $74,999 | 45 (8.7%) | 54 (8.0%) |
| $75,000 to $99,999 | 28 (5.4%) | 87 (12.8%) |
| $100,000 to $149,999 | 102 (19.8%) | 121 (17.8%) |
| $150,000 or more | 104 (20.2%) | 102 (15.0%) |
| Total | 515 (100.0%) | 679 (100.0%) |
Property Value to Household Income Ratio in Wilbraham
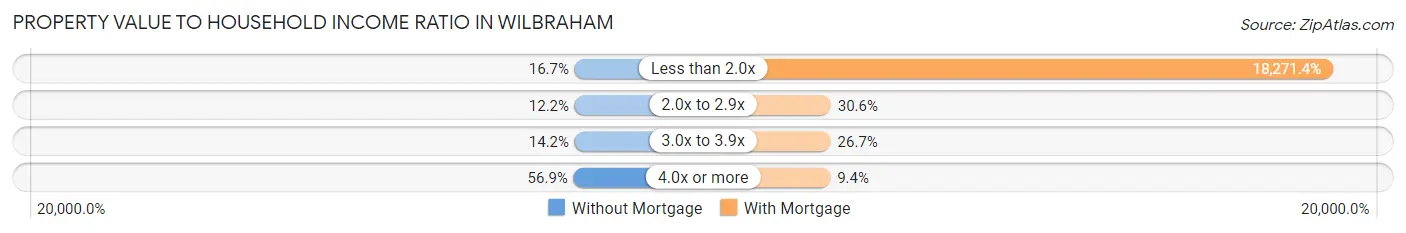
| Value-to-Income Ratio | Without Mortgage | With Mortgage |
| Less than 2.0x | 86 (16.7%) | 124,063 (18,271.4%) |
| 2.0x to 2.9x | 63 (12.2%) | 208 (30.6%) |
| 3.0x to 3.9x | 73 (14.2%) | 181 (26.7%) |
| 4.0x or more | 293 (56.9%) | 64 (9.4%) |
| Total | 515 (100.0%) | 679 (100.0%) |
Real Estate Taxes by Mortgage Status in Wilbraham
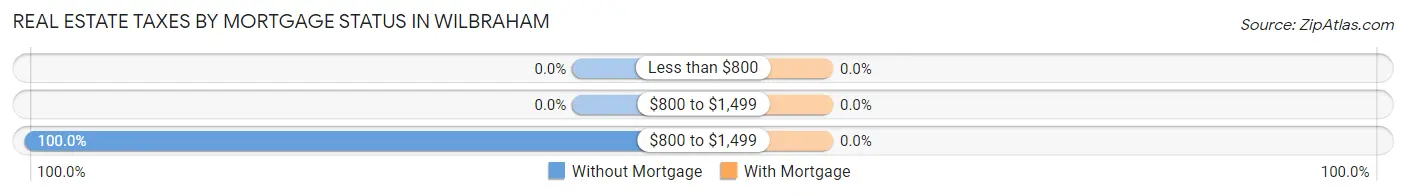
| Property Taxes | Without Mortgage | With Mortgage |
| Less than $800 | 0 (0.0%) | 0 (0.0%) |
| $800 to $1,499 | 0 (0.0%) | 0 (0.0%) |
| $800 to $1,499 | 515 (100.0%) | 0 (0.0%) |
| Total | 515 (100.0%) | 679 (100.0%) |
Health & Disability in Wilbraham
Health Insurance Coverage by Age in Wilbraham
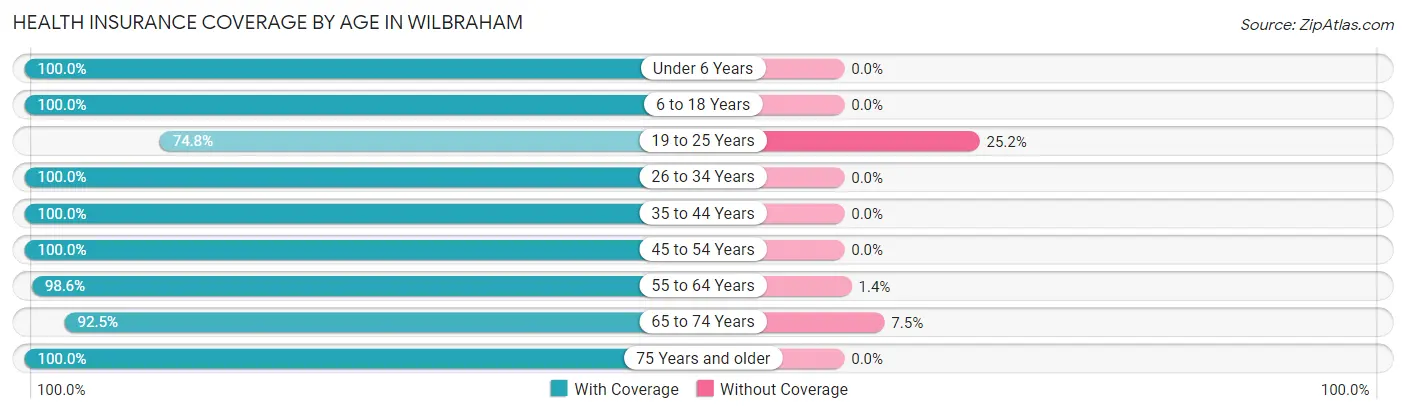
| Age Bracket | With Coverage | Without Coverage |
| Under 6 Years | 121 (100.0%) | 0 (0.0%) |
| 6 to 18 Years | 579 (100.0%) | 0 (0.0%) |
| 19 to 25 Years | 169 (74.8%) | 57 (25.2%) |
| 26 to 34 Years | 310 (100.0%) | 0 (0.0%) |
| 35 to 44 Years | 386 (100.0%) | 0 (0.0%) |
| 45 to 54 Years | 320 (100.0%) | 0 (0.0%) |
| 55 to 64 Years | 652 (98.6%) | 9 (1.4%) |
| 65 to 74 Years | 656 (92.5%) | 53 (7.5%) |
| 75 Years and older | 270 (100.0%) | 0 (0.0%) |
| Total | 3,463 (96.7%) | 119 (3.3%) |
Health Insurance Coverage by Citizenship Status in Wilbraham
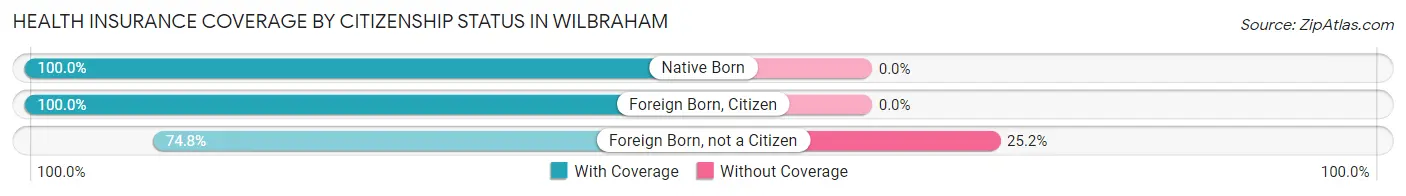
| Citizenship Status | With Coverage | Without Coverage |
| Native Born | 121 (100.0%) | 0 (0.0%) |
| Foreign Born, Citizen | 579 (100.0%) | 0 (0.0%) |
| Foreign Born, not a Citizen | 169 (74.8%) | 57 (25.2%) |
Health Insurance Coverage by Household Income in Wilbraham
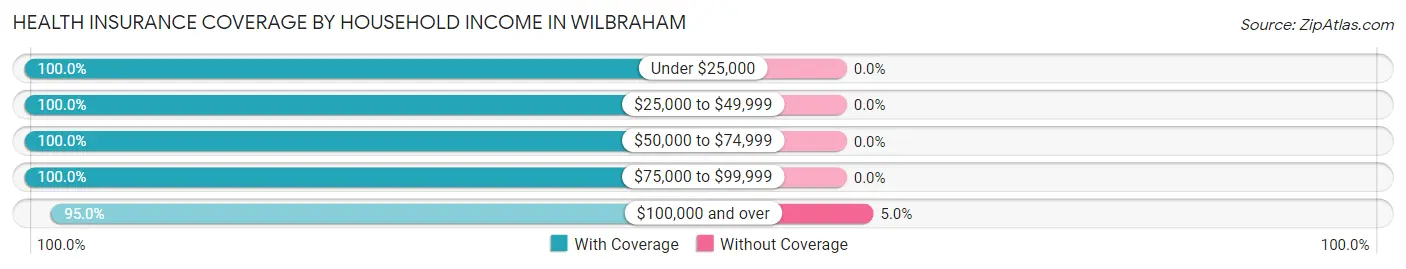
| Household Income | With Coverage | Without Coverage |
| Under $25,000 | 287 (100.0%) | 0 (0.0%) |
| $25,000 to $49,999 | 468 (100.0%) | 0 (0.0%) |
| $50,000 to $74,999 | 428 (100.0%) | 0 (0.0%) |
| $75,000 to $99,999 | 393 (100.0%) | 0 (0.0%) |
| $100,000 and over | 1,821 (95.0%) | 96 (5.0%) |
Public vs Private Health Insurance Coverage by Age in Wilbraham
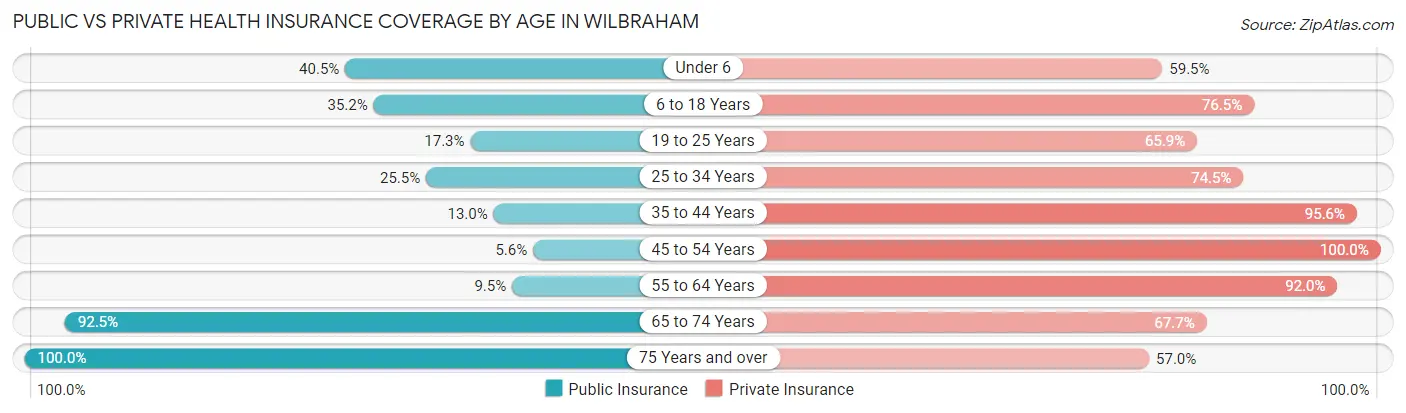
| Age Bracket | Public Insurance | Private Insurance |
| Under 6 | 49 (40.5%) | 72 (59.5%) |
| 6 to 18 Years | 204 (35.2%) | 443 (76.5%) |
| 19 to 25 Years | 39 (17.3%) | 149 (65.9%) |
| 25 to 34 Years | 79 (25.5%) | 231 (74.5%) |
| 35 to 44 Years | 50 (13.0%) | 369 (95.6%) |
| 45 to 54 Years | 18 (5.6%) | 320 (100.0%) |
| 55 to 64 Years | 63 (9.5%) | 608 (92.0%) |
| 65 to 74 Years | 656 (92.5%) | 480 (67.7%) |
| 75 Years and over | 270 (100.0%) | 154 (57.0%) |
| Total | 1,428 (39.9%) | 2,826 (78.9%) |
Disability Status by Sex by Age in Wilbraham
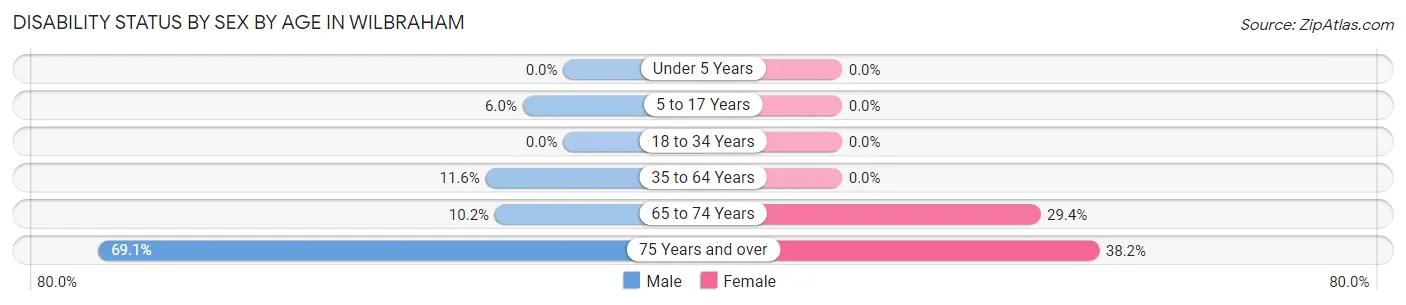
| Age Bracket | Male | Female |
| Under 5 Years | 0 (0.0%) | 0 (0.0%) |
| 5 to 17 Years | 19 (6.0%) | 0 (0.0%) |
| 18 to 34 Years | 0 (0.0%) | 0 (0.0%) |
| 35 to 64 Years | 75 (11.6%) | 0 (0.0%) |
| 65 to 74 Years | 32 (10.2%) | 116 (29.4%) |
| 75 Years and over | 96 (69.1%) | 50 (38.2%) |
Disability Class by Sex by Age in Wilbraham
Disability Class: Hearing Difficulty
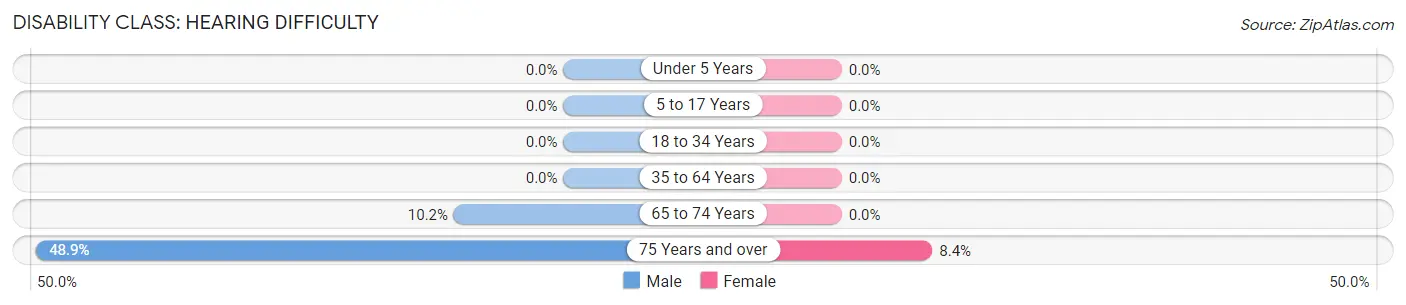
| Age Bracket | Male | Female |
| Under 5 Years | 0 (0.0%) | 0 (0.0%) |
| 5 to 17 Years | 0 (0.0%) | 0 (0.0%) |
| 18 to 34 Years | 0 (0.0%) | 0 (0.0%) |
| 35 to 64 Years | 0 (0.0%) | 0 (0.0%) |
| 65 to 74 Years | 32 (10.2%) | 0 (0.0%) |
| 75 Years and over | 68 (48.9%) | 11 (8.4%) |
Disability Class: Vision Difficulty
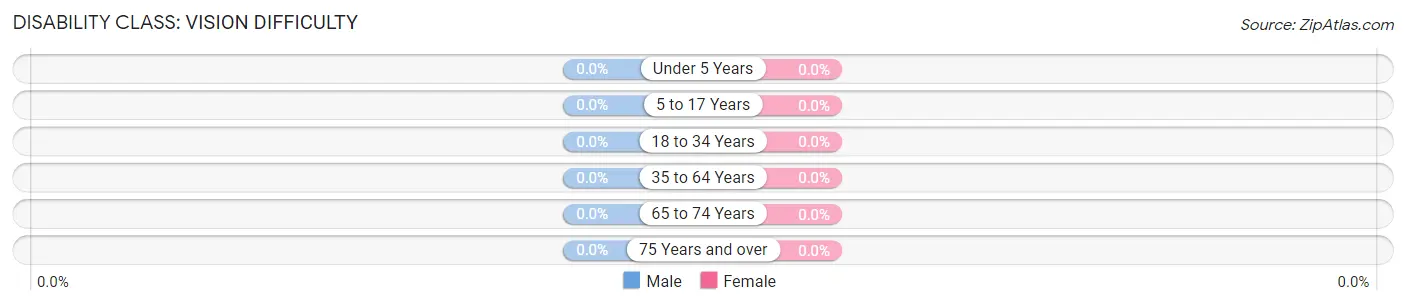
| Age Bracket | Male | Female |
| Under 5 Years | 0 (0.0%) | 0 (0.0%) |
| 5 to 17 Years | 0 (0.0%) | 0 (0.0%) |
| 18 to 34 Years | 0 (0.0%) | 0 (0.0%) |
| 35 to 64 Years | 0 (0.0%) | 0 (0.0%) |
| 65 to 74 Years | 0 (0.0%) | 0 (0.0%) |
| 75 Years and over | 0 (0.0%) | 0 (0.0%) |
Disability Class: Cognitive Difficulty
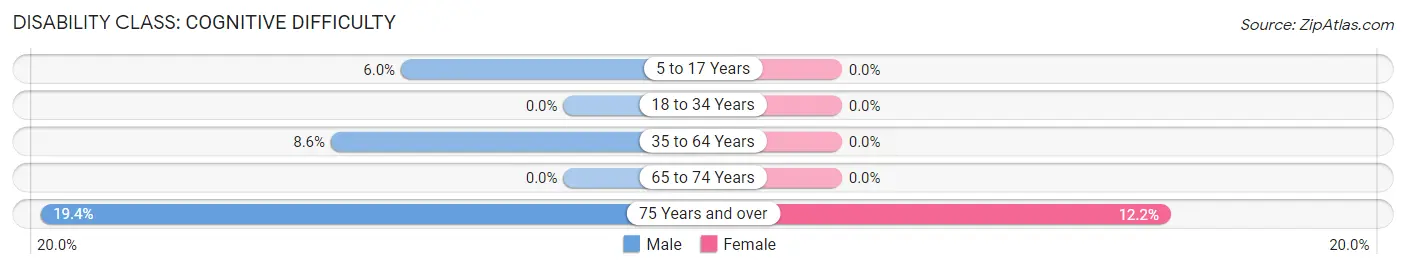
| Age Bracket | Male | Female |
| 5 to 17 Years | 19 (6.0%) | 0 (0.0%) |
| 18 to 34 Years | 0 (0.0%) | 0 (0.0%) |
| 35 to 64 Years | 56 (8.6%) | 0 (0.0%) |
| 65 to 74 Years | 0 (0.0%) | 0 (0.0%) |
| 75 Years and over | 27 (19.4%) | 16 (12.2%) |
Disability Class: Ambulatory Difficulty
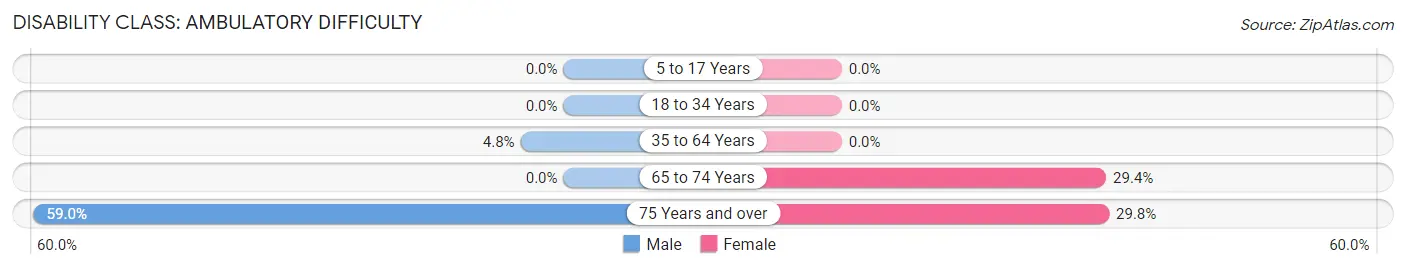
| Age Bracket | Male | Female |
| 5 to 17 Years | 0 (0.0%) | 0 (0.0%) |
| 18 to 34 Years | 0 (0.0%) | 0 (0.0%) |
| 35 to 64 Years | 31 (4.8%) | 0 (0.0%) |
| 65 to 74 Years | 0 (0.0%) | 116 (29.4%) |
| 75 Years and over | 82 (59.0%) | 39 (29.8%) |
Disability Class: Self-Care Difficulty
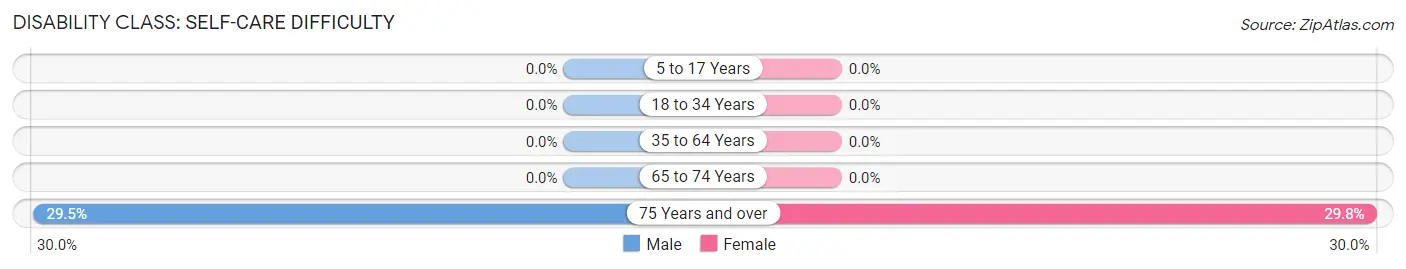
| Age Bracket | Male | Female |
| 5 to 17 Years | 0 (0.0%) | 0 (0.0%) |
| 18 to 34 Years | 0 (0.0%) | 0 (0.0%) |
| 35 to 64 Years | 0 (0.0%) | 0 (0.0%) |
| 65 to 74 Years | 0 (0.0%) | 0 (0.0%) |
| 75 Years and over | 41 (29.5%) | 39 (29.8%) |
Technology Access in Wilbraham
Computing Device Access in Wilbraham
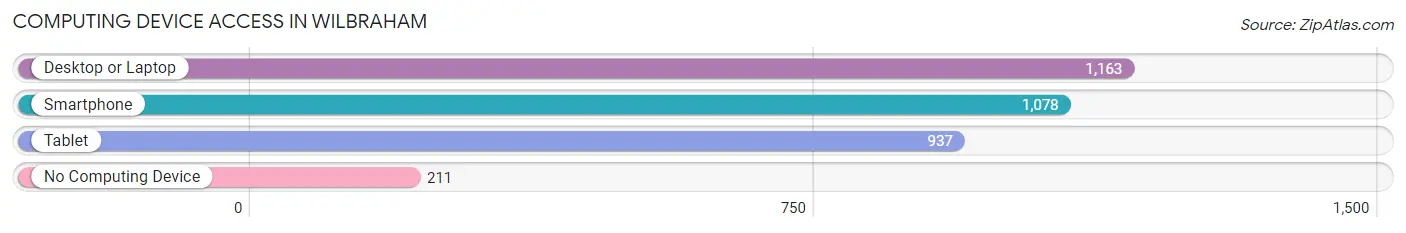
| Device Type | # Households | % Households |
| Desktop or Laptop | 1,163 | 83.0% |
| Smartphone | 1,078 | 76.9% |
| Tablet | 937 | 66.8% |
| No Computing Device | 211 | 15.0% |
| Total | 1,402 | 100.0% |
Internet Access in Wilbraham
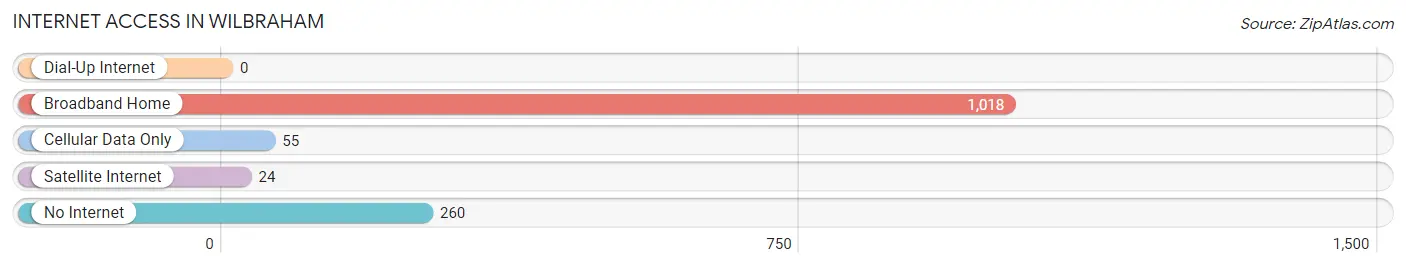
| Internet Type | # Households | % Households |
| Dial-Up Internet | 0 | 0.0% |
| Broadband Home | 1,018 | 72.6% |
| Cellular Data Only | 55 | 3.9% |
| Satellite Internet | 24 | 1.7% |
| No Internet | 260 | 18.5% |
| Total | 1,402 | 100.0% |
Wilbraham Summary
Wilbraham, MA is a town located in Hampden County, Massachusetts. It is situated in the Pioneer Valley region of the state, and is bordered by the towns of Hampden, East Longmeadow, and Ludlow. The town has a population of 14,868, according to the 2010 census.
History
The area that is now Wilbraham was originally inhabited by the Agawam tribe of Native Americans. The first European settlers arrived in the area in 1636, and the town was officially incorporated in 1763. The town was named after William Pynchon, the founder of Springfield, Massachusetts.
The town was primarily an agricultural community until the mid-19th century, when the railroad arrived and the town began to develop into a manufacturing center. The town was home to several factories, including the Wilbraham Manufacturing Company, which produced textiles, and the Wilbraham Paper Company, which produced paper products.
Geography
Wilbraham is located in the Pioneer Valley region of Massachusetts, and is bordered by the towns of Hampden, East Longmeadow, and Ludlow. The town has a total area of 22.2 square miles, of which 21.9 square miles is land and 0.3 square miles is water. The town is located in the Connecticut River Valley, and is home to several small lakes and ponds, including Lake Congamond, which is the largest lake in the area.
Economy
Wilbraham is primarily a residential community, and the town’s economy is largely based on the service industry. The town is home to several retail stores, restaurants, and other businesses. The town is also home to several manufacturing companies, including the Wilbraham Manufacturing Company, which produces textiles, and the Wilbraham Paper Company, which produces paper products.
Demographics
According to the 2010 census, Wilbraham has a population of 14,868. The town has a median household income of $71,945, and a median family income of $86,945. The town has a population that is predominantly white (94.3%), with small percentages of African American (1.3%), Asian (1.2%), and Hispanic (2.2%) residents. The town has a high rate of homeownership (83.3%), and the median value of owner-occupied homes is $269,400.
Wilbraham is a small town with a rich history and a diverse population. The town is home to several businesses and manufacturing companies, and is a popular destination for those looking for a quiet, suburban lifestyle. The town is also home to several recreational activities, including fishing, boating, and hiking. Wilbraham is a great place to live, work, and play.
Common Questions
What is Per Capita Income in Wilbraham?
Per Capita income in Wilbraham is $45,039.
What is the Median Family Income in Wilbraham?
Median Family Income in Wilbraham is $121,000.
What is the Median Household income in Wilbraham?
Median Household Income in Wilbraham is $97,891.
What is Income or Wage Gap in Wilbraham?
Income or Wage Gap in Wilbraham is 8.2%.
Women in Wilbraham earn 91.8 cents for every dollar earned by a man.
What is Inequality or Gini Index in Wilbraham?
Inequality or Gini Index in Wilbraham is 0.44.
What is the Total Population of Wilbraham?
Total Population of Wilbraham is 3,839.
What is the Total Male Population of Wilbraham?
Total Male Population of Wilbraham is 1,829.
What is the Total Female Population of Wilbraham?
Total Female Population of Wilbraham is 2,010.
What is the Ratio of Males per 100 Females in Wilbraham?
There are 91.00 Males per 100 Females in Wilbraham.
What is the Ratio of Females per 100 Males in Wilbraham?
There are 109.90 Females per 100 Males in Wilbraham.
What is the Median Population Age in Wilbraham?
Median Population Age in Wilbraham is 54.3 Years.
What is the Average Family Size in Wilbraham
Average Family Size in Wilbraham is 3.0 People.
What is the Average Household Size in Wilbraham
Average Household Size in Wilbraham is 2.5 People.
How Large is the Labor Force in Wilbraham?
There are 1,693 People in the Labor Forcein in Wilbraham.
What is the Percentage of People in the Labor Force in Wilbraham?
52.5% of People are in the Labor Force in Wilbraham.
What is the Unemployment Rate in Wilbraham?
Unemployment Rate in Wilbraham is 3.8%.