Cities with the Highest Percentage of Lebanese Population in Massachusetts
RELATED REPORTS & OPTIONS
Lebanese
Massachusetts
Compare Cities
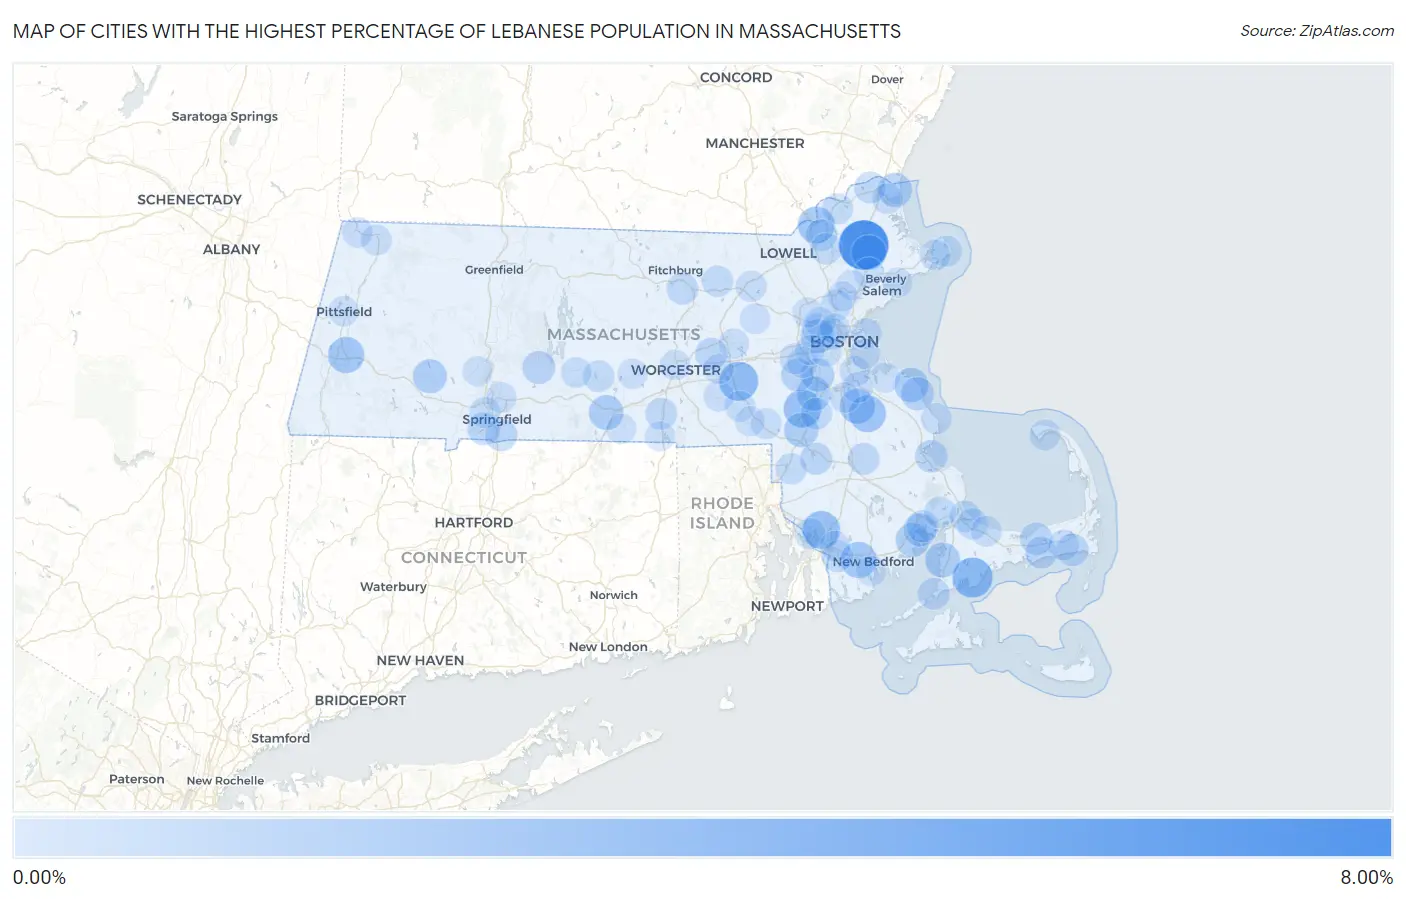
Map of Cities with the Highest Percentage of Lebanese Population in Massachusetts
0.00%
8.00%
Cities with the Highest Percentage of Lebanese Population in Massachusetts
| City | Lebanese | vs State | vs National | |
| 1. | Boxford | 7.07% | 0.44%(+6.63)#1 | 0.17%(+6.91)#17 |
| 2. | Seabrook | 3.70% | 0.44%(+3.26)#2 | 0.17%(+3.53)#71 |
| 3. | Hopkinton | 3.31% | 0.44%(+2.86)#3 | 0.17%(+3.14)#89 |
| 4. | Somerset | 2.91% | 0.44%(+2.47)#4 | 0.17%(+2.74)#103 |
| 5. | Walpole | 2.84% | 0.44%(+2.40)#5 | 0.17%(+2.67)#107 |
| 6. | Abington | 2.54% | 0.44%(+2.10)#6 | 0.17%(+2.38)#134 |
| 7. | Methuen Town | 2.52% | 0.44%(+2.08)#7 | 0.17%(+2.36)#135 |
| 8. | Lee | 2.32% | 0.44%(+1.88)#8 | 0.17%(+2.16)#152 |
| 9. | Smith Mills | 2.30% | 0.44%(+1.86)#9 | 0.17%(+2.14)#159 |
| 10. | Holbrook | 2.07% | 0.44%(+1.63)#10 | 0.17%(+1.91)#188 |
| 11. | North Falmouth | 1.90% | 0.44%(+1.46)#11 | 0.17%(+1.73)#222 |
| 12. | Topsfield | 1.86% | 0.44%(+1.42)#12 | 0.17%(+1.69)#232 |
| 13. | Fiskdale | 1.80% | 0.44%(+1.36)#13 | 0.17%(+1.64)#245 |
| 14. | Norwood | 1.76% | 0.44%(+1.32)#14 | 0.17%(+1.59)#257 |
| 15. | North Scituate | 1.73% | 0.44%(+1.29)#15 | 0.17%(+1.56)#263 |
| 16. | Foxborough | 1.71% | 0.44%(+1.27)#16 | 0.17%(+1.55)#267 |
| 17. | Salisbury | 1.67% | 0.44%(+1.23)#17 | 0.17%(+1.51)#278 |
| 18. | Huntington | 1.62% | 0.44%(+1.18)#18 | 0.17%(+1.45)#293 |
| 19. | Marion Center | 1.53% | 0.44%(+1.09)#19 | 0.17%(+1.37)#322 |
| 20. | Watertown Town | 1.50% | 0.44%(+1.06)#20 | 0.17%(+1.34)#335 |
| 21. | Dedham | 1.36% | 0.44%(+0.922)#21 | 0.17%(+1.20)#387 |
| 22. | Scituate | 1.30% | 0.44%(+0.863)#22 | 0.17%(+1.14)#412 |
| 23. | Weweantic | 1.26% | 0.44%(+0.814)#23 | 0.17%(+1.09)#434 |
| 24. | Belchertown | 1.21% | 0.44%(+0.767)#24 | 0.17%(+1.04)#457 |
| 25. | Dover | 1.19% | 0.44%(+0.753)#25 | 0.17%(+1.03)#466 |
| 26. | North Plymouth | 1.11% | 0.44%(+0.668)#26 | 0.17%(+0.944)#516 |
| 27. | Harwich Port | 1.07% | 0.44%(+0.624)#27 | 0.17%(+0.901)#537 |
| 28. | Agawam Town | 1.05% | 0.44%(+0.604)#28 | 0.17%(+0.880)#553 |
| 29. | Yarmouth Port | 1.02% | 0.44%(+0.580)#29 | 0.17%(+0.856)#568 |
| 30. | Longmeadow | 0.97% | 0.44%(+0.528)#30 | 0.17%(+0.804)#603 |
| 31. | South Yarmouth | 0.95% | 0.44%(+0.507)#31 | 0.17%(+0.784)#622 |
| 32. | Norton Center | 0.93% | 0.44%(+0.489)#32 | 0.17%(+0.765)#639 |
| 33. | Northborough | 0.93% | 0.44%(+0.487)#33 | 0.17%(+0.763)#642 |
| 34. | Wareham Center | 0.90% | 0.44%(+0.463)#34 | 0.17%(+0.739)#667 |
| 35. | Leominster | 0.86% | 0.44%(+0.421)#35 | 0.17%(+0.697)#713 |
| 36. | Amesbury Town | 0.83% | 0.44%(+0.386)#36 | 0.17%(+0.662)#746 |
| 37. | Oxford | 0.81% | 0.44%(+0.372)#37 | 0.17%(+0.648)#758 |
| 38. | Woods Hole | 0.81% | 0.44%(+0.365)#38 | 0.17%(+0.641)#765 |
| 39. | Bridgewater Town | 0.79% | 0.44%(+0.347)#39 | 0.17%(+0.623)#787 |
| 40. | Sharon | 0.79% | 0.44%(+0.344)#40 | 0.17%(+0.620)#794 |
| 41. | North Westport | 0.77% | 0.44%(+0.331)#41 | 0.17%(+0.607)#813 |
| 42. | White Island Shores | 0.76% | 0.44%(+0.323)#42 | 0.17%(+0.600)#827 |
| 43. | Lawrence | 0.76% | 0.44%(+0.322)#43 | 0.17%(+0.598)#830 |
| 44. | Sagamore | 0.73% | 0.44%(+0.290)#44 | 0.17%(+0.566)#873 |
| 45. | West Brookfield | 0.72% | 0.44%(+0.277)#45 | 0.17%(+0.553)#888 |
| 46. | Andover | 0.70% | 0.44%(+0.259)#46 | 0.17%(+0.536)#915 |
| 47. | Devens | 0.68% | 0.44%(+0.239)#47 | 0.17%(+0.516)#949 |
| 48. | Sandwich | 0.68% | 0.44%(+0.237)#48 | 0.17%(+0.513)#955 |
| 49. | Rockport | 0.67% | 0.44%(+0.226)#49 | 0.17%(+0.502)#976 |
| 50. | Stoneham | 0.67% | 0.44%(+0.224)#50 | 0.17%(+0.500)#979 |
| 51. | North Attleborough | 0.64% | 0.44%(+0.202)#51 | 0.17%(+0.479)#1,017 |
| 52. | West Springfield Town | 0.64% | 0.44%(+0.195)#52 | 0.17%(+0.471)#1,032 |
| 53. | Attleboro | 0.61% | 0.44%(+0.169)#53 | 0.17%(+0.445)#1,078 |
| 54. | Belmont | 0.60% | 0.44%(+0.155)#54 | 0.17%(+0.431)#1,098 |
| 55. | Ocean Grove | 0.59% | 0.44%(+0.153)#55 | 0.17%(+0.429)#1,103 |
| 56. | Haverhill | 0.57% | 0.44%(+0.128)#56 | 0.17%(+0.404)#1,161 |
| 57. | Winthrop Town | 0.56% | 0.44%(+0.121)#57 | 0.17%(+0.397)#1,181 |
| 58. | Littleton Common | 0.56% | 0.44%(+0.116)#58 | 0.17%(+0.392)#1,187 |
| 59. | Needham | 0.55% | 0.44%(+0.112)#59 | 0.17%(+0.389)#1,193 |
| 60. | Provincetown | 0.55% | 0.44%(+0.112)#60 | 0.17%(+0.388)#1,195 |
| 61. | Wellesley | 0.55% | 0.44%(+0.104)#61 | 0.17%(+0.381)#1,218 |
| 62. | Ocean Bluff Brant Rock | 0.52% | 0.44%(+0.076)#62 | 0.17%(+0.352)#1,273 |
| 63. | Cambridge | 0.51% | 0.44%(+0.071)#63 | 0.17%(+0.347)#1,290 |
| 64. | Franklin Town | 0.50% | 0.44%(+0.059)#64 | 0.17%(+0.335)#1,316 |
| 65. | Gloucester | 0.49% | 0.44%(+0.051)#65 | 0.17%(+0.328)#1,343 |
| 66. | Quincy | 0.49% | 0.44%(+0.050)#66 | 0.17%(+0.326)#1,347 |
| 67. | Northwest Harwich | 0.49% | 0.44%(+0.049)#67 | 0.17%(+0.326)#1,349 |
| 68. | North Adams | 0.49% | 0.44%(+0.046)#68 | 0.17%(+0.322)#1,362 |
| 69. | Newburyport | 0.48% | 0.44%(+0.043)#69 | 0.17%(+0.320)#1,370 |
| 70. | Arlington | 0.48% | 0.44%(+0.038)#70 | 0.17%(+0.314)#1,385 |
| 71. | East Sandwich | 0.48% | 0.44%(+0.034)#71 | 0.17%(+0.310)#1,401 |
| 72. | Milford | 0.46% | 0.44%(+0.023)#72 | 0.17%(+0.299)#1,438 |
| 73. | Brookline | 0.46% | 0.44%(+0.018)#73 | 0.17%(+0.294)#1,451 |
| 74. | Ware | 0.45% | 0.44%(+0.006)#74 | 0.17%(+0.283)#1,493 |
| 75. | Chicopee | 0.43% | 0.44%(-0.009)#75 | 0.17%(+0.268)#1,550 |
| 76. | Worcester | 0.43% | 0.44%(-0.013)#76 | 0.17%(+0.263)#1,565 |
| 77. | Braintree Town | 0.43% | 0.44%(-0.013)#77 | 0.17%(+0.263)#1,566 |
| 78. | Upton | 0.42% | 0.44%(-0.018)#78 | 0.17%(+0.259)#1,583 |
| 79. | Somerville | 0.42% | 0.44%(-0.019)#79 | 0.17%(+0.257)#1,589 |
| 80. | Maynard | 0.42% | 0.44%(-0.020)#80 | 0.17%(+0.257)#1,594 |
| 81. | Fall River | 0.42% | 0.44%(-0.024)#81 | 0.17%(+0.252)#1,611 |
| 82. | Williamstown | 0.40% | 0.44%(-0.041)#82 | 0.17%(+0.235)#1,677 |
| 83. | Randolph Town | 0.38% | 0.44%(-0.058)#83 | 0.17%(+0.218)#1,745 |
| 84. | Westborough | 0.37% | 0.44%(-0.076)#84 | 0.17%(+0.200)#1,822 |
| 85. | Marlborough | 0.36% | 0.44%(-0.077)#85 | 0.17%(+0.200)#1,826 |
| 86. | Pittsfield | 0.33% | 0.44%(-0.108)#86 | 0.17%(+0.169)#1,980 |
| 87. | Danvers | 0.33% | 0.44%(-0.108)#87 | 0.17%(+0.168)#1,984 |
| 88. | Boston | 0.33% | 0.44%(-0.112)#88 | 0.17%(+0.165)#1,995 |
| 89. | Bliss Corner | 0.32% | 0.44%(-0.120)#89 | 0.17%(+0.157)#2,036 |
| 90. | Spencer | 0.32% | 0.44%(-0.122)#90 | 0.17%(+0.154)#2,055 |
| 91. | Easthampton Town | 0.31% | 0.44%(-0.132)#91 | 0.17%(+0.145)#2,112 |
| 92. | Bellingham | 0.30% | 0.44%(-0.139)#92 | 0.17%(+0.137)#2,161 |
| 93. | Lynnfield | 0.30% | 0.44%(-0.140)#93 | 0.17%(+0.137)#2,165 |
| 94. | Lexington | 0.30% | 0.44%(-0.140)#94 | 0.17%(+0.136)#2,168 |
| 95. | Southbridge Town | 0.29% | 0.44%(-0.153)#95 | 0.17%(+0.123)#2,237 |
| 96. | Hingham | 0.29% | 0.44%(-0.156)#96 | 0.17%(+0.120)#2,260 |
| 97. | Beverly | 0.29% | 0.44%(-0.156)#97 | 0.17%(+0.120)#2,261 |
| 98. | Wakefield | 0.28% | 0.44%(-0.157)#98 | 0.17%(+0.119)#2,266 |
| 99. | Newton | 0.28% | 0.44%(-0.158)#99 | 0.17%(+0.119)#2,269 |
| 100. | Webster | 0.28% | 0.44%(-0.164)#100 | 0.17%(+0.112)#2,309 |
Common Questions
What are the Top 10 Cities with the Highest Percentage of Lebanese Population in Massachusetts?
Top 10 Cities with the Highest Percentage of Lebanese Population in Massachusetts are:
#1
7.07%
#2
3.70%
#3
3.31%
#4
2.91%
#5
2.84%
#6
2.54%
#7
2.52%
#8
2.32%
#9
2.30%
#10
2.07%
What city has the Highest Percentage of Lebanese Population in Massachusetts?
Boxford has the Highest Percentage of Lebanese Population in Massachusetts with 7.07%.
What is the Percentage of Lebanese Population in the State of Massachusetts?
Percentage of Lebanese Population in Massachusetts is 0.44%.
What is the Percentage of Lebanese Population in the United States?
Percentage of Lebanese Population in the United States is 0.17%.