Cities with the Highest Percentage of Population Employed in Business & Financial in Massachusetts
RELATED REPORTS & OPTIONS
Business & Financial
Massachusetts
Compare Cities
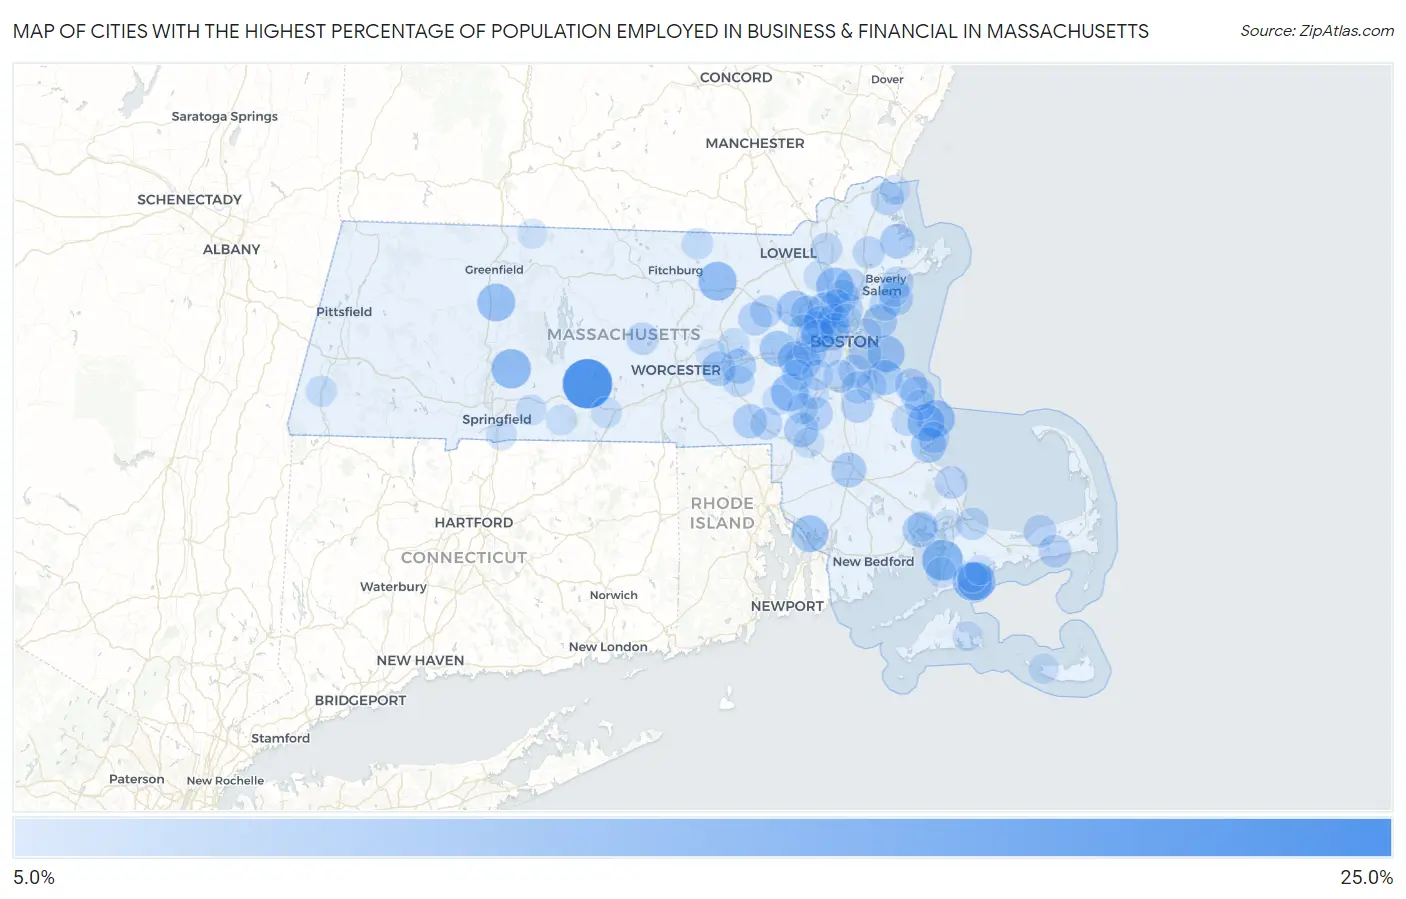
Map of Cities with the Highest Percentage of Population Employed in Business & Financial in Massachusetts
0.0%
25.0%
Cities with the Highest Percentage of Population Employed in Business & Financial in Massachusetts
| City | % Employed | vs State | vs National | |
| 1. | Green Harbor | 24.8% | 7.0%(+17.8)#1 | 5.8%(+19.1)#249 |
| 2. | Warren | 24.2% | 7.0%(+17.2)#2 | 5.8%(+18.5)#260 |
| 3. | North Falmouth | 16.3% | 7.0%(+9.28)#3 | 5.8%(+10.5)#630 |
| 4. | Oak Bluffs | 15.6% | 7.0%(+8.58)#4 | 5.8%(+9.85)#707 |
| 5. | Granby | 15.0% | 7.0%(+7.98)#5 | 5.8%(+9.24)#800 |
| 6. | Monomoscoy Island | 14.7% | 7.0%(+7.68)#6 | 5.8%(+8.94)#844 |
| 7. | Devens | 14.3% | 7.0%(+7.23)#7 | 5.8%(+8.49)#919 |
| 8. | New Seabury | 14.2% | 7.0%(+7.14)#8 | 5.8%(+8.40)#933 |
| 9. | Medfield | 13.8% | 7.0%(+6.73)#9 | 5.8%(+7.99)#999 |
| 10. | South Deerfield | 13.7% | 7.0%(+6.63)#10 | 5.8%(+7.89)#1,015 |
| 11. | Ocean Bluff Brant Rock | 13.4% | 7.0%(+6.37)#11 | 5.8%(+7.63)#1,092 |
| 12. | Reading | 13.3% | 7.0%(+6.32)#12 | 5.8%(+7.58)#1,099 |
| 13. | Marshfield | 13.1% | 7.0%(+6.04)#13 | 5.8%(+7.30)#1,180 |
| 14. | Hull | 12.8% | 7.0%(+5.76)#14 | 5.8%(+7.02)#1,257 |
| 15. | Ocean Grove | 12.8% | 7.0%(+5.75)#15 | 5.8%(+7.01)#1,260 |
| 16. | Hanscom Afb | 12.3% | 7.0%(+5.25)#16 | 5.8%(+6.52)#1,391 |
| 17. | Needham | 12.0% | 7.0%(+4.99)#17 | 5.8%(+6.25)#1,488 |
| 18. | Cochituate | 11.9% | 7.0%(+4.86)#18 | 5.8%(+6.12)#1,526 |
| 19. | Winchester | 11.6% | 7.0%(+4.54)#19 | 5.8%(+5.81)#1,658 |
| 20. | South Duxbury | 11.5% | 7.0%(+4.45)#20 | 5.8%(+5.72)#1,691 |
| 21. | Hingham | 11.3% | 7.0%(+4.29)#21 | 5.8%(+5.55)#1,765 |
| 22. | Wellesley | 11.3% | 7.0%(+4.27)#22 | 5.8%(+5.53)#1,772 |
| 23. | Ipswich | 11.1% | 7.0%(+4.10)#23 | 5.8%(+5.37)#1,833 |
| 24. | Scituate | 11.1% | 7.0%(+4.09)#24 | 5.8%(+5.35)#1,839 |
| 25. | Belmont | 11.1% | 7.0%(+4.08)#25 | 5.8%(+5.34)#1,856 |
| 26. | Raynham Center | 11.1% | 7.0%(+4.07)#26 | 5.8%(+5.34)#1,862 |
| 27. | Weweantic | 11.1% | 7.0%(+4.03)#27 | 5.8%(+5.29)#1,880 |
| 28. | Cordaville | 10.9% | 7.0%(+3.91)#28 | 5.8%(+5.17)#1,936 |
| 29. | Foxborough | 10.9% | 7.0%(+3.85)#29 | 5.8%(+5.11)#1,963 |
| 30. | Westborough | 10.7% | 7.0%(+3.70)#30 | 5.8%(+4.96)#2,037 |
| 31. | Nahant | 10.4% | 7.0%(+3.41)#31 | 5.8%(+4.68)#2,186 |
| 32. | Bellingham | 10.4% | 7.0%(+3.38)#32 | 5.8%(+4.65)#2,202 |
| 33. | Lexington | 10.4% | 7.0%(+3.35)#33 | 5.8%(+4.61)#2,217 |
| 34. | Marblehead | 10.2% | 7.0%(+3.18)#34 | 5.8%(+4.44)#2,312 |
| 35. | Maynard | 10.0% | 7.0%(+2.95)#35 | 5.8%(+4.21)#2,457 |
| 36. | Melrose | 10.0% | 7.0%(+2.94)#36 | 5.8%(+4.20)#2,466 |
| 37. | Cambridge | 9.9% | 7.0%(+2.84)#37 | 5.8%(+4.10)#2,531 |
| 38. | Sharon | 9.8% | 7.0%(+2.74)#38 | 5.8%(+4.00)#2,590 |
| 39. | Wakefield | 9.7% | 7.0%(+2.68)#39 | 5.8%(+3.95)#2,620 |
| 40. | Holbrook | 9.7% | 7.0%(+2.65)#40 | 5.8%(+3.91)#2,641 |
| 41. | Newton | 9.7% | 7.0%(+2.64)#41 | 5.8%(+3.90)#2,654 |
| 42. | Arlington | 9.6% | 7.0%(+2.53)#42 | 5.8%(+3.79)#2,719 |
| 43. | Newburyport | 9.5% | 7.0%(+2.46)#43 | 5.8%(+3.73)#2,755 |
| 44. | North Scituate | 9.5% | 7.0%(+2.45)#44 | 5.8%(+3.71)#2,767 |
| 45. | Quincy | 9.5% | 7.0%(+2.45)#45 | 5.8%(+3.71)#2,773 |
| 46. | Milton | 9.4% | 7.0%(+2.37)#46 | 5.8%(+3.63)#2,842 |
| 47. | The Pinehills | 9.4% | 7.0%(+2.35)#47 | 5.8%(+3.62)#2,862 |
| 48. | Watertown Town | 9.4% | 7.0%(+2.35)#48 | 5.8%(+3.61)#2,873 |
| 49. | Dennis Port | 9.3% | 7.0%(+2.27)#49 | 5.8%(+3.54)#2,925 |
| 50. | Boston | 9.3% | 7.0%(+2.27)#50 | 5.8%(+3.54)#2,928 |
| 51. | Dennis | 9.3% | 7.0%(+2.24)#51 | 5.8%(+3.50)#2,958 |
| 52. | Medford | 9.1% | 7.0%(+2.12)#52 | 5.8%(+3.38)#3,056 |
| 53. | Rutland | 9.1% | 7.0%(+2.05)#53 | 5.8%(+3.32)#3,118 |
| 54. | Brookline | 9.0% | 7.0%(+1.99)#54 | 5.8%(+3.25)#3,166 |
| 55. | Sandwich | 9.0% | 7.0%(+1.96)#55 | 5.8%(+3.22)#3,189 |
| 56. | Lynnfield | 8.9% | 7.0%(+1.92)#56 | 5.8%(+3.18)#3,227 |
| 57. | West Concord | 8.9% | 7.0%(+1.90)#57 | 5.8%(+3.16)#3,250 |
| 58. | Braintree Town | 8.9% | 7.0%(+1.88)#58 | 5.8%(+3.14)#3,263 |
| 59. | Topsfield | 8.8% | 7.0%(+1.75)#59 | 5.8%(+3.02)#3,375 |
| 60. | Franklin Town | 8.8% | 7.0%(+1.75)#60 | 5.8%(+3.01)#3,387 |
| 61. | Cedar Crest | 8.8% | 7.0%(+1.73)#61 | 5.8%(+2.99)#3,402 |
| 62. | Andover | 8.6% | 7.0%(+1.58)#62 | 5.8%(+2.84)#3,542 |
| 63. | Beverly | 8.6% | 7.0%(+1.57)#63 | 5.8%(+2.83)#3,562 |
| 64. | North Pembroke | 8.5% | 7.0%(+1.45)#64 | 5.8%(+2.72)#3,660 |
| 65. | Somerville | 8.5% | 7.0%(+1.44)#65 | 5.8%(+2.70)#3,678 |
| 66. | Swampscott | 8.5% | 7.0%(+1.43)#66 | 5.8%(+2.69)#3,686 |
| 67. | Duxbury | 8.4% | 7.0%(+1.39)#67 | 5.8%(+2.65)#3,730 |
| 68. | Hopkinton | 8.4% | 7.0%(+1.34)#68 | 5.8%(+2.60)#3,778 |
| 69. | Salem | 8.2% | 7.0%(+1.21)#69 | 5.8%(+2.48)#3,894 |
| 70. | Waltham | 8.1% | 7.0%(+1.10)#70 | 5.8%(+2.36)#4,022 |
| 71. | Stoneham | 8.0% | 7.0%(+1.01)#71 | 5.8%(+2.28)#4,128 |
| 72. | Townsend | 8.0% | 7.0%(+1.01)#72 | 5.8%(+2.27)#4,135 |
| 73. | Dover | 8.0% | 7.0%(+0.959)#73 | 5.8%(+2.22)#4,191 |
| 74. | Norwood | 7.9% | 7.0%(+0.907)#74 | 5.8%(+2.17)#4,248 |
| 75. | Great Barrington | 7.9% | 7.0%(+0.899)#75 | 5.8%(+2.16)#4,268 |
| 76. | Dedham | 7.9% | 7.0%(+0.864)#76 | 5.8%(+2.13)#4,324 |
| 77. | Marlborough | 7.8% | 7.0%(+0.814)#77 | 5.8%(+2.08)#4,383 |
| 78. | Fiskdale | 7.8% | 7.0%(+0.813)#78 | 5.8%(+2.08)#4,385 |
| 79. | Weymouth Town | 7.8% | 7.0%(+0.778)#79 | 5.8%(+2.04)#4,422 |
| 80. | Walpole | 7.7% | 7.0%(+0.718)#80 | 5.8%(+1.98)#4,492 |
| 81. | Wilbraham | 7.7% | 7.0%(+0.648)#81 | 5.8%(+1.91)#4,597 |
| 82. | Mansfield Center | 7.7% | 7.0%(+0.641)#82 | 5.8%(+1.90)#4,605 |
| 83. | Millis Clicquot | 7.7% | 7.0%(+0.635)#83 | 5.8%(+1.90)#4,613 |
| 84. | Winthrop Town | 7.5% | 7.0%(+0.522)#84 | 5.8%(+1.79)#4,729 |
| 85. | Monson Center | 7.5% | 7.0%(+0.498)#85 | 5.8%(+1.76)#4,763 |
| 86. | West Falmouth | 7.5% | 7.0%(+0.484)#86 | 5.8%(+1.75)#4,784 |
| 87. | Longmeadow | 7.5% | 7.0%(+0.478)#87 | 5.8%(+1.74)#4,790 |
| 88. | Wareham Center | 7.4% | 7.0%(+0.410)#88 | 5.8%(+1.67)#4,862 |
| 89. | North Attleborough | 7.4% | 7.0%(+0.395)#89 | 5.8%(+1.66)#4,883 |
| 90. | Wilmington | 7.4% | 7.0%(+0.352)#90 | 5.8%(+1.62)#4,926 |
| 91. | Marshfield Hills | 7.3% | 7.0%(+0.322)#91 | 5.8%(+1.58)#4,958 |
| 92. | Madaket | 7.3% | 7.0%(+0.266)#92 | 5.8%(+1.53)#5,043 |
| 93. | Salisbury | 7.1% | 7.0%(+0.098)#93 | 5.8%(+1.36)#5,284 |
| 94. | Buzzards Bay | 7.1% | 7.0%(+0.091)#94 | 5.8%(+1.35)#5,290 |
| 95. | Seabrook | 7.1% | 7.0%(+0.078)#95 | 5.8%(+1.34)#5,304 |
| 96. | Northfield | 7.0% | 7.0%(-0.015)#96 | 5.8%(+1.25)#5,427 |
| 97. | Edgartown | 7.0% | 7.0%(-0.023)#97 | 5.8%(+1.24)#5,437 |
| 98. | Northborough | 7.0% | 7.0%(-0.048)#98 | 5.8%(+1.22)#5,480 |
| 99. | Malden | 7.0% | 7.0%(-0.050)#99 | 5.8%(+1.21)#5,490 |
| 100. | Mashpee Neck | 6.9% | 7.0%(-0.098)#100 | 5.8%(+1.17)#5,548 |
Common Questions
What are the Top 10 Cities with the Highest Percentage of Population Employed in Business & Financial in Massachusetts?
Top 10 Cities with the Highest Percentage of Population Employed in Business & Financial in Massachusetts are:
#1
24.2%
#2
16.3%
#3
15.0%
#4
14.7%
#5
14.3%
#6
14.2%
#7
13.8%
#8
13.7%
#9
13.4%
#10
13.3%
What city has the Highest Percentage of Population Employed in Business & Financial in Massachusetts?
Warren has the Highest Percentage of Population Employed in Business & Financial in Massachusetts with 24.2%.
What is the Percentage of Population Employed in Business & Financial in the State of Massachusetts?
Percentage of Population Employed in Business & Financial in Massachusetts is 7.0%.
What is the Percentage of Population Employed in Business & Financial in the United States?
Percentage of Population Employed in Business & Financial in the United States is 5.8%.