Yarmouth Port, MA Map & Demographics
Yarmouth Port Map
Yarmouth Port Overview
$62,228
PER CAPITA INCOME
$124,873
AVG FAMILY INCOME
$102,321
AVG HOUSEHOLD INCOME
6.0%
WAGE / INCOME GAP [ % ]
94.0¢/ $1
WAGE / INCOME GAP [ $ ]
0.49
INEQUALITY / GINI INDEX
5,971
TOTAL POPULATION
2,821
MALE POPULATION
3,150
FEMALE POPULATION
89.56
MALES / 100 FEMALES
111.66
FEMALES / 100 MALES
59.7
MEDIAN AGE
2.7
AVG FAMILY SIZE
2.2
AVG HOUSEHOLD SIZE
2,841
LABOR FORCE [ PEOPLE ]
52.2%
PERCENT IN LABOR FORCE
2.0%
UNEMPLOYMENT RATE
Yarmouth Port Zip Codes
Yarmouth Port Area Codes
Income in Yarmouth Port
Income Overview in Yarmouth Port
Per Capita Income in Yarmouth Port is $62,228, while median incomes of families and households are $124,873 and $102,321 respectively.
| Characteristic | Number | Measure |
| Per Capita Income | 5,971 | $62,228 |
| Median Family Income | 1,801 | $124,873 |
| Mean Family Income | 1,801 | $166,917 |
| Median Household Income | 2,751 | $102,321 |
| Mean Household Income | 2,751 | $133,565 |
| Income Deficit | 1,801 | $0 |
| Wage / Income Gap (%) | 5,971 | 6.00% |
| Wage / Income Gap ($) | 5,971 | 94.00¢ per $1 |
| Gini / Inequality Index | 5,971 | 0.49 |
Earnings by Sex in Yarmouth Port
Average Earnings in Yarmouth Port are $55,259, $58,214 for men and $54,721 for women, a difference of 6.0%.

| Sex | Number | Average Earnings |
| Male | 1,544 (52.9%) | $58,214 |
| Female | 1,375 (47.1%) | $54,721 |
| Total | 2,919 (100.0%) | $55,259 |
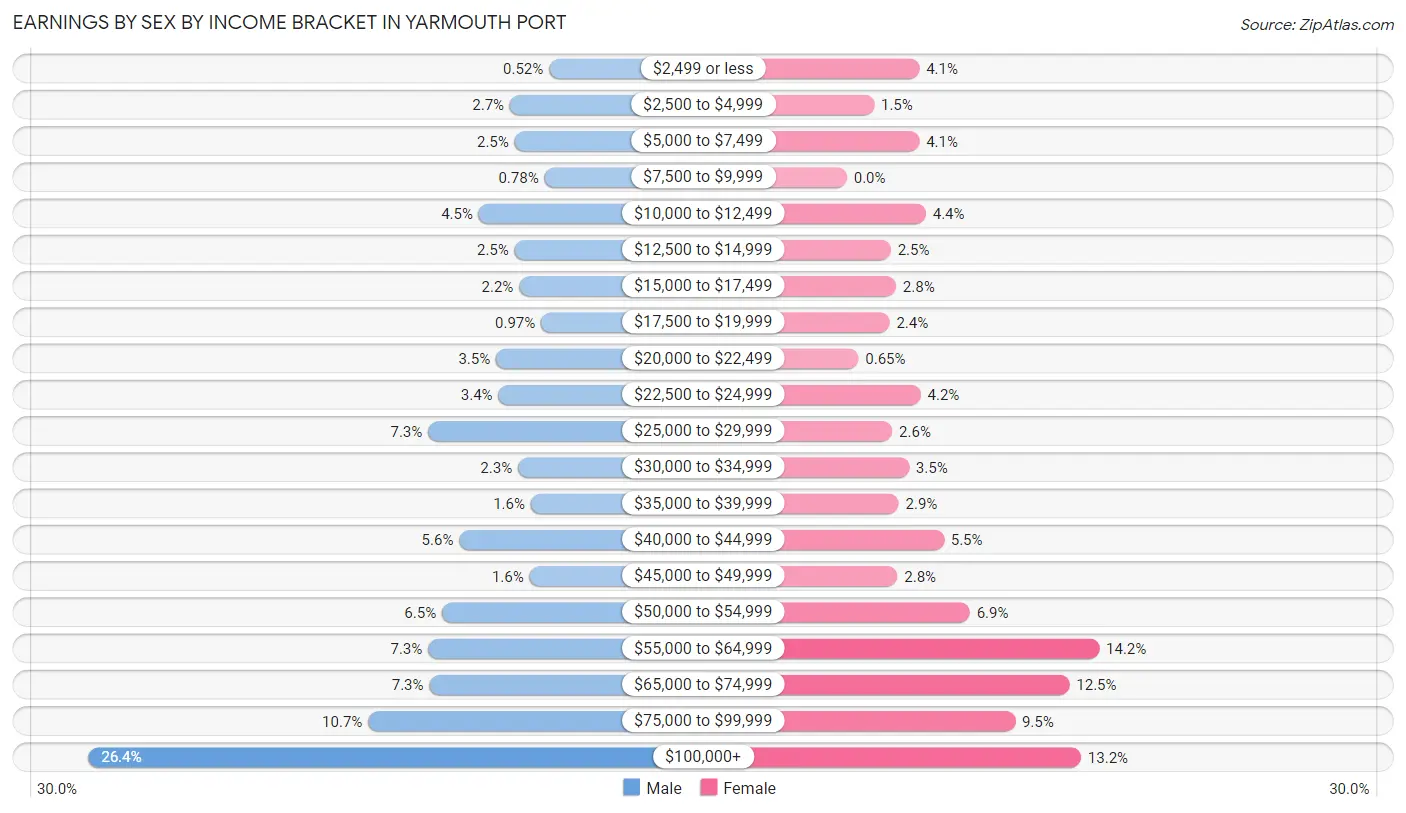
Earnings by Sex by Income Bracket in Yarmouth Port
The most common earnings brackets in Yarmouth Port are $100,000+ for men (408 | 26.4%) and $55,000 to $64,999 for women (195 | 14.2%).
| Income | Male | Female |
| $2,499 or less | 8 (0.5%) | 56 (4.1%) |
| $2,500 to $4,999 | 42 (2.7%) | 21 (1.5%) |
| $5,000 to $7,499 | 38 (2.5%) | 56 (4.1%) |
| $7,500 to $9,999 | 12 (0.8%) | 0 (0.0%) |
| $10,000 to $12,499 | 69 (4.5%) | 61 (4.4%) |
| $12,500 to $14,999 | 38 (2.5%) | 34 (2.5%) |
| $15,000 to $17,499 | 34 (2.2%) | 38 (2.8%) |
| $17,500 to $19,999 | 15 (1.0%) | 33 (2.4%) |
| $20,000 to $22,499 | 54 (3.5%) | 9 (0.6%) |
| $22,500 to $24,999 | 52 (3.4%) | 57 (4.2%) |
| $25,000 to $29,999 | 113 (7.3%) | 35 (2.5%) |
| $30,000 to $34,999 | 35 (2.3%) | 48 (3.5%) |
| $35,000 to $39,999 | 24 (1.5%) | 40 (2.9%) |
| $40,000 to $44,999 | 86 (5.6%) | 75 (5.4%) |
| $45,000 to $49,999 | 25 (1.6%) | 39 (2.8%) |
| $50,000 to $54,999 | 101 (6.5%) | 95 (6.9%) |
| $55,000 to $64,999 | 113 (7.3%) | 195 (14.2%) |
| $65,000 to $74,999 | 112 (7.2%) | 172 (12.5%) |
| $75,000 to $99,999 | 165 (10.7%) | 130 (9.5%) |
| $100,000+ | 408 (26.4%) | 181 (13.2%) |
| Total | 1,544 (100.0%) | 1,375 (100.0%) |
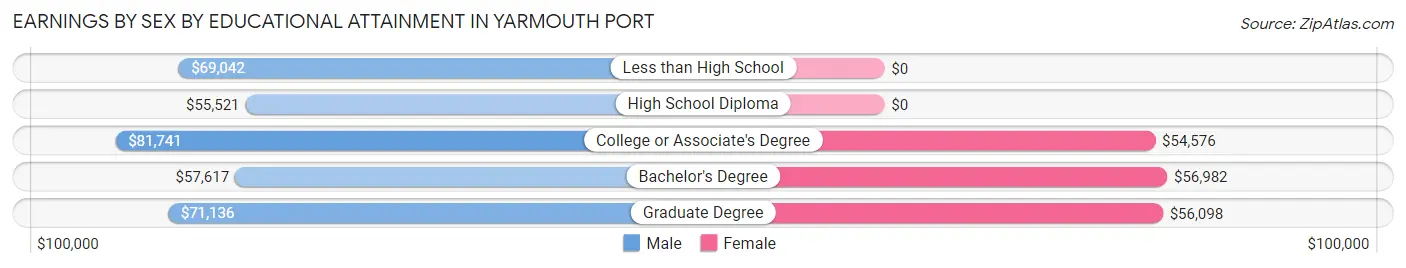
Earnings by Sex by Educational Attainment in Yarmouth Port
Average earnings in Yarmouth Port are $65,833 for men and $55,519 for women, a difference of 15.7%. Men with an educational attainment of college or associate's degree enjoy the highest average annual earnings of $81,741, while those with high school diploma education earn the least with $55,521. Women with an educational attainment of bachelor's degree earn the most with the average annual earnings of $56,982, while those with college or associate's degree education have the smallest earnings of $54,576.
| Educational Attainment | Male Income | Female Income |
| Less than High School | $69,042 | $0 |
| High School Diploma | $55,521 | $0 |
| College or Associate's Degree | $81,741 | $54,576 |
| Bachelor's Degree | $57,617 | $56,982 |
| Graduate Degree | $71,136 | $56,098 |
| Total | $65,833 | $55,519 |
Family Income in Yarmouth Port
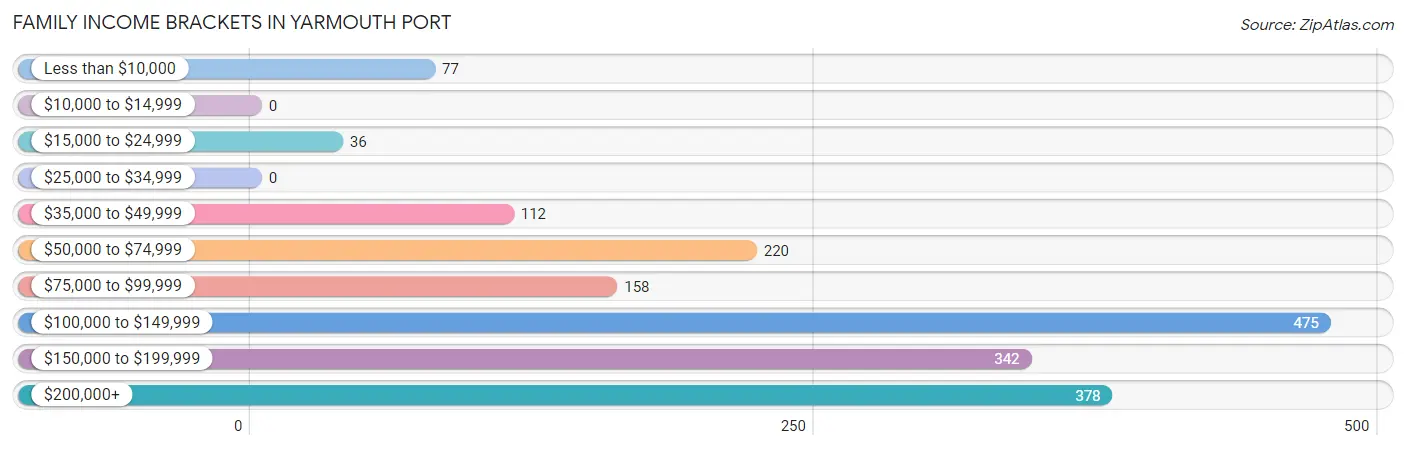
Family Income Brackets in Yarmouth Port
According to the Yarmouth Port family income data, there are 475 families falling into the $100,000 to $149,999 income range, which is the most common income bracket and makes up 26.4% of all families.
| Income Bracket | # Families | % Families |
| Less than $10,000 | 77 | 4.3% |
| $10,000 to $14,999 | 0 | 0.0% |
| $15,000 to $24,999 | 36 | 2.0% |
| $25,000 to $34,999 | 0 | 0.0% |
| $35,000 to $49,999 | 112 | 6.2% |
| $50,000 to $74,999 | 220 | 12.2% |
| $75,000 to $99,999 | 158 | 8.8% |
| $100,000 to $149,999 | 475 | 26.4% |
| $150,000 to $199,999 | 342 | 19.0% |
| $200,000+ | 378 | 21.0% |
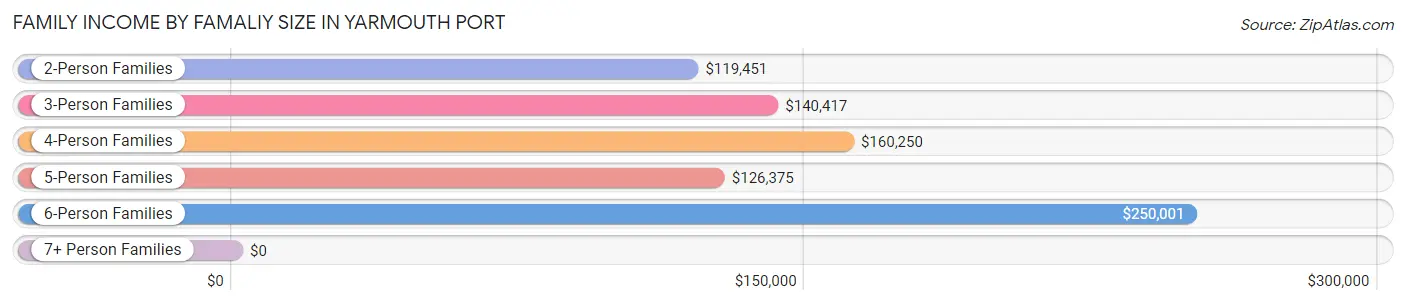
Family Income by Famaliy Size in Yarmouth Port
6-person families (82 | 4.5%) account for the highest median family income in Yarmouth Port with $250,001 per family, while 2-person families (1,244 | 69.1%) have the highest median income of $59,726 per family member.
| Income Bracket | # Families | Median Income |
| 2-Person Families | 1,244 (69.1%) | $119,451 |
| 3-Person Families | 191 (10.6%) | $140,417 |
| 4-Person Families | 248 (13.8%) | $160,250 |
| 5-Person Families | 23 (1.3%) | $126,375 |
| 6-Person Families | 82 (4.5%) | $250,001 |
| 7+ Person Families | 13 (0.7%) | $0 |
| Total | 1,801 (100.0%) | $124,873 |
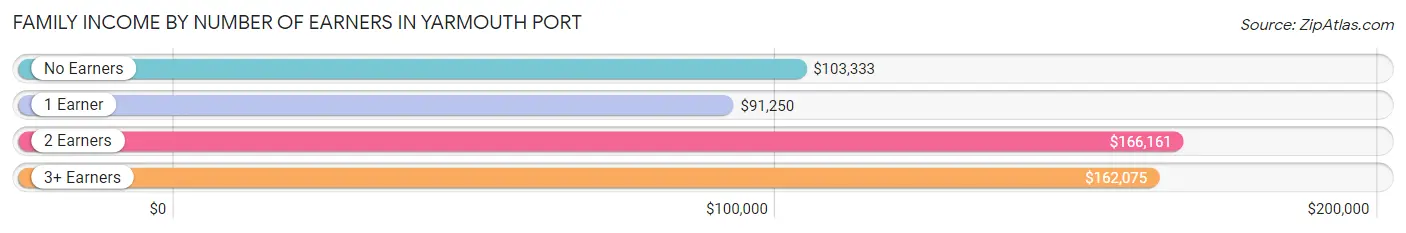
Family Income by Number of Earners in Yarmouth Port
The median family income in Yarmouth Port is $124,873, with families comprising 2 earners (630) having the highest median family income of $166,161, while families with 1 earner (432) have the lowest median family income of $91,250, accounting for 35.0% and 24.0% of families, respectively.
| Number of Earners | # Families | Median Income |
| No Earners | 554 (30.8%) | $103,333 |
| 1 Earner | 432 (24.0%) | $91,250 |
| 2 Earners | 630 (35.0%) | $166,161 |
| 3+ Earners | 185 (10.3%) | $162,075 |
| Total | 1,801 (100.0%) | $124,873 |
Household Income in Yarmouth Port
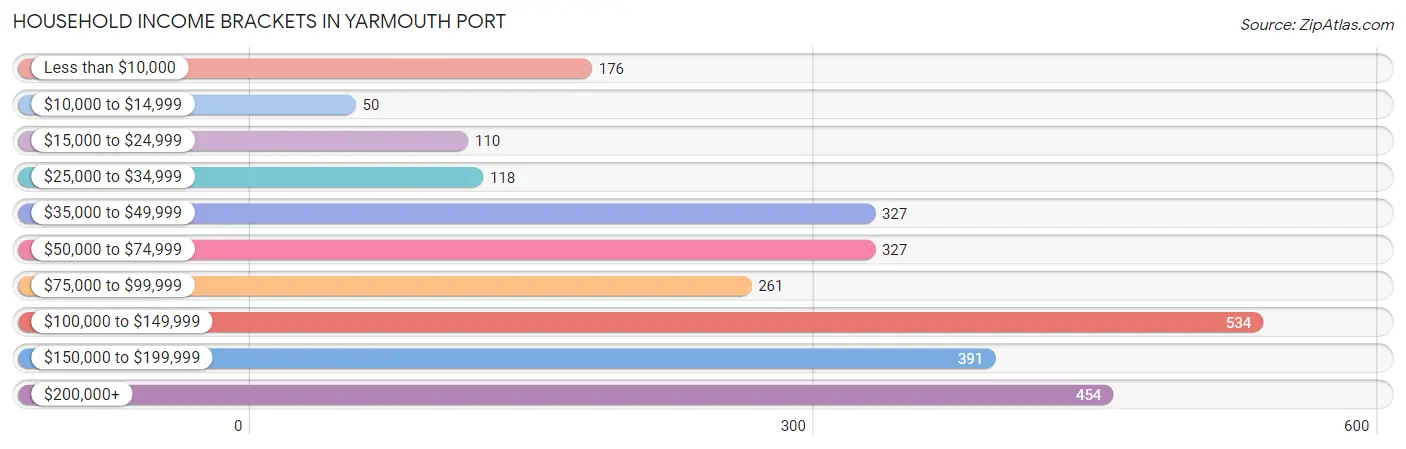
Household Income Brackets in Yarmouth Port
With 534 households falling in the category, the $100,000 to $149,999 income range is the most frequent in Yarmouth Port, accounting for 19.4% of all households. In contrast, only 50 households (1.8%) fall into the $10,000 to $14,999 income bracket, making it the least populous group.
| Income Bracket | # Households | % Households |
| Less than $10,000 | 176 | 6.4% |
| $10,000 to $14,999 | 50 | 1.8% |
| $15,000 to $24,999 | 110 | 4.0% |
| $25,000 to $34,999 | 118 | 4.3% |
| $35,000 to $49,999 | 327 | 11.9% |
| $50,000 to $74,999 | 327 | 11.9% |
| $75,000 to $99,999 | 261 | 9.5% |
| $100,000 to $149,999 | 534 | 19.4% |
| $150,000 to $199,999 | 391 | 14.2% |
| $200,000+ | 454 | 16.5% |
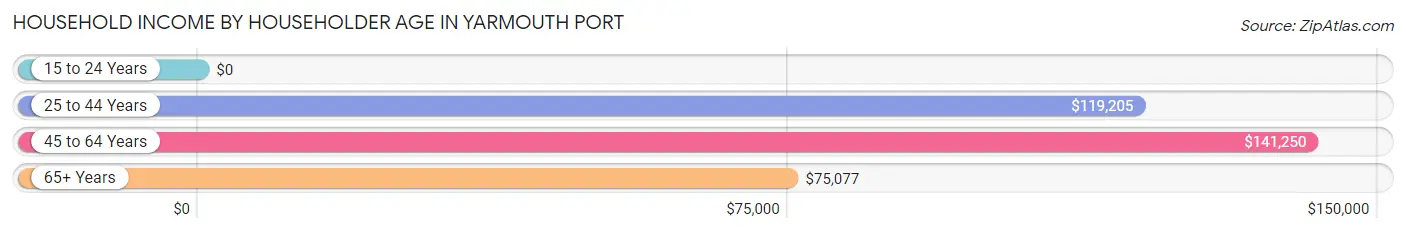
Household Income by Householder Age in Yarmouth Port
The median household income in Yarmouth Port is $102,321, with the highest median household income of $141,250 found in the 45 to 64 years age bracket for the primary householder. A total of 890 households (32.4%) fall into this category. Meanwhile, the 15 to 24 years age bracket for the primary householder has the lowest median household income of $0, with 15 households (0.5%) in this group.
| Income Bracket | # Households | Median Income |
| 15 to 24 Years | 15 (0.5%) | $0 |
| 25 to 44 Years | 338 (12.3%) | $119,205 |
| 45 to 64 Years | 890 (32.4%) | $141,250 |
| 65+ Years | 1,508 (54.8%) | $75,077 |
| Total | 2,751 (100.0%) | $102,321 |
Poverty in Yarmouth Port
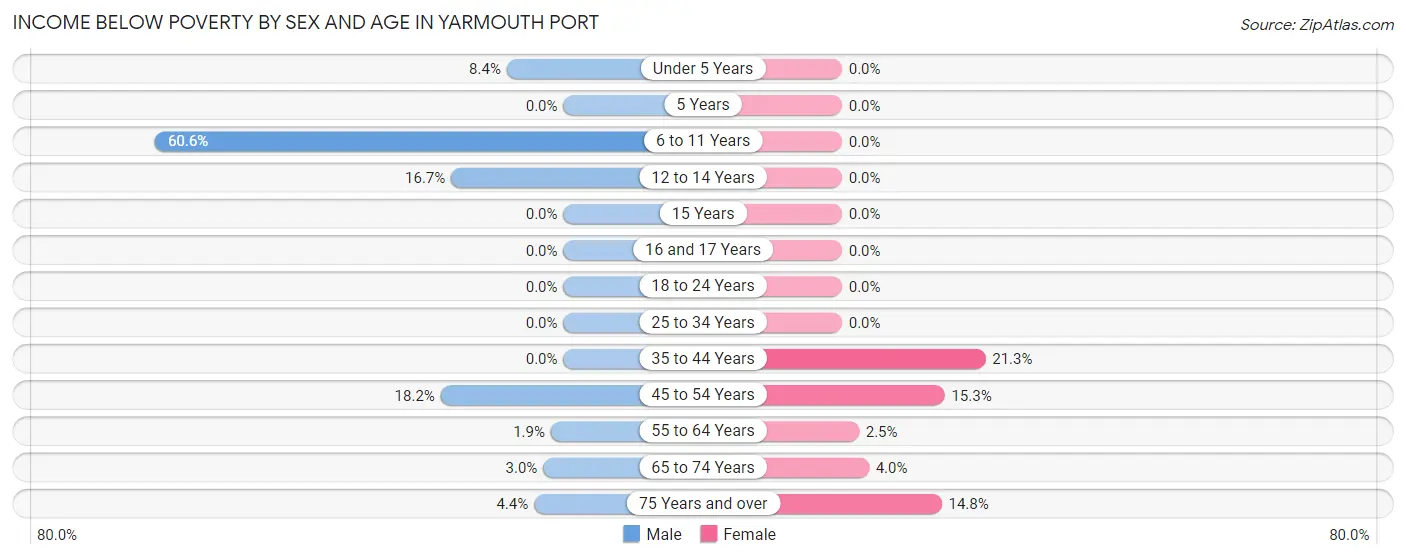
Income Below Poverty by Sex and Age in Yarmouth Port
With 6.1% poverty level for males and 8.1% for females among the residents of Yarmouth Port, 6 to 11 year old males and 35 to 44 year old females are the most vulnerable to poverty, with 57 males (60.6%) and 65 females (21.3%) in their respective age groups living below the poverty level.
| Age Bracket | Male | Female |
| Under 5 Years | 9 (8.4%) | 0 (0.0%) |
| 5 Years | 0 (0.0%) | 0 (0.0%) |
| 6 to 11 Years | 57 (60.6%) | 0 (0.0%) |
| 12 to 14 Years | 11 (16.7%) | 0 (0.0%) |
| 15 Years | 0 (0.0%) | 0 (0.0%) |
| 16 and 17 Years | 0 (0.0%) | 0 (0.0%) |
| 18 to 24 Years | 0 (0.0%) | 0 (0.0%) |
| 25 to 34 Years | 0 (0.0%) | 0 (0.0%) |
| 35 to 44 Years | 0 (0.0%) | 65 (21.3%) |
| 45 to 54 Years | 47 (18.2%) | 45 (15.2%) |
| 55 to 64 Years | 9 (1.9%) | 14 (2.5%) |
| 65 to 74 Years | 15 (3.0%) | 27 (4.0%) |
| 75 Years and over | 24 (4.3%) | 105 (14.8%) |
| Total | 172 (6.1%) | 256 (8.1%) |
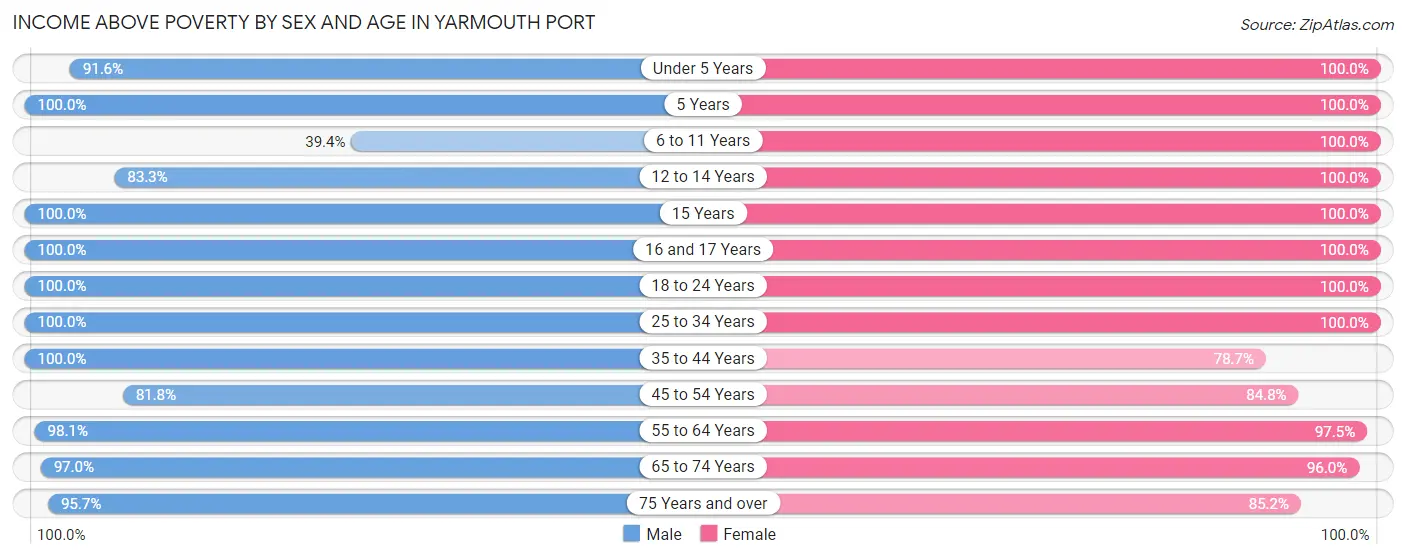
Income Above Poverty by Sex and Age in Yarmouth Port
According to the poverty statistics in Yarmouth Port, males aged 5 years and females aged under 5 years are the age groups that are most secure financially, with 100.0% of males and 100.0% of females in these age groups living above the poverty line.
| Age Bracket | Male | Female |
| Under 5 Years | 98 (91.6%) | 61 (100.0%) |
| 5 Years | 30 (100.0%) | 55 (100.0%) |
| 6 to 11 Years | 37 (39.4%) | 46 (100.0%) |
| 12 to 14 Years | 55 (83.3%) | 55 (100.0%) |
| 15 Years | 6 (100.0%) | 8 (100.0%) |
| 16 and 17 Years | 83 (100.0%) | 118 (100.0%) |
| 18 to 24 Years | 151 (100.0%) | 83 (100.0%) |
| 25 to 34 Years | 263 (100.0%) | 185 (100.0%) |
| 35 to 44 Years | 229 (100.0%) | 240 (78.7%) |
| 45 to 54 Years | 211 (81.8%) | 250 (84.8%) |
| 55 to 64 Years | 473 (98.1%) | 541 (97.5%) |
| 65 to 74 Years | 485 (97.0%) | 648 (96.0%) |
| 75 Years and over | 528 (95.7%) | 604 (85.2%) |
| Total | 2,649 (93.9%) | 2,894 (91.9%) |
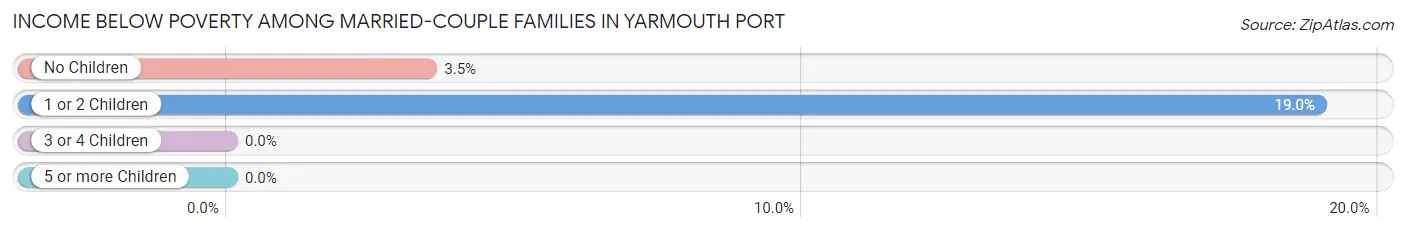
Income Below Poverty Among Married-Couple Families in Yarmouth Port
The poverty statistics for married-couple families in Yarmouth Port show that 5.8% or 93 of the total 1,602 families live below the poverty line. Families with 1 or 2 children have the highest poverty rate of 19.0%, comprising of 47 families. On the other hand, families with 3 or 4 children have the lowest poverty rate of 0.0%, which includes 0 families.
| Children | Above Poverty | Below Poverty |
| No Children | 1,279 (96.5%) | 46 (3.5%) |
| 1 or 2 Children | 201 (81.0%) | 47 (19.0%) |
| 3 or 4 Children | 29 (100.0%) | 0 (0.0%) |
| 5 or more Children | 0 (0.0%) | 0 (0.0%) |
| Total | 1,509 (94.2%) | 93 (5.8%) |
Income Below Poverty Among Single-Parent Households in Yarmouth Port
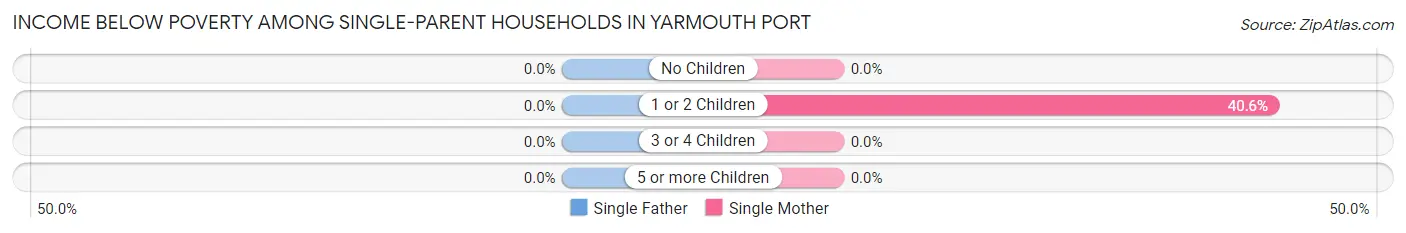
| Children | Single Father | Single Mother |
| No Children | 0 (0.0%) | 0 (0.0%) |
| 1 or 2 Children | 0 (0.0%) | 13 (40.6%) |
| 3 or 4 Children | 0 (0.0%) | 0 (0.0%) |
| 5 or more Children | 0 (0.0%) | 0 (0.0%) |
| Total | 0 (0.0%) | 13 (12.0%) |
Income Below Poverty Among Married-Couple vs Single-Parent Households in Yarmouth Port
The poverty data for Yarmouth Port shows that 93 of the married-couple family households (5.8%) and 13 of the single-parent households (6.5%) are living below the poverty level. Within the married-couple family households, those with 1 or 2 children have the highest poverty rate, with 47 households (19.0%) falling below the poverty line. Among the single-parent households, those with 1 or 2 children have the highest poverty rate, with 13 household (12.3%) living below poverty.
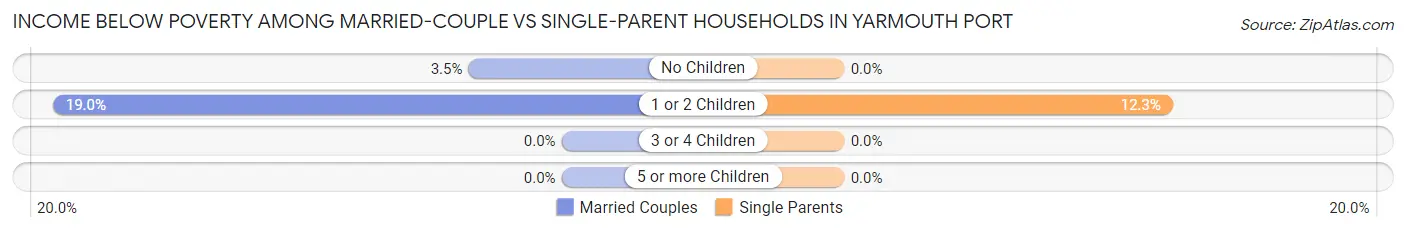
| Children | Married-Couple Families | Single-Parent Households |
| No Children | 46 (3.5%) | 0 (0.0%) |
| 1 or 2 Children | 47 (19.0%) | 13 (12.3%) |
| 3 or 4 Children | 0 (0.0%) | 0 (0.0%) |
| 5 or more Children | 0 (0.0%) | 0 (0.0%) |
| Total | 93 (5.8%) | 13 (6.5%) |
Race in Yarmouth Port
The most populous races in Yarmouth Port are White / Caucasian (5,741 | 96.2%), Two or more Races (202 | 3.4%), and Hispanic or Latino (172 | 2.9%).
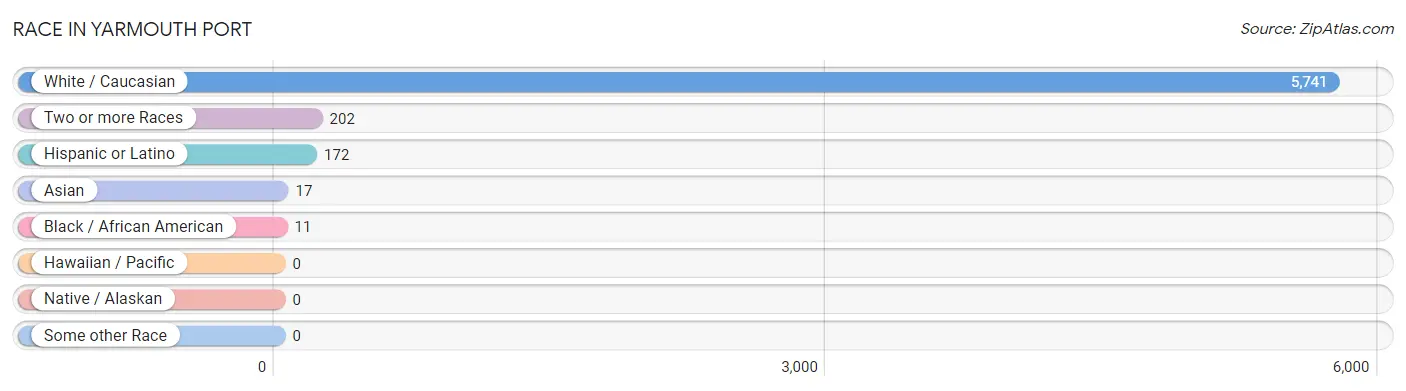
| Race | # Population | % Population |
| Asian | 17 | 0.3% |
| Black / African American | 11 | 0.2% |
| Hawaiian / Pacific | 0 | 0.0% |
| Hispanic or Latino | 172 | 2.9% |
| Native / Alaskan | 0 | 0.0% |
| White / Caucasian | 5,741 | 96.2% |
| Two or more Races | 202 | 3.4% |
| Some other Race | 0 | 0.0% |
| Total | 5,971 | 100.0% |
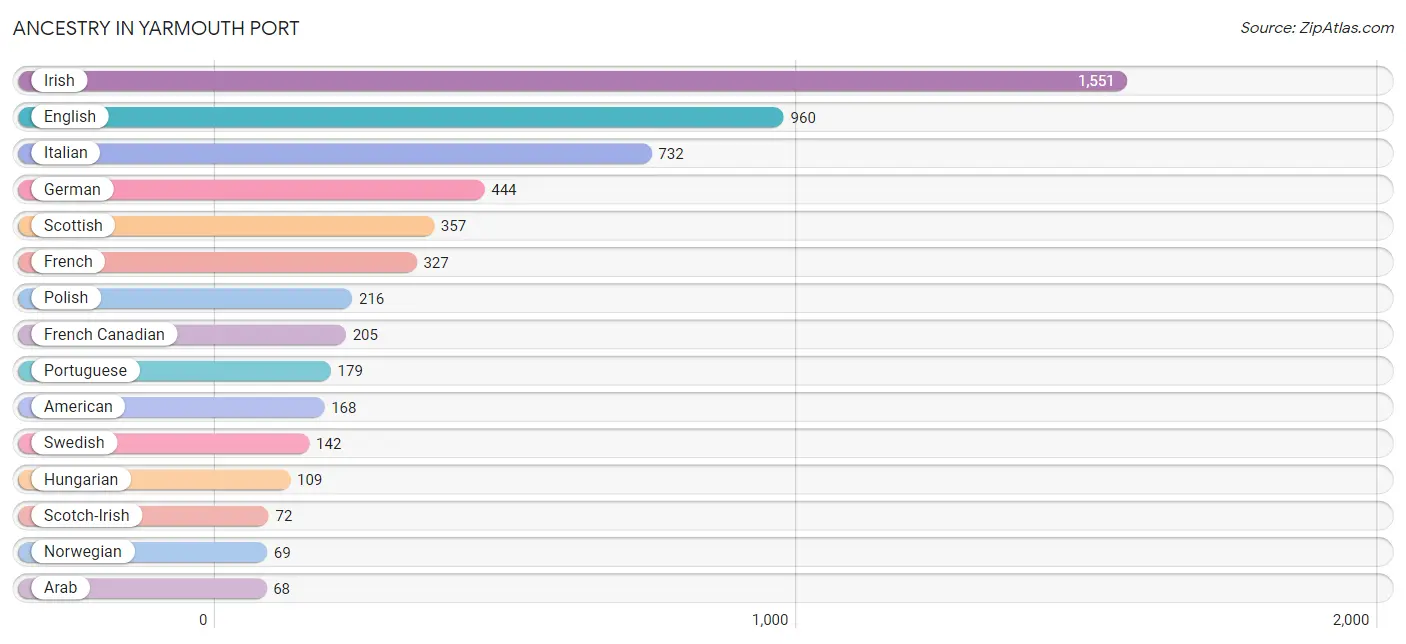
Ancestry in Yarmouth Port
The most populous ancestries reported in Yarmouth Port are Irish (1,551 | 26.0%), English (960 | 16.1%), Italian (732 | 12.3%), German (444 | 7.4%), and Scottish (357 | 6.0%), together accounting for 67.7% of all Yarmouth Port residents.
| Ancestry | # Population | % Population |
| American | 168 | 2.8% |
| Arab | 68 | 1.1% |
| Armenian | 23 | 0.4% |
| Austrian | 9 | 0.2% |
| Belgian | 13 | 0.2% |
| Bermudan | 19 | 0.3% |
| Brazilian | 25 | 0.4% |
| British | 40 | 0.7% |
| Canadian | 44 | 0.7% |
| Central American | 56 | 0.9% |
| Chilean | 33 | 0.5% |
| Czech | 25 | 0.4% |
| Danish | 17 | 0.3% |
| Dutch | 57 | 0.9% |
| Eastern European | 7 | 0.1% |
| English | 960 | 16.1% |
| European | 51 | 0.9% |
| Finnish | 10 | 0.2% |
| French | 327 | 5.5% |
| French Canadian | 205 | 3.4% |
| German | 444 | 7.4% |
| Hungarian | 109 | 1.8% |
| Irish | 1,551 | 26.0% |
| Italian | 732 | 12.3% |
| Lebanese | 61 | 1.0% |
| Lithuanian | 66 | 1.1% |
| Norwegian | 69 | 1.2% |
| Polish | 216 | 3.6% |
| Portuguese | 179 | 3.0% |
| Puerto Rican | 53 | 0.9% |
| Romanian | 24 | 0.4% |
| Russian | 49 | 0.8% |
| Salvadoran | 56 | 0.9% |
| Scotch-Irish | 72 | 1.2% |
| Scottish | 357 | 6.0% |
| Slovak | 15 | 0.3% |
| South American | 33 | 0.5% |
| Spaniard | 30 | 0.5% |
| Swedish | 142 | 2.4% |
| Syrian | 7 | 0.1% |
| Thai | 17 | 0.3% |
| Ukrainian | 35 | 0.6% |
| Welsh | 64 | 1.1% | View All 43 Rows |
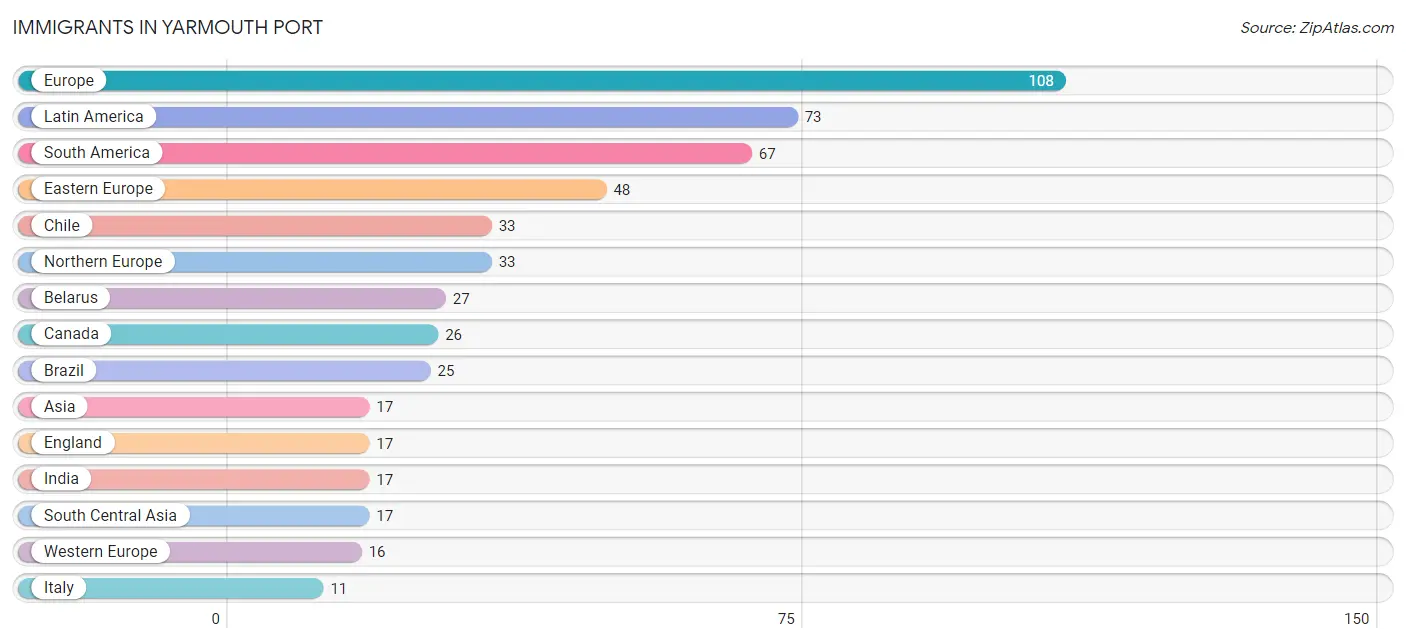
Immigrants in Yarmouth Port
The most numerous immigrant groups reported in Yarmouth Port came from Europe (108 | 1.8%), Latin America (73 | 1.2%), South America (67 | 1.1%), Eastern Europe (48 | 0.8%), and Chile (33 | 0.5%), together accounting for 5.5% of all Yarmouth Port residents.
| Immigration Origin | # Population | % Population |
| Asia | 17 | 0.3% |
| Belarus | 27 | 0.4% |
| Belgium | 7 | 0.1% |
| Brazil | 25 | 0.4% |
| Canada | 26 | 0.4% |
| Central America | 6 | 0.1% |
| Chile | 33 | 0.5% |
| Colombia | 9 | 0.2% |
| Eastern Europe | 48 | 0.8% |
| England | 17 | 0.3% |
| Europe | 108 | 1.8% |
| Germany | 9 | 0.2% |
| Guatemala | 6 | 0.1% |
| India | 17 | 0.3% |
| Ireland | 8 | 0.1% |
| Italy | 11 | 0.2% |
| Latin America | 73 | 1.2% |
| Northern Europe | 33 | 0.5% |
| Poland | 10 | 0.2% |
| Russia | 11 | 0.2% |
| Scotland | 8 | 0.1% |
| South America | 67 | 1.1% |
| South Central Asia | 17 | 0.3% |
| Southern Europe | 11 | 0.2% |
| Western Europe | 16 | 0.3% | View All 25 Rows |
Sex and Age in Yarmouth Port
Sex and Age in Yarmouth Port
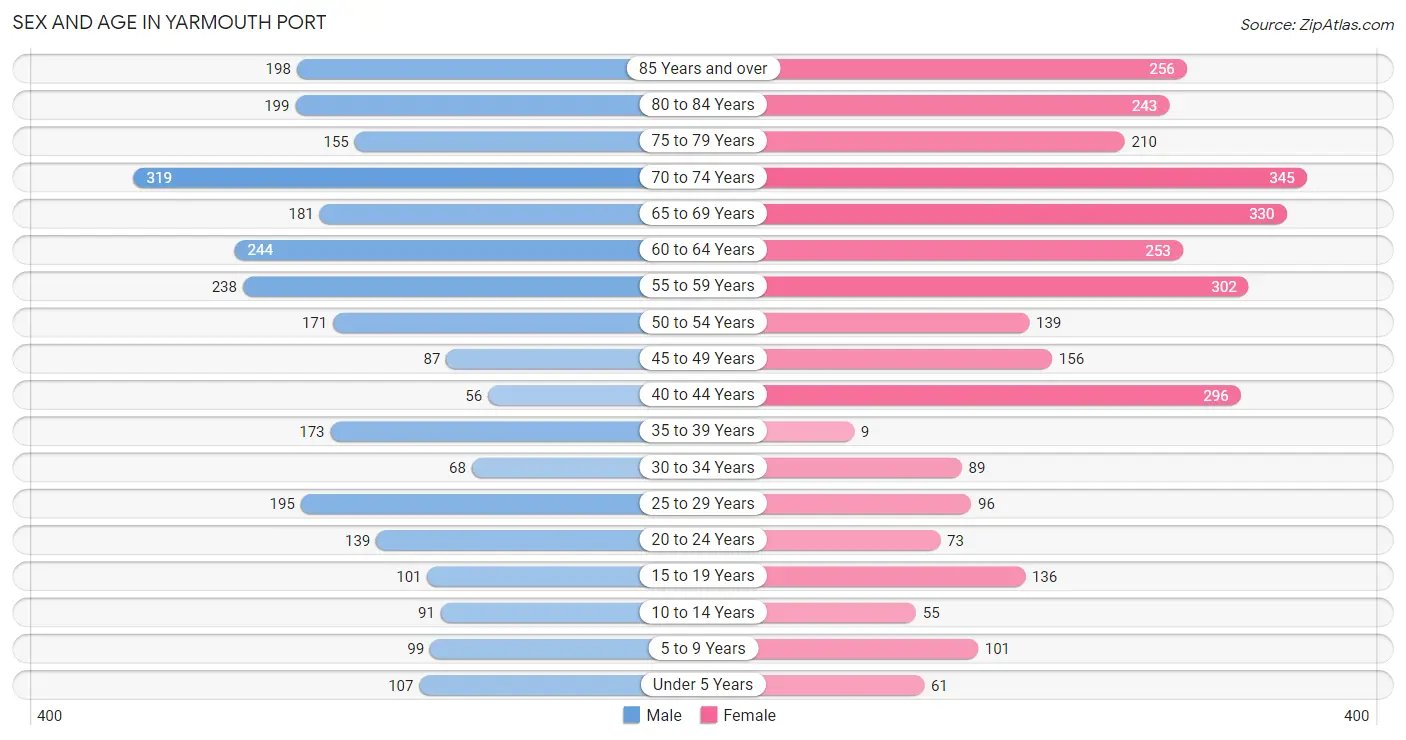
The most populous age groups in Yarmouth Port are 70 to 74 Years (319 | 11.3%) for men and 70 to 74 Years (345 | 11.0%) for women.
| Age Bracket | Male | Female |
| Under 5 Years | 107 (3.8%) | 61 (1.9%) |
| 5 to 9 Years | 99 (3.5%) | 101 (3.2%) |
| 10 to 14 Years | 91 (3.2%) | 55 (1.8%) |
| 15 to 19 Years | 101 (3.6%) | 136 (4.3%) |
| 20 to 24 Years | 139 (4.9%) | 73 (2.3%) |
| 25 to 29 Years | 195 (6.9%) | 96 (3.0%) |
| 30 to 34 Years | 68 (2.4%) | 89 (2.8%) |
| 35 to 39 Years | 173 (6.1%) | 9 (0.3%) |
| 40 to 44 Years | 56 (2.0%) | 296 (9.4%) |
| 45 to 49 Years | 87 (3.1%) | 156 (5.0%) |
| 50 to 54 Years | 171 (6.1%) | 139 (4.4%) |
| 55 to 59 Years | 238 (8.4%) | 302 (9.6%) |
| 60 to 64 Years | 244 (8.6%) | 253 (8.0%) |
| 65 to 69 Years | 181 (6.4%) | 330 (10.5%) |
| 70 to 74 Years | 319 (11.3%) | 345 (11.0%) |
| 75 to 79 Years | 155 (5.5%) | 210 (6.7%) |
| 80 to 84 Years | 199 (7.0%) | 243 (7.7%) |
| 85 Years and over | 198 (7.0%) | 256 (8.1%) |
| Total | 2,821 (100.0%) | 3,150 (100.0%) |
Families and Households in Yarmouth Port
Median Family Size in Yarmouth Port
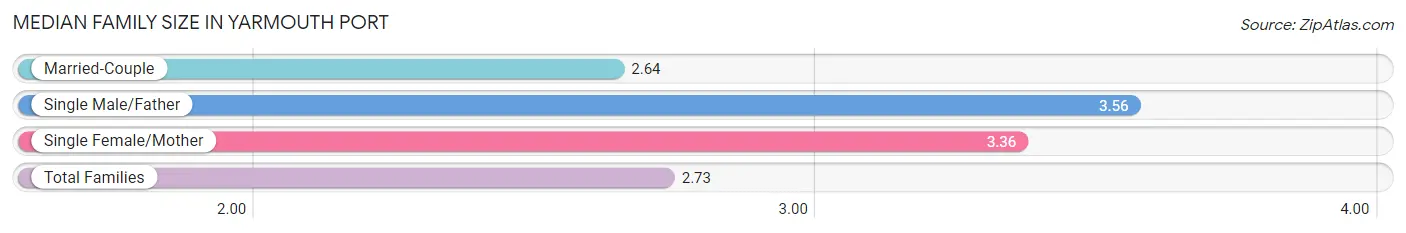
The median family size in Yarmouth Port is 2.73 persons per family, with single male/father families (91 | 5.1%) accounting for the largest median family size of 3.56 persons per family. On the other hand, married-couple families (1,602 | 88.9%) represent the smallest median family size with 2.64 persons per family.
| Family Type | # Families | Family Size |
| Married-Couple | 1,602 (88.9%) | 2.64 |
| Single Male/Father | 91 (5.1%) | 3.56 |
| Single Female/Mother | 108 (6.0%) | 3.36 |
| Total Families | 1,801 (100.0%) | 2.73 |
Median Household Size in Yarmouth Port
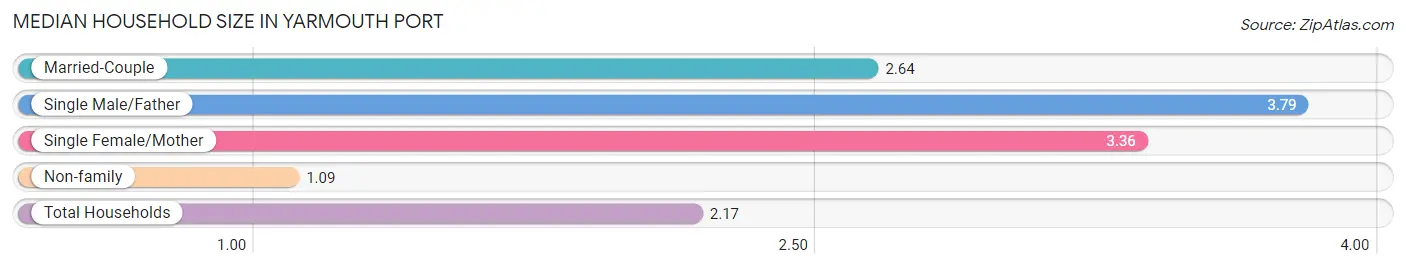
The median household size in Yarmouth Port is 2.17 persons per household, with single male/father households (91 | 3.3%) accounting for the largest median household size of 3.79 persons per household. non-family households (950 | 34.5%) represent the smallest median household size with 1.09 persons per household.
| Household Type | # Households | Household Size |
| Married-Couple | 1,602 (58.2%) | 2.64 |
| Single Male/Father | 91 (3.3%) | 3.79 |
| Single Female/Mother | 108 (3.9%) | 3.36 |
| Non-family | 950 (34.5%) | 1.09 |
| Total Households | 2,751 (100.0%) | 2.17 |
Household Size by Marriage Status in Yarmouth Port
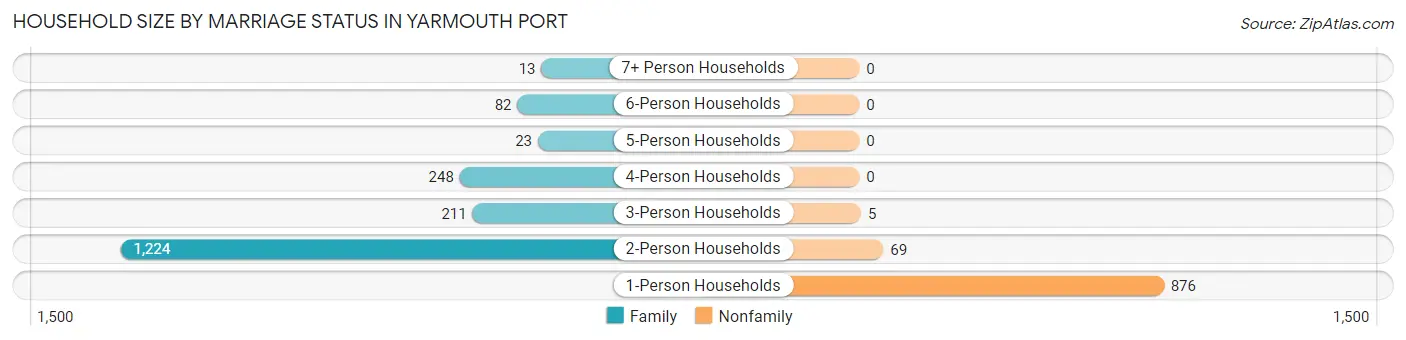
Out of a total of 2,751 households in Yarmouth Port, 1,801 (65.5%) are family households, while 950 (34.5%) are nonfamily households. The most numerous type of family households are 2-person households, comprising 1,224, and the most common type of nonfamily households are 1-person households, comprising 876.
| Household Size | Family Households | Nonfamily Households |
| 1-Person Households | - | 876 (31.8%) |
| 2-Person Households | 1,224 (44.5%) | 69 (2.5%) |
| 3-Person Households | 211 (7.7%) | 5 (0.2%) |
| 4-Person Households | 248 (9.0%) | 0 (0.0%) |
| 5-Person Households | 23 (0.8%) | 0 (0.0%) |
| 6-Person Households | 82 (3.0%) | 0 (0.0%) |
| 7+ Person Households | 13 (0.5%) | 0 (0.0%) |
| Total | 1,801 (65.5%) | 950 (34.5%) |
Female Fertility in Yarmouth Port
Fertility by Age in Yarmouth Port
Average fertility rate in Yarmouth Port is 49.0 births per 1,000 women. Women in the age bracket of 20 to 34 years have the highest fertility rate with 128.0 births per 1,000 women. Women in the age bracket of 20 to 34 years acount for 78.6% of all women with births.
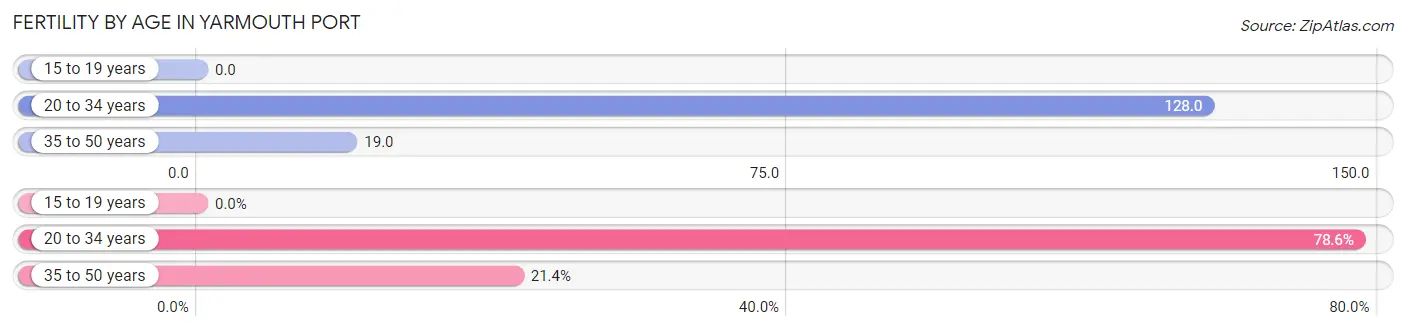
| Age Bracket | Women with Births | Births / 1,000 Women |
| 15 to 19 years | 0 (0.0%) | 0.0 |
| 20 to 34 years | 33 (78.6%) | 128.0 |
| 35 to 50 years | 9 (21.4%) | 19.0 |
| Total | 42 (100.0%) | 49.0 |
Fertility by Age by Marriage Status in Yarmouth Port
78.6% of women with births (42) in Yarmouth Port are married. The highest percentage of unmarried women with births falls into 35 to 50 years age bracket with 100.0% of them unmarried at the time of birth, while the lowest percentage of unmarried women with births belong to 20 to 34 years age bracket with 0.0% of them unmarried.
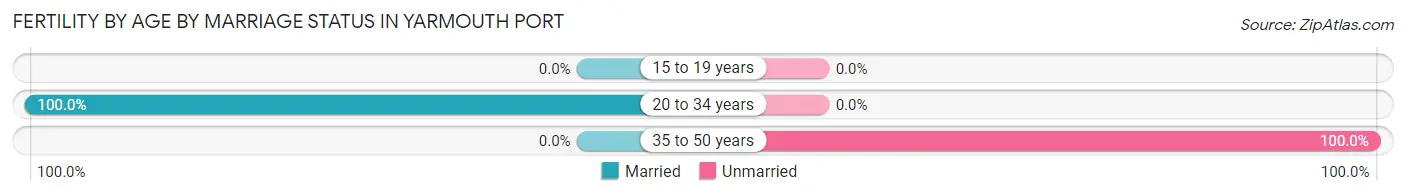
| Age Bracket | Married | Unmarried |
| 15 to 19 years | 0 (0.0%) | 0 (0.0%) |
| 20 to 34 years | 33 (100.0%) | 0 (0.0%) |
| 35 to 50 years | 0 (0.0%) | 9 (100.0%) |
| Total | 33 (78.6%) | 9 (21.4%) |
Fertility by Education in Yarmouth Port
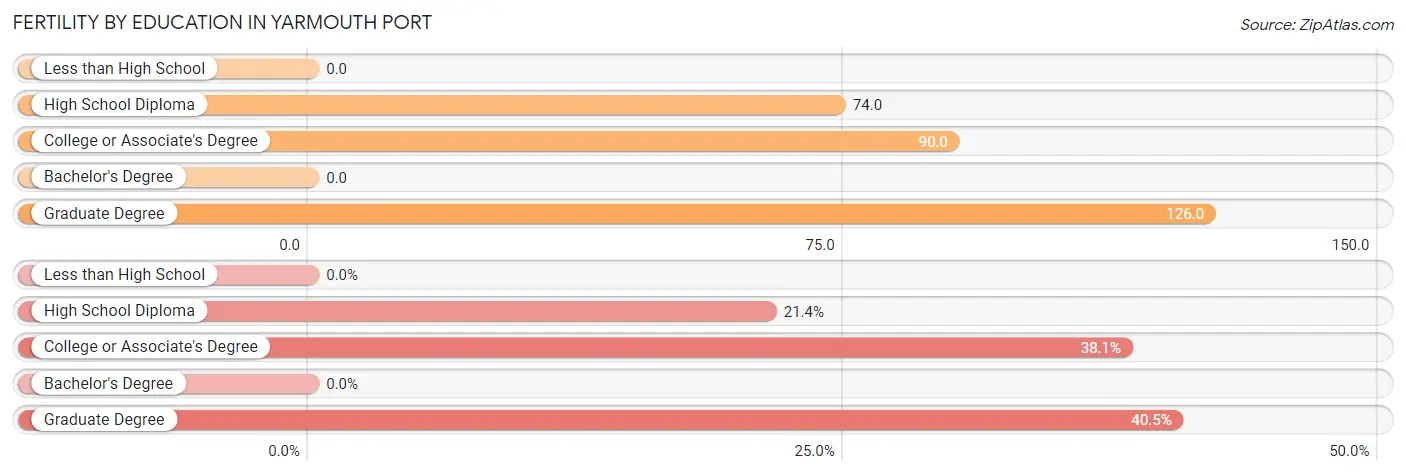
| Educational Attainment | Women with Births | Births / 1,000 Women |
| Less than High School | 0 (0.0%) | 0.0 |
| High School Diploma | 9 (21.4%) | 74.0 |
| College or Associate's Degree | 16 (38.1%) | 90.0 |
| Bachelor's Degree | 0 (0.0%) | 0.0 |
| Graduate Degree | 17 (40.5%) | 126.0 |
| Total | 42 (100.0%) | 49.0 |
Fertility by Education by Marriage Status in Yarmouth Port
21.4% of women with births in Yarmouth Port are unmarried. Women with the educational attainment of college or associate's degree are most likely to be married with 100.0% of them married at childbirth, while women with the educational attainment of high school diploma are least likely to be married with 100.0% of them unmarried at childbirth.
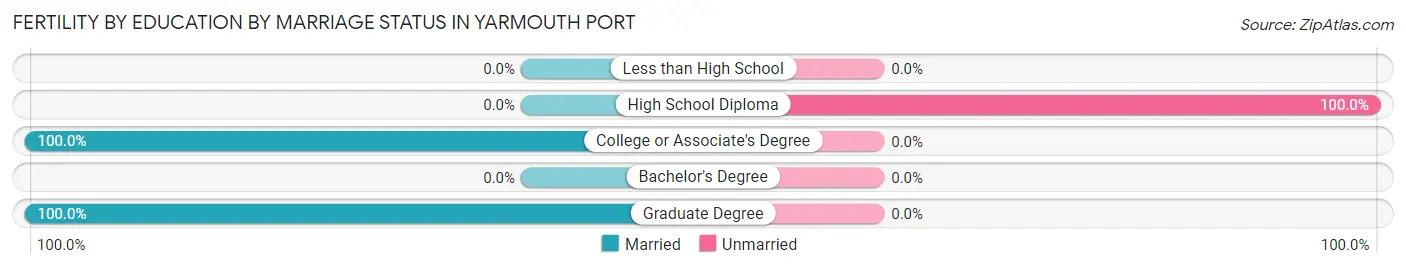
| Educational Attainment | Married | Unmarried |
| Less than High School | 0 (0.0%) | 0 (0.0%) |
| High School Diploma | 0 (0.0%) | 9 (100.0%) |
| College or Associate's Degree | 16 (100.0%) | 0 (0.0%) |
| Bachelor's Degree | 0 (0.0%) | 0 (0.0%) |
| Graduate Degree | 17 (100.0%) | 0 (0.0%) |
| Total | 33 (78.6%) | 9 (21.4%) |
Employment Characteristics in Yarmouth Port
Employment by Class of Employer in Yarmouth Port
Among the 2,719 employed individuals in Yarmouth Port, private company employees (1,487 | 54.7%), local government employees (365 | 13.4%), and self-employed (not incorporated) (332 | 12.2%) make up the most common classes of employment.
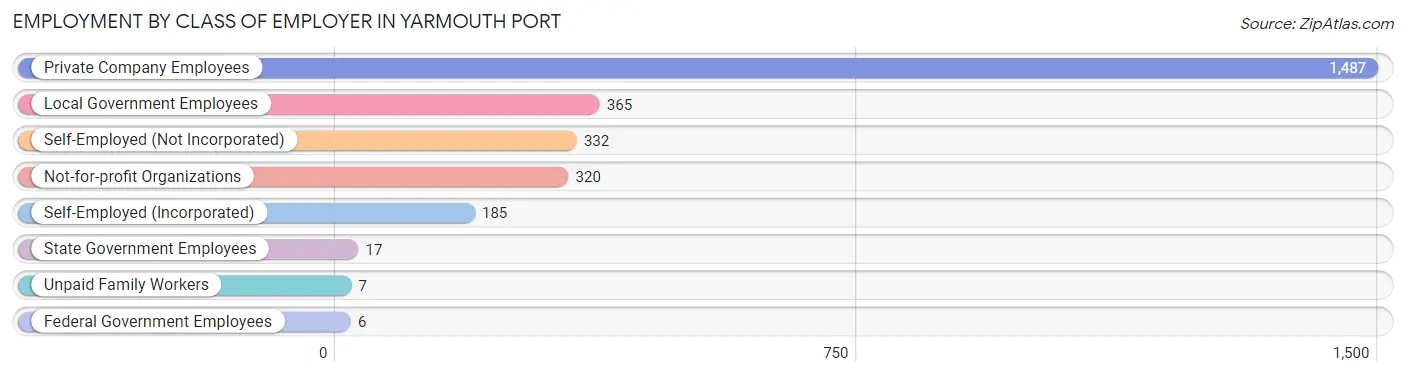
| Employer Class | # Employees | % Employees |
| Private Company Employees | 1,487 | 54.7% |
| Self-Employed (Incorporated) | 185 | 6.8% |
| Self-Employed (Not Incorporated) | 332 | 12.2% |
| Not-for-profit Organizations | 320 | 11.8% |
| Local Government Employees | 365 | 13.4% |
| State Government Employees | 17 | 0.6% |
| Federal Government Employees | 6 | 0.2% |
| Unpaid Family Workers | 7 | 0.3% |
| Total | 2,719 | 100.0% |
Employment Status by Age in Yarmouth Port
According to the labor force statistics for Yarmouth Port, out of the total population over 16 years of age (5,443), 52.2% or 2,841 individuals are in the labor force, with 2.0% or 57 of them unemployed. The age group with the highest labor force participation rate is 25 to 29 years, with 94.2% or 274 individuals in the labor force. Within the labor force, the 75 years and over age range has the highest percentage of unemployed individuals, with 26.4% or 24 of them being unemployed.
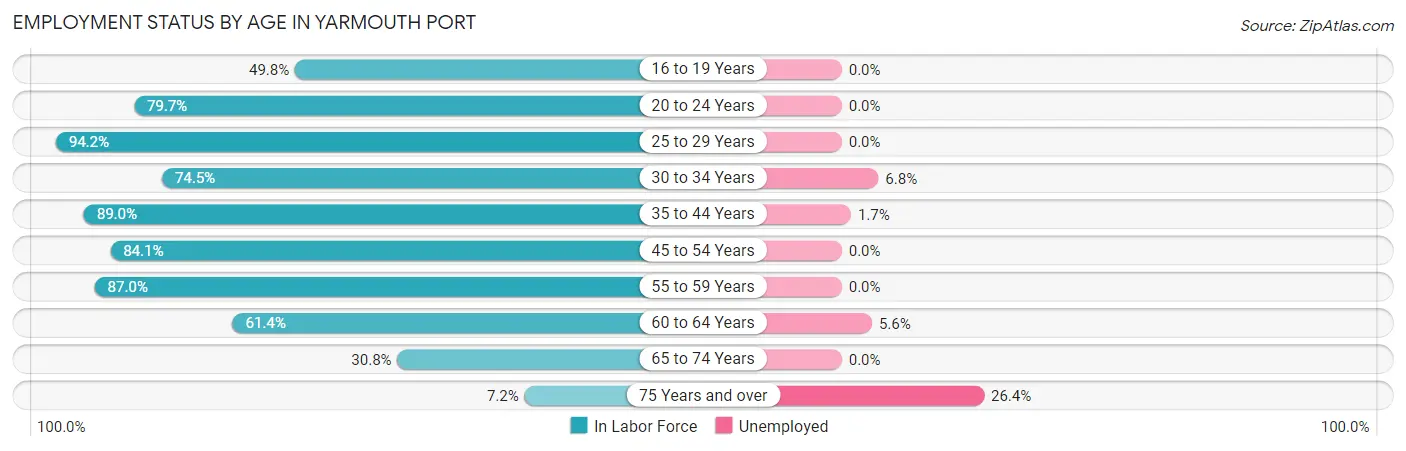
| Age Bracket | In Labor Force | Unemployed |
| 16 to 19 Years | 111 (49.8%) | 0 (0.0%) |
| 20 to 24 Years | 169 (79.7%) | 0 (0.0%) |
| 25 to 29 Years | 274 (94.2%) | 0 (0.0%) |
| 30 to 34 Years | 117 (74.5%) | 8 (6.8%) |
| 35 to 44 Years | 475 (89.0%) | 8 (1.7%) |
| 45 to 54 Years | 465 (84.1%) | 0 (0.0%) |
| 55 to 59 Years | 470 (87.0%) | 0 (0.0%) |
| 60 to 64 Years | 305 (61.4%) | 17 (5.6%) |
| 65 to 74 Years | 362 (30.8%) | 0 (0.0%) |
| 75 Years and over | 91 (7.2%) | 24 (26.4%) |
| Total | 2,841 (52.2%) | 57 (2.0%) |
Employment Status by Educational Attainment in Yarmouth Port
According to labor force statistics for Yarmouth Port, 81.9% of individuals (2,106) out of the total population between 25 and 64 years of age (2,572) are in the labor force, with 1.6% or 34 of them being unemployed. The group with the highest labor force participation rate are those with the educational attainment of bachelor's degree or higher, with 87.4% or 1,151 individuals in the labor force. Within the labor force, individuals with high school diploma education have the highest percentage of unemployment, with 4.0% or 17 of them being unemployed.
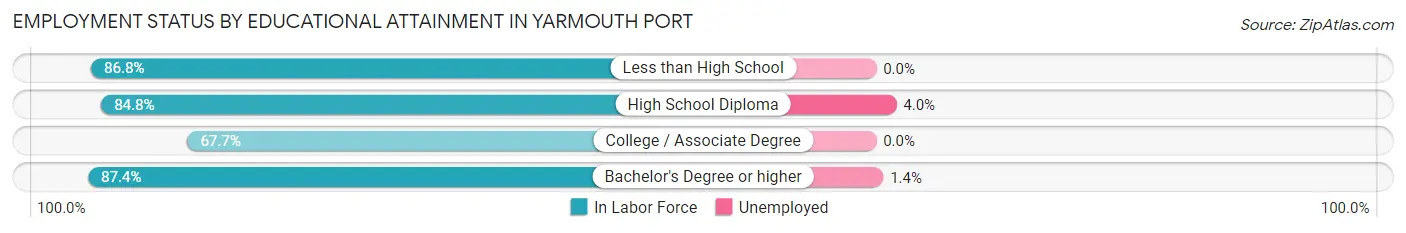
| Educational Attainment | In Labor Force | Unemployed |
| Less than High School | 92 (86.8%) | 0 (0.0%) |
| High School Diploma | 420 (84.8%) | 20 (4.0%) |
| College / Associate Degree | 443 (67.7%) | 0 (0.0%) |
| Bachelor's Degree or higher | 1,151 (87.4%) | 18 (1.4%) |
| Total | 2,106 (81.9%) | 41 (1.6%) |
Employment Occupations by Sex in Yarmouth Port
Management, Business, Science and Arts Occupations
The most common Management, Business, Science and Arts occupations in Yarmouth Port are Community & Social Service (479 | 17.2%), Management (439 | 15.8%), Education Instruction & Library (296 | 10.6%), Health Diagnosing & Treating (197 | 7.1%), and Health Technologists (153 | 5.5%).
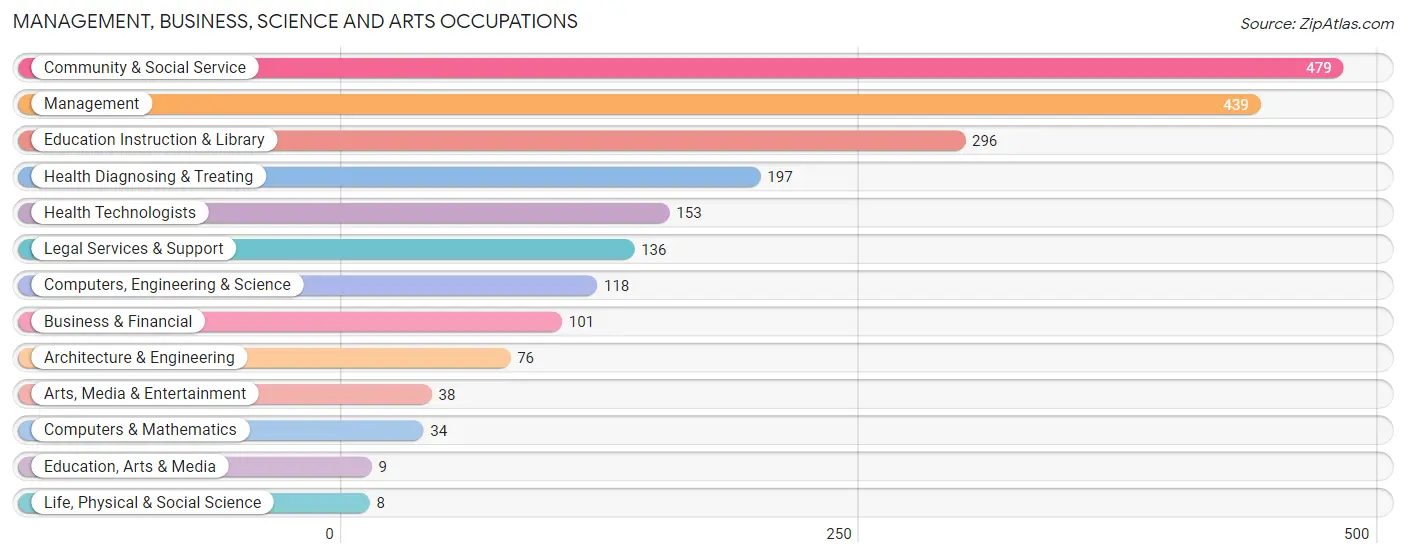
Management, Business, Science and Arts Occupations by Sex
Within the Management, Business, Science and Arts occupations in Yarmouth Port, the most male-oriented occupations are Legal Services & Support (89.7%), Business & Financial (78.2%), and Computers & Mathematics (52.9%), while the most female-oriented occupations are Life, Physical & Social Science (100.0%), Education, Arts & Media (100.0%), and Arts, Media & Entertainment (100.0%).
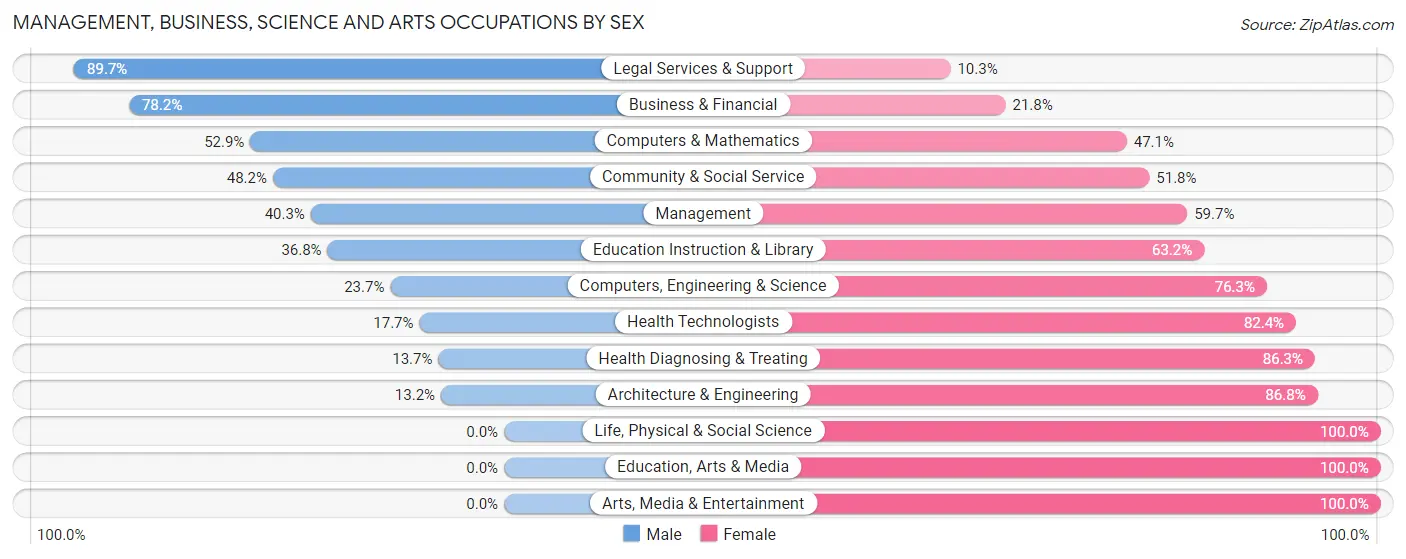
| Occupation | Male | Female |
| Management | 177 (40.3%) | 262 (59.7%) |
| Business & Financial | 79 (78.2%) | 22 (21.8%) |
| Computers, Engineering & Science | 28 (23.7%) | 90 (76.3%) |
| Computers & Mathematics | 18 (52.9%) | 16 (47.1%) |
| Architecture & Engineering | 10 (13.2%) | 66 (86.8%) |
| Life, Physical & Social Science | 0 (0.0%) | 8 (100.0%) |
| Community & Social Service | 231 (48.2%) | 248 (51.8%) |
| Education, Arts & Media | 0 (0.0%) | 9 (100.0%) |
| Legal Services & Support | 122 (89.7%) | 14 (10.3%) |
| Education Instruction & Library | 109 (36.8%) | 187 (63.2%) |
| Arts, Media & Entertainment | 0 (0.0%) | 38 (100.0%) |
| Health Diagnosing & Treating | 27 (13.7%) | 170 (86.3%) |
| Health Technologists | 27 (17.6%) | 126 (82.4%) |
| Total (Category) | 542 (40.6%) | 792 (59.4%) |
| Total (Overall) | 1,451 (52.2%) | 1,331 (47.8%) |
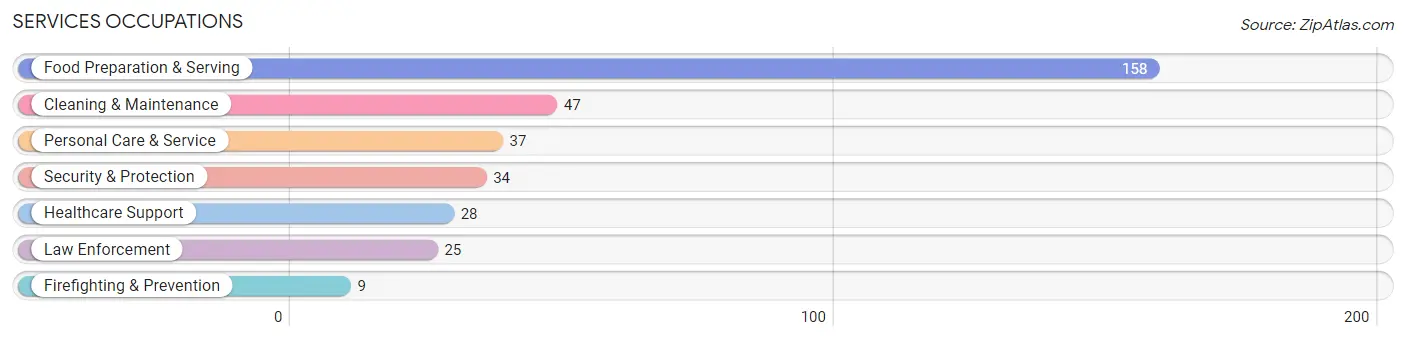
Services Occupations
The most common Services occupations in Yarmouth Port are Food Preparation & Serving (158 | 5.7%), Cleaning & Maintenance (47 | 1.7%), Personal Care & Service (37 | 1.3%), Security & Protection (34 | 1.2%), and Healthcare Support (28 | 1.0%).
Services Occupations by Sex
Within the Services occupations in Yarmouth Port, the most male-oriented occupations are Security & Protection (100.0%), Firefighting & Prevention (100.0%), and Law Enforcement (100.0%), while the most female-oriented occupations are Healthcare Support (100.0%), Personal Care & Service (64.9%), and Food Preparation & Serving (27.9%).
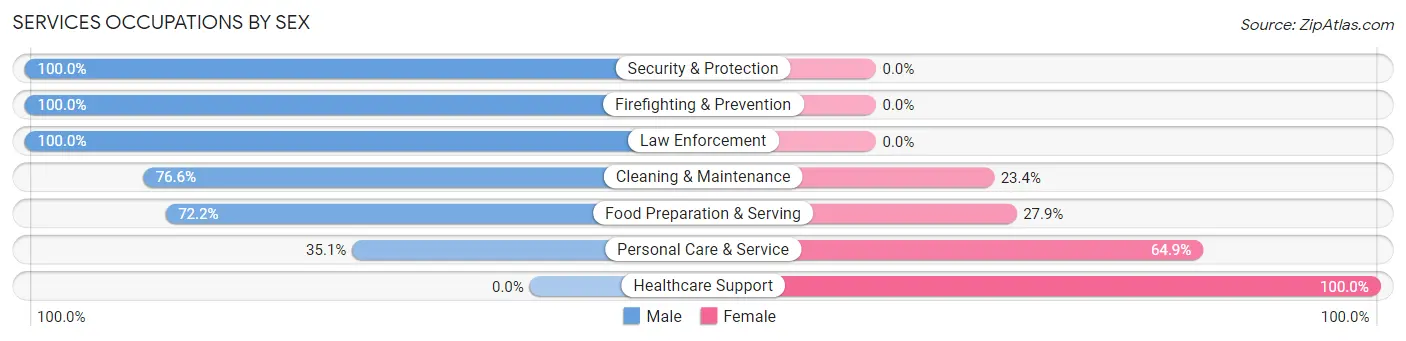
| Occupation | Male | Female |
| Healthcare Support | 0 (0.0%) | 28 (100.0%) |
| Security & Protection | 34 (100.0%) | 0 (0.0%) |
| Firefighting & Prevention | 9 (100.0%) | 0 (0.0%) |
| Law Enforcement | 25 (100.0%) | 0 (0.0%) |
| Food Preparation & Serving | 114 (72.2%) | 44 (27.9%) |
| Cleaning & Maintenance | 36 (76.6%) | 11 (23.4%) |
| Personal Care & Service | 13 (35.1%) | 24 (64.9%) |
| Total (Category) | 197 (64.8%) | 107 (35.2%) |
| Total (Overall) | 1,451 (52.2%) | 1,331 (47.8%) |
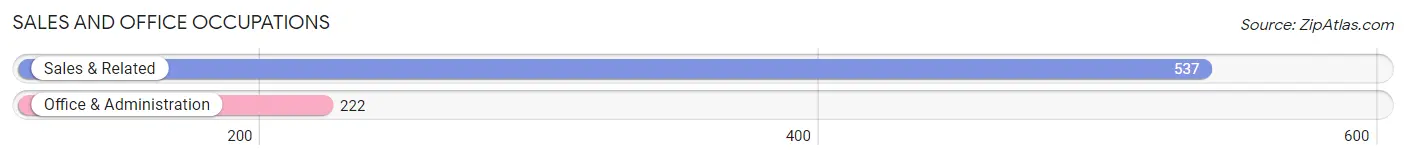
Sales and Office Occupations
The most common Sales and Office occupations in Yarmouth Port are Sales & Related (537 | 19.3%), and Office & Administration (222 | 8.0%).
Sales and Office Occupations by Sex

| Occupation | Male | Female |
| Sales & Related | 318 (59.2%) | 219 (40.8%) |
| Office & Administration | 15 (6.8%) | 207 (93.2%) |
| Total (Category) | 333 (43.9%) | 426 (56.1%) |
| Total (Overall) | 1,451 (52.2%) | 1,331 (47.8%) |
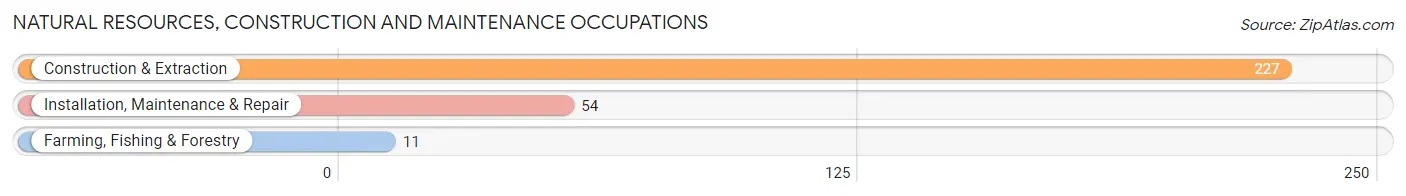
Natural Resources, Construction and Maintenance Occupations
The most common Natural Resources, Construction and Maintenance occupations in Yarmouth Port are Construction & Extraction (227 | 8.2%), Installation, Maintenance & Repair (54 | 1.9%), and Farming, Fishing & Forestry (11 | 0.4%).
Natural Resources, Construction and Maintenance Occupations by Sex
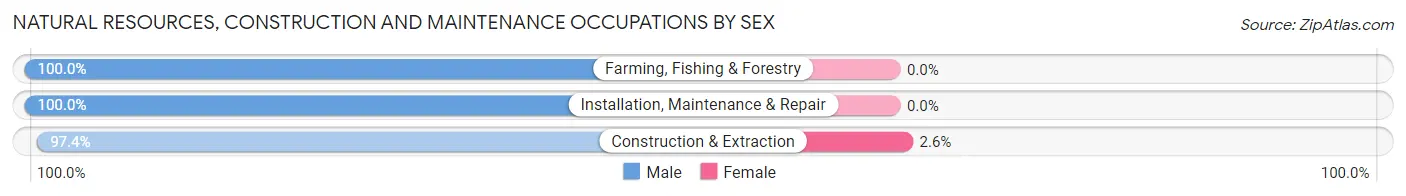
| Occupation | Male | Female |
| Farming, Fishing & Forestry | 11 (100.0%) | 0 (0.0%) |
| Construction & Extraction | 221 (97.4%) | 6 (2.6%) |
| Installation, Maintenance & Repair | 54 (100.0%) | 0 (0.0%) |
| Total (Category) | 286 (98.0%) | 6 (2.1%) |
| Total (Overall) | 1,451 (52.2%) | 1,331 (47.8%) |
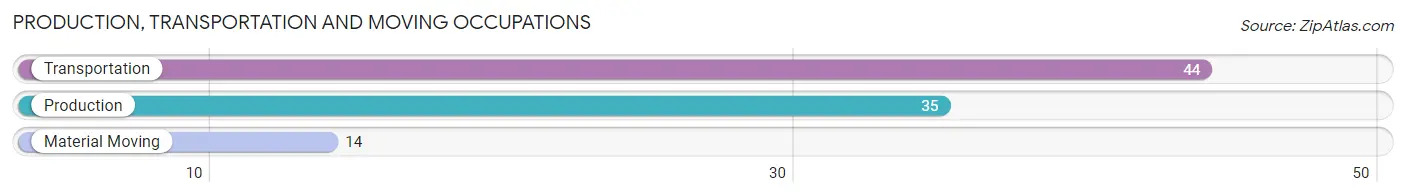
Production, Transportation and Moving Occupations
The most common Production, Transportation and Moving occupations in Yarmouth Port are Transportation (44 | 1.6%), Production (35 | 1.3%), and Material Moving (14 | 0.5%).
Production, Transportation and Moving Occupations by Sex
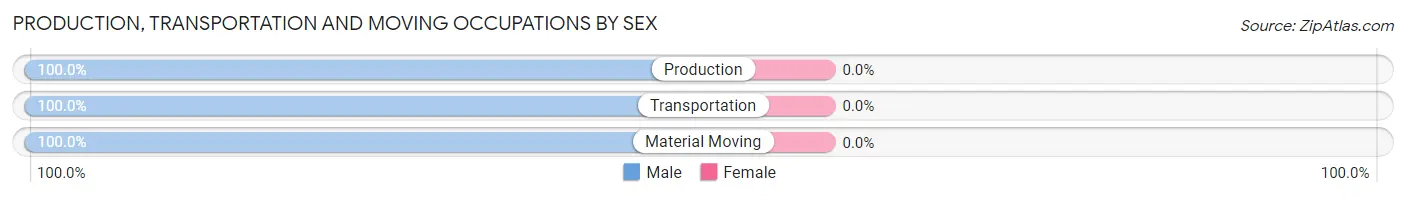
| Occupation | Male | Female |
| Production | 35 (100.0%) | 0 (0.0%) |
| Transportation | 44 (100.0%) | 0 (0.0%) |
| Material Moving | 14 (100.0%) | 0 (0.0%) |
| Total (Category) | 93 (100.0%) | 0 (0.0%) |
| Total (Overall) | 1,451 (52.2%) | 1,331 (47.8%) |
Employment Industries by Sex in Yarmouth Port
Employment Industries in Yarmouth Port
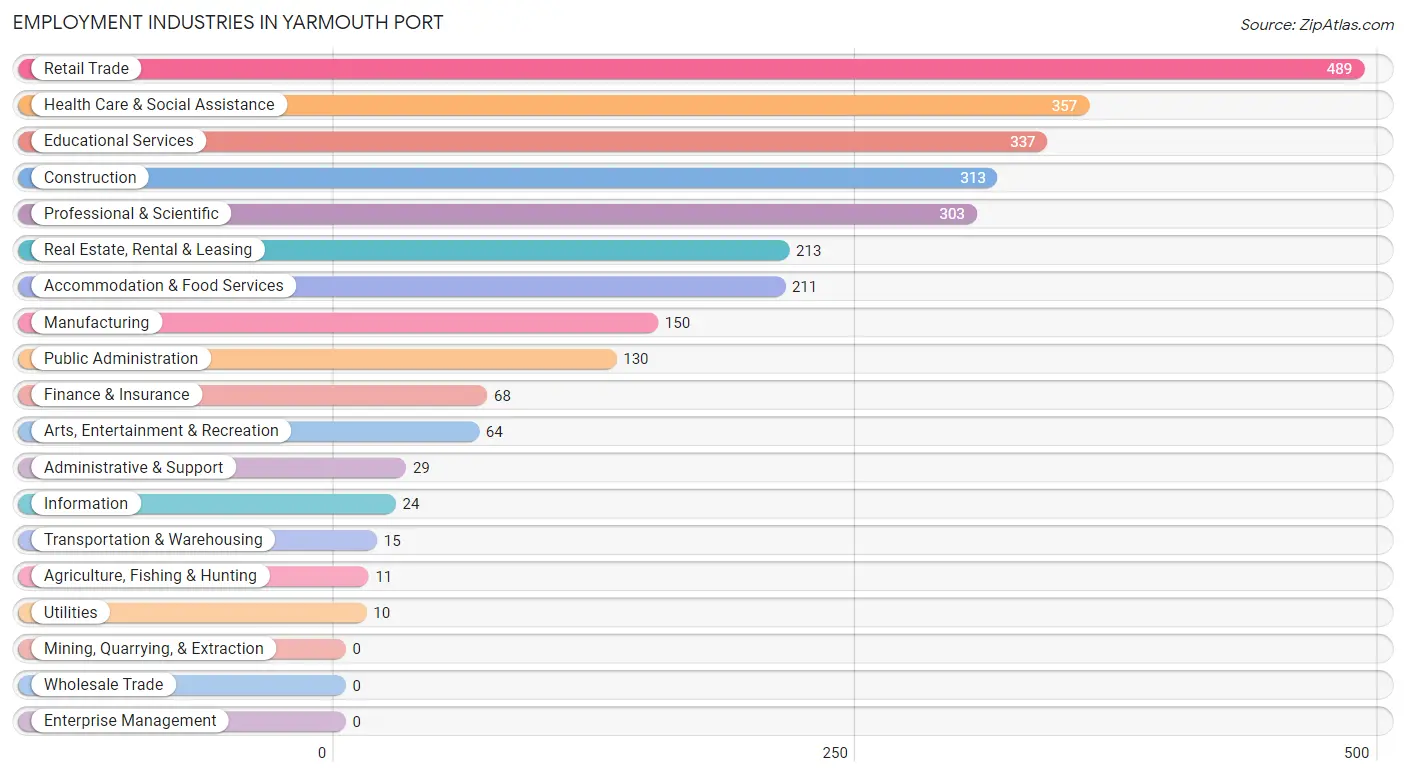
The major employment industries in Yarmouth Port include Retail Trade (489 | 17.6%), Health Care & Social Assistance (357 | 12.8%), Educational Services (337 | 12.1%), Construction (313 | 11.3%), and Professional & Scientific (303 | 10.9%).
Employment Industries by Sex in Yarmouth Port
The Yarmouth Port industries that see more men than women are Agriculture, Fishing & Hunting (100.0%), Transportation & Warehousing (100.0%), and Utilities (100.0%), whereas the industries that tend to have a higher number of women are Health Care & Social Assistance (83.5%), Arts, Entertainment & Recreation (70.3%), and Retail Trade (69.9%).
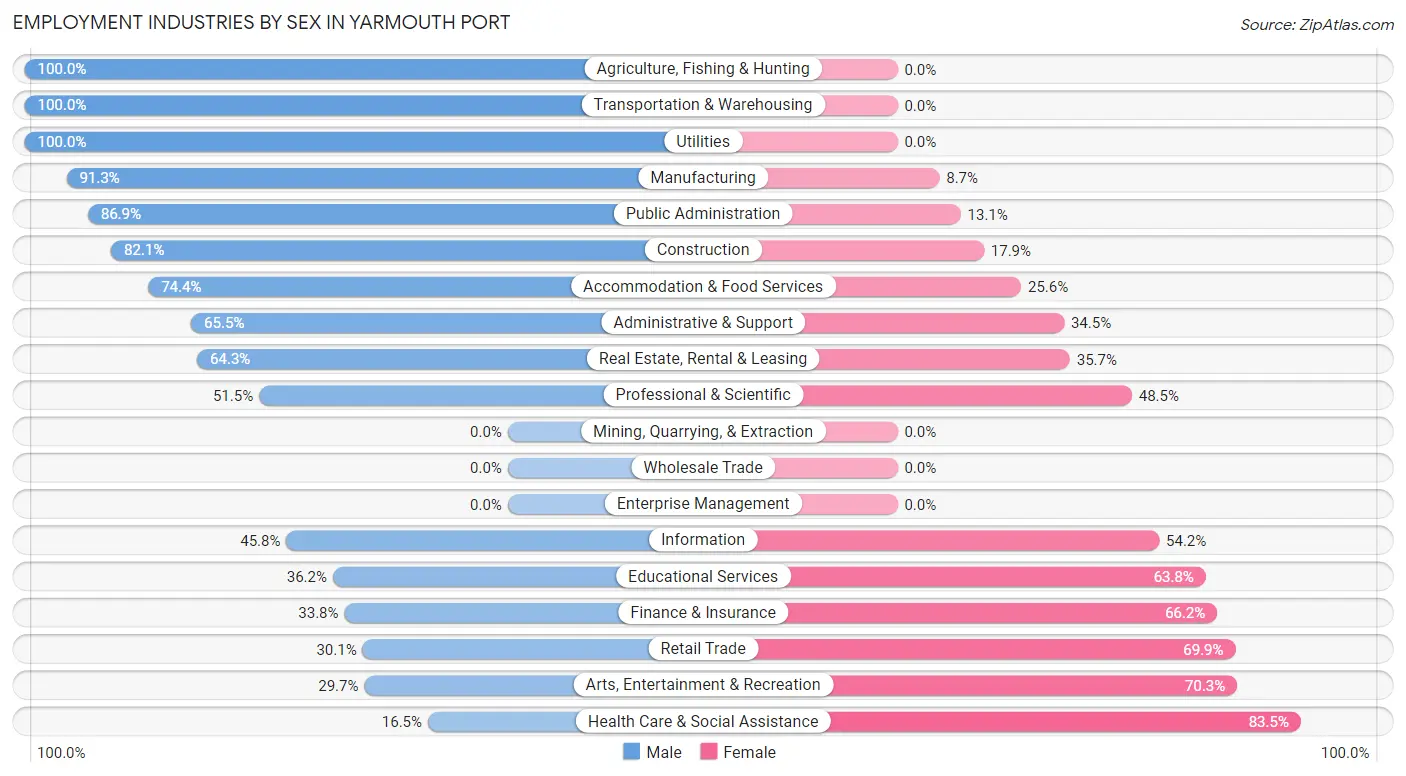
| Industry | Male | Female |
| Agriculture, Fishing & Hunting | 11 (100.0%) | 0 (0.0%) |
| Mining, Quarrying, & Extraction | 0 (0.0%) | 0 (0.0%) |
| Construction | 257 (82.1%) | 56 (17.9%) |
| Manufacturing | 137 (91.3%) | 13 (8.7%) |
| Wholesale Trade | 0 (0.0%) | 0 (0.0%) |
| Retail Trade | 147 (30.1%) | 342 (69.9%) |
| Transportation & Warehousing | 15 (100.0%) | 0 (0.0%) |
| Utilities | 10 (100.0%) | 0 (0.0%) |
| Information | 11 (45.8%) | 13 (54.2%) |
| Finance & Insurance | 23 (33.8%) | 45 (66.2%) |
| Real Estate, Rental & Leasing | 137 (64.3%) | 76 (35.7%) |
| Professional & Scientific | 156 (51.5%) | 147 (48.5%) |
| Enterprise Management | 0 (0.0%) | 0 (0.0%) |
| Administrative & Support | 19 (65.5%) | 10 (34.5%) |
| Educational Services | 122 (36.2%) | 215 (63.8%) |
| Health Care & Social Assistance | 59 (16.5%) | 298 (83.5%) |
| Arts, Entertainment & Recreation | 19 (29.7%) | 45 (70.3%) |
| Accommodation & Food Services | 157 (74.4%) | 54 (25.6%) |
| Public Administration | 113 (86.9%) | 17 (13.1%) |
| Total | 1,451 (52.2%) | 1,331 (47.8%) |
Education in Yarmouth Port
School Enrollment in Yarmouth Port
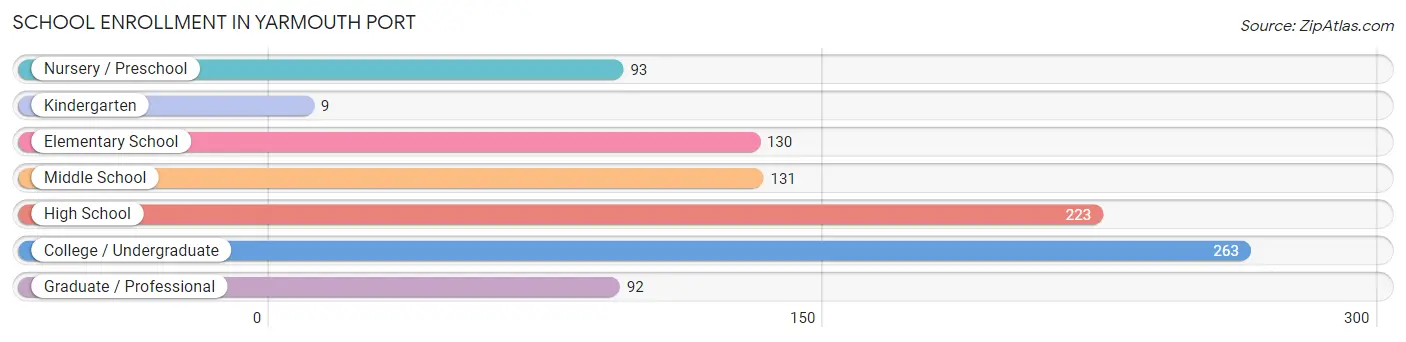
The most common levels of schooling among the 941 students in Yarmouth Port are college / undergraduate (263 | 28.0%), high school (223 | 23.7%), and middle school (131 | 13.9%).
| School Level | # Students | % Students |
| Nursery / Preschool | 93 | 9.9% |
| Kindergarten | 9 | 1.0% |
| Elementary School | 130 | 13.8% |
| Middle School | 131 | 13.9% |
| High School | 223 | 23.7% |
| College / Undergraduate | 263 | 28.0% |
| Graduate / Professional | 92 | 9.8% |
| Total | 941 | 100.0% |
School Enrollment by Age by Funding Source in Yarmouth Port
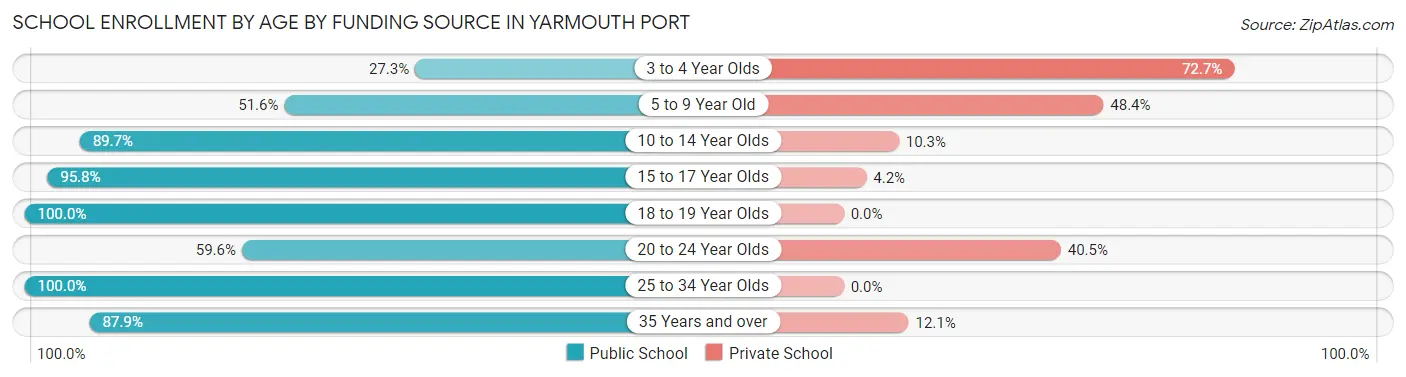
Out of a total of 941 students who are enrolled in schools in Yarmouth Port, 195 (20.7%) attend a private institution, while the remaining 746 (79.3%) are enrolled in public schools. The age group of 3 to 4 year olds has the highest likelihood of being enrolled in private schools, with 24 (72.7% in the age bracket) enrolled. Conversely, the age group of 18 to 19 year olds has the lowest likelihood of being enrolled in a private school, with 10 (100.0% in the age bracket) attending a public institution.
| Age Bracket | Public School | Private School |
| 3 to 4 Year Olds | 9 (27.3%) | 24 (72.7%) |
| 5 to 9 Year Old | 95 (51.6%) | 89 (48.4%) |
| 10 to 14 Year Olds | 131 (89.7%) | 15 (10.3%) |
| 15 to 17 Year Olds | 204 (95.8%) | 9 (4.2%) |
| 18 to 19 Year Olds | 10 (100.0%) | 0 (0.0%) |
| 20 to 24 Year Olds | 53 (59.6%) | 36 (40.5%) |
| 25 to 34 Year Olds | 84 (100.0%) | 0 (0.0%) |
| 35 Years and over | 160 (87.9%) | 22 (12.1%) |
| Total | 746 (79.3%) | 195 (20.7%) |
Educational Attainment by Field of Study in Yarmouth Port
Education (418 | 13.9%), literature & languages (418 | 13.9%), science & technology (312 | 10.3%), business (309 | 10.2%), and social sciences (282 | 9.3%) are the most common fields of study among 3,016 individuals in Yarmouth Port who have obtained a bachelor's degree or higher.
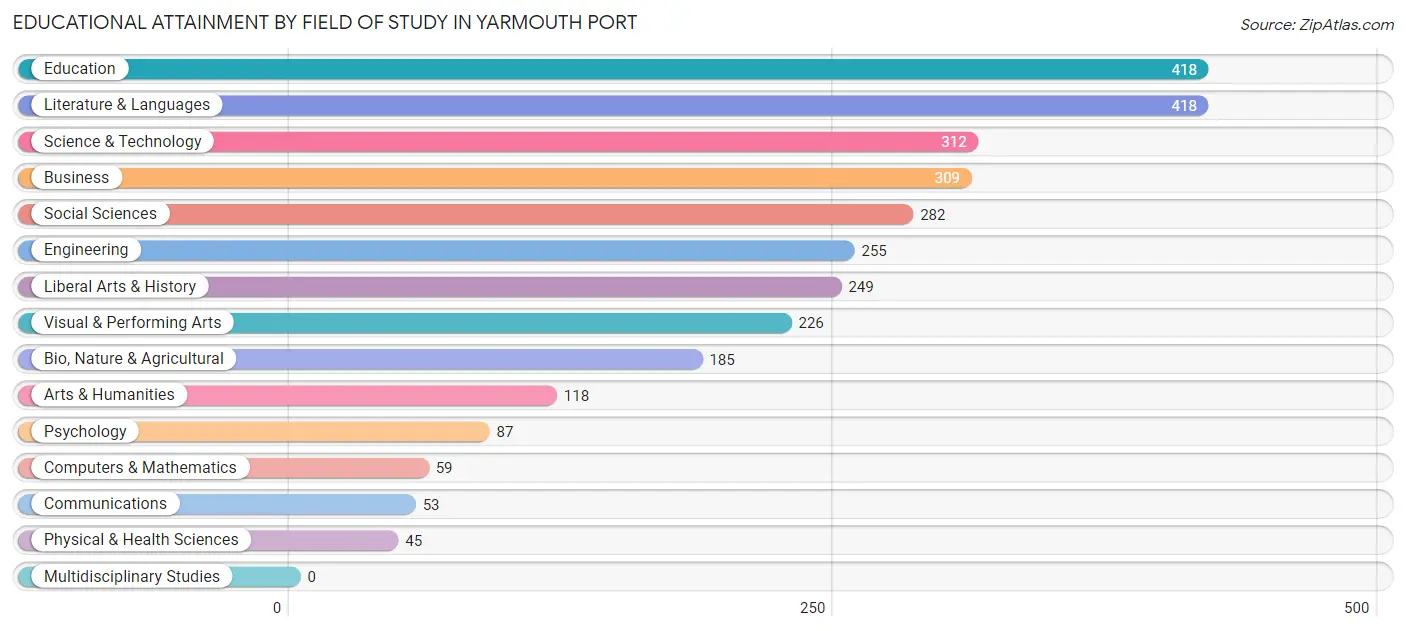
| Field of Study | # Graduates | % Graduates |
| Computers & Mathematics | 59 | 2.0% |
| Bio, Nature & Agricultural | 185 | 6.1% |
| Physical & Health Sciences | 45 | 1.5% |
| Psychology | 87 | 2.9% |
| Social Sciences | 282 | 9.3% |
| Engineering | 255 | 8.5% |
| Multidisciplinary Studies | 0 | 0.0% |
| Science & Technology | 312 | 10.3% |
| Business | 309 | 10.2% |
| Education | 418 | 13.9% |
| Literature & Languages | 418 | 13.9% |
| Liberal Arts & History | 249 | 8.3% |
| Visual & Performing Arts | 226 | 7.5% |
| Communications | 53 | 1.8% |
| Arts & Humanities | 118 | 3.9% |
| Total | 3,016 | 100.0% |
Transportation & Commute in Yarmouth Port
Vehicle Availability by Sex in Yarmouth Port
The most prevalent vehicle ownership categories in Yarmouth Port are males with 2 vehicles (643, accounting for 44.7%) and females with 2 vehicles (596, making up 50.2%).
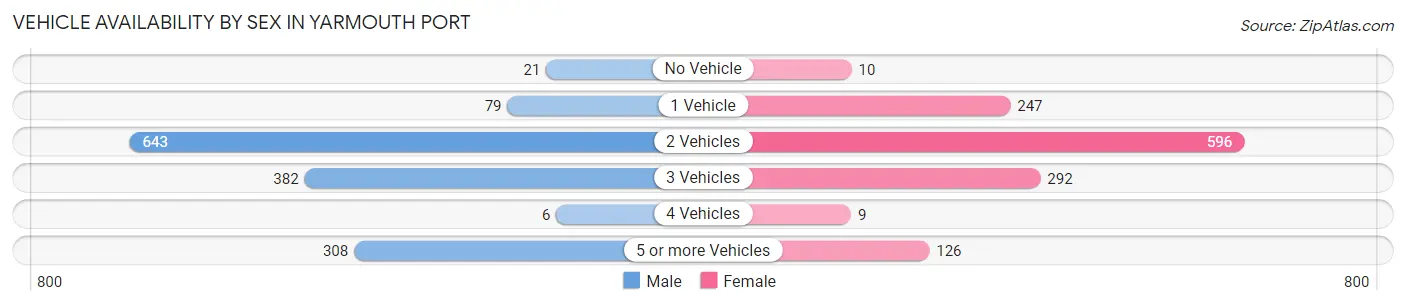
| Vehicles Available | Male | Female |
| No Vehicle | 21 (1.5%) | 10 (0.8%) |
| 1 Vehicle | 79 (5.5%) | 247 (19.3%) |
| 2 Vehicles | 643 (44.7%) | 596 (46.6%) |
| 3 Vehicles | 382 (26.6%) | 292 (22.8%) |
| 4 Vehicles | 6 (0.4%) | 9 (0.7%) |
| 5 or more Vehicles | 308 (21.4%) | 126 (9.8%) |
| Total | 1,439 (100.0%) | 1,280 (100.0%) |
Commute Time in Yarmouth Port
The most frequently occuring commute durations in Yarmouth Port are 15 to 19 minutes (634 commuters, 28.1%), 20 to 24 minutes (388 commuters, 17.2%), and 10 to 14 minutes (315 commuters, 14.0%).
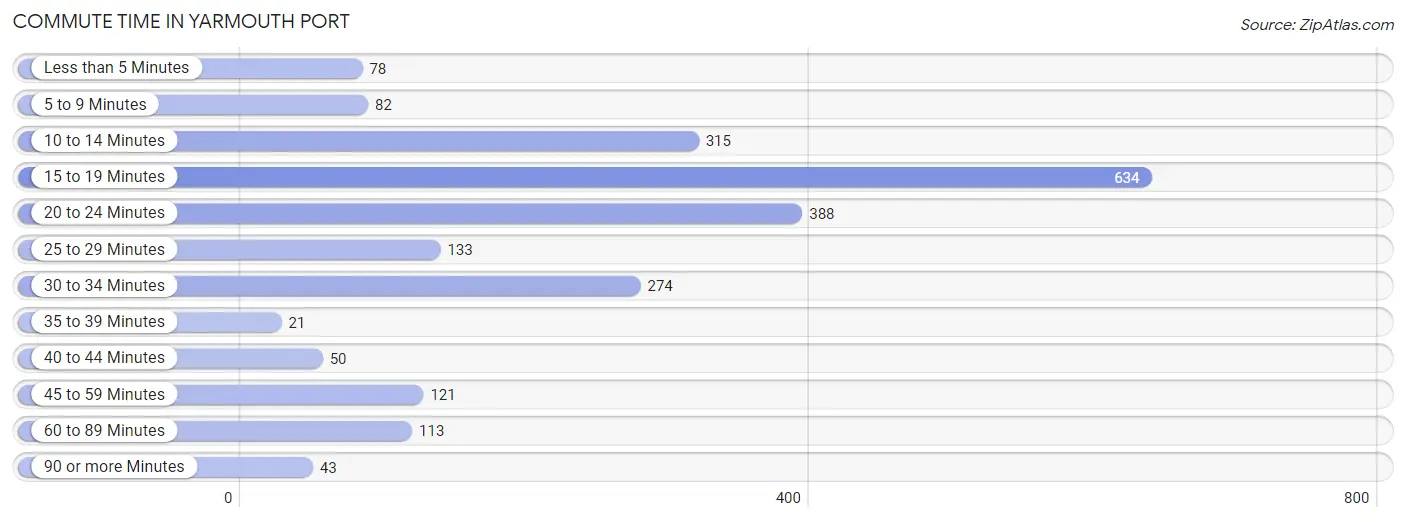
| Commute Time | # Commuters | % Commuters |
| Less than 5 Minutes | 78 | 3.5% |
| 5 to 9 Minutes | 82 | 3.6% |
| 10 to 14 Minutes | 315 | 14.0% |
| 15 to 19 Minutes | 634 | 28.1% |
| 20 to 24 Minutes | 388 | 17.2% |
| 25 to 29 Minutes | 133 | 5.9% |
| 30 to 34 Minutes | 274 | 12.2% |
| 35 to 39 Minutes | 21 | 0.9% |
| 40 to 44 Minutes | 50 | 2.2% |
| 45 to 59 Minutes | 121 | 5.4% |
| 60 to 89 Minutes | 113 | 5.0% |
| 90 or more Minutes | 43 | 1.9% |
Commute Time by Sex in Yarmouth Port
The most common commute times in Yarmouth Port are 15 to 19 minutes (298 commuters, 24.0%) for males and 15 to 19 minutes (336 commuters, 33.2%) for females.
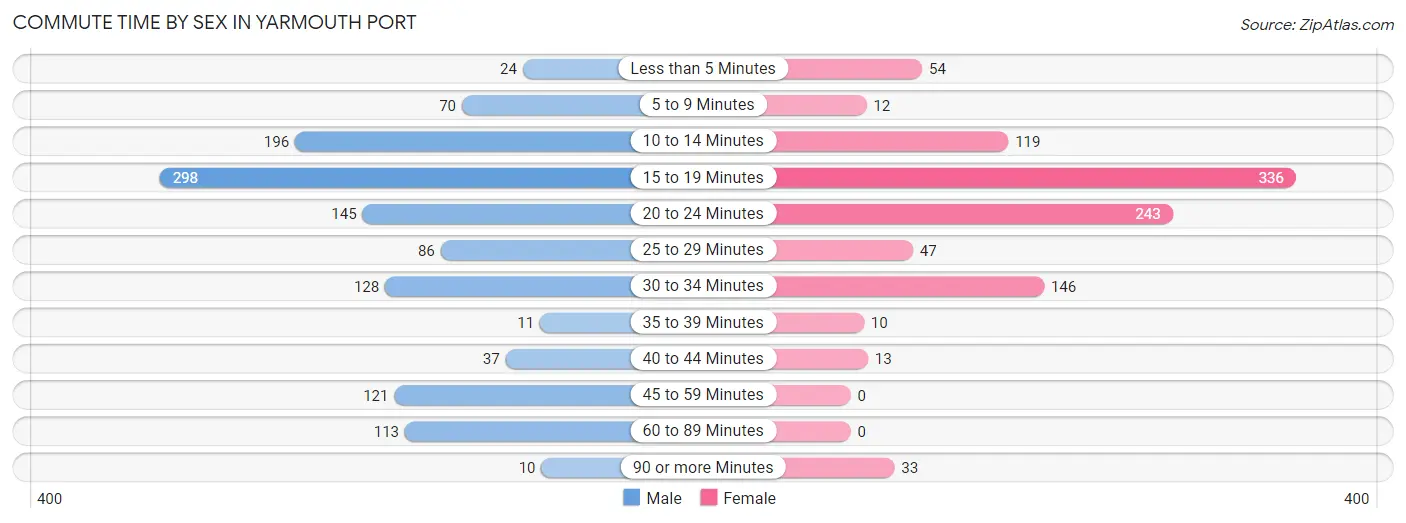
| Commute Time | Male | Female |
| Less than 5 Minutes | 24 (1.9%) | 54 (5.3%) |
| 5 to 9 Minutes | 70 (5.7%) | 12 (1.2%) |
| 10 to 14 Minutes | 196 (15.8%) | 119 (11.7%) |
| 15 to 19 Minutes | 298 (24.0%) | 336 (33.2%) |
| 20 to 24 Minutes | 145 (11.7%) | 243 (24.0%) |
| 25 to 29 Minutes | 86 (6.9%) | 47 (4.6%) |
| 30 to 34 Minutes | 128 (10.3%) | 146 (14.4%) |
| 35 to 39 Minutes | 11 (0.9%) | 10 (1.0%) |
| 40 to 44 Minutes | 37 (3.0%) | 13 (1.3%) |
| 45 to 59 Minutes | 121 (9.8%) | 0 (0.0%) |
| 60 to 89 Minutes | 113 (9.1%) | 0 (0.0%) |
| 90 or more Minutes | 10 (0.8%) | 33 (3.3%) |
Time of Departure to Work by Sex in Yarmouth Port
The most frequent times of departure to work in Yarmouth Port are 7:30 AM to 7:59 AM (186, 15.0%) for males and 9:00 AM to 9:59 AM (238, 23.5%) for females.
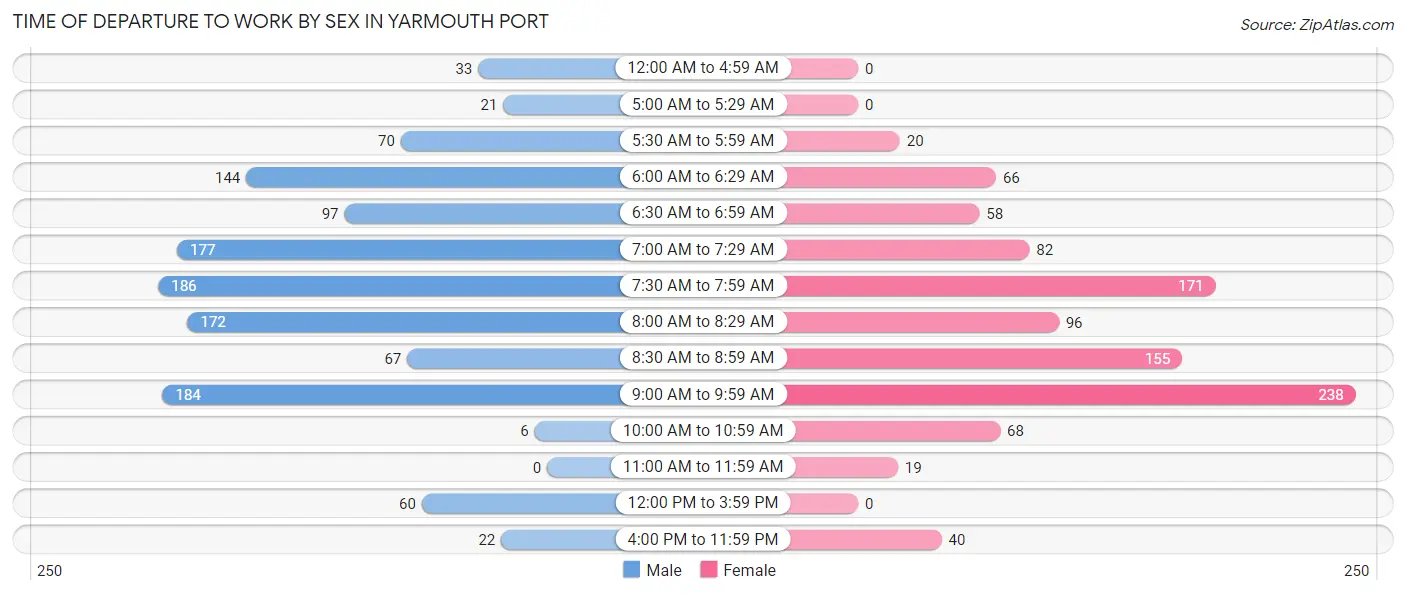
| Time of Departure | Male | Female |
| 12:00 AM to 4:59 AM | 33 (2.7%) | 0 (0.0%) |
| 5:00 AM to 5:29 AM | 21 (1.7%) | 0 (0.0%) |
| 5:30 AM to 5:59 AM | 70 (5.7%) | 20 (2.0%) |
| 6:00 AM to 6:29 AM | 144 (11.6%) | 66 (6.5%) |
| 6:30 AM to 6:59 AM | 97 (7.8%) | 58 (5.7%) |
| 7:00 AM to 7:29 AM | 177 (14.3%) | 82 (8.1%) |
| 7:30 AM to 7:59 AM | 186 (15.0%) | 171 (16.9%) |
| 8:00 AM to 8:29 AM | 172 (13.9%) | 96 (9.5%) |
| 8:30 AM to 8:59 AM | 67 (5.4%) | 155 (15.3%) |
| 9:00 AM to 9:59 AM | 184 (14.8%) | 238 (23.5%) |
| 10:00 AM to 10:59 AM | 6 (0.5%) | 68 (6.7%) |
| 11:00 AM to 11:59 AM | 0 (0.0%) | 19 (1.9%) |
| 12:00 PM to 3:59 PM | 60 (4.8%) | 0 (0.0%) |
| 4:00 PM to 11:59 PM | 22 (1.8%) | 40 (4.0%) |
| Total | 1,239 (100.0%) | 1,013 (100.0%) |
Housing Occupancy in Yarmouth Port
Occupancy by Ownership in Yarmouth Port
Of the total 2,751 dwellings in Yarmouth Port, owner-occupied units account for 2,556 (92.9%), while renter-occupied units make up 195 (7.1%).
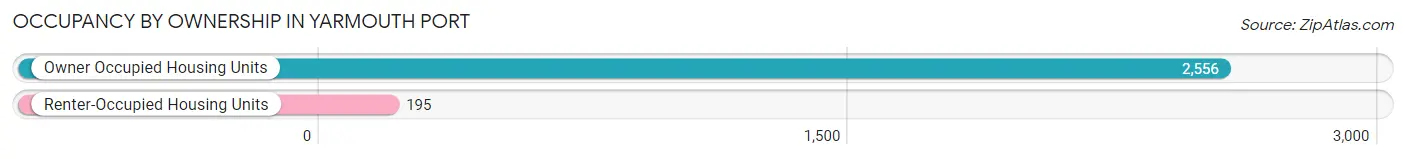
| Occupancy | # Housing Units | % Housing Units |
| Owner Occupied Housing Units | 2,556 | 92.9% |
| Renter-Occupied Housing Units | 195 | 7.1% |
| Total Occupied Housing Units | 2,751 | 100.0% |
Occupancy by Household Size in Yarmouth Port
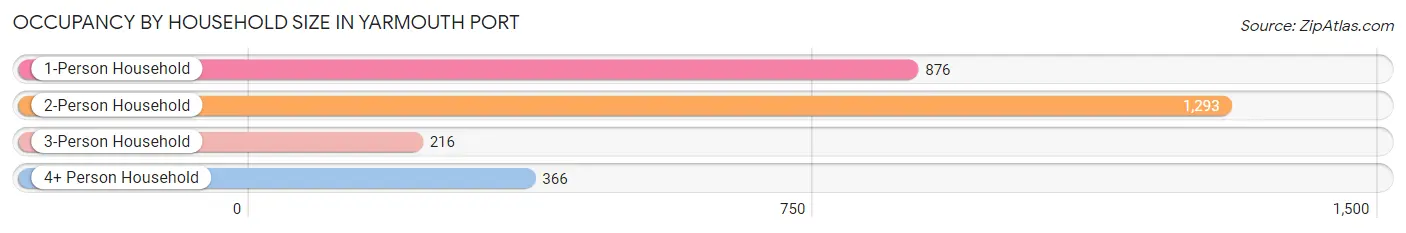
| Household Size | # Housing Units | % Housing Units |
| 1-Person Household | 876 | 31.8% |
| 2-Person Household | 1,293 | 47.0% |
| 3-Person Household | 216 | 7.9% |
| 4+ Person Household | 366 | 13.3% |
| Total Housing Units | 2,751 | 100.0% |
Occupancy by Ownership by Household Size in Yarmouth Port
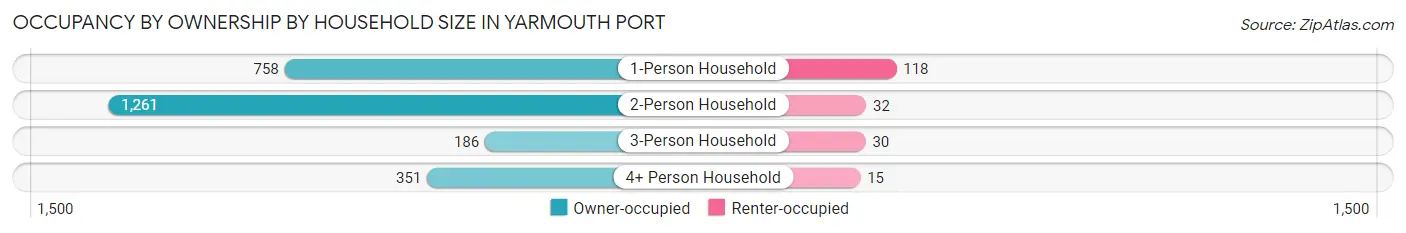
| Household Size | Owner-occupied | Renter-occupied |
| 1-Person Household | 758 (86.5%) | 118 (13.5%) |
| 2-Person Household | 1,261 (97.5%) | 32 (2.5%) |
| 3-Person Household | 186 (86.1%) | 30 (13.9%) |
| 4+ Person Household | 351 (95.9%) | 15 (4.1%) |
| Total Housing Units | 2,556 (92.9%) | 195 (7.1%) |
Occupancy by Educational Attainment in Yarmouth Port
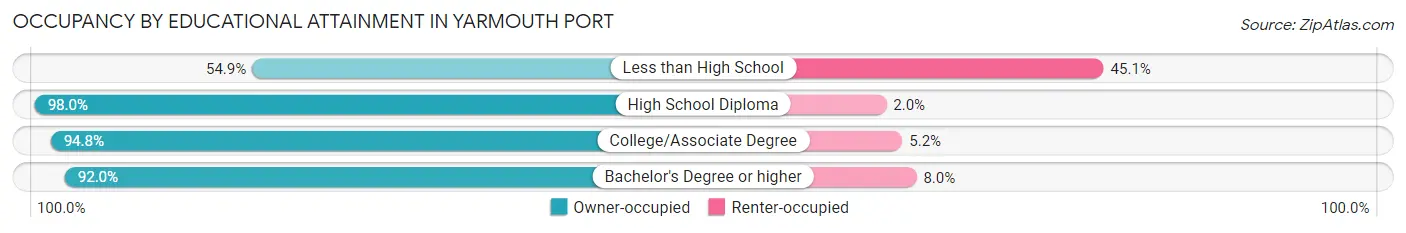
| Household Size | Owner-occupied | Renter-occupied |
| Less than High School | 28 (54.9%) | 23 (45.1%) |
| High School Diploma | 293 (98.0%) | 6 (2.0%) |
| College/Associate Degree | 877 (94.8%) | 48 (5.2%) |
| Bachelor's Degree or higher | 1,358 (92.0%) | 118 (8.0%) |
Occupancy by Age of Householder in Yarmouth Port
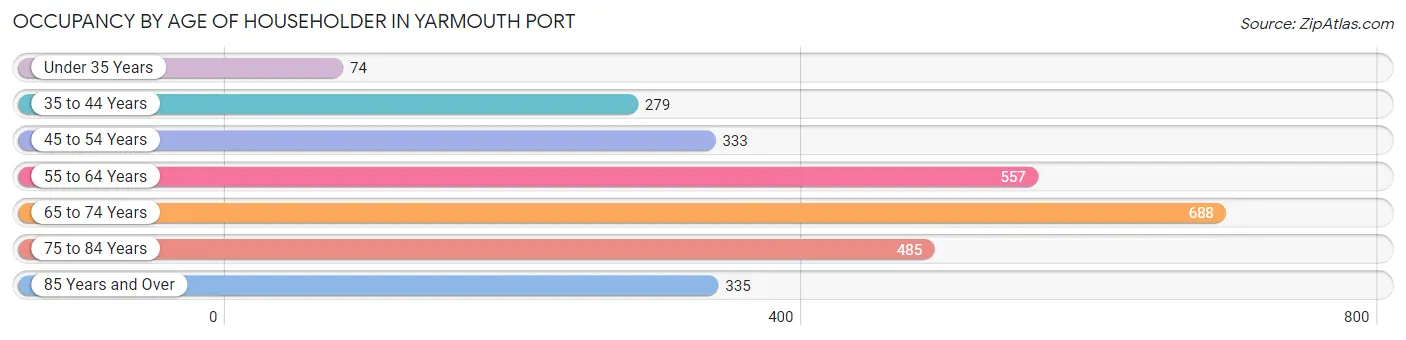
| Age Bracket | # Households | % Households |
| Under 35 Years | 74 | 2.7% |
| 35 to 44 Years | 279 | 10.1% |
| 45 to 54 Years | 333 | 12.1% |
| 55 to 64 Years | 557 | 20.3% |
| 65 to 74 Years | 688 | 25.0% |
| 75 to 84 Years | 485 | 17.6% |
| 85 Years and Over | 335 | 12.2% |
| Total | 2,751 | 100.0% |
Housing Finances in Yarmouth Port
Median Income by Occupancy in Yarmouth Port
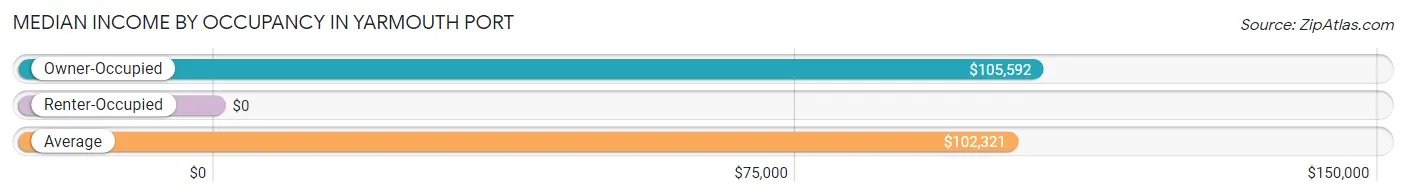
| Occupancy Type | # Households | Median Income |
| Owner-Occupied | 2,556 (92.9%) | $105,592 |
| Renter-Occupied | 195 (7.1%) | $0 |
| Average | 2,751 (100.0%) | $102,321 |
Occupancy by Householder Income Bracket in Yarmouth Port
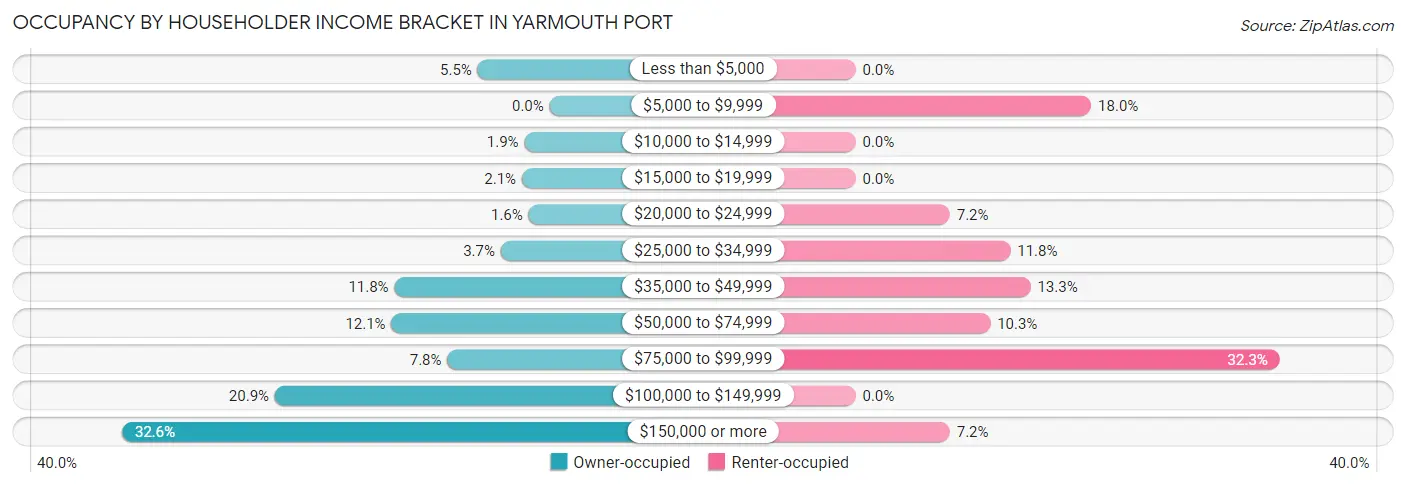
| Income Bracket | Owner-occupied | Renter-occupied |
| Less than $5,000 | 140 (5.5%) | 0 (0.0%) |
| $5,000 to $9,999 | 0 (0.0%) | 35 (17.9%) |
| $10,000 to $14,999 | 49 (1.9%) | 0 (0.0%) |
| $15,000 to $19,999 | 54 (2.1%) | 0 (0.0%) |
| $20,000 to $24,999 | 41 (1.6%) | 14 (7.2%) |
| $25,000 to $34,999 | 95 (3.7%) | 23 (11.8%) |
| $35,000 to $49,999 | 302 (11.8%) | 26 (13.3%) |
| $50,000 to $74,999 | 308 (12.0%) | 20 (10.3%) |
| $75,000 to $99,999 | 199 (7.8%) | 63 (32.3%) |
| $100,000 to $149,999 | 535 (20.9%) | 0 (0.0%) |
| $150,000 or more | 833 (32.6%) | 14 (7.2%) |
| Total | 2,556 (100.0%) | 195 (100.0%) |
Monthly Housing Cost Tiers in Yarmouth Port
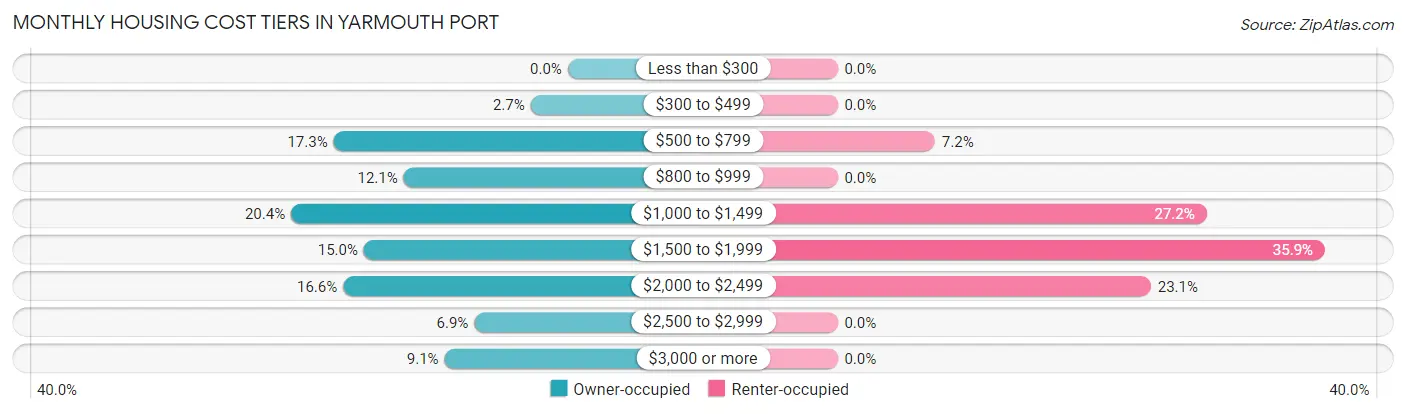
| Monthly Cost | Owner-occupied | Renter-occupied |
| Less than $300 | 0 (0.0%) | 0 (0.0%) |
| $300 to $499 | 70 (2.7%) | 0 (0.0%) |
| $500 to $799 | 441 (17.2%) | 14 (7.2%) |
| $800 to $999 | 309 (12.1%) | 0 (0.0%) |
| $1,000 to $1,499 | 521 (20.4%) | 53 (27.2%) |
| $1,500 to $1,999 | 384 (15.0%) | 70 (35.9%) |
| $2,000 to $2,499 | 423 (16.6%) | 45 (23.1%) |
| $2,500 to $2,999 | 176 (6.9%) | 0 (0.0%) |
| $3,000 or more | 232 (9.1%) | 0 (0.0%) |
| Total | 2,556 (100.0%) | 195 (100.0%) |
Physical Housing Characteristics in Yarmouth Port
Housing Structures in Yarmouth Port
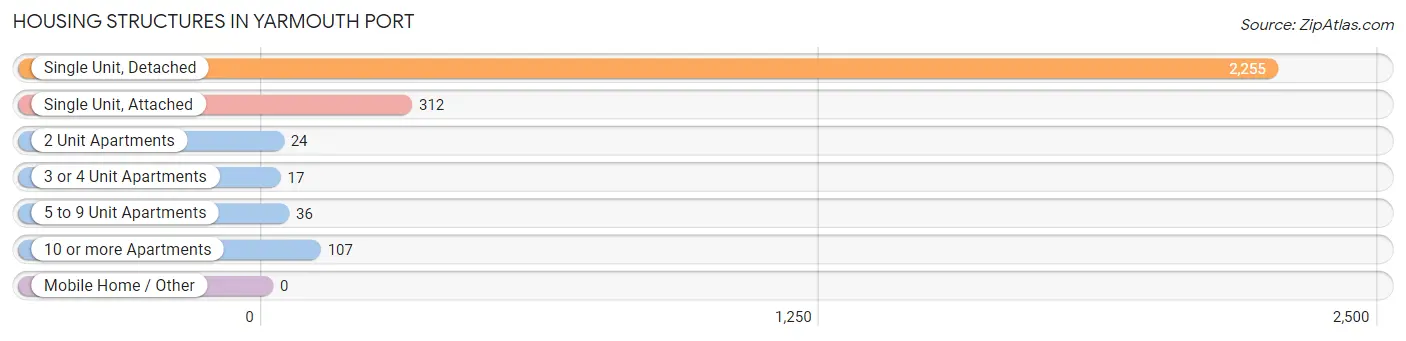
| Structure Type | # Housing Units | % Housing Units |
| Single Unit, Detached | 2,255 | 82.0% |
| Single Unit, Attached | 312 | 11.3% |
| 2 Unit Apartments | 24 | 0.9% |
| 3 or 4 Unit Apartments | 17 | 0.6% |
| 5 to 9 Unit Apartments | 36 | 1.3% |
| 10 or more Apartments | 107 | 3.9% |
| Mobile Home / Other | 0 | 0.0% |
| Total | 2,751 | 100.0% |
Housing Structures by Occupancy in Yarmouth Port
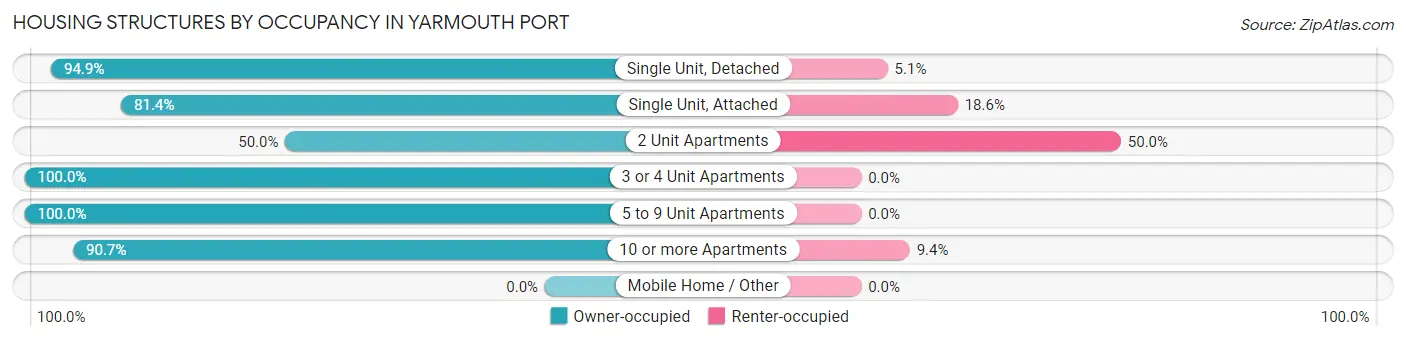
| Structure Type | Owner-occupied | Renter-occupied |
| Single Unit, Detached | 2,140 (94.9%) | 115 (5.1%) |
| Single Unit, Attached | 254 (81.4%) | 58 (18.6%) |
| 2 Unit Apartments | 12 (50.0%) | 12 (50.0%) |
| 3 or 4 Unit Apartments | 17 (100.0%) | 0 (0.0%) |
| 5 to 9 Unit Apartments | 36 (100.0%) | 0 (0.0%) |
| 10 or more Apartments | 97 (90.6%) | 10 (9.3%) |
| Mobile Home / Other | 0 (0.0%) | 0 (0.0%) |
| Total | 2,556 (92.9%) | 195 (7.1%) |
Housing Structures by Number of Rooms in Yarmouth Port
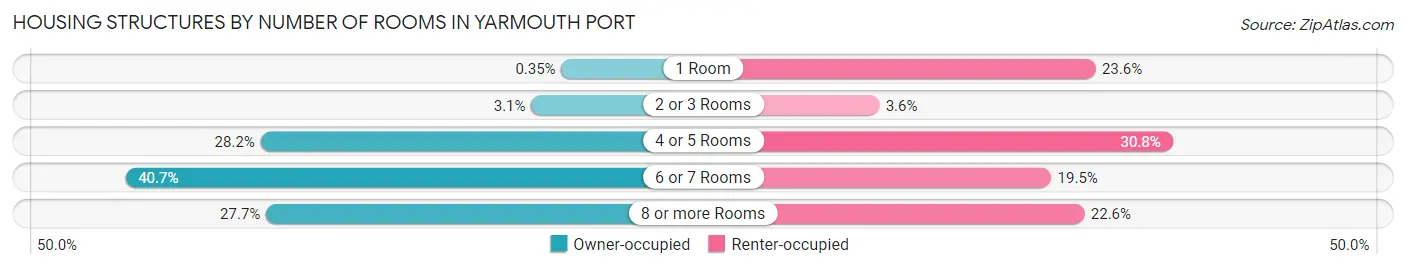
| Number of Rooms | Owner-occupied | Renter-occupied |
| 1 Room | 9 (0.4%) | 46 (23.6%) |
| 2 or 3 Rooms | 80 (3.1%) | 7 (3.6%) |
| 4 or 5 Rooms | 720 (28.2%) | 60 (30.8%) |
| 6 or 7 Rooms | 1,040 (40.7%) | 38 (19.5%) |
| 8 or more Rooms | 707 (27.7%) | 44 (22.6%) |
| Total | 2,556 (100.0%) | 195 (100.0%) |
Housing Structure by Heating Type in Yarmouth Port
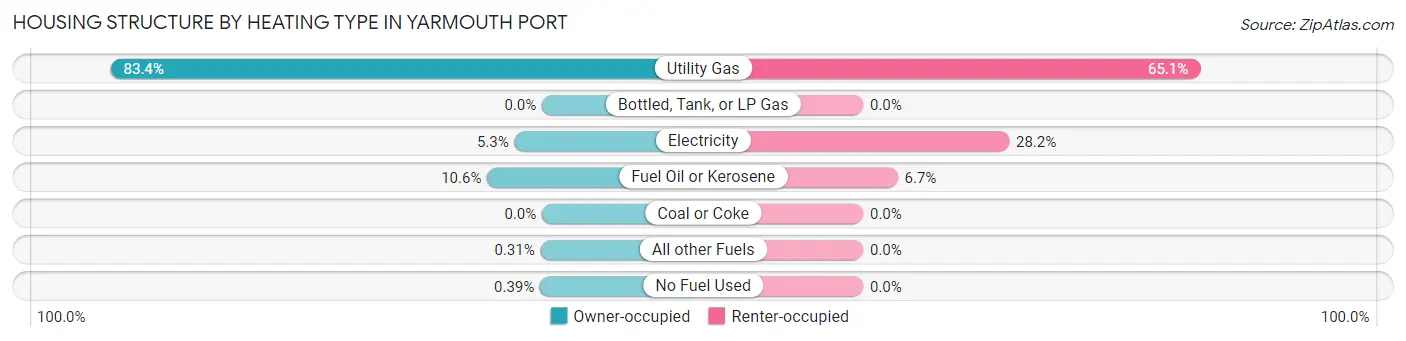
| Heating Type | Owner-occupied | Renter-occupied |
| Utility Gas | 2,131 (83.4%) | 127 (65.1%) |
| Bottled, Tank, or LP Gas | 0 (0.0%) | 0 (0.0%) |
| Electricity | 136 (5.3%) | 55 (28.2%) |
| Fuel Oil or Kerosene | 271 (10.6%) | 13 (6.7%) |
| Coal or Coke | 0 (0.0%) | 0 (0.0%) |
| All other Fuels | 8 (0.3%) | 0 (0.0%) |
| No Fuel Used | 10 (0.4%) | 0 (0.0%) |
| Total | 2,556 (100.0%) | 195 (100.0%) |
Household Vehicle Usage in Yarmouth Port
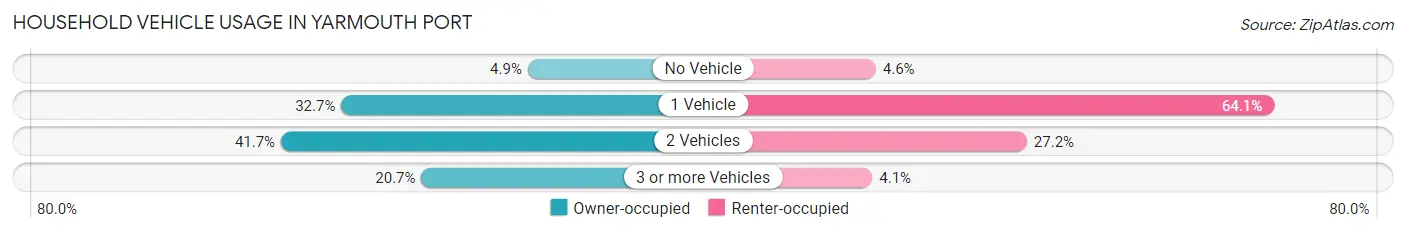
| Vehicles per Household | Owner-occupied | Renter-occupied |
| No Vehicle | 124 (4.9%) | 9 (4.6%) |
| 1 Vehicle | 836 (32.7%) | 125 (64.1%) |
| 2 Vehicles | 1,066 (41.7%) | 53 (27.2%) |
| 3 or more Vehicles | 530 (20.7%) | 8 (4.1%) |
| Total | 2,556 (100.0%) | 195 (100.0%) |
Real Estate & Mortgages in Yarmouth Port
Real Estate and Mortgage Overview in Yarmouth Port
| Characteristic | Without Mortgage | With Mortgage |
| Housing Units | 1,253 | 1,303 |
| Median Property Value | $478,100 | $494,800 |
| Median Household Income | $94,083 | $502 |
| Monthly Housing Costs | $888 | $232 |
| Real Estate Taxes | $4,284 | $12 |
Property Value by Mortgage Status in Yarmouth Port
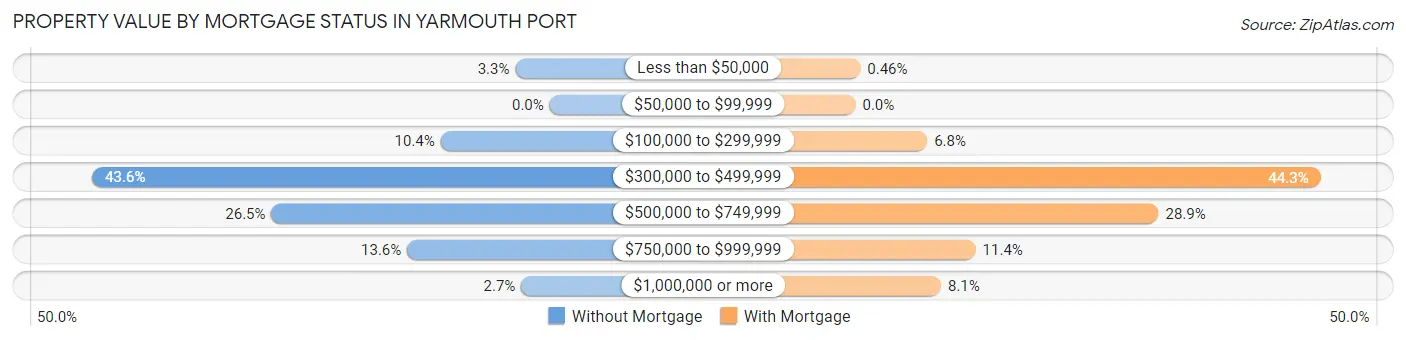
| Property Value | Without Mortgage | With Mortgage |
| Less than $50,000 | 41 (3.3%) | 6 (0.5%) |
| $50,000 to $99,999 | 0 (0.0%) | 0 (0.0%) |
| $100,000 to $299,999 | 130 (10.4%) | 89 (6.8%) |
| $300,000 to $499,999 | 546 (43.6%) | 577 (44.3%) |
| $500,000 to $749,999 | 332 (26.5%) | 376 (28.9%) |
| $750,000 to $999,999 | 170 (13.6%) | 149 (11.4%) |
| $1,000,000 or more | 34 (2.7%) | 106 (8.1%) |
| Total | 1,253 (100.0%) | 1,303 (100.0%) |
Household Income by Mortgage Status in Yarmouth Port
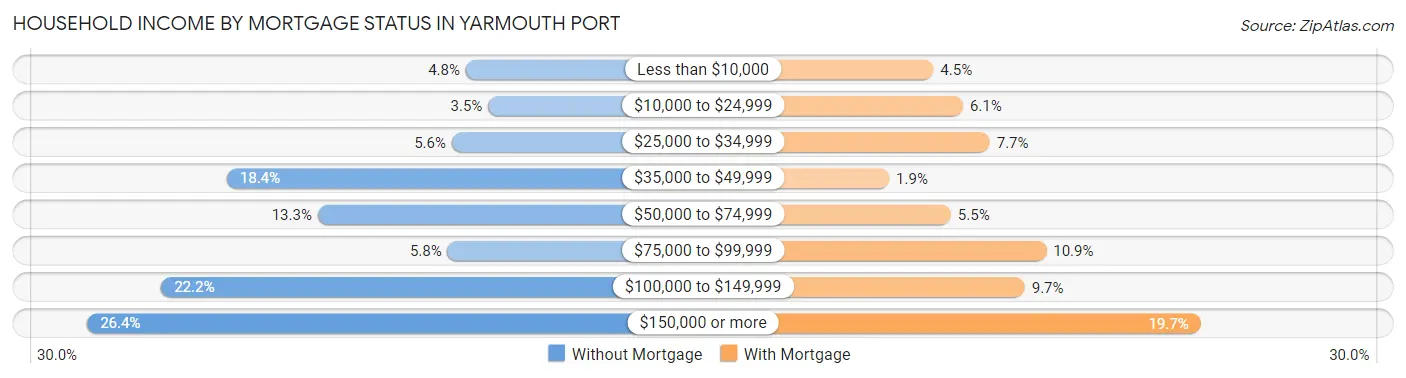
| Household Income | Without Mortgage | With Mortgage |
| Less than $10,000 | 60 (4.8%) | 58 (4.4%) |
| $10,000 to $24,999 | 44 (3.5%) | 80 (6.1%) |
| $25,000 to $34,999 | 70 (5.6%) | 100 (7.7%) |
| $35,000 to $49,999 | 231 (18.4%) | 25 (1.9%) |
| $50,000 to $74,999 | 166 (13.3%) | 71 (5.4%) |
| $75,000 to $99,999 | 73 (5.8%) | 142 (10.9%) |
| $100,000 to $149,999 | 278 (22.2%) | 126 (9.7%) |
| $150,000 or more | 331 (26.4%) | 257 (19.7%) |
| Total | 1,253 (100.0%) | 1,303 (100.0%) |
Property Value to Household Income Ratio in Yarmouth Port
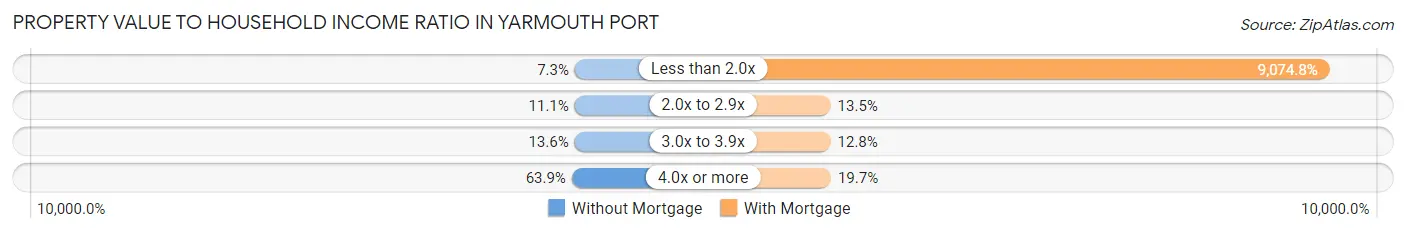
| Value-to-Income Ratio | Without Mortgage | With Mortgage |
| Less than 2.0x | 92 (7.3%) | 118,244 (9,074.8%) |
| 2.0x to 2.9x | 139 (11.1%) | 176 (13.5%) |
| 3.0x to 3.9x | 170 (13.6%) | 167 (12.8%) |
| 4.0x or more | 801 (63.9%) | 256 (19.7%) |
| Total | 1,253 (100.0%) | 1,303 (100.0%) |
Real Estate Taxes by Mortgage Status in Yarmouth Port

| Property Taxes | Without Mortgage | With Mortgage |
| Less than $800 | 16 (1.3%) | 47 (3.6%) |
| $800 to $1,499 | 65 (5.2%) | 6 (0.5%) |
| $800 to $1,499 | 1,172 (93.5%) | 76 (5.8%) |
| Total | 1,253 (100.0%) | 1,303 (100.0%) |
Health & Disability in Yarmouth Port
Health Insurance Coverage by Age in Yarmouth Port
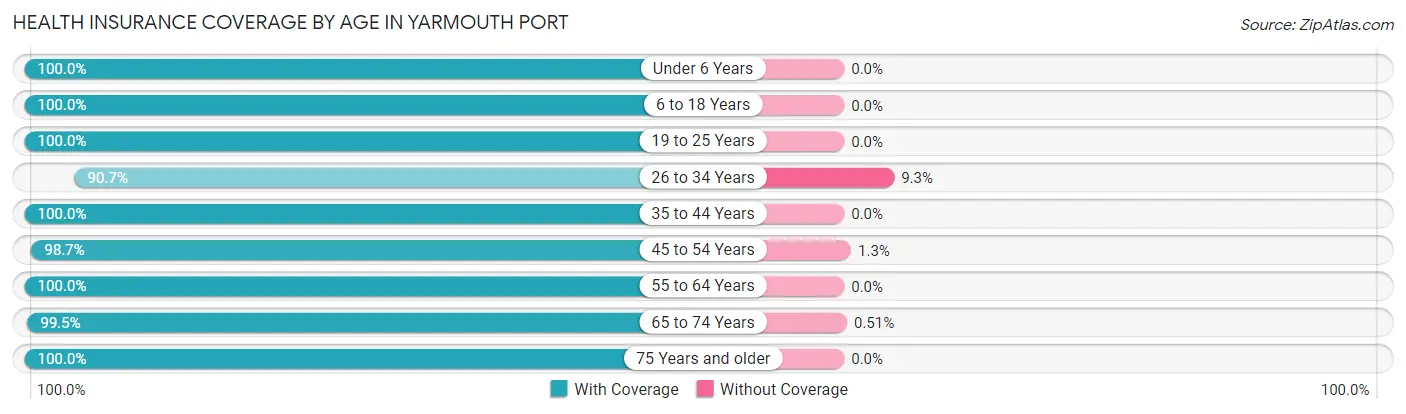
| Age Bracket | With Coverage | Without Coverage |
| Under 6 Years | 253 (100.0%) | 0 (0.0%) |
| 6 to 18 Years | 486 (100.0%) | 0 (0.0%) |
| 19 to 25 Years | 339 (100.0%) | 0 (0.0%) |
| 26 to 34 Years | 302 (90.7%) | 31 (9.3%) |
| 35 to 44 Years | 534 (100.0%) | 0 (0.0%) |
| 45 to 54 Years | 546 (98.7%) | 7 (1.3%) |
| 55 to 64 Years | 1,037 (100.0%) | 0 (0.0%) |
| 65 to 74 Years | 1,169 (99.5%) | 6 (0.5%) |
| 75 Years and older | 1,261 (100.0%) | 0 (0.0%) |
| Total | 5,927 (99.3%) | 44 (0.7%) |
Health Insurance Coverage by Citizenship Status in Yarmouth Port
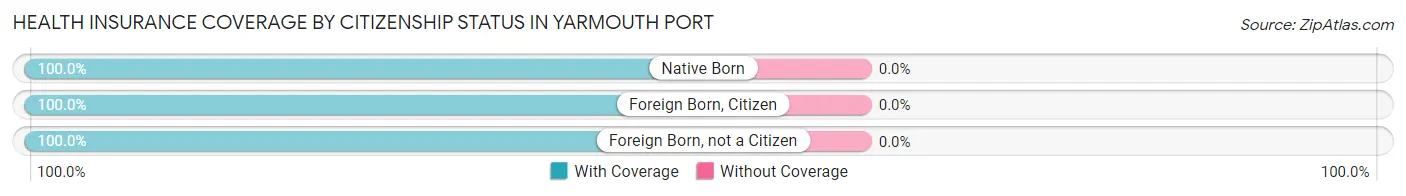
| Citizenship Status | With Coverage | Without Coverage |
| Native Born | 253 (100.0%) | 0 (0.0%) |
| Foreign Born, Citizen | 486 (100.0%) | 0 (0.0%) |
| Foreign Born, not a Citizen | 339 (100.0%) | 0 (0.0%) |
Health Insurance Coverage by Household Income in Yarmouth Port
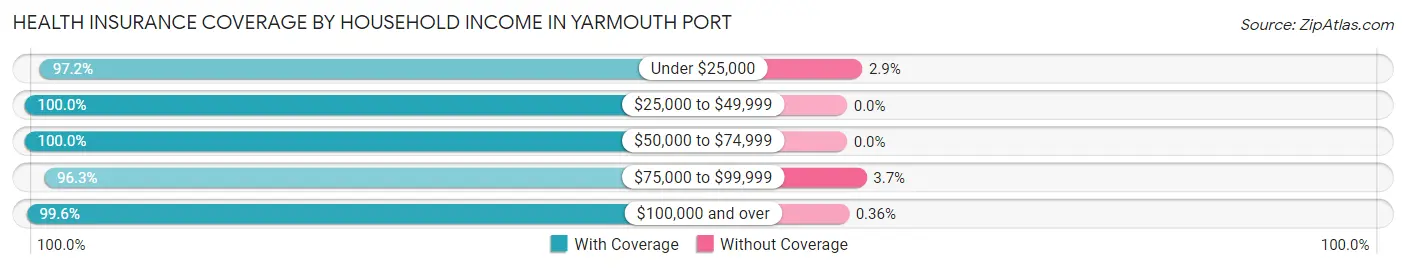
| Household Income | With Coverage | Without Coverage |
| Under $25,000 | 478 (97.2%) | 14 (2.9%) |
| $25,000 to $49,999 | 655 (100.0%) | 0 (0.0%) |
| $50,000 to $74,999 | 701 (100.0%) | 0 (0.0%) |
| $75,000 to $99,999 | 446 (96.3%) | 17 (3.7%) |
| $100,000 and over | 3,645 (99.6%) | 13 (0.4%) |
Public vs Private Health Insurance Coverage by Age in Yarmouth Port
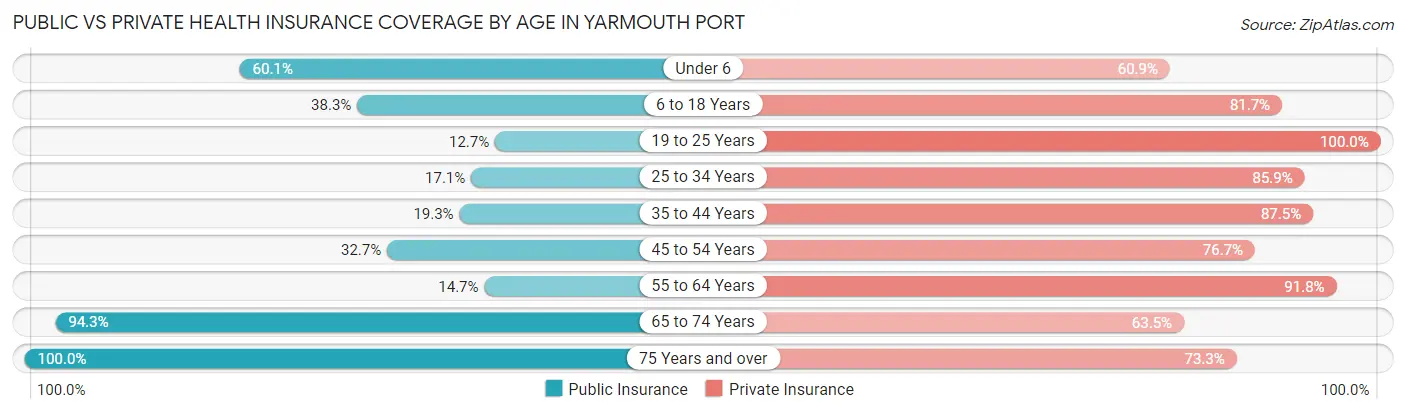
| Age Bracket | Public Insurance | Private Insurance |
| Under 6 | 152 (60.1%) | 154 (60.9%) |
| 6 to 18 Years | 186 (38.3%) | 397 (81.7%) |
| 19 to 25 Years | 43 (12.7%) | 339 (100.0%) |
| 25 to 34 Years | 57 (17.1%) | 286 (85.9%) |
| 35 to 44 Years | 103 (19.3%) | 467 (87.5%) |
| 45 to 54 Years | 181 (32.7%) | 424 (76.7%) |
| 55 to 64 Years | 152 (14.7%) | 952 (91.8%) |
| 65 to 74 Years | 1,108 (94.3%) | 746 (63.5%) |
| 75 Years and over | 1,261 (100.0%) | 924 (73.3%) |
| Total | 3,243 (54.3%) | 4,689 (78.5%) |
Disability Status by Sex by Age in Yarmouth Port
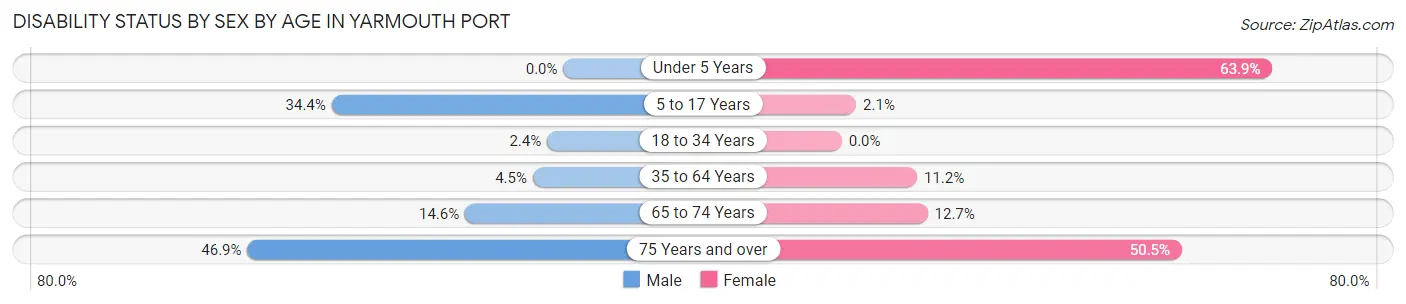
| Age Bracket | Male | Female |
| Under 5 Years | 0 (0.0%) | 39 (63.9%) |
| 5 to 17 Years | 96 (34.4%) | 6 (2.1%) |
| 18 to 34 Years | 10 (2.4%) | 0 (0.0%) |
| 35 to 64 Years | 44 (4.5%) | 129 (11.2%) |
| 65 to 74 Years | 73 (14.6%) | 86 (12.7%) |
| 75 Years and over | 259 (46.9%) | 358 (50.5%) |
Disability Class by Sex by Age in Yarmouth Port
Disability Class: Hearing Difficulty
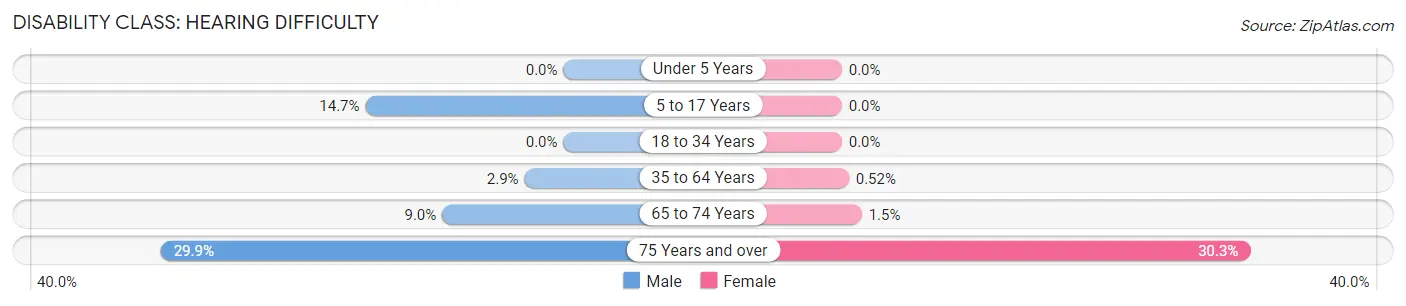
| Age Bracket | Male | Female |
| Under 5 Years | 0 (0.0%) | 0 (0.0%) |
| 5 to 17 Years | 41 (14.7%) | 0 (0.0%) |
| 18 to 34 Years | 0 (0.0%) | 0 (0.0%) |
| 35 to 64 Years | 28 (2.9%) | 6 (0.5%) |
| 65 to 74 Years | 45 (9.0%) | 10 (1.5%) |
| 75 Years and over | 165 (29.9%) | 215 (30.3%) |
Disability Class: Vision Difficulty
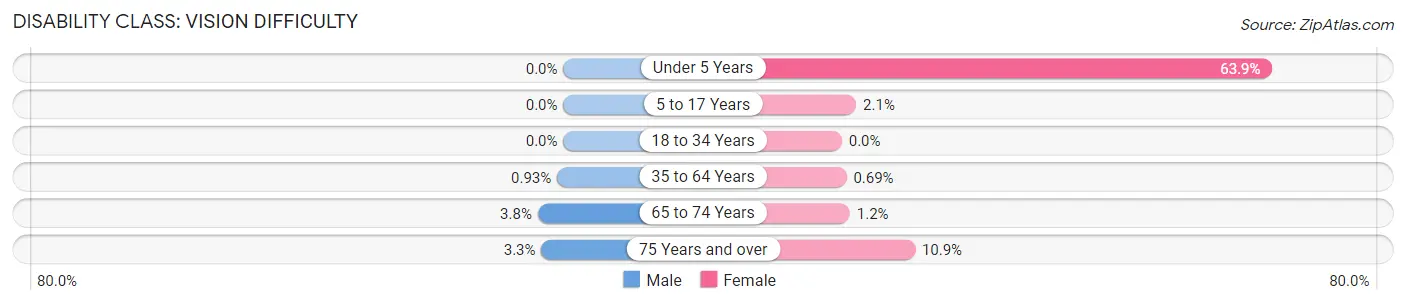
| Age Bracket | Male | Female |
| Under 5 Years | 0 (0.0%) | 39 (63.9%) |
| 5 to 17 Years | 0 (0.0%) | 6 (2.1%) |
| 18 to 34 Years | 0 (0.0%) | 0 (0.0%) |
| 35 to 64 Years | 9 (0.9%) | 8 (0.7%) |
| 65 to 74 Years | 19 (3.8%) | 8 (1.2%) |
| 75 Years and over | 18 (3.3%) | 77 (10.9%) |
Disability Class: Cognitive Difficulty
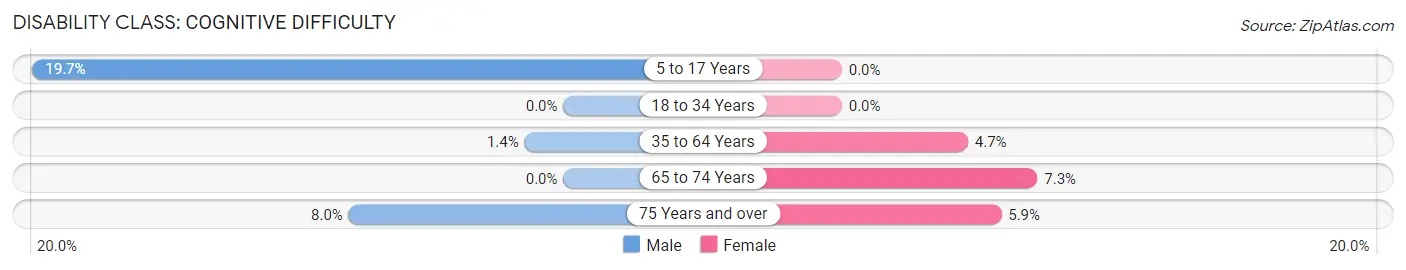
| Age Bracket | Male | Female |
| 5 to 17 Years | 55 (19.7%) | 0 (0.0%) |
| 18 to 34 Years | 0 (0.0%) | 0 (0.0%) |
| 35 to 64 Years | 14 (1.4%) | 54 (4.7%) |
| 65 to 74 Years | 0 (0.0%) | 49 (7.3%) |
| 75 Years and over | 44 (8.0%) | 42 (5.9%) |
Disability Class: Ambulatory Difficulty
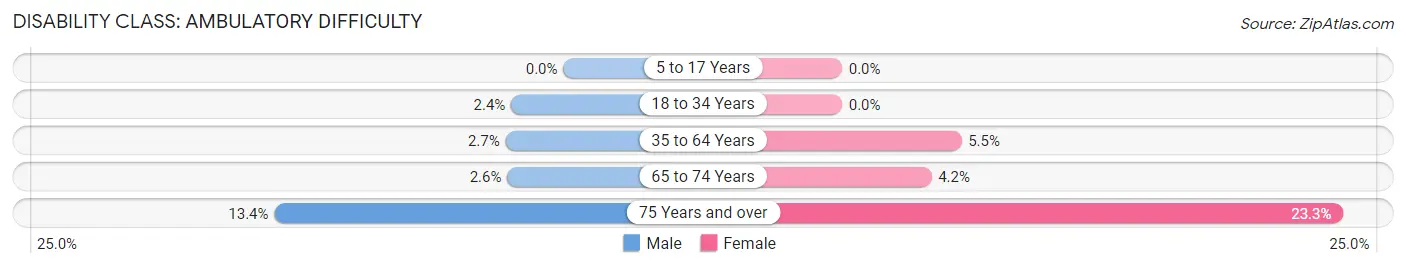
| Age Bracket | Male | Female |
| 5 to 17 Years | 0 (0.0%) | 0 (0.0%) |
| 18 to 34 Years | 10 (2.4%) | 0 (0.0%) |
| 35 to 64 Years | 26 (2.7%) | 64 (5.5%) |
| 65 to 74 Years | 13 (2.6%) | 28 (4.2%) |
| 75 Years and over | 74 (13.4%) | 165 (23.3%) |
Disability Class: Self-Care Difficulty
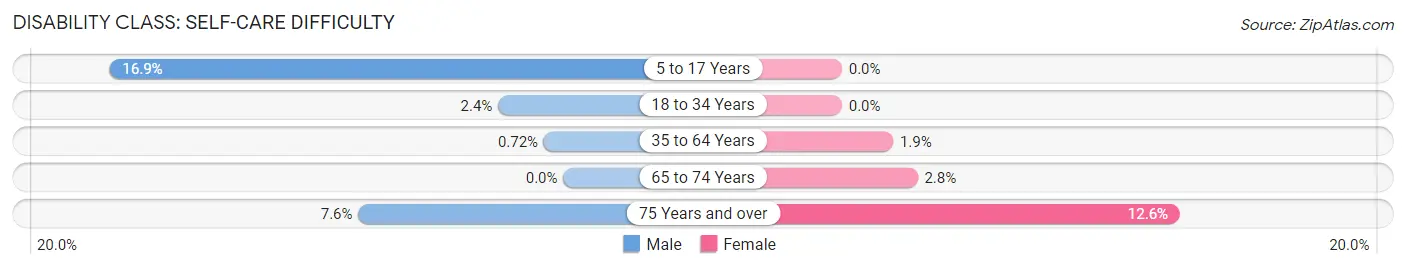
| Age Bracket | Male | Female |
| 5 to 17 Years | 47 (16.9%) | 0 (0.0%) |
| 18 to 34 Years | 10 (2.4%) | 0 (0.0%) |
| 35 to 64 Years | 7 (0.7%) | 22 (1.9%) |
| 65 to 74 Years | 0 (0.0%) | 19 (2.8%) |
| 75 Years and over | 42 (7.6%) | 89 (12.6%) |
Technology Access in Yarmouth Port
Computing Device Access in Yarmouth Port
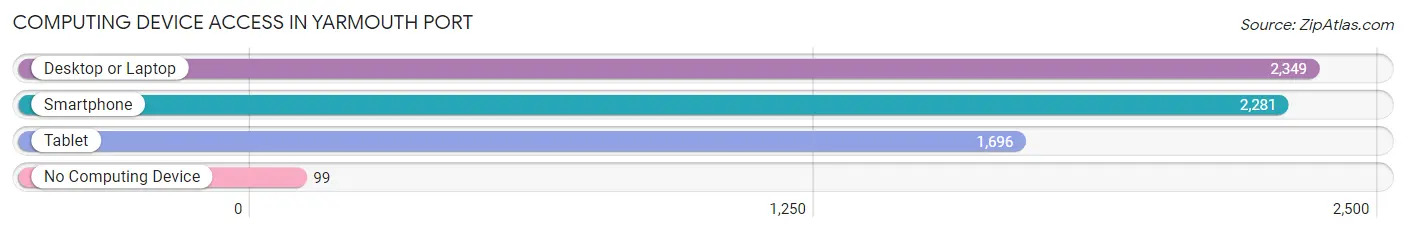
| Device Type | # Households | % Households |
| Desktop or Laptop | 2,349 | 85.4% |
| Smartphone | 2,281 | 82.9% |
| Tablet | 1,696 | 61.7% |
| No Computing Device | 99 | 3.6% |
| Total | 2,751 | 100.0% |
Internet Access in Yarmouth Port
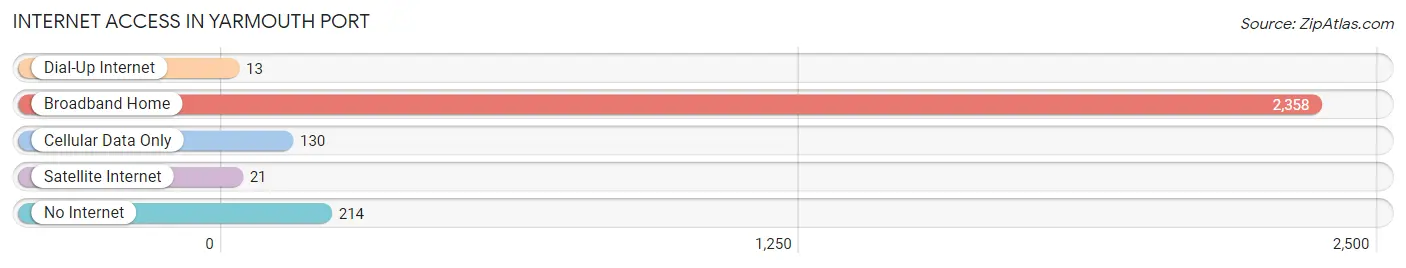
| Internet Type | # Households | % Households |
| Dial-Up Internet | 13 | 0.5% |
| Broadband Home | 2,358 | 85.7% |
| Cellular Data Only | 130 | 4.7% |
| Satellite Internet | 21 | 0.8% |
| No Internet | 214 | 7.8% |
| Total | 2,751 | 100.0% |
Yarmouth Port Summary
Yarmouth Port is a small village located in the town of Yarmouth, Massachusetts, on the south side of Cape Cod. It is a popular tourist destination, known for its quaint New England charm and its proximity to the ocean. The village is home to a variety of shops, restaurants, and other attractions, as well as a number of historic sites.
Geography
Yarmouth Port is located in the southeastern corner of the town of Yarmouth, Massachusetts, on the south side of Cape Cod. It is bordered by the towns of Barnstable to the north, Dennis to the east, and Brewster to the south. The village is situated on the banks of the Bass River, which flows into Nantucket Sound. The village is approximately 4 miles from the Atlantic Ocean and is located at an elevation of approximately 10 feet above sea level.
The village is characterized by its rolling hills and wooded areas, as well as its many ponds and streams. The area is also home to a variety of wildlife, including deer, foxes, and a variety of birds.
Economy
Yarmouth Port is a popular tourist destination, and the village’s economy is largely dependent on the tourism industry. The village is home to a variety of shops, restaurants, and other attractions, as well as a number of historic sites. The village is also home to a number of marinas, which provide access to the ocean for fishing and other recreational activities.
The village is also home to a number of businesses, including a number of small businesses, such as antique shops, art galleries, and gift shops. The village is also home to a number of professional services, such as lawyers, accountants, and real estate agents.
Demographics
As of the 2010 census, the population of Yarmouth Port was 2,717. The population is predominantly white, with approximately 95% of the population identifying as white. The median age of the population is 48.7 years, and the median household income is $68,944.
The village is home to a variety of religious denominations, including Catholic, Protestant, and Jewish. The village is also home to a number of educational institutions, including a public elementary school, a private middle school, and a private high school.
History
Yarmouth Port was first settled in 1639 by a group of English settlers. The village was originally known as “Yarmouth”, and was part of the town of Yarmouth. In 1712, the village was officially incorporated as the town of Yarmouth Port.
The village was an important port during the American Revolution, and was the site of a number of naval battles. The village was also an important fishing port, and was home to a number of whaling ships.
In the 19th century, the village became a popular tourist destination, and was home to a number of hotels and resorts. The village was also home to a number of artists and writers, including Henry David Thoreau and Nathaniel Hawthorne.
Today, Yarmouth Port is a popular tourist destination, known for its quaint New England charm and its proximity to the ocean. The village is home to a variety of shops, restaurants, and other attractions, as well as a number of historic sites. The village is also home to a number of businesses, including a number of small businesses, such as antique shops, art galleries, and gift shops.
Common Questions
What is Per Capita Income in Yarmouth Port?
Per Capita income in Yarmouth Port is $62,228.
What is the Median Family Income in Yarmouth Port?
Median Family Income in Yarmouth Port is $124,873.
What is the Median Household income in Yarmouth Port?
Median Household Income in Yarmouth Port is $102,321.
What is Income or Wage Gap in Yarmouth Port?
Income or Wage Gap in Yarmouth Port is 6.0%.
Women in Yarmouth Port earn 94.0 cents for every dollar earned by a man.
What is Inequality or Gini Index in Yarmouth Port?
Inequality or Gini Index in Yarmouth Port is 0.49.
What is the Total Population of Yarmouth Port?
Total Population of Yarmouth Port is 5,971.
What is the Total Male Population of Yarmouth Port?
Total Male Population of Yarmouth Port is 2,821.
What is the Total Female Population of Yarmouth Port?
Total Female Population of Yarmouth Port is 3,150.
What is the Ratio of Males per 100 Females in Yarmouth Port?
There are 89.56 Males per 100 Females in Yarmouth Port.
What is the Ratio of Females per 100 Males in Yarmouth Port?
There are 111.66 Females per 100 Males in Yarmouth Port.
What is the Median Population Age in Yarmouth Port?
Median Population Age in Yarmouth Port is 59.7 Years.
What is the Average Family Size in Yarmouth Port
Average Family Size in Yarmouth Port is 2.7 People.
What is the Average Household Size in Yarmouth Port
Average Household Size in Yarmouth Port is 2.2 People.
How Large is the Labor Force in Yarmouth Port?
There are 2,841 People in the Labor Forcein in Yarmouth Port.
What is the Percentage of People in the Labor Force in Yarmouth Port?
52.2% of People are in the Labor Force in Yarmouth Port.
What is the Unemployment Rate in Yarmouth Port?
Unemployment Rate in Yarmouth Port is 2.0%.