Chatham, MA Map & Demographics
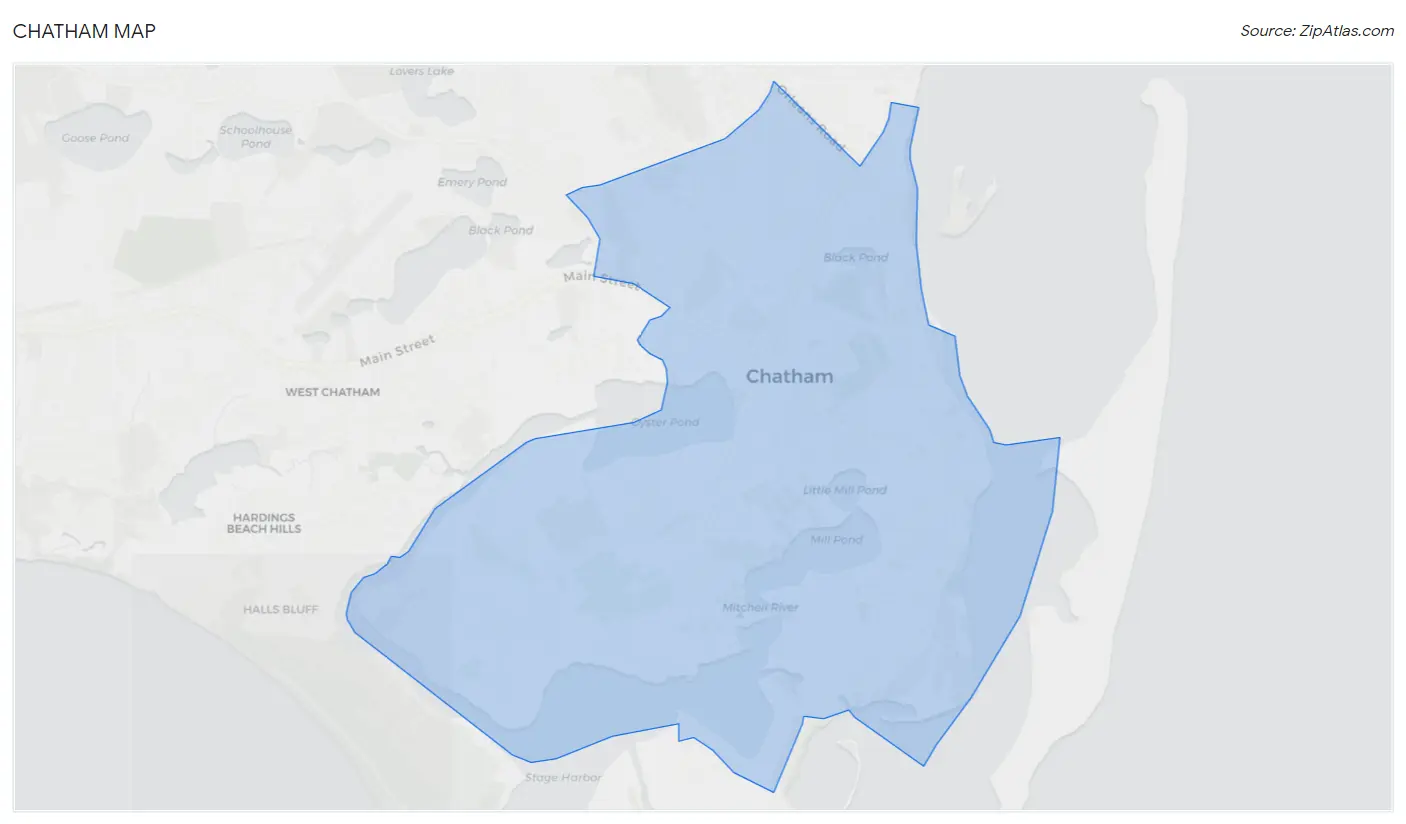
Chatham Map
Chatham Overview
$88,295
PER CAPITA INCOME
$122,214
AVG FAMILY INCOME
$84,554
AVG HOUSEHOLD INCOME
38.7%
WAGE / INCOME GAP [ % ]
61.3¢/ $1
WAGE / INCOME GAP [ $ ]
0.50
INEQUALITY / GINI INDEX
1,637
TOTAL POPULATION
783
MALE POPULATION
854
FEMALE POPULATION
91.69
MALES / 100 FEMALES
109.07
FEMALES / 100 MALES
67.8
MEDIAN AGE
2.3
AVG FAMILY SIZE
1.8
AVG HOUSEHOLD SIZE
549
LABOR FORCE [ PEOPLE ]
34.3%
PERCENT IN LABOR FORCE
8.6%
UNEMPLOYMENT RATE
Chatham Zip Codes
Income in Chatham
Income Overview in Chatham
Per Capita Income in Chatham is $88,295, while median incomes of families and households are $122,214 and $84,554 respectively.
| Characteristic | Number | Measure |
| Per Capita Income | 1,637 | $88,295 |
| Median Family Income | 478 | $122,214 |
| Mean Family Income | 478 | $208,852 |
| Median Household Income | 915 | $84,554 |
| Mean Household Income | 915 | $155,400 |
| Income Deficit | 478 | $0 |
| Wage / Income Gap (%) | 1,637 | 38.67% |
| Wage / Income Gap ($) | 1,637 | 61.33¢ per $1 |
| Gini / Inequality Index | 1,637 | 0.50 |
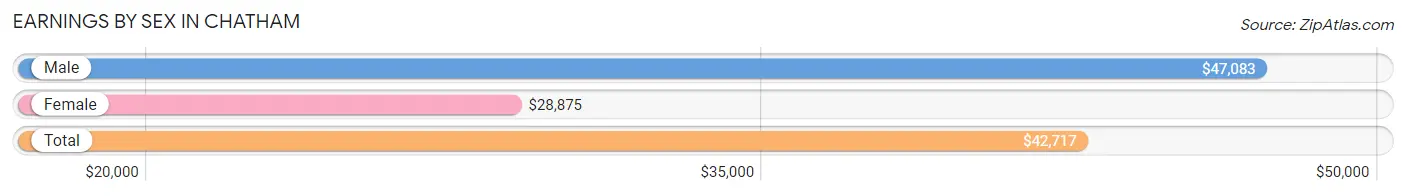
Earnings by Sex in Chatham
Average Earnings in Chatham are $42,717, $47,083 for men and $28,875 for women, a difference of 38.7%.
| Sex | Number | Average Earnings |
| Male | 317 (48.9%) | $47,083 |
| Female | 331 (51.1%) | $28,875 |
| Total | 648 (100.0%) | $42,717 |
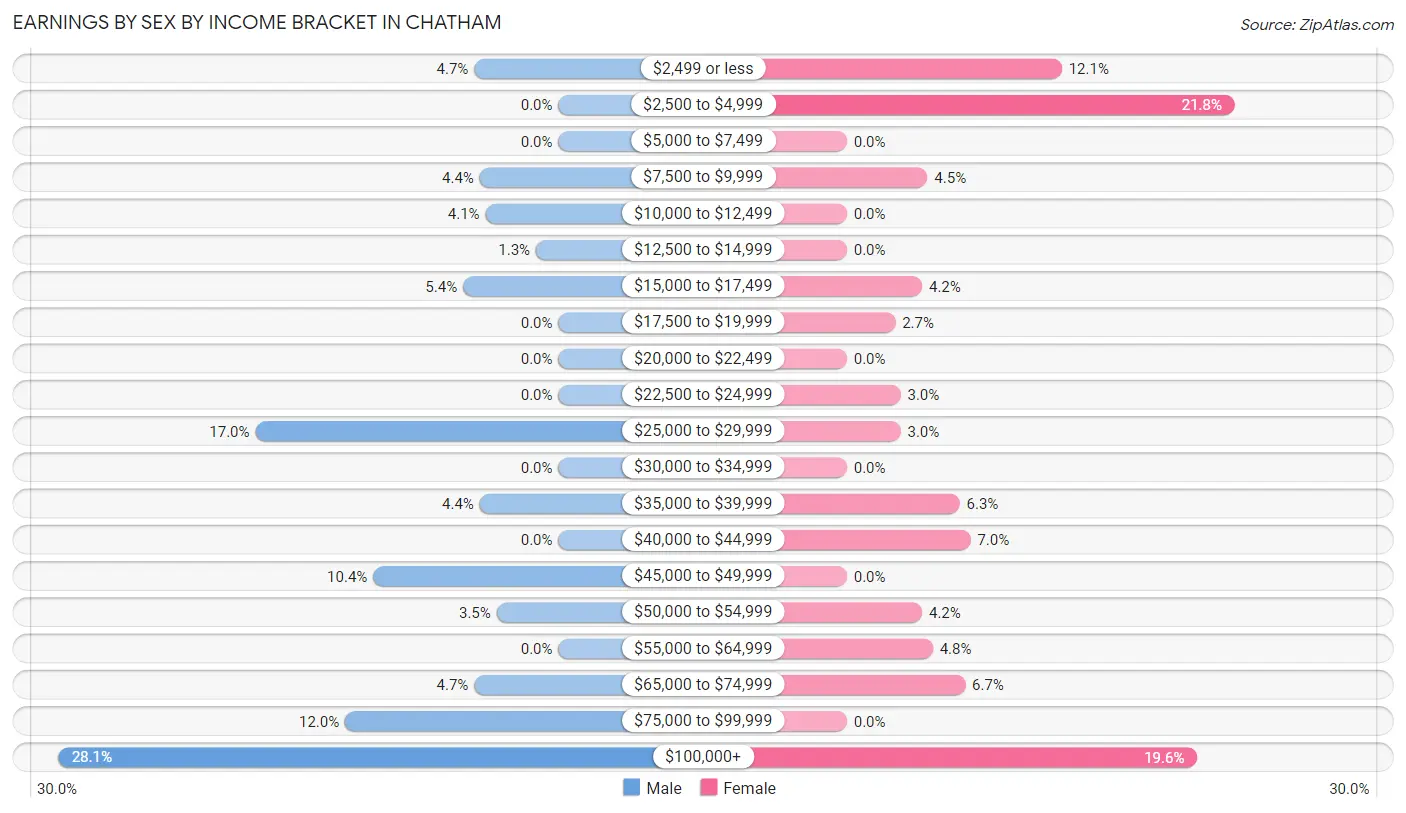
Earnings by Sex by Income Bracket in Chatham
The most common earnings brackets in Chatham are $100,000+ for men (89 | 28.1%) and $2,500 to $4,999 for women (72 | 21.7%).
| Income | Male | Female |
| $2,499 or less | 15 (4.7%) | 40 (12.1%) |
| $2,500 to $4,999 | 0 (0.0%) | 72 (21.7%) |
| $5,000 to $7,499 | 0 (0.0%) | 0 (0.0%) |
| $7,500 to $9,999 | 14 (4.4%) | 15 (4.5%) |
| $10,000 to $12,499 | 13 (4.1%) | 0 (0.0%) |
| $12,500 to $14,999 | 4 (1.3%) | 0 (0.0%) |
| $15,000 to $17,499 | 17 (5.4%) | 14 (4.2%) |
| $17,500 to $19,999 | 0 (0.0%) | 9 (2.7%) |
| $20,000 to $22,499 | 0 (0.0%) | 0 (0.0%) |
| $22,500 to $24,999 | 0 (0.0%) | 10 (3.0%) |
| $25,000 to $29,999 | 54 (17.0%) | 10 (3.0%) |
| $30,000 to $34,999 | 0 (0.0%) | 0 (0.0%) |
| $35,000 to $39,999 | 14 (4.4%) | 21 (6.3%) |
| $40,000 to $44,999 | 0 (0.0%) | 23 (7.0%) |
| $45,000 to $49,999 | 33 (10.4%) | 0 (0.0%) |
| $50,000 to $54,999 | 11 (3.5%) | 14 (4.2%) |
| $55,000 to $64,999 | 0 (0.0%) | 16 (4.8%) |
| $65,000 to $74,999 | 15 (4.7%) | 22 (6.7%) |
| $75,000 to $99,999 | 38 (12.0%) | 0 (0.0%) |
| $100,000+ | 89 (28.1%) | 65 (19.6%) |
| Total | 317 (100.0%) | 331 (100.0%) |
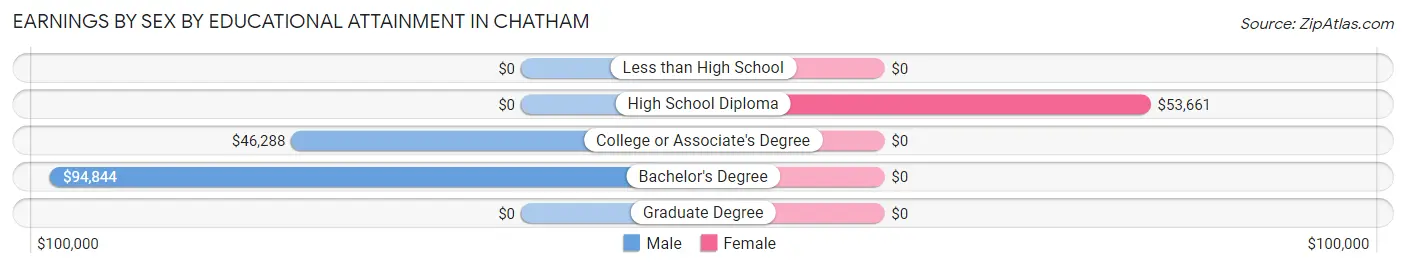
Earnings by Sex by Educational Attainment in Chatham
Average earnings in Chatham are $54,886 for men and $43,098 for women, a difference of 21.5%. Men with an educational attainment of bachelor's degree enjoy the highest average annual earnings of $94,844, while those with college or associate's degree education earn the least with $46,288. Women with an educational attainment of high school diploma earn the most with the average annual earnings of $53,661, while those with high school diploma education have the smallest earnings of $53,661.
| Educational Attainment | Male Income | Female Income |
| Less than High School | - | - |
| High School Diploma | - | - |
| College or Associate's Degree | $46,288 | $0 |
| Bachelor's Degree | $94,844 | $0 |
| Graduate Degree | - | - |
| Total | $54,886 | $43,098 |
Family Income in Chatham
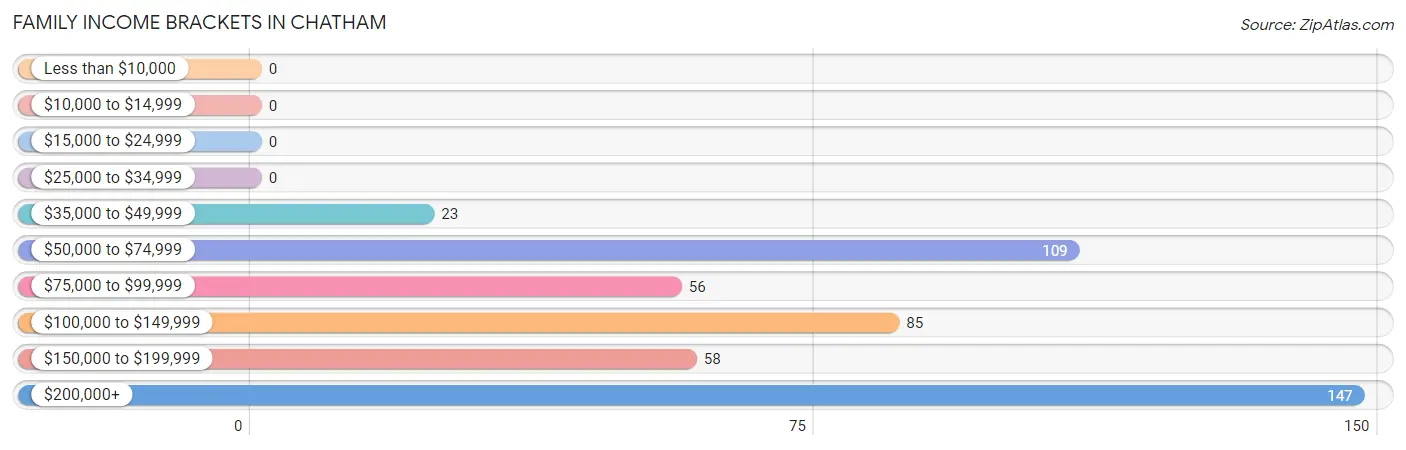
Family Income Brackets in Chatham
According to the Chatham family income data, there are 147 families falling into the $200,000+ income range, which is the most common income bracket and makes up 30.7% of all families.
| Income Bracket | # Families | % Families |
| Less than $10,000 | 0 | 0.0% |
| $10,000 to $14,999 | 0 | 0.0% |
| $15,000 to $24,999 | 0 | 0.0% |
| $25,000 to $34,999 | 0 | 0.0% |
| $35,000 to $49,999 | 23 | 4.8% |
| $50,000 to $74,999 | 109 | 22.8% |
| $75,000 to $99,999 | 56 | 11.7% |
| $100,000 to $149,999 | 85 | 17.8% |
| $150,000 to $199,999 | 58 | 12.1% |
| $200,000+ | 147 | 30.8% |
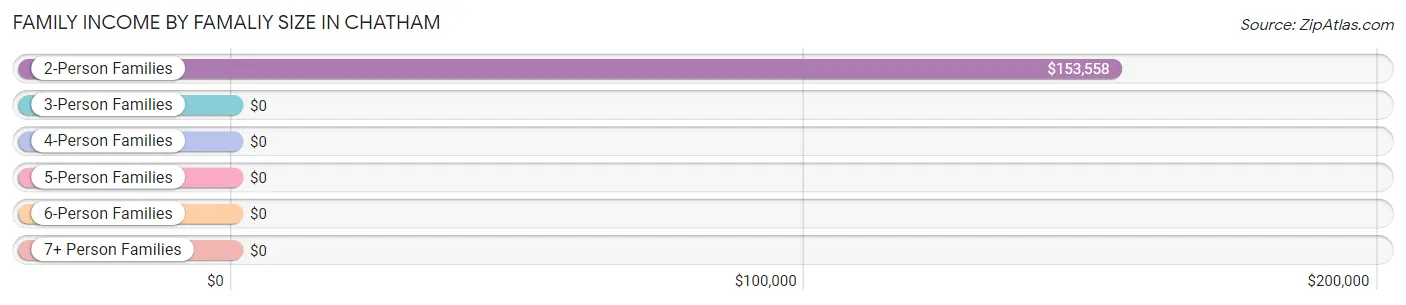
Family Income by Famaliy Size in Chatham
2-person families (399 | 83.5%) account for the highest median family income in Chatham with $153,558 per family, while 2-person families (399 | 83.5%) have the highest median income of $76,779 per family member.
| Income Bracket | # Families | Median Income |
| 2-Person Families | 399 (83.5%) | $153,558 |
| 3-Person Families | 53 (11.1%) | $0 |
| 4-Person Families | 26 (5.4%) | $0 |
| 5-Person Families | 0 (0.0%) | $0 |
| 6-Person Families | 0 (0.0%) | $0 |
| 7+ Person Families | 0 (0.0%) | $0 |
| Total | 478 (100.0%) | $122,214 |
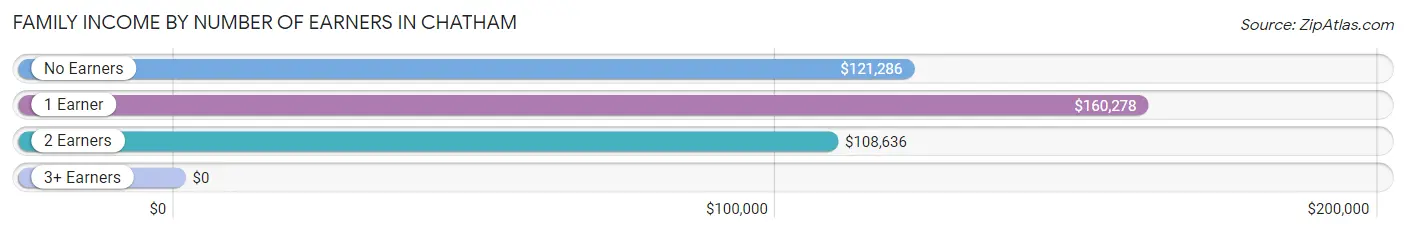
Family Income by Number of Earners in Chatham
| Number of Earners | # Families | Median Income |
| No Earners | 224 (46.9%) | $121,286 |
| 1 Earner | 156 (32.6%) | $160,278 |
| 2 Earners | 88 (18.4%) | $108,636 |
| 3+ Earners | 10 (2.1%) | $0 |
| Total | 478 (100.0%) | $122,214 |
Household Income in Chatham
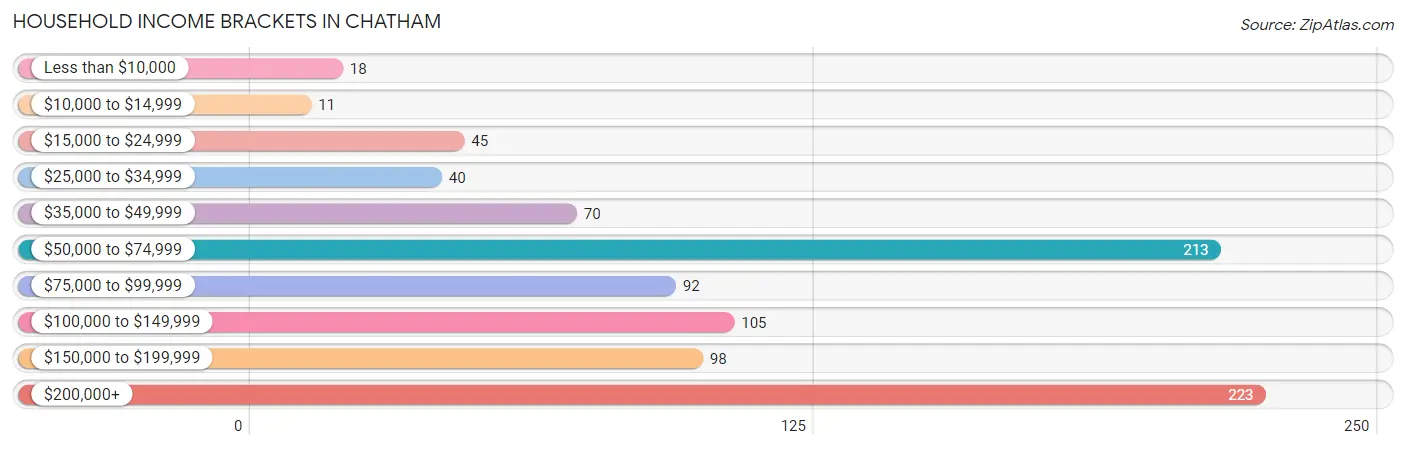
Household Income Brackets in Chatham
With 223 households falling in the category, the $200,000+ income range is the most frequent in Chatham, accounting for 24.4% of all households. In contrast, only 11 households (1.2%) fall into the $10,000 to $14,999 income bracket, making it the least populous group.
| Income Bracket | # Households | % Households |
| Less than $10,000 | 18 | 2.0% |
| $10,000 to $14,999 | 11 | 1.2% |
| $15,000 to $24,999 | 45 | 4.9% |
| $25,000 to $34,999 | 40 | 4.4% |
| $35,000 to $49,999 | 70 | 7.7% |
| $50,000 to $74,999 | 213 | 23.3% |
| $75,000 to $99,999 | 92 | 10.1% |
| $100,000 to $149,999 | 105 | 11.5% |
| $150,000 to $199,999 | 98 | 10.7% |
| $200,000+ | 223 | 24.4% |
Household Income by Householder Age in Chatham
The median household income in Chatham is $84,554, with the highest median household income of $91,389 found in the 45 to 64 years age bracket for the primary householder. A total of 176 households (19.2%) fall into this category.
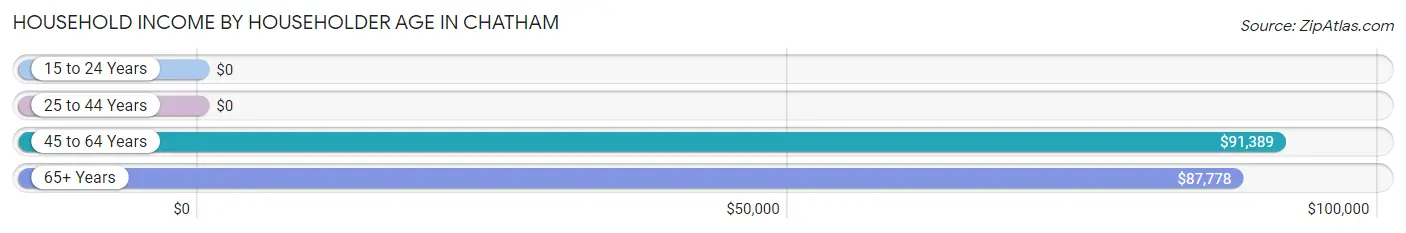
| Income Bracket | # Households | Median Income |
| 15 to 24 Years | 0 (0.0%) | $0 |
| 25 to 44 Years | 95 (10.4%) | $0 |
| 45 to 64 Years | 176 (19.2%) | $91,389 |
| 65+ Years | 644 (70.4%) | $87,778 |
| Total | 915 (100.0%) | $84,554 |
Poverty in Chatham
Income Below Poverty by Sex and Age in Chatham
With 4.6% poverty level for males and 2.1% for females among the residents of Chatham, 18 to 24 year old males and 55 to 64 year old females are the most vulnerable to poverty, with 13 males (46.4%) and 7 females (4.3%) in their respective age groups living below the poverty level.
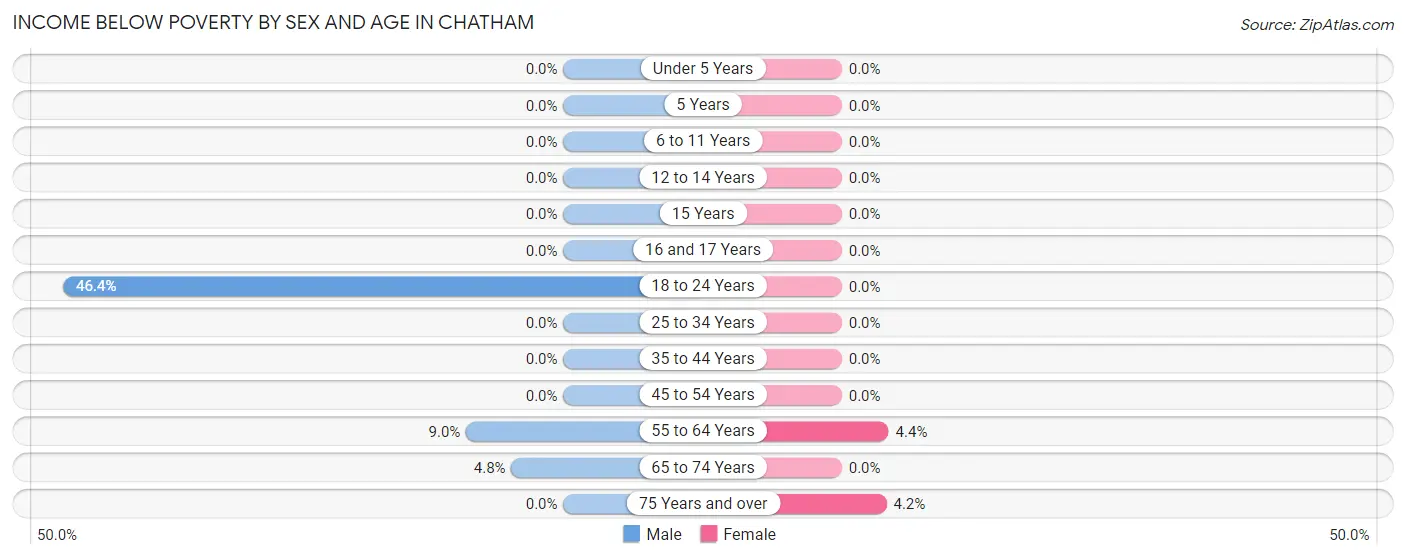
| Age Bracket | Male | Female |
| Under 5 Years | 0 (0.0%) | 0 (0.0%) |
| 5 Years | 0 (0.0%) | 0 (0.0%) |
| 6 to 11 Years | 0 (0.0%) | 0 (0.0%) |
| 12 to 14 Years | 0 (0.0%) | 0 (0.0%) |
| 15 Years | 0 (0.0%) | 0 (0.0%) |
| 16 and 17 Years | 0 (0.0%) | 0 (0.0%) |
| 18 to 24 Years | 13 (46.4%) | 0 (0.0%) |
| 25 to 34 Years | 0 (0.0%) | 0 (0.0%) |
| 35 to 44 Years | 0 (0.0%) | 0 (0.0%) |
| 45 to 54 Years | 0 (0.0%) | 0 (0.0%) |
| 55 to 64 Years | 11 (9.0%) | 7 (4.3%) |
| 65 to 74 Years | 11 (4.8%) | 0 (0.0%) |
| 75 Years and over | 0 (0.0%) | 11 (4.2%) |
| Total | 35 (4.6%) | 18 (2.1%) |
Income Above Poverty by Sex and Age in Chatham
According to the poverty statistics in Chatham, males aged 12 to 14 years and females aged 6 to 11 years are the age groups that are most secure financially, with 100.0% of males and 100.0% of females in these age groups living above the poverty line.
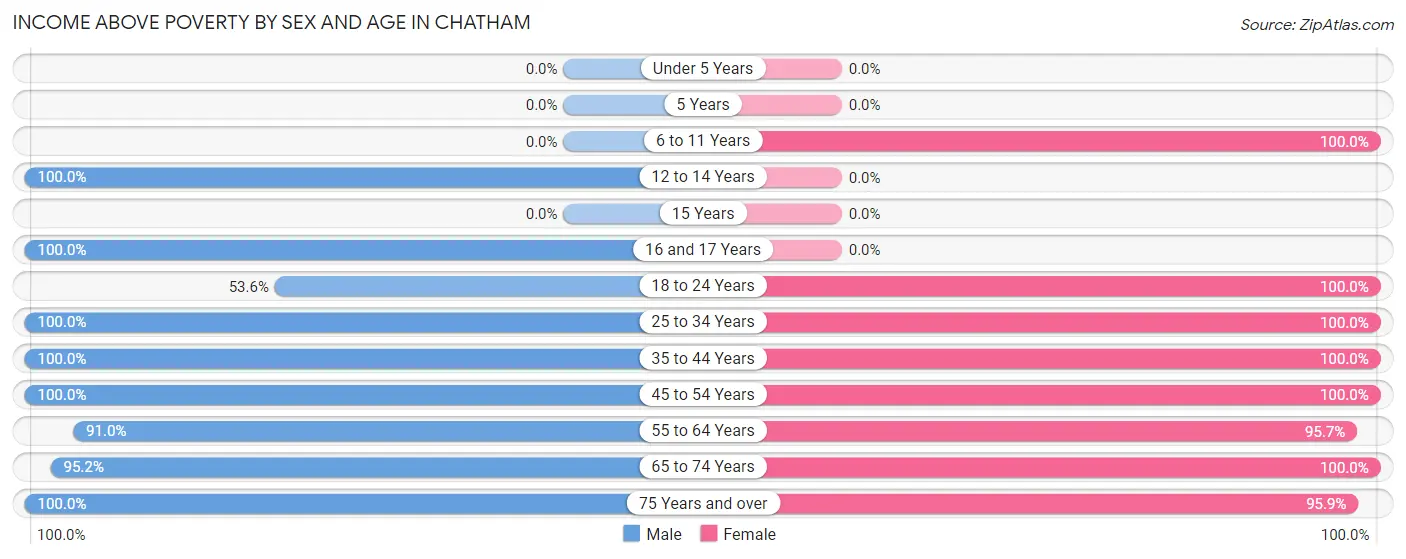
| Age Bracket | Male | Female |
| Under 5 Years | 0 (0.0%) | 0 (0.0%) |
| 5 Years | 0 (0.0%) | 0 (0.0%) |
| 6 to 11 Years | 0 (0.0%) | 17 (100.0%) |
| 12 to 14 Years | 20 (100.0%) | 0 (0.0%) |
| 15 Years | 0 (0.0%) | 0 (0.0%) |
| 16 and 17 Years | 49 (100.0%) | 0 (0.0%) |
| 18 to 24 Years | 15 (53.6%) | 62 (100.0%) |
| 25 to 34 Years | 62 (100.0%) | 38 (100.0%) |
| 35 to 44 Years | 50 (100.0%) | 38 (100.0%) |
| 45 to 54 Years | 24 (100.0%) | 24 (100.0%) |
| 55 to 64 Years | 111 (91.0%) | 154 (95.7%) |
| 65 to 74 Years | 217 (95.2%) | 249 (100.0%) |
| 75 Years and over | 183 (100.0%) | 254 (95.9%) |
| Total | 731 (95.4%) | 836 (97.9%) |
Income Below Poverty Among Married-Couple Families in Chatham
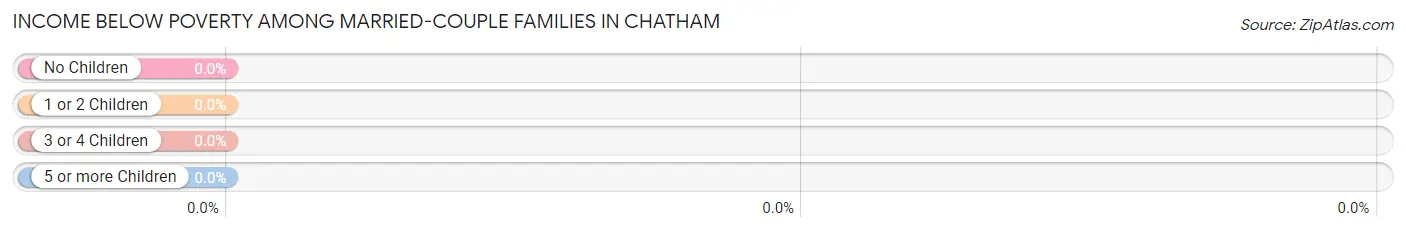
| Children | Above Poverty | Below Poverty |
| No Children | 429 (100.0%) | 0 (0.0%) |
| 1 or 2 Children | 0 (0.0%) | 0 (0.0%) |
| 3 or 4 Children | 0 (0.0%) | 0 (0.0%) |
| 5 or more Children | 0 (0.0%) | 0 (0.0%) |
| Total | 429 (100.0%) | 0 (0.0%) |
Income Below Poverty Among Single-Parent Households in Chatham
| Children | Single Father | Single Mother |
| No Children | 0 (0.0%) | 0 (0.0%) |
| 1 or 2 Children | 0 (0.0%) | 0 (0.0%) |
| 3 or 4 Children | 0 (0.0%) | 0 (0.0%) |
| 5 or more Children | 0 (0.0%) | 0 (0.0%) |
| Total | 0 (0.0%) | 0 (0.0%) |
Income Below Poverty Among Married-Couple vs Single-Parent Households in Chatham
| Children | Married-Couple Families | Single-Parent Households |
| No Children | 0 (0.0%) | 0 (0.0%) |
| 1 or 2 Children | 0 (0.0%) | 0 (0.0%) |
| 3 or 4 Children | 0 (0.0%) | 0 (0.0%) |
| 5 or more Children | 0 (0.0%) | 0 (0.0%) |
| Total | 0 (0.0%) | 0 (0.0%) |
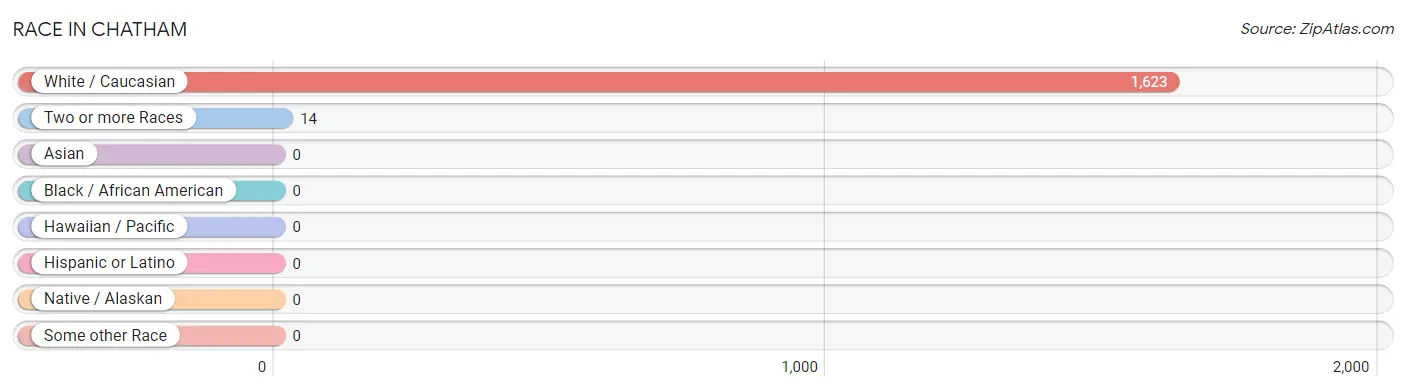
Race in Chatham
The most populous races in Chatham are White / Caucasian (1,623 | 99.1%), and Two or more Races (14 | 0.9%).
| Race | # Population | % Population |
| Asian | 0 | 0.0% |
| Black / African American | 0 | 0.0% |
| Hawaiian / Pacific | 0 | 0.0% |
| Hispanic or Latino | 0 | 0.0% |
| Native / Alaskan | 0 | 0.0% |
| White / Caucasian | 1,623 | 99.1% |
| Two or more Races | 14 | 0.9% |
| Some other Race | 0 | 0.0% |
| Total | 1,637 | 100.0% |
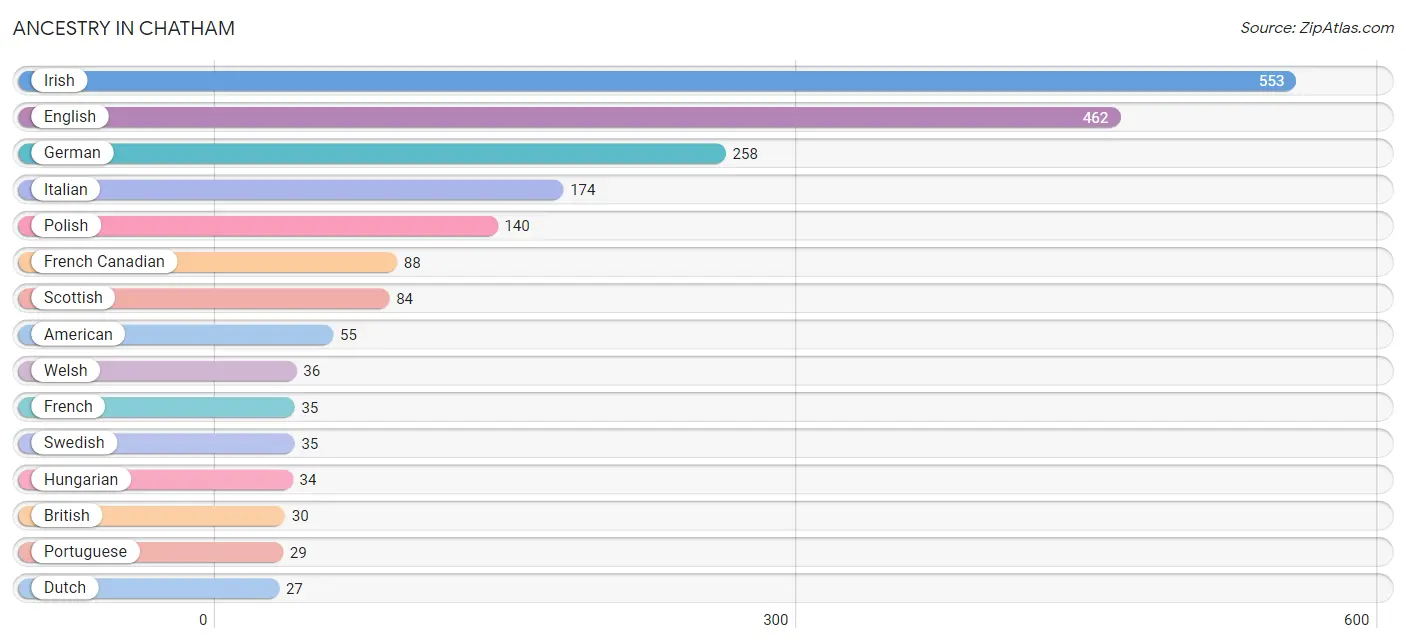
Ancestry in Chatham
The most populous ancestries reported in Chatham are Irish (553 | 33.8%), English (462 | 28.2%), German (258 | 15.8%), Italian (174 | 10.6%), and Polish (140 | 8.6%), together accounting for 96.9% of all Chatham residents.
| Ancestry | # Population | % Population |
| American | 55 | 3.4% |
| Armenian | 10 | 0.6% |
| Austrian | 12 | 0.7% |
| Bhutanese | 14 | 0.9% |
| British | 30 | 1.8% |
| Danish | 11 | 0.7% |
| Dutch | 27 | 1.7% |
| English | 462 | 28.2% |
| European | 21 | 1.3% |
| Finnish | 12 | 0.7% |
| French | 35 | 2.1% |
| French Canadian | 88 | 5.4% |
| German | 258 | 15.8% |
| Hungarian | 34 | 2.1% |
| Irish | 553 | 33.8% |
| Italian | 174 | 10.6% |
| Lithuanian | 16 | 1.0% |
| Norwegian | 12 | 0.7% |
| Polish | 140 | 8.6% |
| Portuguese | 29 | 1.8% |
| Russian | 15 | 0.9% |
| Scandinavian | 10 | 0.6% |
| Scotch-Irish | 23 | 1.4% |
| Scottish | 84 | 5.1% |
| Swedish | 35 | 2.1% |
| Welsh | 36 | 2.2% | View All 26 Rows |
Immigrants in Chatham
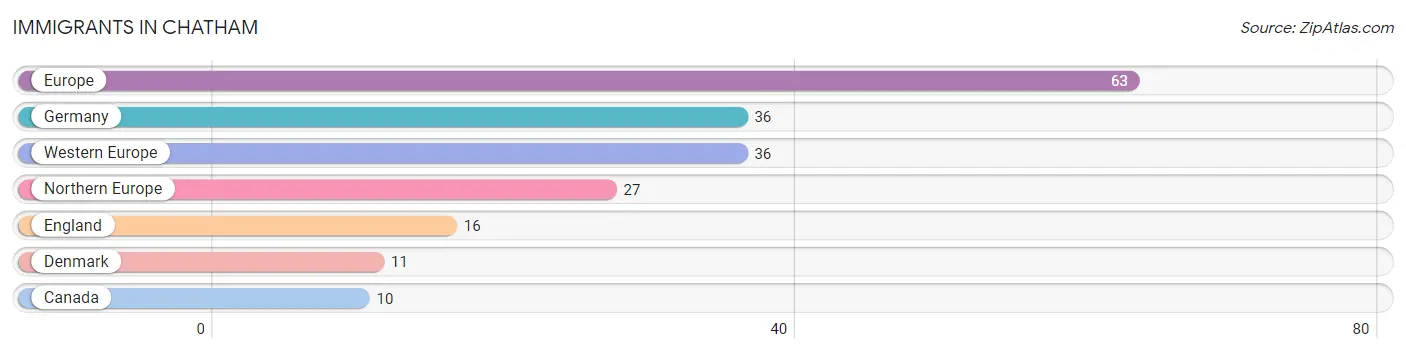
The most numerous immigrant groups reported in Chatham came from Europe (63 | 3.8%), Germany (36 | 2.2%), Western Europe (36 | 2.2%), Northern Europe (27 | 1.7%), and England (16 | 1.0%), together accounting for 10.9% of all Chatham residents.
| Immigration Origin | # Population | % Population |
| Canada | 10 | 0.6% |
| Denmark | 11 | 0.7% |
| England | 16 | 1.0% |
| Europe | 63 | 3.8% |
| Germany | 36 | 2.2% |
| Northern Europe | 27 | 1.7% |
| Western Europe | 36 | 2.2% | View All 7 Rows |
Sex and Age in Chatham
Sex and Age in Chatham
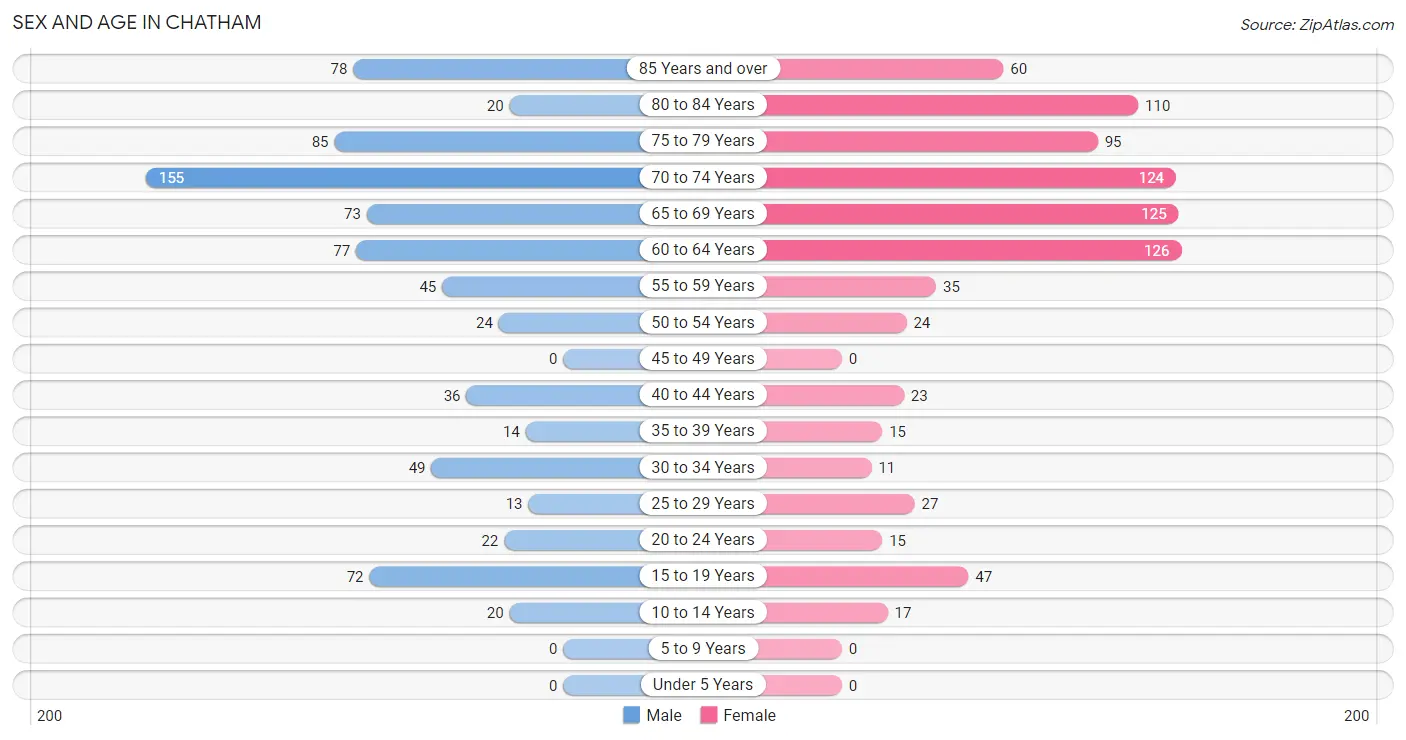
The most populous age groups in Chatham are 70 to 74 Years (155 | 19.8%) for men and 60 to 64 Years (126 | 14.7%) for women.
| Age Bracket | Male | Female |
| Under 5 Years | 0 (0.0%) | 0 (0.0%) |
| 5 to 9 Years | 0 (0.0%) | 0 (0.0%) |
| 10 to 14 Years | 20 (2.5%) | 17 (2.0%) |
| 15 to 19 Years | 72 (9.2%) | 47 (5.5%) |
| 20 to 24 Years | 22 (2.8%) | 15 (1.8%) |
| 25 to 29 Years | 13 (1.7%) | 27 (3.2%) |
| 30 to 34 Years | 49 (6.3%) | 11 (1.3%) |
| 35 to 39 Years | 14 (1.8%) | 15 (1.8%) |
| 40 to 44 Years | 36 (4.6%) | 23 (2.7%) |
| 45 to 49 Years | 0 (0.0%) | 0 (0.0%) |
| 50 to 54 Years | 24 (3.1%) | 24 (2.8%) |
| 55 to 59 Years | 45 (5.8%) | 35 (4.1%) |
| 60 to 64 Years | 77 (9.8%) | 126 (14.7%) |
| 65 to 69 Years | 73 (9.3%) | 125 (14.6%) |
| 70 to 74 Years | 155 (19.8%) | 124 (14.5%) |
| 75 to 79 Years | 85 (10.9%) | 95 (11.1%) |
| 80 to 84 Years | 20 (2.5%) | 110 (12.9%) |
| 85 Years and over | 78 (10.0%) | 60 (7.0%) |
| Total | 783 (100.0%) | 854 (100.0%) |
Families and Households in Chatham
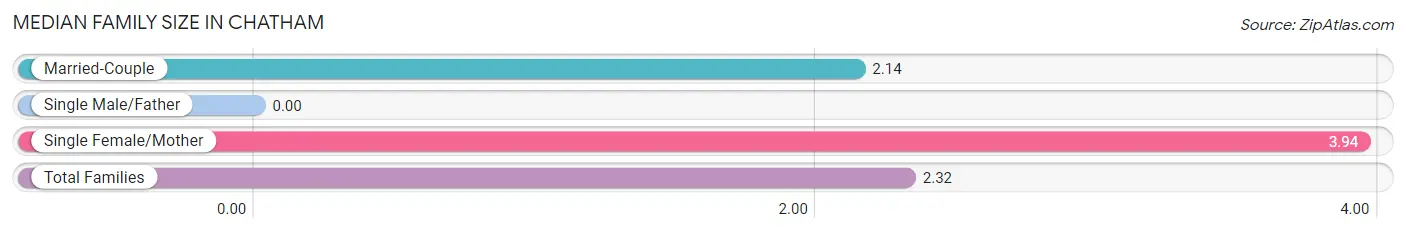
Median Family Size in Chatham
| Family Type | # Families | Family Size |
| Married-Couple | 429 (89.7%) | 2.14 |
| Single Male/Father | 0 (0.0%) | - |
| Single Female/Mother | 49 (10.2%) | 3.94 |
| Total Families | 478 (100.0%) | 2.32 |
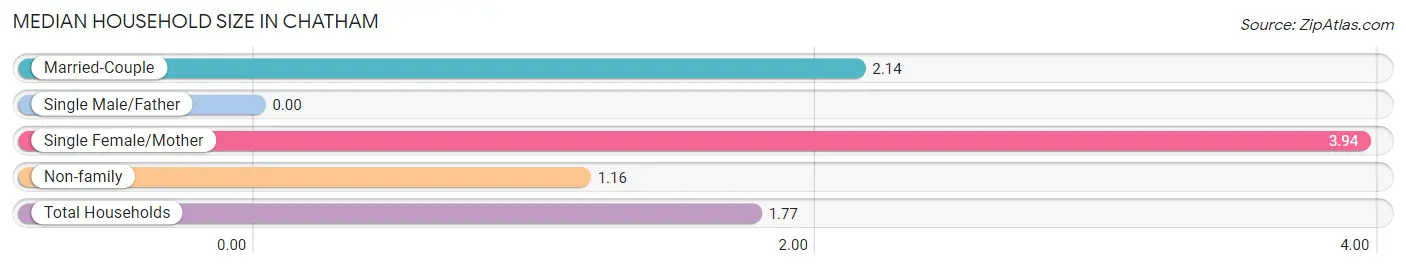
Median Household Size in Chatham
| Household Type | # Households | Household Size |
| Married-Couple | 429 (46.9%) | 2.14 |
| Single Male/Father | 0 (0.0%) | - |
| Single Female/Mother | 49 (5.4%) | 3.94 |
| Non-family | 437 (47.8%) | 1.16 |
| Total Households | 915 (100.0%) | 1.77 |
Household Size by Marriage Status in Chatham
Out of a total of 915 households in Chatham, 478 (52.2%) are family households, while 437 (47.8%) are nonfamily households. The most numerous type of family households are 2-person households, comprising 399, and the most common type of nonfamily households are 1-person households, comprising 389.
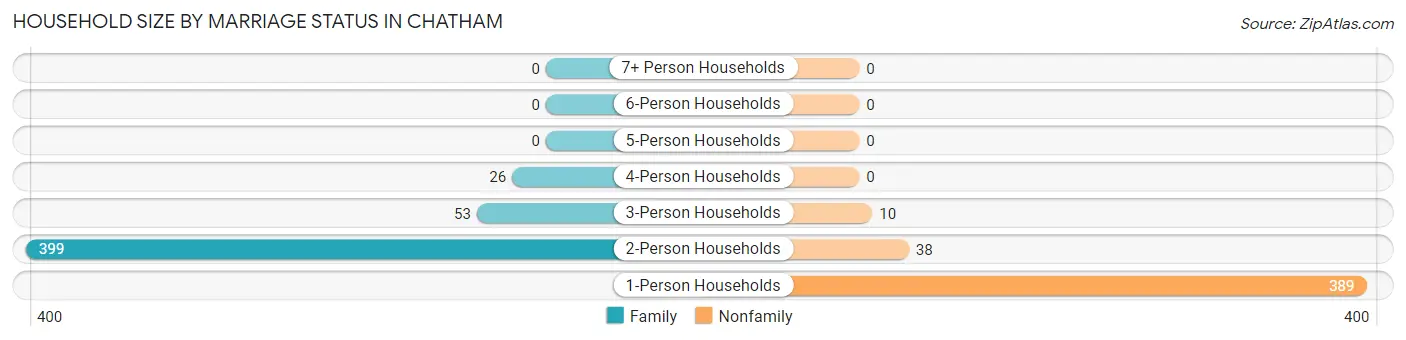
| Household Size | Family Households | Nonfamily Households |
| 1-Person Households | - | 389 (42.5%) |
| 2-Person Households | 399 (43.6%) | 38 (4.2%) |
| 3-Person Households | 53 (5.8%) | 10 (1.1%) |
| 4-Person Households | 26 (2.8%) | 0 (0.0%) |
| 5-Person Households | 0 (0.0%) | 0 (0.0%) |
| 6-Person Households | 0 (0.0%) | 0 (0.0%) |
| 7+ Person Households | 0 (0.0%) | 0 (0.0%) |
| Total | 478 (52.2%) | 437 (47.8%) |
Female Fertility in Chatham
Fertility by Age in Chatham
| Age Bracket | Women with Births | Births / 1,000 Women |
| 15 to 19 years | 0 (0.0%) | 0.0 |
| 20 to 34 years | 0 (0.0%) | 0.0 |
| 35 to 50 years | 0 (0.0%) | 0.0 |
| Total | 0 (0.0%) | 0.0 |
Fertility by Age by Marriage Status in Chatham
| Age Bracket | Married | Unmarried |
| 15 to 19 years | 0 (0.0%) | 0 (0.0%) |
| 20 to 34 years | 0 (0.0%) | 0 (0.0%) |
| 35 to 50 years | 0 (0.0%) | 0 (0.0%) |
| Total | 0 (0.0%) | 0 (0.0%) |
Fertility by Education in Chatham
| Educational Attainment | Women with Births | Births / 1,000 Women |
| Less than High School | 0 (0.0%) | 0.0 |
| High School Diploma | 0 (0.0%) | 0.0 |
| College or Associate's Degree | 0 (0.0%) | 0.0 |
| Bachelor's Degree | 0 (0.0%) | 0.0 |
| Graduate Degree | 0 (0.0%) | 0.0 |
| Total | 0 (0.0%) | 0.0 |
Fertility by Education by Marriage Status in Chatham
| Educational Attainment | Married | Unmarried |
| Less than High School | 0 (0.0%) | 0 (0.0%) |
| High School Diploma | 0 (0.0%) | 0 (0.0%) |
| College or Associate's Degree | 0 (0.0%) | 0 (0.0%) |
| Bachelor's Degree | 0 (0.0%) | 0 (0.0%) |
| Graduate Degree | 0 (0.0%) | 0 (0.0%) |
| Total | 0 (0.0%) | 0 (0.0%) |
Employment Characteristics in Chatham
Employment by Class of Employer in Chatham
Among the 488 employed individuals in Chatham, private company employees (278 | 57.0%), local government employees (67 | 13.7%), and self-employed (not incorporated) (58 | 11.9%) make up the most common classes of employment.
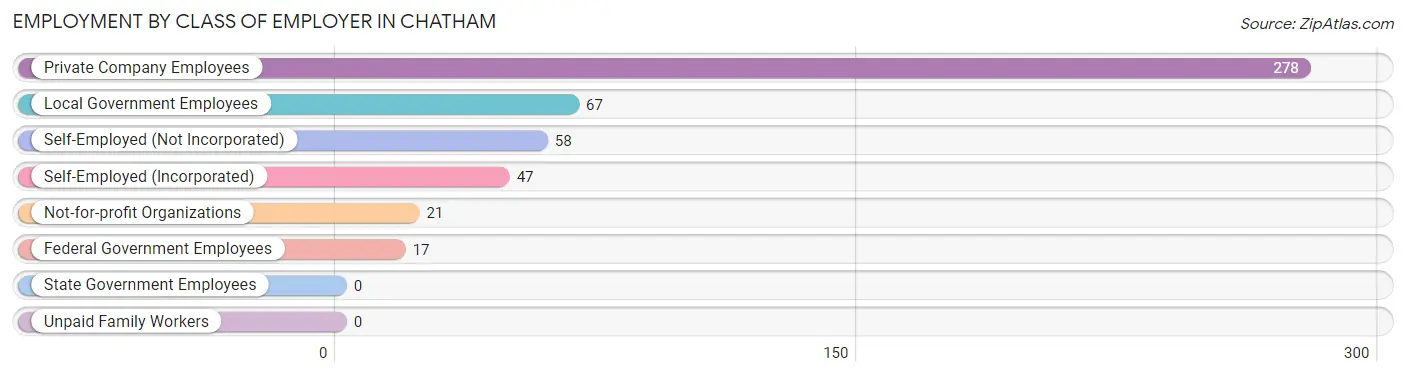
| Employer Class | # Employees | % Employees |
| Private Company Employees | 278 | 57.0% |
| Self-Employed (Incorporated) | 47 | 9.6% |
| Self-Employed (Not Incorporated) | 58 | 11.9% |
| Not-for-profit Organizations | 21 | 4.3% |
| Local Government Employees | 67 | 13.7% |
| State Government Employees | 0 | 0.0% |
| Federal Government Employees | 17 | 3.5% |
| Unpaid Family Workers | 0 | 0.0% |
| Total | 488 | 100.0% |
Employment Status by Age in Chatham
According to the labor force statistics for Chatham, out of the total population over 16 years of age (1,600), 34.3% or 549 individuals are in the labor force, with 8.6% or 47 of them unemployed. The age group with the highest labor force participation rate is 20 to 24 years, with 100.0% or 37 individuals in the labor force. Within the labor force, the 20 to 24 years age range has the highest percentage of unemployed individuals, with 46.4% or 17 of them being unemployed.
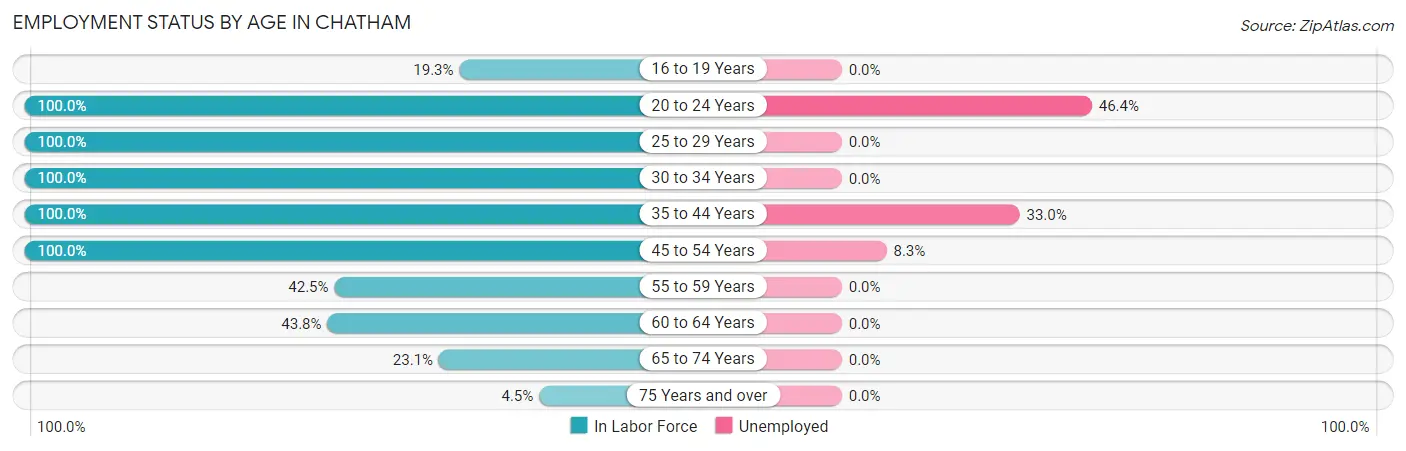
| Age Bracket | In Labor Force | Unemployed |
| 16 to 19 Years | 23 (19.3%) | 0 (0.0%) |
| 20 to 24 Years | 37 (100.0%) | 17 (46.4%) |
| 25 to 29 Years | 40 (100.0%) | 0 (0.0%) |
| 30 to 34 Years | 60 (100.0%) | 0 (0.0%) |
| 35 to 44 Years | 88 (100.0%) | 29 (33.0%) |
| 45 to 54 Years | 48 (100.0%) | 4 (8.3%) |
| 55 to 59 Years | 34 (42.5%) | 0 (0.0%) |
| 60 to 64 Years | 89 (43.8%) | 0 (0.0%) |
| 65 to 74 Years | 110 (23.1%) | 0 (0.0%) |
| 75 Years and over | 20 (4.5%) | 0 (0.0%) |
| Total | 549 (34.3%) | 47 (8.6%) |
Employment Status by Educational Attainment in Chatham
According to labor force statistics for Chatham, 69.2% of individuals (359) out of the total population between 25 and 64 years of age (519) are in the labor force, with 9.2% or 33 of them being unemployed. The group with the highest labor force participation rate are those with the educational attainment of high school diploma, with 100.0% or 68 individuals in the labor force. Within the labor force, individuals with bachelor's degree or higher education have the highest percentage of unemployment, with 17.5% or 29 of them being unemployed.
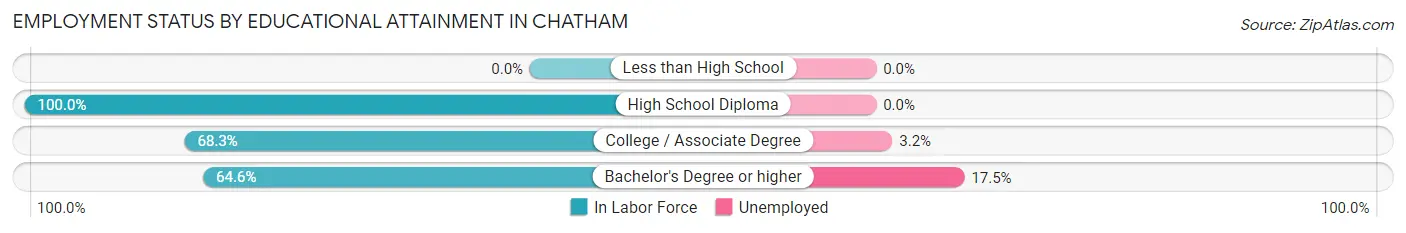
| Educational Attainment | In Labor Force | Unemployed |
| Less than High School | 0 (0.0%) | 0 (0.0%) |
| High School Diploma | 68 (100.0%) | 0 (0.0%) |
| College / Associate Degree | 125 (68.3%) | 6 (3.2%) |
| Bachelor's Degree or higher | 166 (64.6%) | 45 (17.5%) |
| Total | 359 (69.2%) | 48 (9.2%) |
Employment Occupations by Sex in Chatham
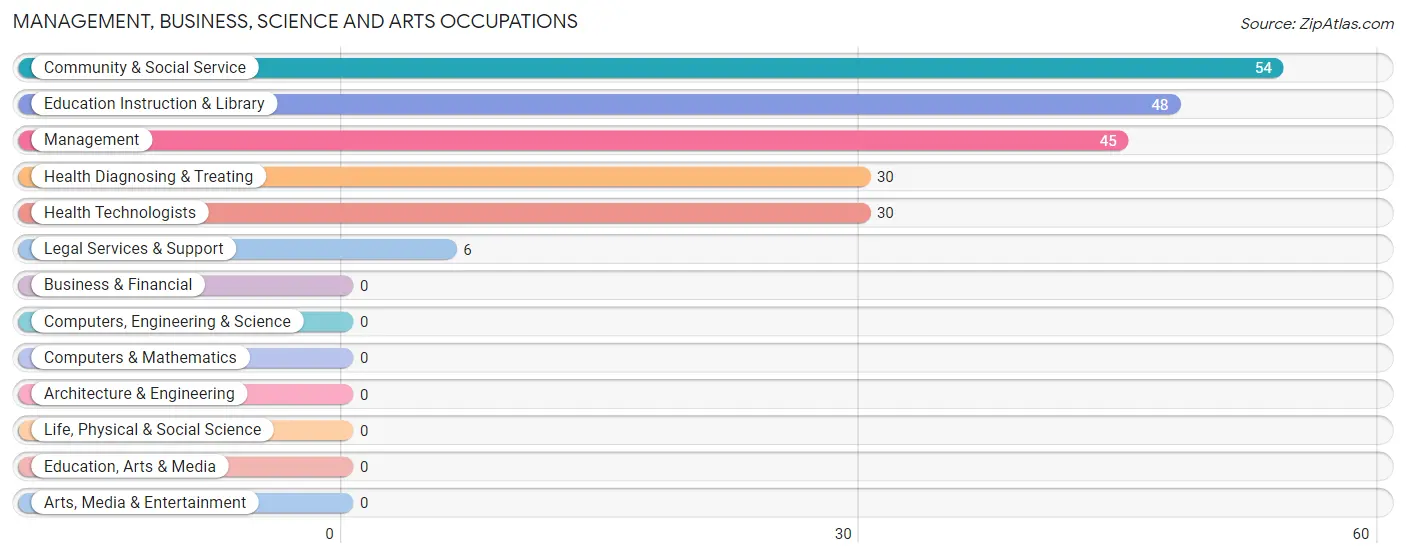
Management, Business, Science and Arts Occupations
The most common Management, Business, Science and Arts occupations in Chatham are Community & Social Service (54 | 11.1%), Education Instruction & Library (48 | 9.9%), Management (45 | 9.3%), Health Diagnosing & Treating (30 | 6.2%), and Health Technologists (30 | 6.2%).
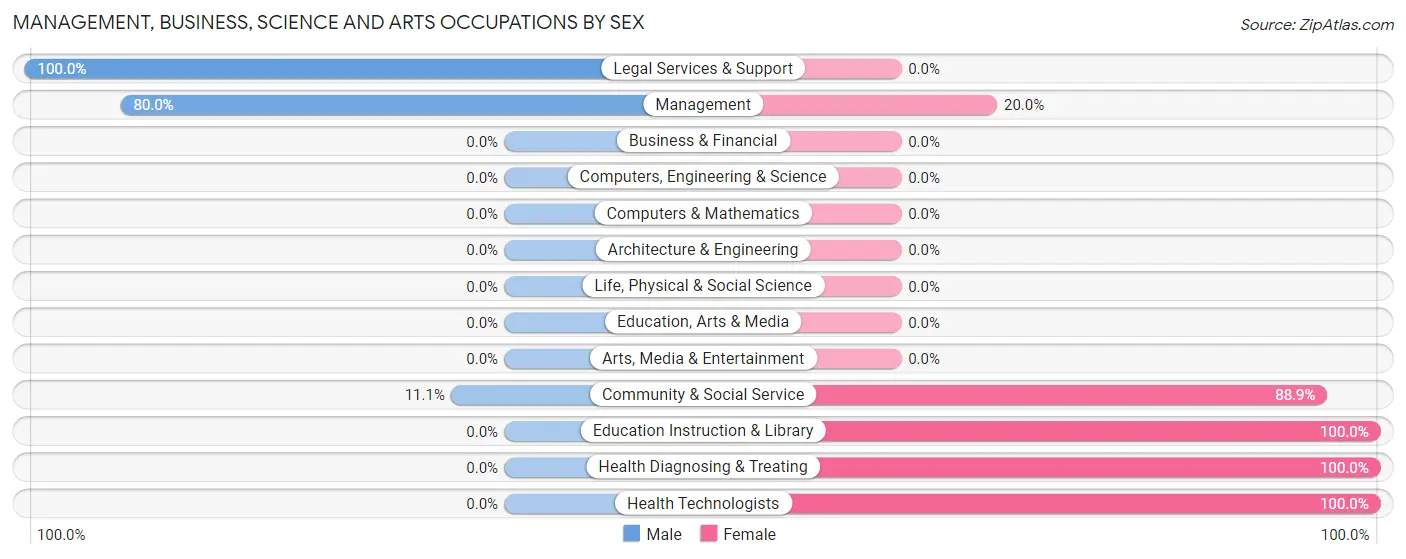
Management, Business, Science and Arts Occupations by Sex
Within the Management, Business, Science and Arts occupations in Chatham, the most male-oriented occupations are Legal Services & Support (100.0%), Management (80.0%), and Community & Social Service (11.1%), while the most female-oriented occupations are Education Instruction & Library (100.0%), Health Diagnosing & Treating (100.0%), and Health Technologists (100.0%).
| Occupation | Male | Female |
| Management | 36 (80.0%) | 9 (20.0%) |
| Business & Financial | 0 (0.0%) | 0 (0.0%) |
| Computers, Engineering & Science | 0 (0.0%) | 0 (0.0%) |
| Computers & Mathematics | 0 (0.0%) | 0 (0.0%) |
| Architecture & Engineering | 0 (0.0%) | 0 (0.0%) |
| Life, Physical & Social Science | 0 (0.0%) | 0 (0.0%) |
| Community & Social Service | 6 (11.1%) | 48 (88.9%) |
| Education, Arts & Media | 0 (0.0%) | 0 (0.0%) |
| Legal Services & Support | 6 (100.0%) | 0 (0.0%) |
| Education Instruction & Library | 0 (0.0%) | 48 (100.0%) |
| Arts, Media & Entertainment | 0 (0.0%) | 0 (0.0%) |
| Health Diagnosing & Treating | 0 (0.0%) | 30 (100.0%) |
| Health Technologists | 0 (0.0%) | 30 (100.0%) |
| Total (Category) | 42 (32.6%) | 87 (67.4%) |
| Total (Overall) | 257 (52.9%) | 229 (47.1%) |
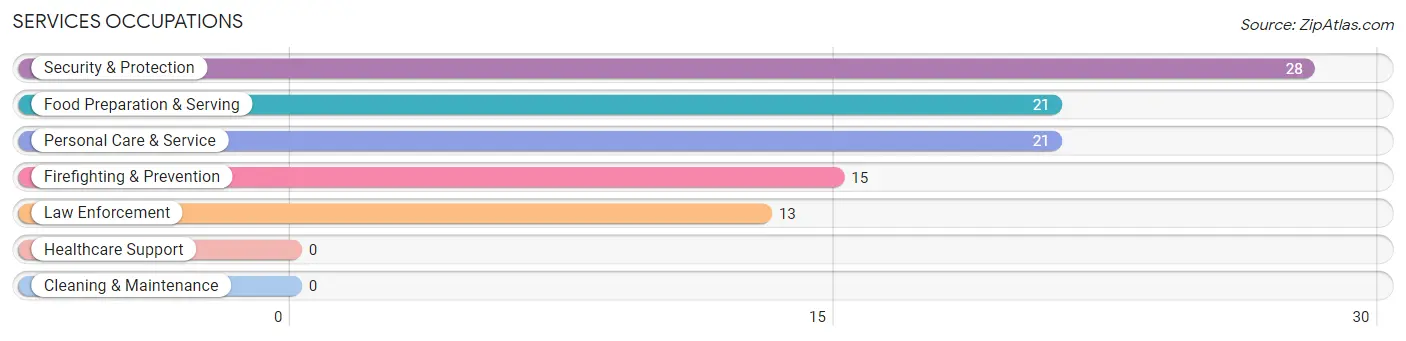
Services Occupations
The most common Services occupations in Chatham are Security & Protection (28 | 5.8%), Food Preparation & Serving (21 | 4.3%), Personal Care & Service (21 | 4.3%), Firefighting & Prevention (15 | 3.1%), and Law Enforcement (13 | 2.7%).
Services Occupations by Sex
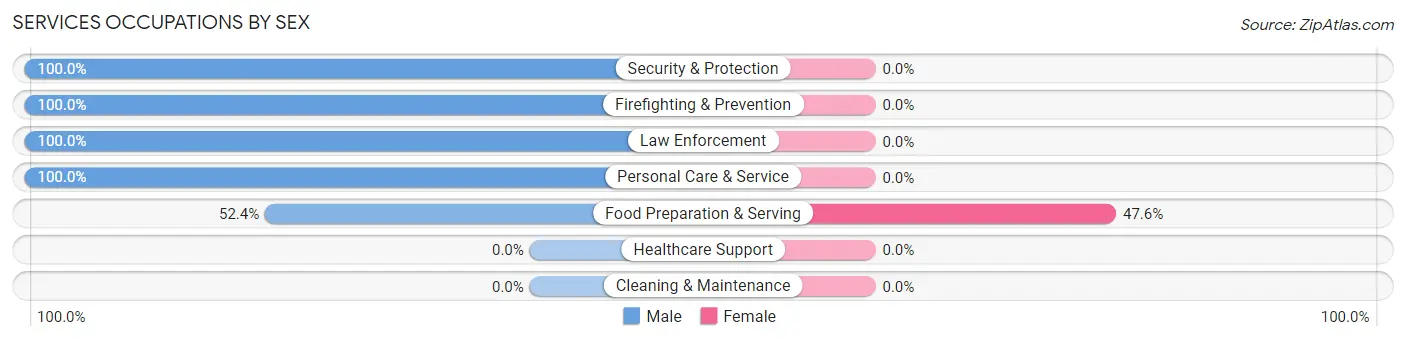
| Occupation | Male | Female |
| Healthcare Support | 0 (0.0%) | 0 (0.0%) |
| Security & Protection | 28 (100.0%) | 0 (0.0%) |
| Firefighting & Prevention | 15 (100.0%) | 0 (0.0%) |
| Law Enforcement | 13 (100.0%) | 0 (0.0%) |
| Food Preparation & Serving | 11 (52.4%) | 10 (47.6%) |
| Cleaning & Maintenance | 0 (0.0%) | 0 (0.0%) |
| Personal Care & Service | 21 (100.0%) | 0 (0.0%) |
| Total (Category) | 60 (85.7%) | 10 (14.3%) |
| Total (Overall) | 257 (52.9%) | 229 (47.1%) |
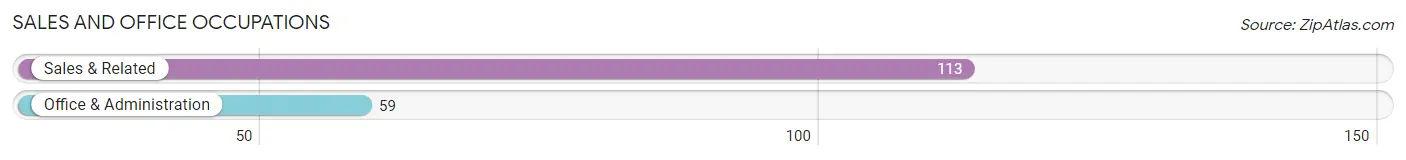
Sales and Office Occupations
The most common Sales and Office occupations in Chatham are Sales & Related (113 | 23.3%), and Office & Administration (59 | 12.1%).
Sales and Office Occupations by Sex
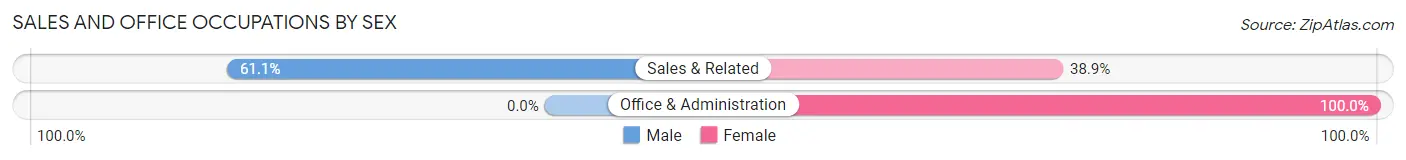
| Occupation | Male | Female |
| Sales & Related | 69 (61.1%) | 44 (38.9%) |
| Office & Administration | 0 (0.0%) | 59 (100.0%) |
| Total (Category) | 69 (40.1%) | 103 (59.9%) |
| Total (Overall) | 257 (52.9%) | 229 (47.1%) |
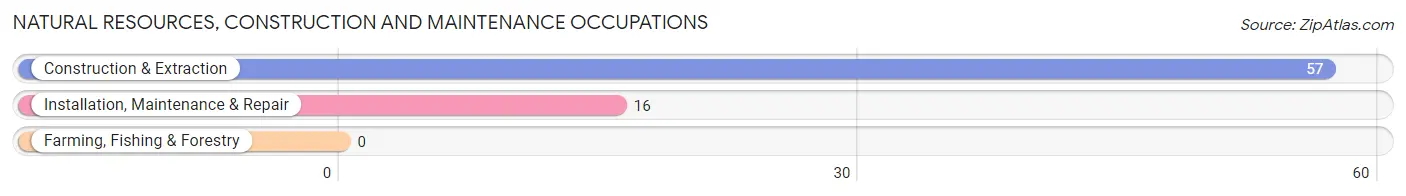
Natural Resources, Construction and Maintenance Occupations
The most common Natural Resources, Construction and Maintenance occupations in Chatham are Construction & Extraction (57 | 11.7%), and Installation, Maintenance & Repair (16 | 3.3%).
Natural Resources, Construction and Maintenance Occupations by Sex
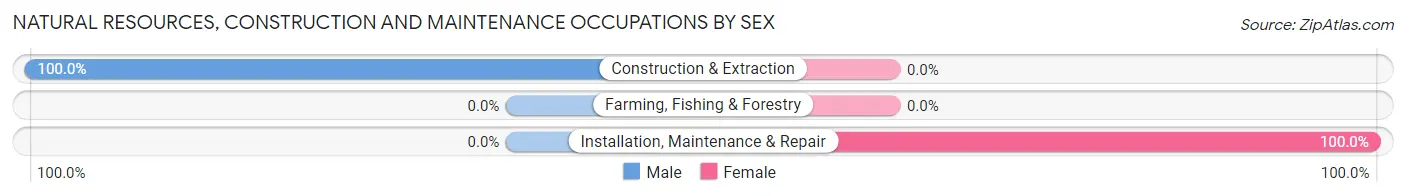
| Occupation | Male | Female |
| Farming, Fishing & Forestry | 0 (0.0%) | 0 (0.0%) |
| Construction & Extraction | 57 (100.0%) | 0 (0.0%) |
| Installation, Maintenance & Repair | 0 (0.0%) | 16 (100.0%) |
| Total (Category) | 57 (78.1%) | 16 (21.9%) |
| Total (Overall) | 257 (52.9%) | 229 (47.1%) |
Production, Transportation and Moving Occupations
The most common Production, Transportation and Moving occupations in Chatham are , and Transportation (42 | 8.6%).
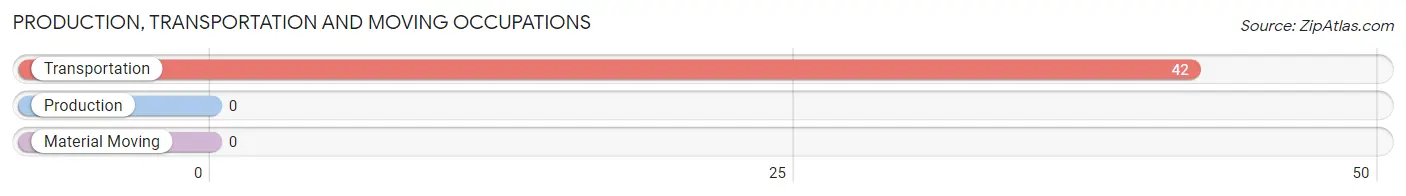
Production, Transportation and Moving Occupations by Sex
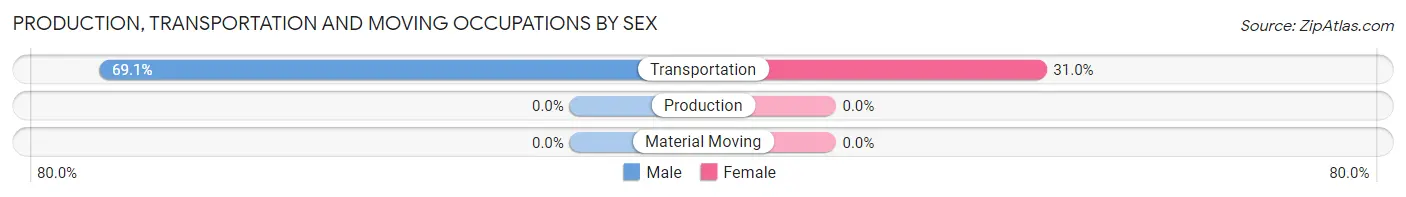
| Occupation | Male | Female |
| Production | 0 (0.0%) | 0 (0.0%) |
| Transportation | 29 (69.1%) | 13 (30.9%) |
| Material Moving | 0 (0.0%) | 0 (0.0%) |
| Total (Category) | 29 (69.1%) | 13 (30.9%) |
| Total (Overall) | 257 (52.9%) | 229 (47.1%) |
Employment Industries by Sex in Chatham
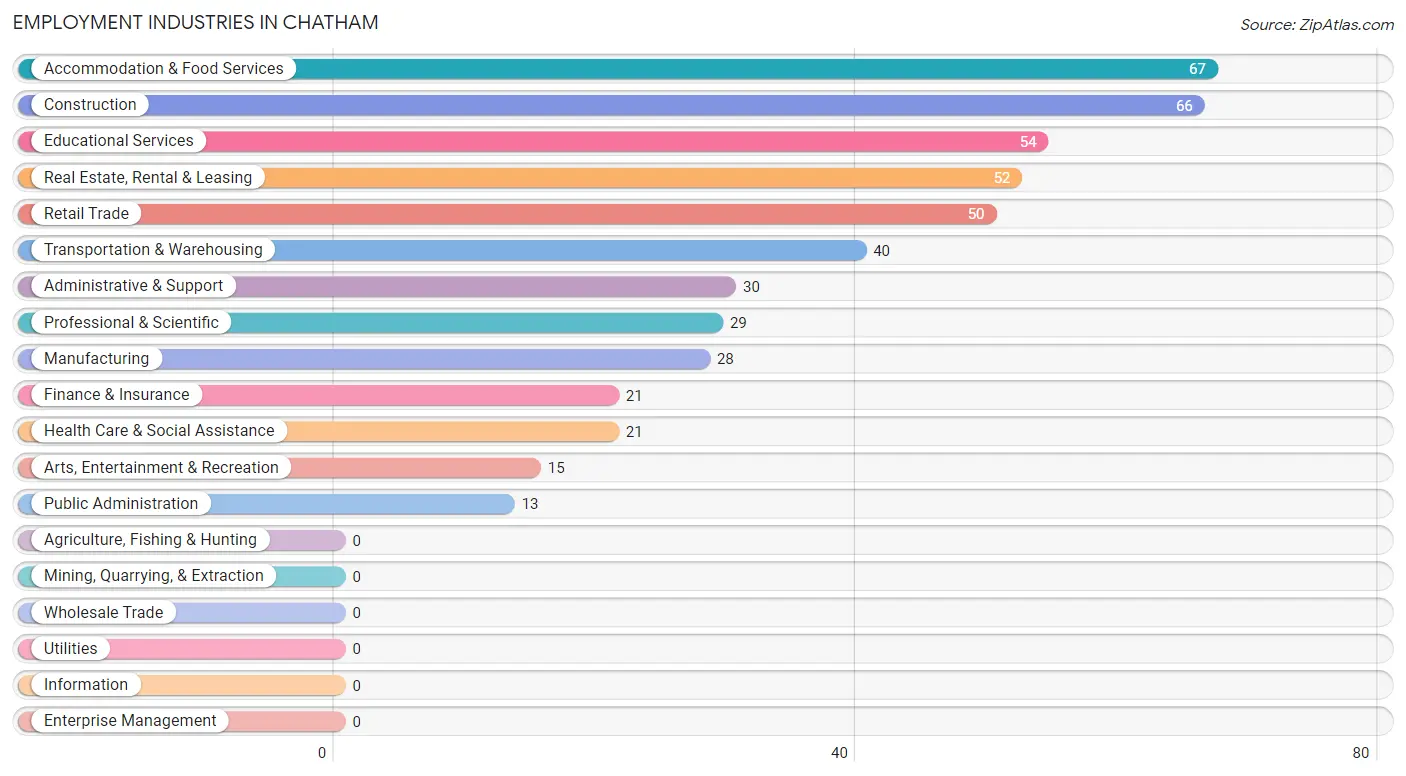
Employment Industries in Chatham
The major employment industries in Chatham include Accommodation & Food Services (67 | 13.8%), Construction (66 | 13.6%), Educational Services (54 | 11.1%), Real Estate, Rental & Leasing (52 | 10.7%), and Retail Trade (50 | 10.3%).
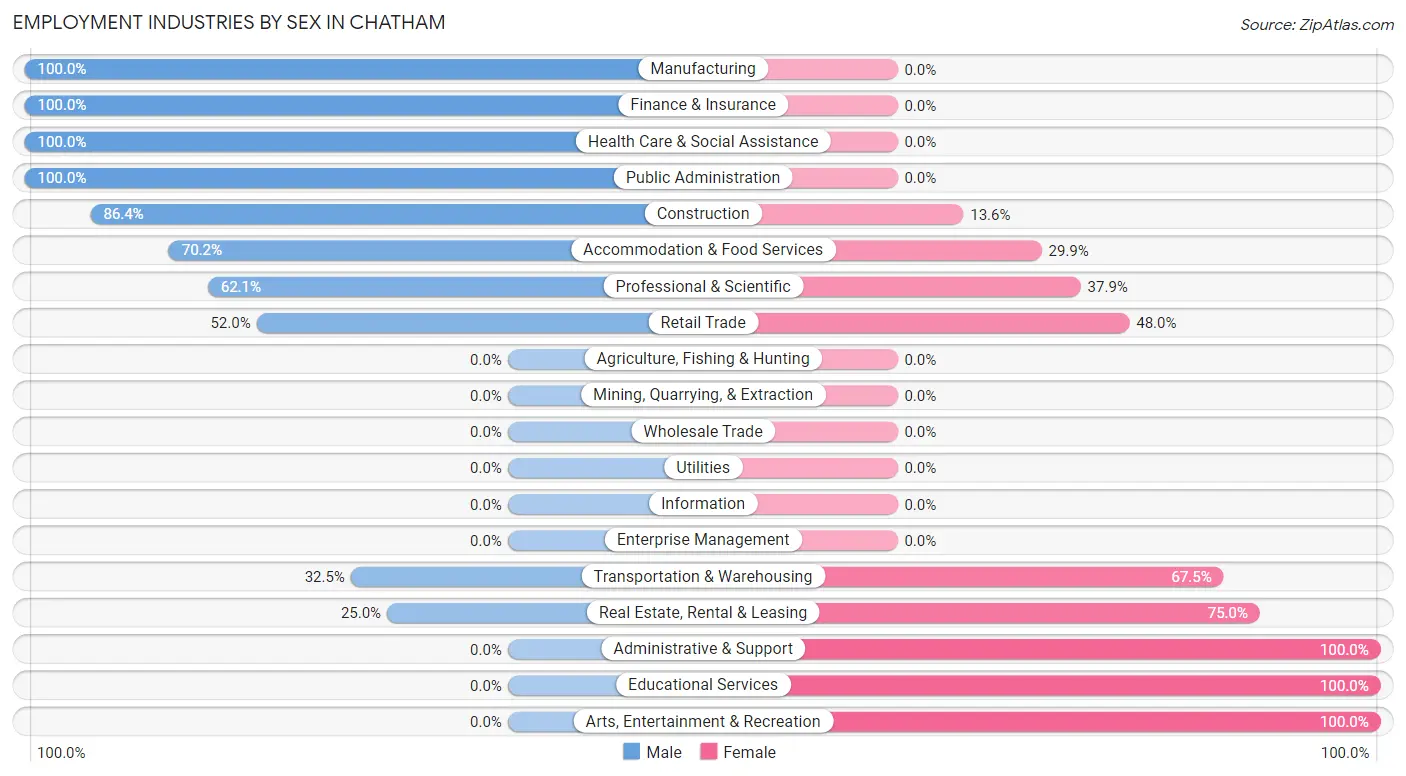
Employment Industries by Sex in Chatham
The Chatham industries that see more men than women are Manufacturing (100.0%), Finance & Insurance (100.0%), and Health Care & Social Assistance (100.0%), whereas the industries that tend to have a higher number of women are Administrative & Support (100.0%), Educational Services (100.0%), and Arts, Entertainment & Recreation (100.0%).
| Industry | Male | Female |
| Agriculture, Fishing & Hunting | 0 (0.0%) | 0 (0.0%) |
| Mining, Quarrying, & Extraction | 0 (0.0%) | 0 (0.0%) |
| Construction | 57 (86.4%) | 9 (13.6%) |
| Manufacturing | 28 (100.0%) | 0 (0.0%) |
| Wholesale Trade | 0 (0.0%) | 0 (0.0%) |
| Retail Trade | 26 (52.0%) | 24 (48.0%) |
| Transportation & Warehousing | 13 (32.5%) | 27 (67.5%) |
| Utilities | 0 (0.0%) | 0 (0.0%) |
| Information | 0 (0.0%) | 0 (0.0%) |
| Finance & Insurance | 21 (100.0%) | 0 (0.0%) |
| Real Estate, Rental & Leasing | 13 (25.0%) | 39 (75.0%) |
| Professional & Scientific | 18 (62.1%) | 11 (37.9%) |
| Enterprise Management | 0 (0.0%) | 0 (0.0%) |
| Administrative & Support | 0 (0.0%) | 30 (100.0%) |
| Educational Services | 0 (0.0%) | 54 (100.0%) |
| Health Care & Social Assistance | 21 (100.0%) | 0 (0.0%) |
| Arts, Entertainment & Recreation | 0 (0.0%) | 15 (100.0%) |
| Accommodation & Food Services | 47 (70.2%) | 20 (29.8%) |
| Public Administration | 13 (100.0%) | 0 (0.0%) |
| Total | 257 (52.9%) | 229 (47.1%) |
Education in Chatham
School Enrollment in Chatham
The most common levels of schooling among the 161 students in Chatham are college / undergraduate (75 | 46.6%), high school (69 | 42.9%), and middle school (17 | 10.6%).
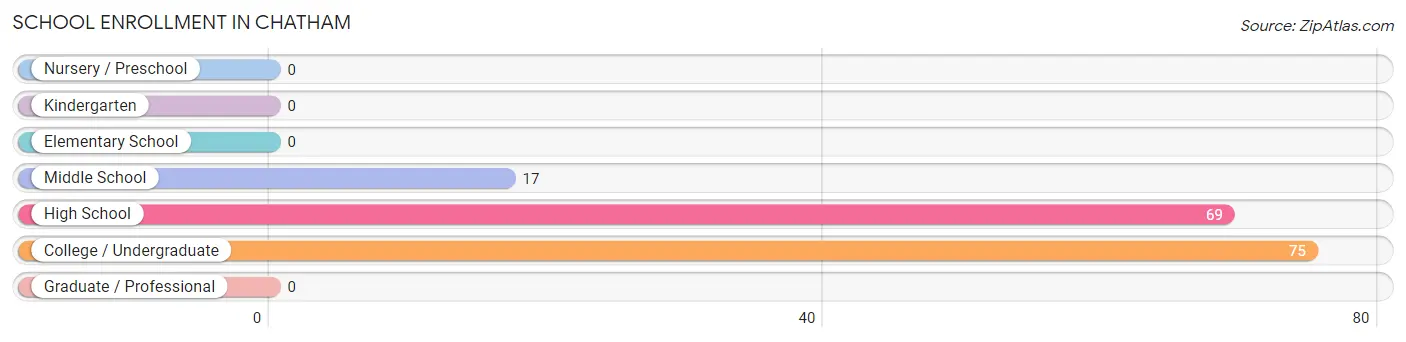
| School Level | # Students | % Students |
| Nursery / Preschool | 0 | 0.0% |
| Kindergarten | 0 | 0.0% |
| Elementary School | 0 | 0.0% |
| Middle School | 17 | 10.6% |
| High School | 69 | 42.9% |
| College / Undergraduate | 75 | 46.6% |
| Graduate / Professional | 0 | 0.0% |
| Total | 161 | 100.0% |
School Enrollment by Age by Funding Source in Chatham
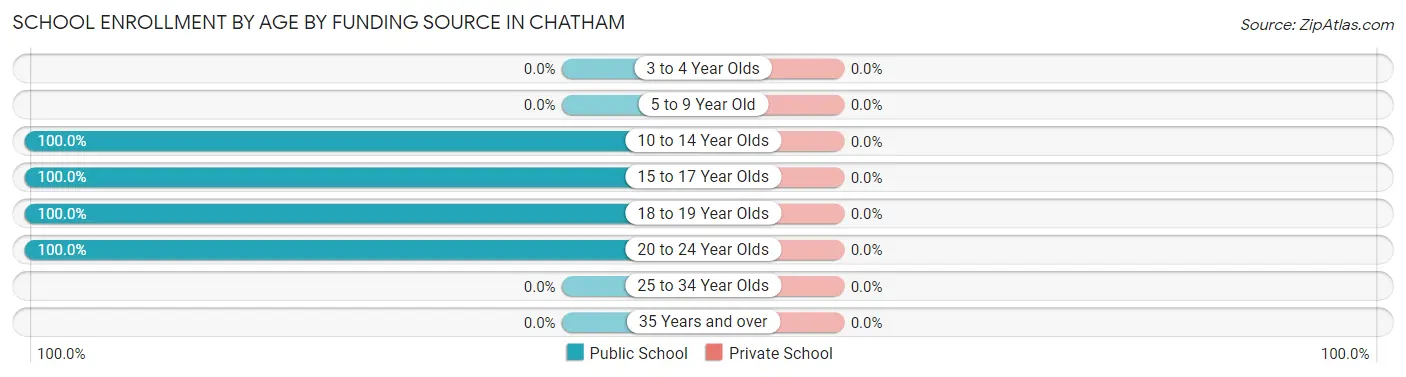
| Age Bracket | Public School | Private School |
| 3 to 4 Year Olds | 0 (0.0%) | 0 (0.0%) |
| 5 to 9 Year Old | 0 (0.0%) | 0 (0.0%) |
| 10 to 14 Year Olds | 37 (100.0%) | 0 (0.0%) |
| 15 to 17 Year Olds | 49 (100.0%) | 0 (0.0%) |
| 18 to 19 Year Olds | 62 (100.0%) | 0 (0.0%) |
| 20 to 24 Year Olds | 13 (100.0%) | 0 (0.0%) |
| 25 to 34 Year Olds | 0 (0.0%) | 0 (0.0%) |
| 35 Years and over | 0 (0.0%) | 0 (0.0%) |
| Total | 161 (100.0%) | 0 (0.0%) |
Educational Attainment by Field of Study in Chatham
Social sciences (147 | 14.7%), education (140 | 14.0%), liberal arts & history (136 | 13.6%), business (121 | 12.1%), and science & technology (85 | 8.5%) are the most common fields of study among 998 individuals in Chatham who have obtained a bachelor's degree or higher.
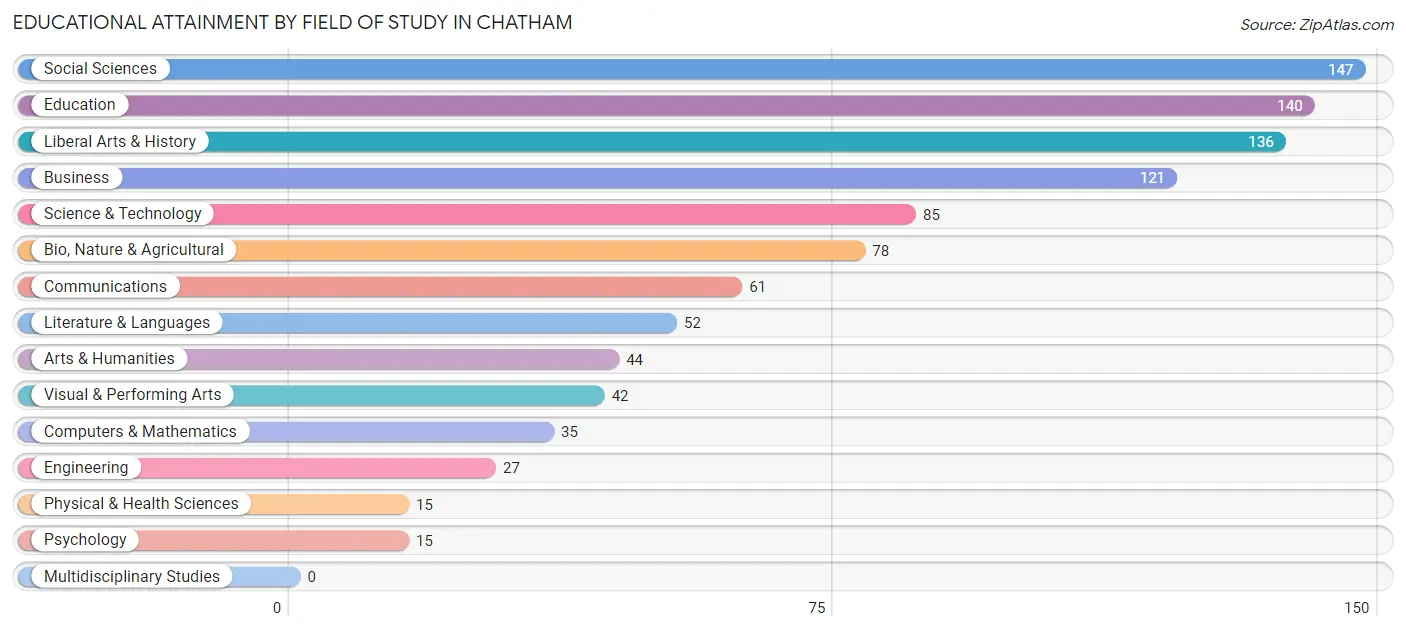
| Field of Study | # Graduates | % Graduates |
| Computers & Mathematics | 35 | 3.5% |
| Bio, Nature & Agricultural | 78 | 7.8% |
| Physical & Health Sciences | 15 | 1.5% |
| Psychology | 15 | 1.5% |
| Social Sciences | 147 | 14.7% |
| Engineering | 27 | 2.7% |
| Multidisciplinary Studies | 0 | 0.0% |
| Science & Technology | 85 | 8.5% |
| Business | 121 | 12.1% |
| Education | 140 | 14.0% |
| Literature & Languages | 52 | 5.2% |
| Liberal Arts & History | 136 | 13.6% |
| Visual & Performing Arts | 42 | 4.2% |
| Communications | 61 | 6.1% |
| Arts & Humanities | 44 | 4.4% |
| Total | 998 | 100.0% |
Transportation & Commute in Chatham
Vehicle Availability by Sex in Chatham
The most prevalent vehicle ownership categories in Chatham are males with 2 vehicles (144, accounting for 56.0%) and females with 2 vehicles (109, making up 67.3%).
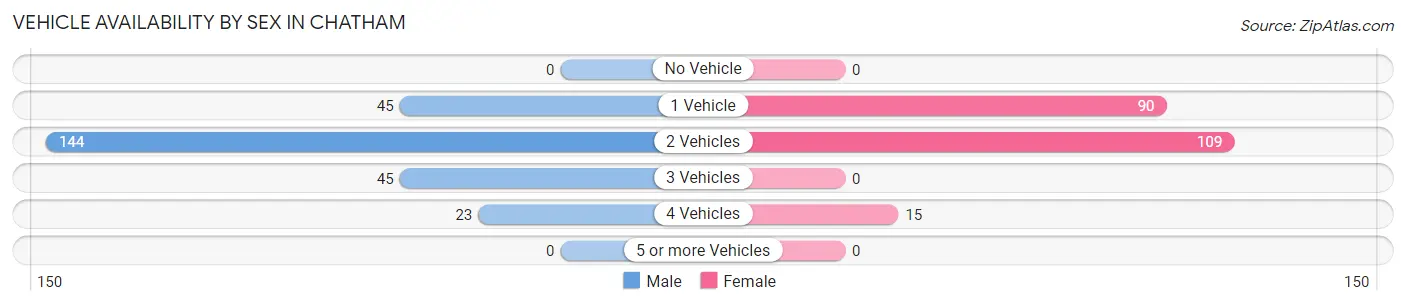
| Vehicles Available | Male | Female |
| No Vehicle | 0 (0.0%) | 0 (0.0%) |
| 1 Vehicle | 45 (17.5%) | 90 (42.1%) |
| 2 Vehicles | 144 (56.0%) | 109 (50.9%) |
| 3 Vehicles | 45 (17.5%) | 0 (0.0%) |
| 4 Vehicles | 23 (8.9%) | 15 (7.0%) |
| 5 or more Vehicles | 0 (0.0%) | 0 (0.0%) |
| Total | 257 (100.0%) | 214 (100.0%) |
Commute Time in Chatham
The most frequently occuring commute durations in Chatham are less than 5 minutes (119 commuters, 28.5%), 15 to 19 minutes (83 commuters, 19.9%), and 10 to 14 minutes (73 commuters, 17.5%).
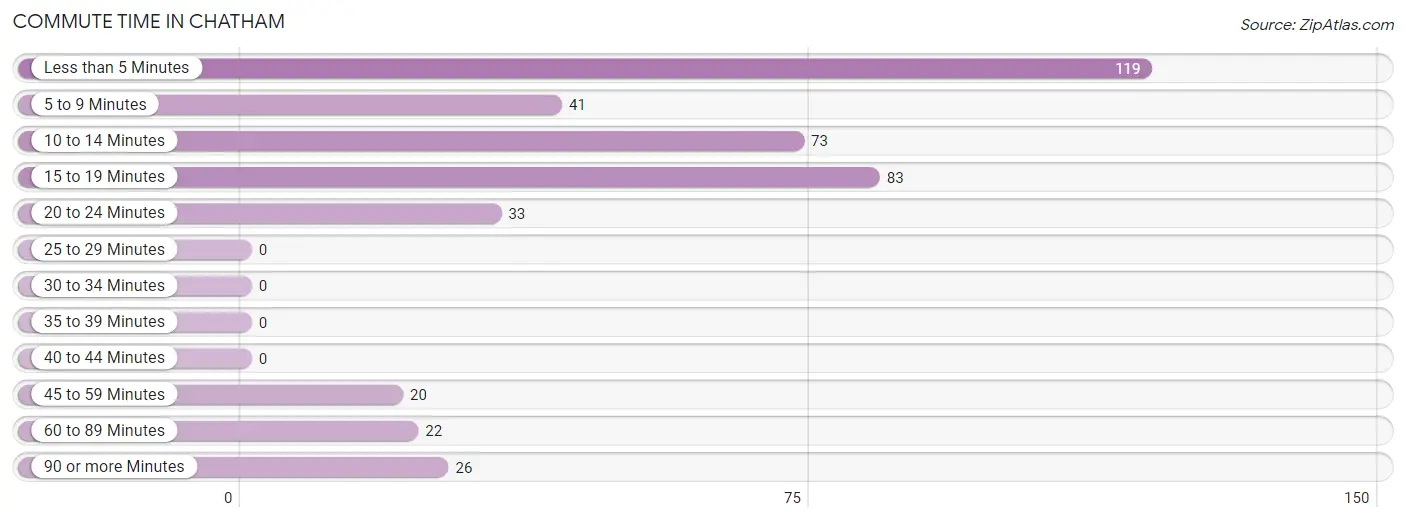
| Commute Time | # Commuters | % Commuters |
| Less than 5 Minutes | 119 | 28.5% |
| 5 to 9 Minutes | 41 | 9.8% |
| 10 to 14 Minutes | 73 | 17.5% |
| 15 to 19 Minutes | 83 | 19.9% |
| 20 to 24 Minutes | 33 | 7.9% |
| 25 to 29 Minutes | 0 | 0.0% |
| 30 to 34 Minutes | 0 | 0.0% |
| 35 to 39 Minutes | 0 | 0.0% |
| 40 to 44 Minutes | 0 | 0.0% |
| 45 to 59 Minutes | 20 | 4.8% |
| 60 to 89 Minutes | 22 | 5.3% |
| 90 or more Minutes | 26 | 6.2% |
Commute Time by Sex in Chatham
The most common commute times in Chatham are less than 5 minutes (62 commuters, 29.0%) for males and 10 to 14 minutes (63 commuters, 31.0%) for females.
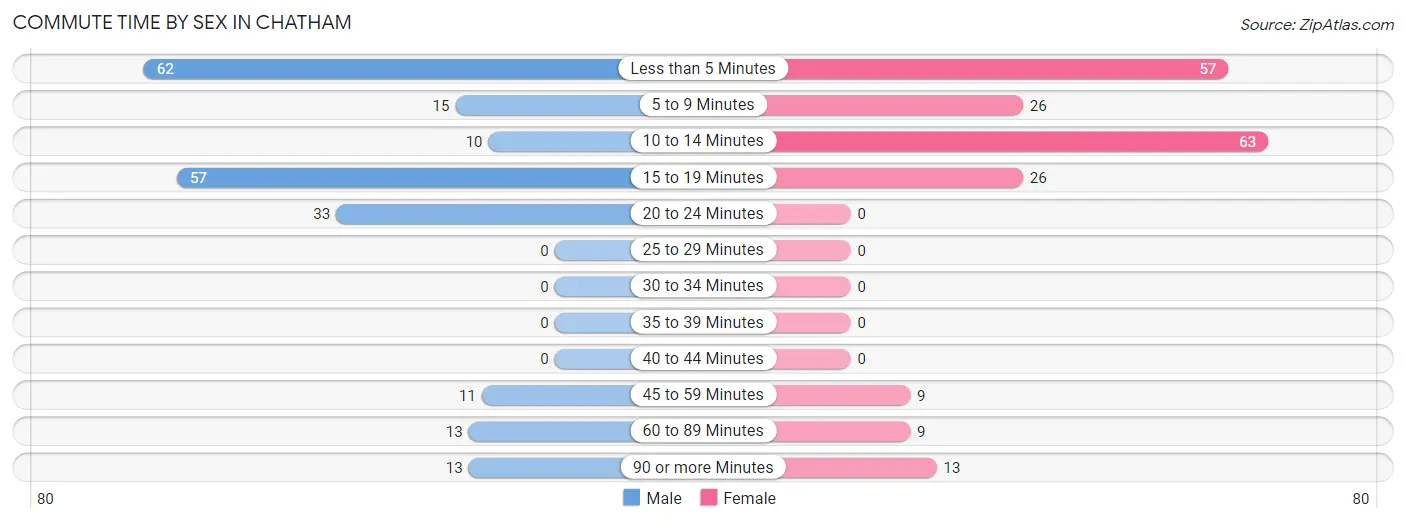
| Commute Time | Male | Female |
| Less than 5 Minutes | 62 (29.0%) | 57 (28.1%) |
| 5 to 9 Minutes | 15 (7.0%) | 26 (12.8%) |
| 10 to 14 Minutes | 10 (4.7%) | 63 (31.0%) |
| 15 to 19 Minutes | 57 (26.6%) | 26 (12.8%) |
| 20 to 24 Minutes | 33 (15.4%) | 0 (0.0%) |
| 25 to 29 Minutes | 0 (0.0%) | 0 (0.0%) |
| 30 to 34 Minutes | 0 (0.0%) | 0 (0.0%) |
| 35 to 39 Minutes | 0 (0.0%) | 0 (0.0%) |
| 40 to 44 Minutes | 0 (0.0%) | 0 (0.0%) |
| 45 to 59 Minutes | 11 (5.1%) | 9 (4.4%) |
| 60 to 89 Minutes | 13 (6.1%) | 9 (4.4%) |
| 90 or more Minutes | 13 (6.1%) | 13 (6.4%) |
Time of Departure to Work by Sex in Chatham
The most frequent times of departure to work in Chatham are 7:00 AM to 7:29 AM (61, 28.5%) for males and 9:00 AM to 9:59 AM (63, 31.0%) for females.
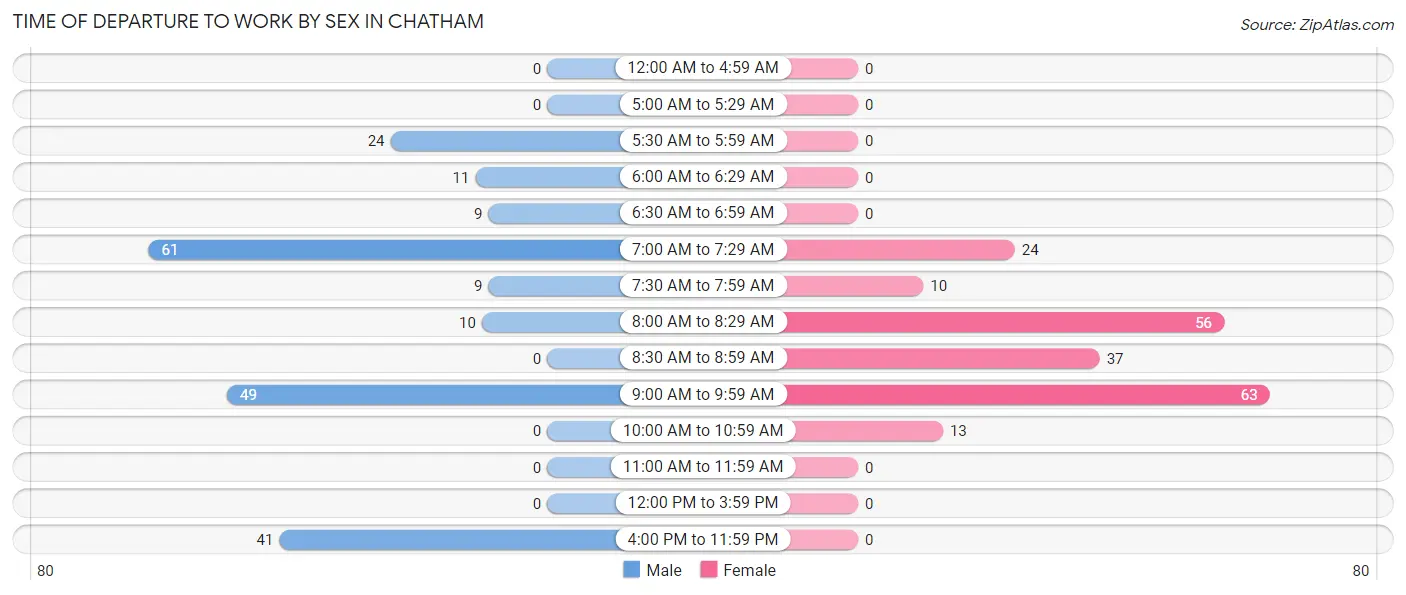
| Time of Departure | Male | Female |
| 12:00 AM to 4:59 AM | 0 (0.0%) | 0 (0.0%) |
| 5:00 AM to 5:29 AM | 0 (0.0%) | 0 (0.0%) |
| 5:30 AM to 5:59 AM | 24 (11.2%) | 0 (0.0%) |
| 6:00 AM to 6:29 AM | 11 (5.1%) | 0 (0.0%) |
| 6:30 AM to 6:59 AM | 9 (4.2%) | 0 (0.0%) |
| 7:00 AM to 7:29 AM | 61 (28.5%) | 24 (11.8%) |
| 7:30 AM to 7:59 AM | 9 (4.2%) | 10 (4.9%) |
| 8:00 AM to 8:29 AM | 10 (4.7%) | 56 (27.6%) |
| 8:30 AM to 8:59 AM | 0 (0.0%) | 37 (18.2%) |
| 9:00 AM to 9:59 AM | 49 (22.9%) | 63 (31.0%) |
| 10:00 AM to 10:59 AM | 0 (0.0%) | 13 (6.4%) |
| 11:00 AM to 11:59 AM | 0 (0.0%) | 0 (0.0%) |
| 12:00 PM to 3:59 PM | 0 (0.0%) | 0 (0.0%) |
| 4:00 PM to 11:59 PM | 41 (19.2%) | 0 (0.0%) |
| Total | 214 (100.0%) | 203 (100.0%) |
Housing Occupancy in Chatham
Occupancy by Ownership in Chatham
Of the total 915 dwellings in Chatham, owner-occupied units account for 744 (81.3%), while renter-occupied units make up 171 (18.7%).
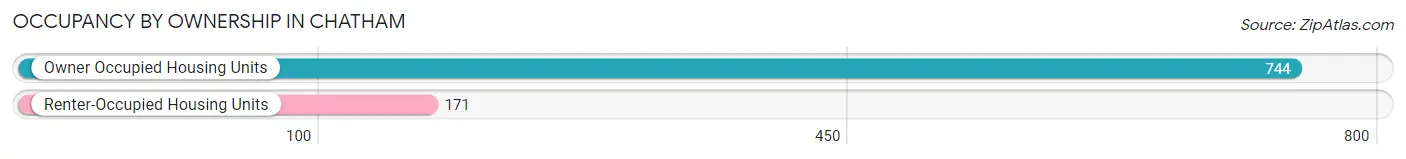
| Occupancy | # Housing Units | % Housing Units |
| Owner Occupied Housing Units | 744 | 81.3% |
| Renter-Occupied Housing Units | 171 | 18.7% |
| Total Occupied Housing Units | 915 | 100.0% |
Occupancy by Household Size in Chatham
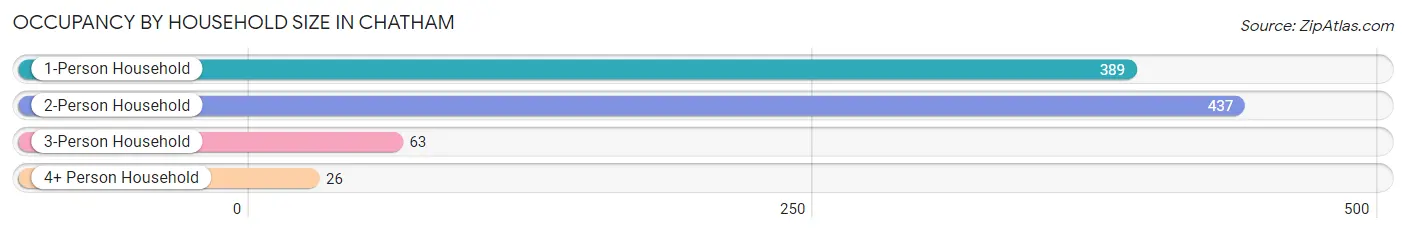
| Household Size | # Housing Units | % Housing Units |
| 1-Person Household | 389 | 42.5% |
| 2-Person Household | 437 | 47.8% |
| 3-Person Household | 63 | 6.9% |
| 4+ Person Household | 26 | 2.8% |
| Total Housing Units | 915 | 100.0% |
Occupancy by Ownership by Household Size in Chatham
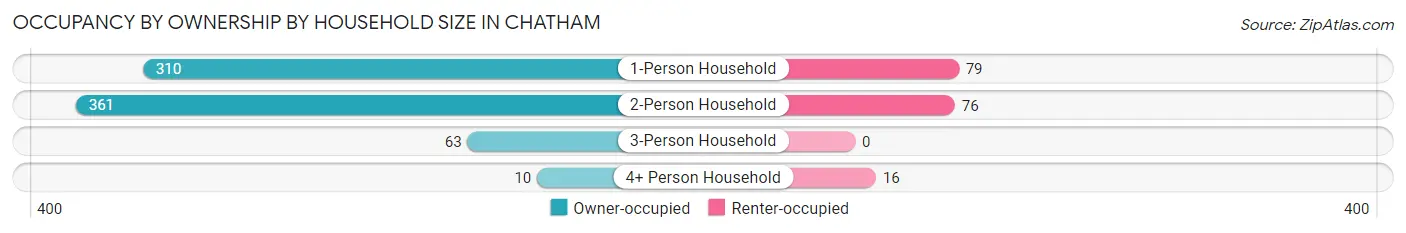
| Household Size | Owner-occupied | Renter-occupied |
| 1-Person Household | 310 (79.7%) | 79 (20.3%) |
| 2-Person Household | 361 (82.6%) | 76 (17.4%) |
| 3-Person Household | 63 (100.0%) | 0 (0.0%) |
| 4+ Person Household | 10 (38.5%) | 16 (61.5%) |
| Total Housing Units | 744 (81.3%) | 171 (18.7%) |
Occupancy by Educational Attainment in Chatham
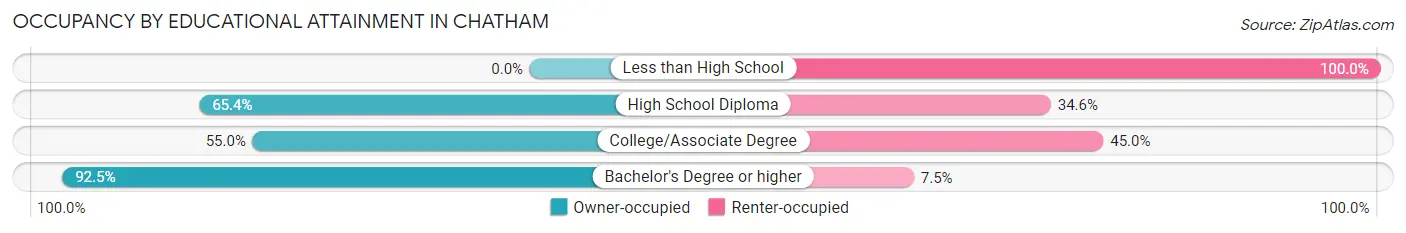
| Household Size | Owner-occupied | Renter-occupied |
| Less than High School | 0 (0.0%) | 11 (100.0%) |
| High School Diploma | 68 (65.4%) | 36 (34.6%) |
| College/Associate Degree | 94 (55.0%) | 77 (45.0%) |
| Bachelor's Degree or higher | 582 (92.5%) | 47 (7.5%) |
Occupancy by Age of Householder in Chatham
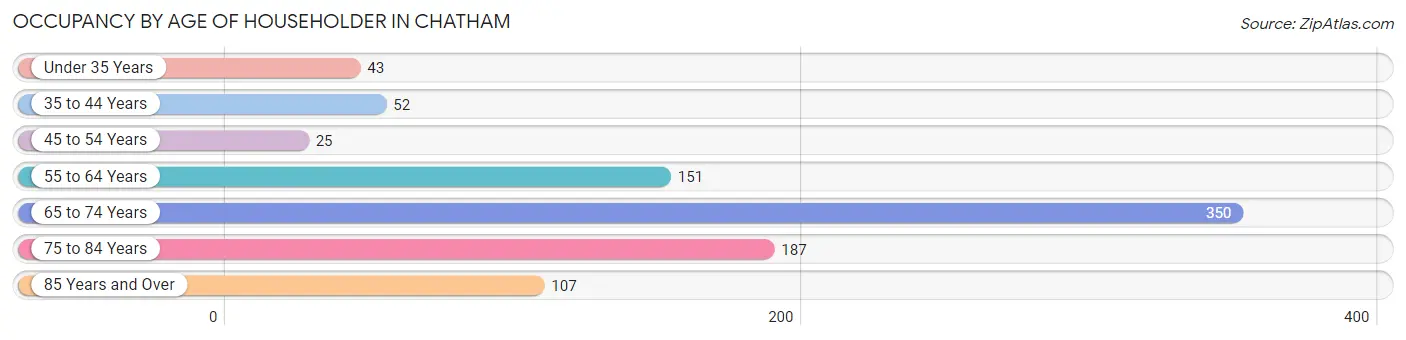
| Age Bracket | # Households | % Households |
| Under 35 Years | 43 | 4.7% |
| 35 to 44 Years | 52 | 5.7% |
| 45 to 54 Years | 25 | 2.7% |
| 55 to 64 Years | 151 | 16.5% |
| 65 to 74 Years | 350 | 38.3% |
| 75 to 84 Years | 187 | 20.4% |
| 85 Years and Over | 107 | 11.7% |
| Total | 915 | 100.0% |
Housing Finances in Chatham
Median Income by Occupancy in Chatham
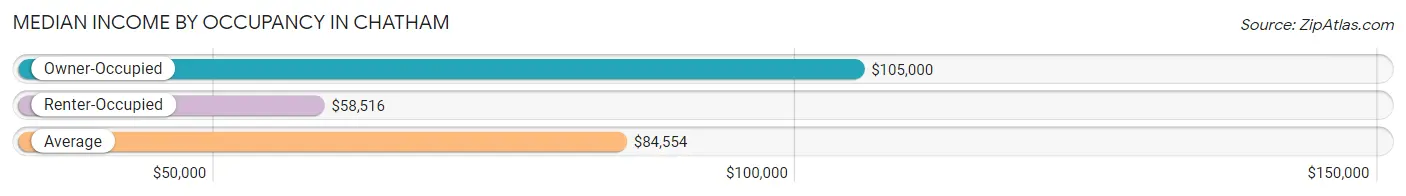
| Occupancy Type | # Households | Median Income |
| Owner-Occupied | 744 (81.3%) | $105,000 |
| Renter-Occupied | 171 (18.7%) | $58,516 |
| Average | 915 (100.0%) | $84,554 |
Occupancy by Householder Income Bracket in Chatham
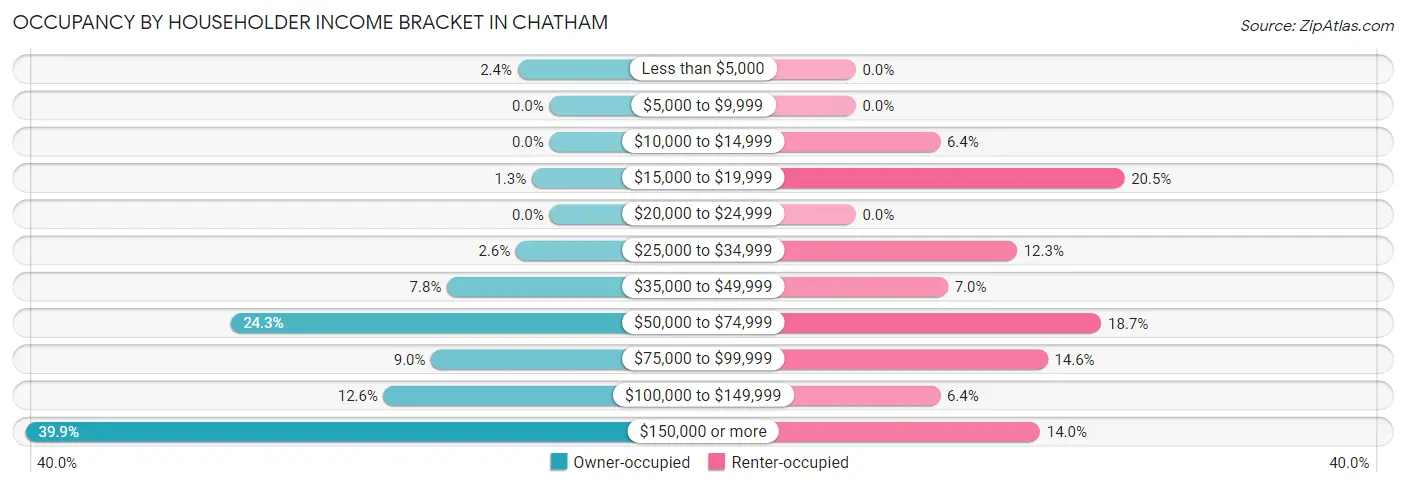
| Income Bracket | Owner-occupied | Renter-occupied |
| Less than $5,000 | 18 (2.4%) | 0 (0.0%) |
| $5,000 to $9,999 | 0 (0.0%) | 0 (0.0%) |
| $10,000 to $14,999 | 0 (0.0%) | 11 (6.4%) |
| $15,000 to $19,999 | 10 (1.3%) | 35 (20.5%) |
| $20,000 to $24,999 | 0 (0.0%) | 0 (0.0%) |
| $25,000 to $34,999 | 19 (2.5%) | 21 (12.3%) |
| $35,000 to $49,999 | 58 (7.8%) | 12 (7.0%) |
| $50,000 to $74,999 | 181 (24.3%) | 32 (18.7%) |
| $75,000 to $99,999 | 67 (9.0%) | 25 (14.6%) |
| $100,000 to $149,999 | 94 (12.6%) | 11 (6.4%) |
| $150,000 or more | 297 (39.9%) | 24 (14.0%) |
| Total | 744 (100.0%) | 171 (100.0%) |
Monthly Housing Cost Tiers in Chatham
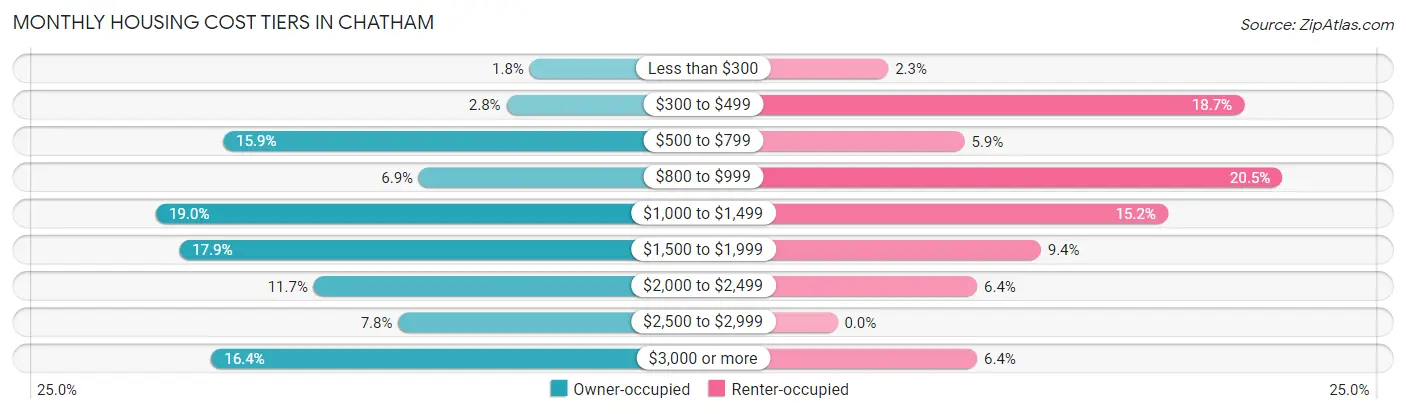
| Monthly Cost | Owner-occupied | Renter-occupied |
| Less than $300 | 13 (1.8%) | 4 (2.3%) |
| $300 to $499 | 21 (2.8%) | 32 (18.7%) |
| $500 to $799 | 118 (15.9%) | 10 (5.9%) |
| $800 to $999 | 51 (6.9%) | 35 (20.5%) |
| $1,000 to $1,499 | 141 (19.0%) | 26 (15.2%) |
| $1,500 to $1,999 | 133 (17.9%) | 16 (9.4%) |
| $2,000 to $2,499 | 87 (11.7%) | 11 (6.4%) |
| $2,500 to $2,999 | 58 (7.8%) | 0 (0.0%) |
| $3,000 or more | 122 (16.4%) | 11 (6.4%) |
| Total | 744 (100.0%) | 171 (100.0%) |
Physical Housing Characteristics in Chatham
Housing Structures in Chatham
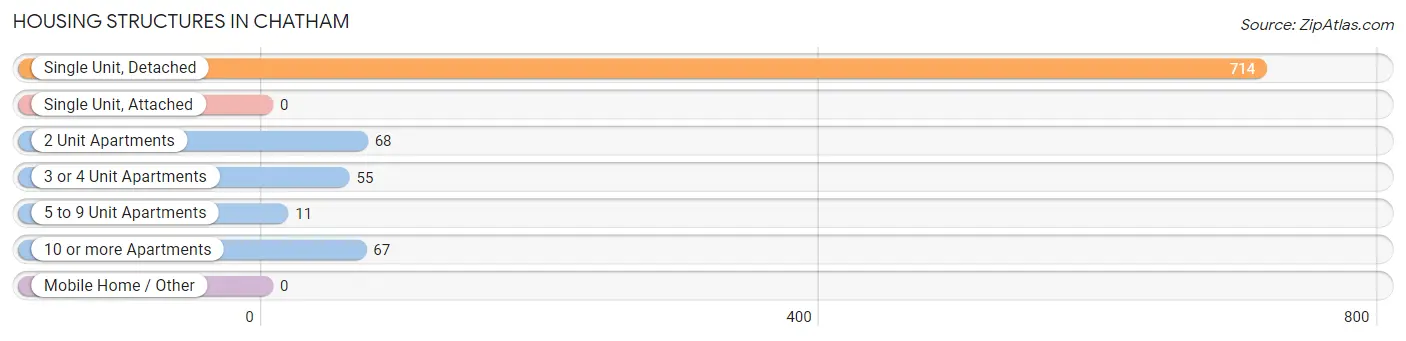
| Structure Type | # Housing Units | % Housing Units |
| Single Unit, Detached | 714 | 78.0% |
| Single Unit, Attached | 0 | 0.0% |
| 2 Unit Apartments | 68 | 7.4% |
| 3 or 4 Unit Apartments | 55 | 6.0% |
| 5 to 9 Unit Apartments | 11 | 1.2% |
| 10 or more Apartments | 67 | 7.3% |
| Mobile Home / Other | 0 | 0.0% |
| Total | 915 | 100.0% |
Housing Structures by Occupancy in Chatham
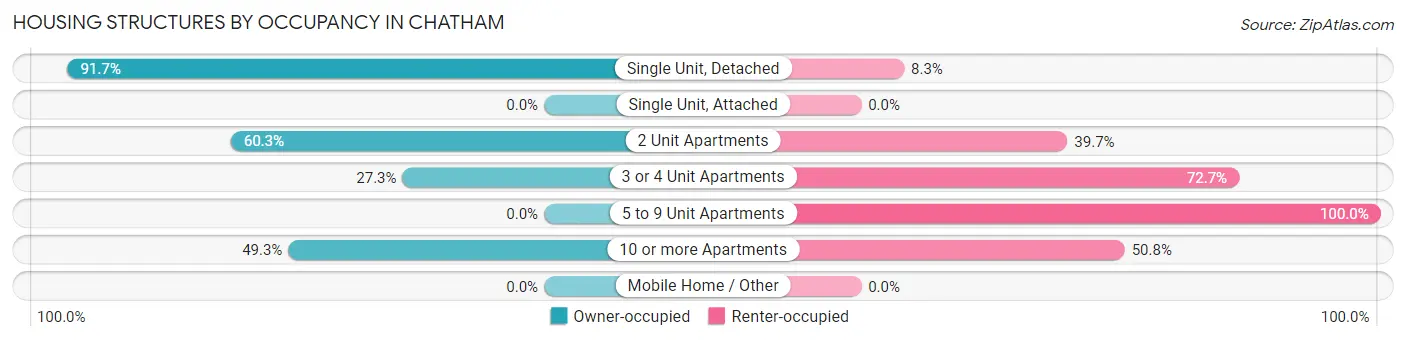
| Structure Type | Owner-occupied | Renter-occupied |
| Single Unit, Detached | 655 (91.7%) | 59 (8.3%) |
| Single Unit, Attached | 0 (0.0%) | 0 (0.0%) |
| 2 Unit Apartments | 41 (60.3%) | 27 (39.7%) |
| 3 or 4 Unit Apartments | 15 (27.3%) | 40 (72.7%) |
| 5 to 9 Unit Apartments | 0 (0.0%) | 11 (100.0%) |
| 10 or more Apartments | 33 (49.2%) | 34 (50.7%) |
| Mobile Home / Other | 0 (0.0%) | 0 (0.0%) |
| Total | 744 (81.3%) | 171 (18.7%) |
Housing Structures by Number of Rooms in Chatham
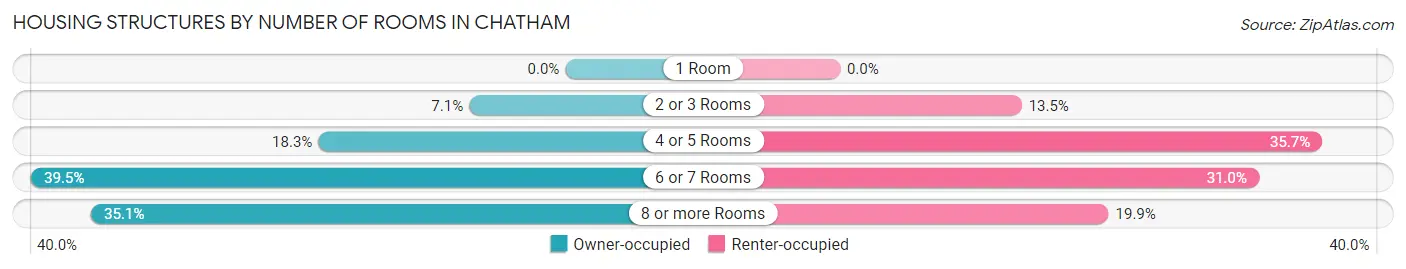
| Number of Rooms | Owner-occupied | Renter-occupied |
| 1 Room | 0 (0.0%) | 0 (0.0%) |
| 2 or 3 Rooms | 53 (7.1%) | 23 (13.5%) |
| 4 or 5 Rooms | 136 (18.3%) | 61 (35.7%) |
| 6 or 7 Rooms | 294 (39.5%) | 53 (31.0%) |
| 8 or more Rooms | 261 (35.1%) | 34 (19.9%) |
| Total | 744 (100.0%) | 171 (100.0%) |
Housing Structure by Heating Type in Chatham
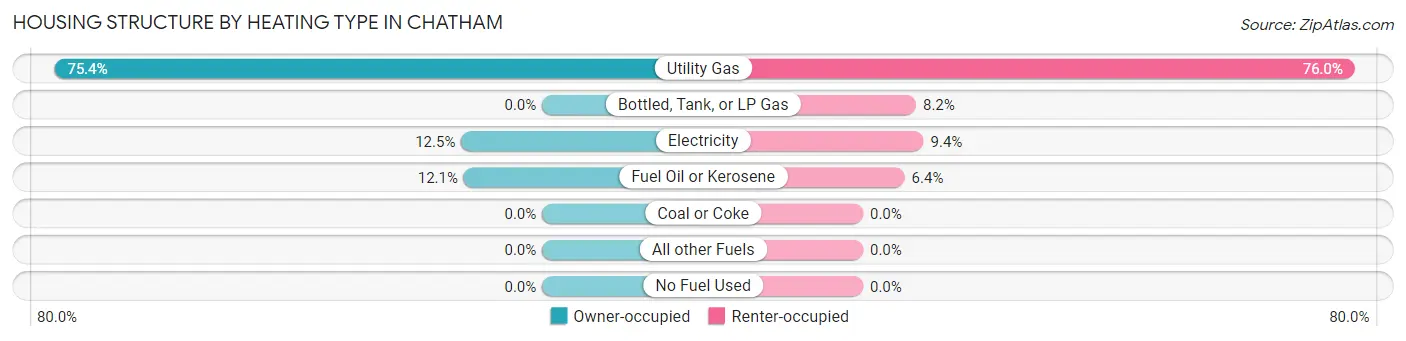
| Heating Type | Owner-occupied | Renter-occupied |
| Utility Gas | 561 (75.4%) | 130 (76.0%) |
| Bottled, Tank, or LP Gas | 0 (0.0%) | 14 (8.2%) |
| Electricity | 93 (12.5%) | 16 (9.4%) |
| Fuel Oil or Kerosene | 90 (12.1%) | 11 (6.4%) |
| Coal or Coke | 0 (0.0%) | 0 (0.0%) |
| All other Fuels | 0 (0.0%) | 0 (0.0%) |
| No Fuel Used | 0 (0.0%) | 0 (0.0%) |
| Total | 744 (100.0%) | 171 (100.0%) |
Household Vehicle Usage in Chatham
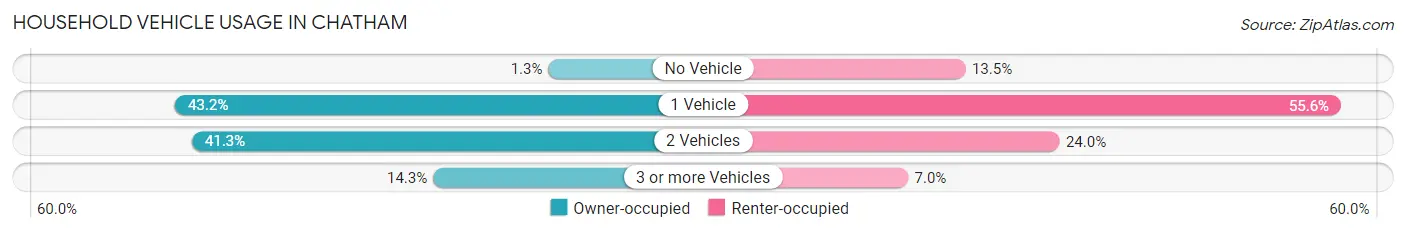
| Vehicles per Household | Owner-occupied | Renter-occupied |
| No Vehicle | 10 (1.3%) | 23 (13.5%) |
| 1 Vehicle | 321 (43.1%) | 95 (55.6%) |
| 2 Vehicles | 307 (41.3%) | 41 (24.0%) |
| 3 or more Vehicles | 106 (14.2%) | 12 (7.0%) |
| Total | 744 (100.0%) | 171 (100.0%) |
Real Estate & Mortgages in Chatham
Real Estate and Mortgage Overview in Chatham
| Characteristic | Without Mortgage | With Mortgage |
| Housing Units | 487 | 257 |
| Median Property Value | $1,419,600 | $1,041,700 |
| Median Household Income | $79,542 | $104 |
| Monthly Housing Costs | $1,128 | $122 |
| Real Estate Taxes | $5,519 | $0 |
Property Value by Mortgage Status in Chatham
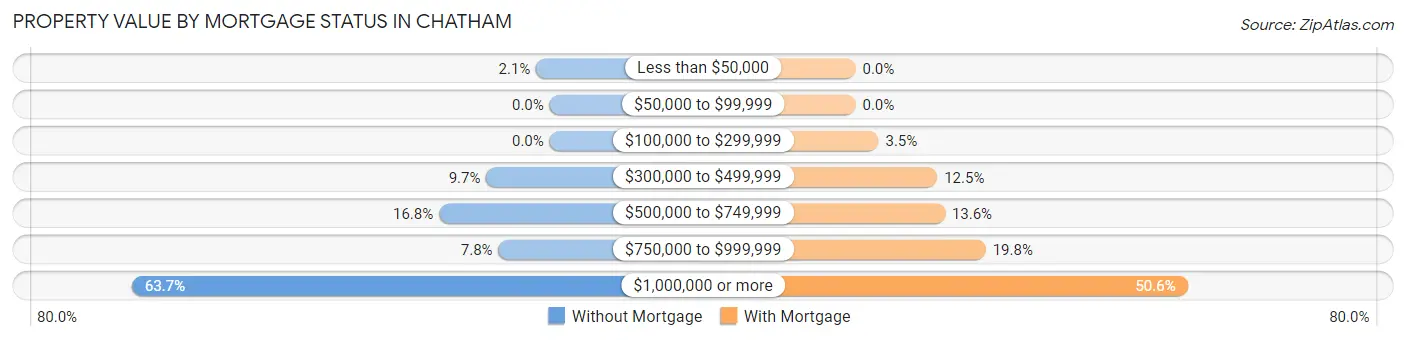
| Property Value | Without Mortgage | With Mortgage |
| Less than $50,000 | 10 (2.1%) | 0 (0.0%) |
| $50,000 to $99,999 | 0 (0.0%) | 0 (0.0%) |
| $100,000 to $299,999 | 0 (0.0%) | 9 (3.5%) |
| $300,000 to $499,999 | 47 (9.7%) | 32 (12.4%) |
| $500,000 to $749,999 | 82 (16.8%) | 35 (13.6%) |
| $750,000 to $999,999 | 38 (7.8%) | 51 (19.8%) |
| $1,000,000 or more | 310 (63.7%) | 130 (50.6%) |
| Total | 487 (100.0%) | 257 (100.0%) |
Household Income by Mortgage Status in Chatham
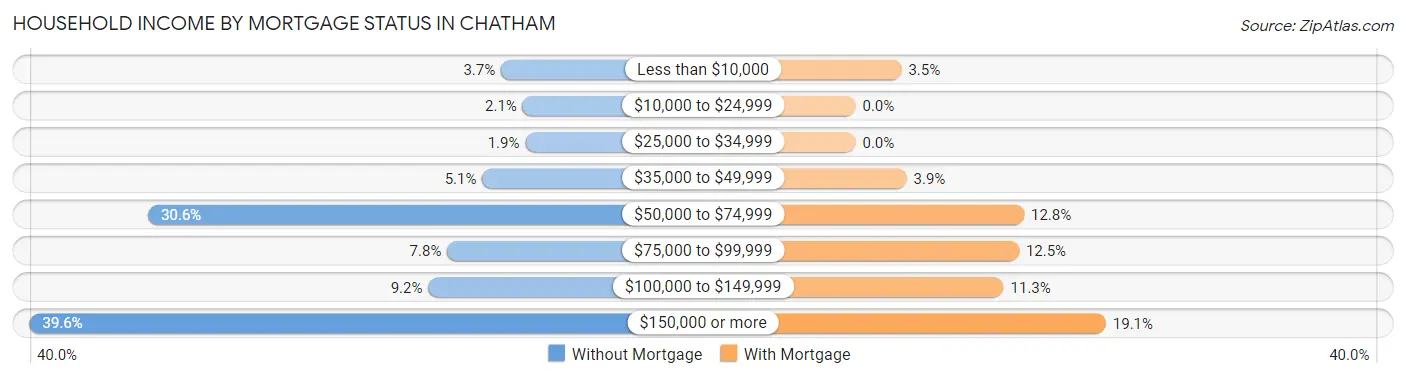
| Household Income | Without Mortgage | With Mortgage |
| Less than $10,000 | 18 (3.7%) | 9 (3.5%) |
| $10,000 to $24,999 | 10 (2.1%) | 0 (0.0%) |
| $25,000 to $34,999 | 9 (1.8%) | 0 (0.0%) |
| $35,000 to $49,999 | 25 (5.1%) | 10 (3.9%) |
| $50,000 to $74,999 | 149 (30.6%) | 33 (12.8%) |
| $75,000 to $99,999 | 38 (7.8%) | 32 (12.4%) |
| $100,000 to $149,999 | 45 (9.2%) | 29 (11.3%) |
| $150,000 or more | 193 (39.6%) | 49 (19.1%) |
| Total | 487 (100.0%) | 257 (100.0%) |
Property Value to Household Income Ratio in Chatham
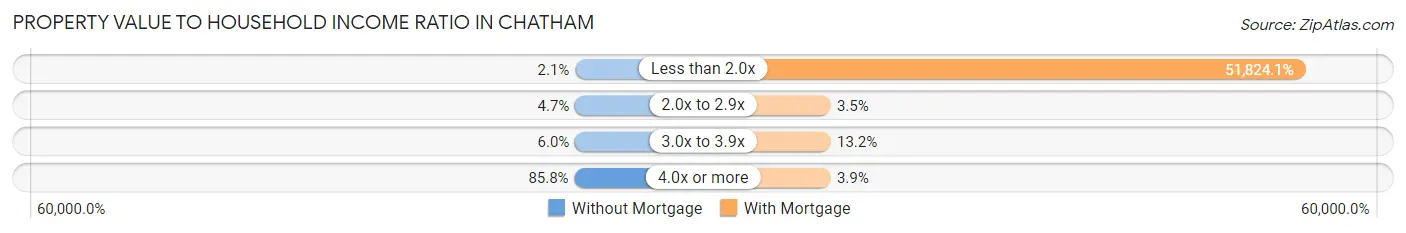
| Value-to-Income Ratio | Without Mortgage | With Mortgage |
| Less than 2.0x | 10 (2.1%) | 133,188 (51,824.1%) |
| 2.0x to 2.9x | 23 (4.7%) | 9 (3.5%) |
| 3.0x to 3.9x | 29 (5.9%) | 34 (13.2%) |
| 4.0x or more | 418 (85.8%) | 10 (3.9%) |
| Total | 487 (100.0%) | 257 (100.0%) |
Real Estate Taxes by Mortgage Status in Chatham
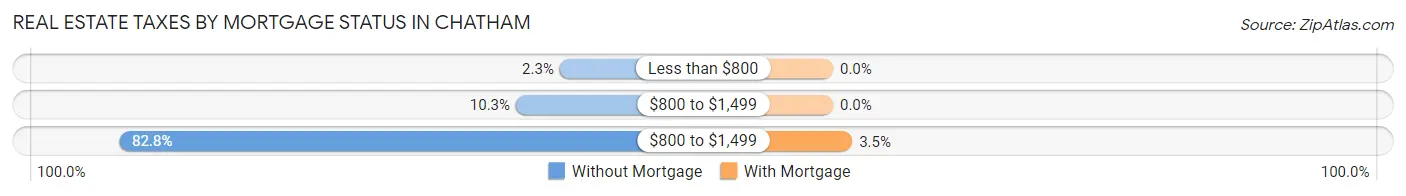
| Property Taxes | Without Mortgage | With Mortgage |
| Less than $800 | 11 (2.3%) | 0 (0.0%) |
| $800 to $1,499 | 50 (10.3%) | 0 (0.0%) |
| $800 to $1,499 | 403 (82.8%) | 9 (3.5%) |
| Total | 487 (100.0%) | 257 (100.0%) |
Health & Disability in Chatham
Health Insurance Coverage by Age in Chatham
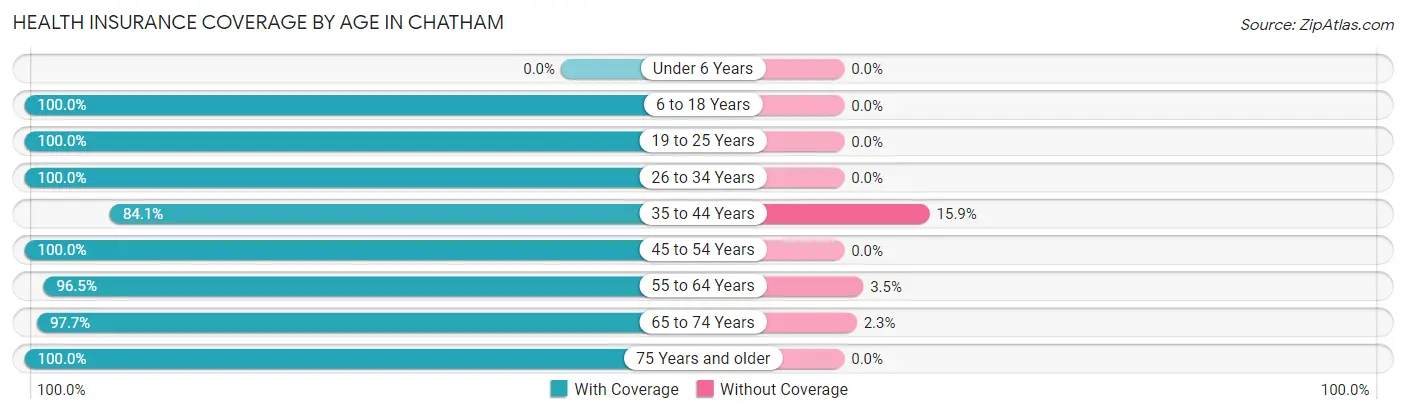
| Age Bracket | With Coverage | Without Coverage |
| Under 6 Years | 0 (0.0%) | 0 (0.0%) |
| 6 to 18 Years | 133 (100.0%) | 0 (0.0%) |
| 19 to 25 Years | 56 (100.0%) | 0 (0.0%) |
| 26 to 34 Years | 87 (100.0%) | 0 (0.0%) |
| 35 to 44 Years | 74 (84.1%) | 14 (15.9%) |
| 45 to 54 Years | 48 (100.0%) | 0 (0.0%) |
| 55 to 64 Years | 273 (96.5%) | 10 (3.5%) |
| 65 to 74 Years | 466 (97.7%) | 11 (2.3%) |
| 75 Years and older | 448 (100.0%) | 0 (0.0%) |
| Total | 1,585 (97.8%) | 35 (2.2%) |
Health Insurance Coverage by Citizenship Status in Chatham
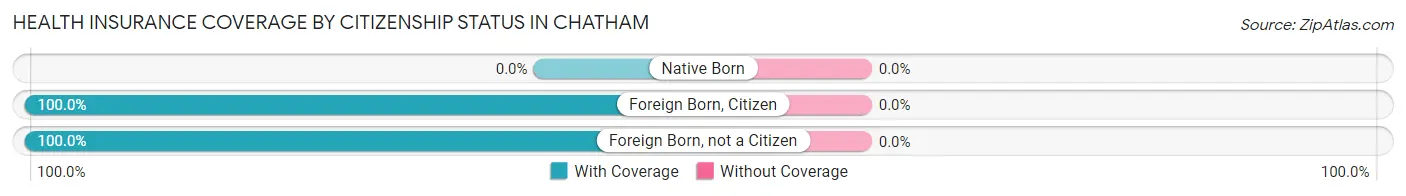
| Citizenship Status | With Coverage | Without Coverage |
| Native Born | 0 (0.0%) | 0 (0.0%) |
| Foreign Born, Citizen | 133 (100.0%) | 0 (0.0%) |
| Foreign Born, not a Citizen | 56 (100.0%) | 0 (0.0%) |
Health Insurance Coverage by Household Income in Chatham
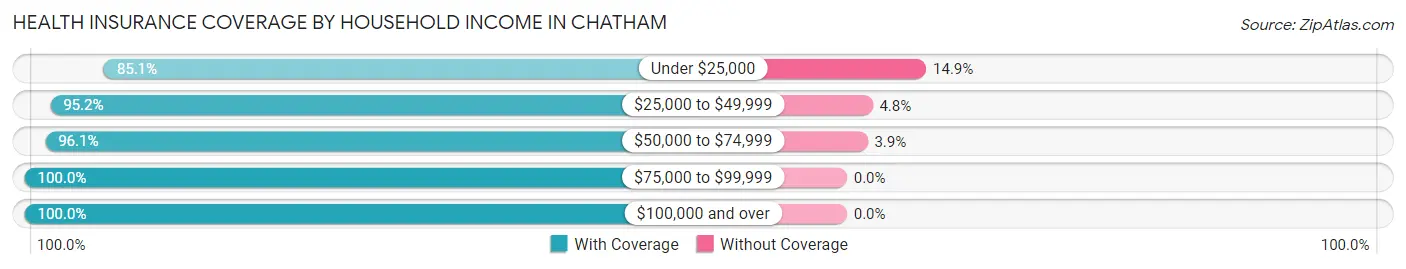
| Household Income | With Coverage | Without Coverage |
| Under $25,000 | 63 (85.1%) | 11 (14.9%) |
| $25,000 to $49,999 | 198 (95.2%) | 10 (4.8%) |
| $50,000 to $74,999 | 348 (96.1%) | 14 (3.9%) |
| $75,000 to $99,999 | 198 (100.0%) | 0 (0.0%) |
| $100,000 and over | 778 (100.0%) | 0 (0.0%) |
Public vs Private Health Insurance Coverage by Age in Chatham
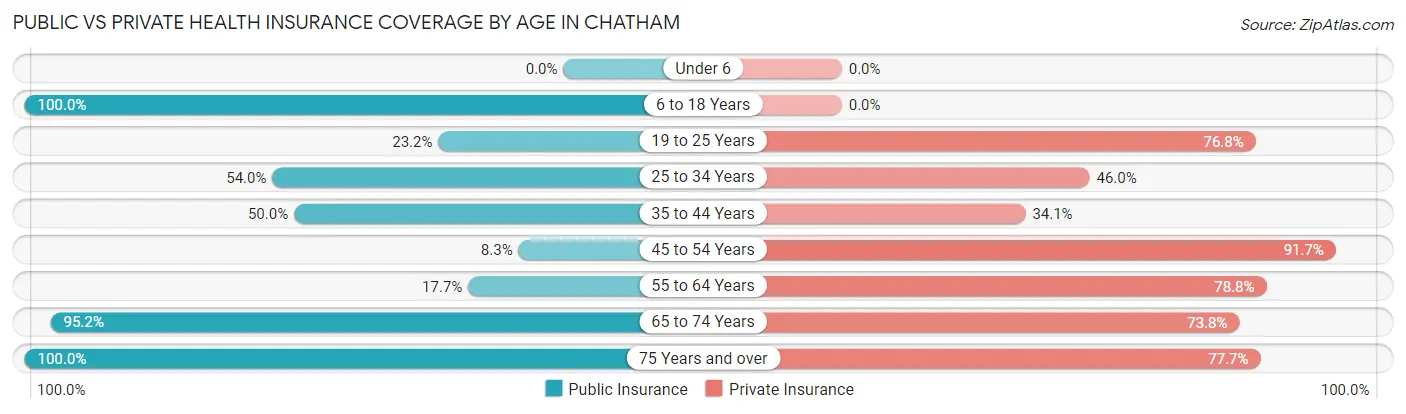
| Age Bracket | Public Insurance | Private Insurance |
| Under 6 | 0 (0.0%) | 0 (0.0%) |
| 6 to 18 Years | 133 (100.0%) | 0 (0.0%) |
| 19 to 25 Years | 13 (23.2%) | 43 (76.8%) |
| 25 to 34 Years | 47 (54.0%) | 40 (46.0%) |
| 35 to 44 Years | 44 (50.0%) | 30 (34.1%) |
| 45 to 54 Years | 4 (8.3%) | 44 (91.7%) |
| 55 to 64 Years | 50 (17.7%) | 223 (78.8%) |
| 65 to 74 Years | 454 (95.2%) | 352 (73.8%) |
| 75 Years and over | 448 (100.0%) | 348 (77.7%) |
| Total | 1,193 (73.6%) | 1,080 (66.7%) |
Disability Status by Sex by Age in Chatham
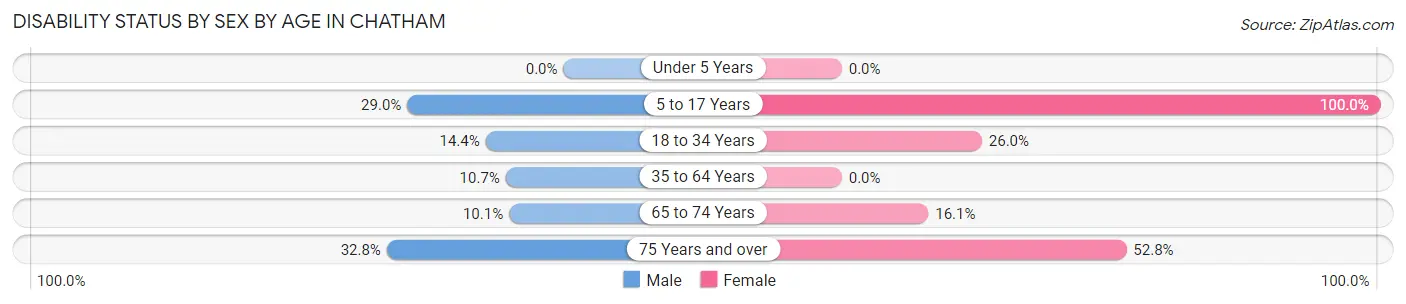
| Age Bracket | Male | Female |
| Under 5 Years | 0 (0.0%) | 0 (0.0%) |
| 5 to 17 Years | 20 (29.0%) | 17 (100.0%) |
| 18 to 34 Years | 13 (14.4%) | 26 (26.0%) |
| 35 to 64 Years | 21 (10.7%) | 0 (0.0%) |
| 65 to 74 Years | 23 (10.1%) | 40 (16.1%) |
| 75 Years and over | 60 (32.8%) | 140 (52.8%) |
Disability Class by Sex by Age in Chatham
Disability Class: Hearing Difficulty
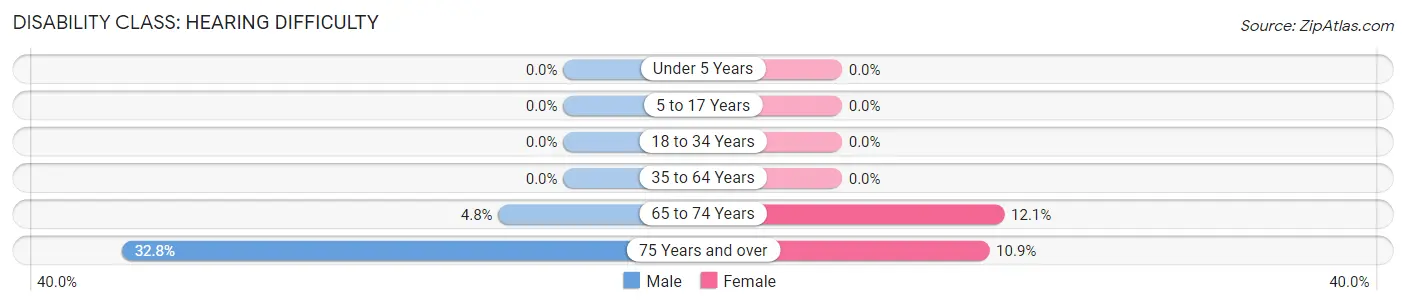
| Age Bracket | Male | Female |
| Under 5 Years | 0 (0.0%) | 0 (0.0%) |
| 5 to 17 Years | 0 (0.0%) | 0 (0.0%) |
| 18 to 34 Years | 0 (0.0%) | 0 (0.0%) |
| 35 to 64 Years | 0 (0.0%) | 0 (0.0%) |
| 65 to 74 Years | 11 (4.8%) | 30 (12.0%) |
| 75 Years and over | 60 (32.8%) | 29 (10.9%) |
Disability Class: Vision Difficulty
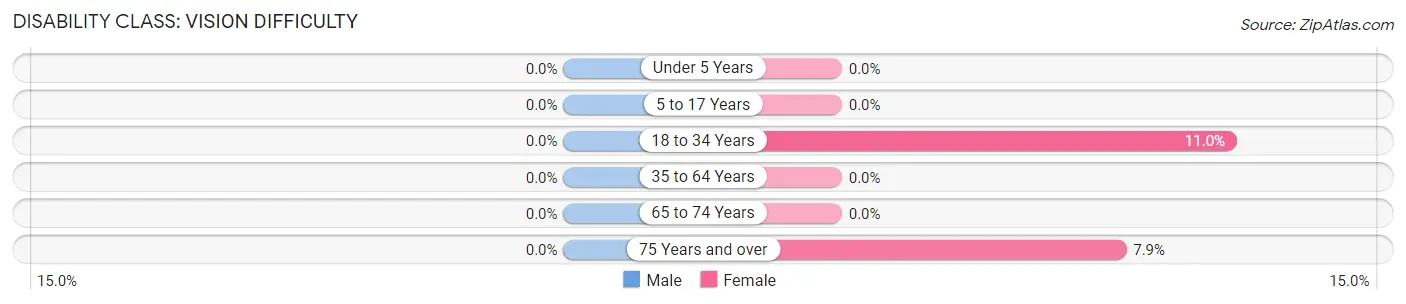
| Age Bracket | Male | Female |
| Under 5 Years | 0 (0.0%) | 0 (0.0%) |
| 5 to 17 Years | 0 (0.0%) | 0 (0.0%) |
| 18 to 34 Years | 0 (0.0%) | 11 (11.0%) |
| 35 to 64 Years | 0 (0.0%) | 0 (0.0%) |
| 65 to 74 Years | 0 (0.0%) | 0 (0.0%) |
| 75 Years and over | 0 (0.0%) | 21 (7.9%) |
Disability Class: Cognitive Difficulty
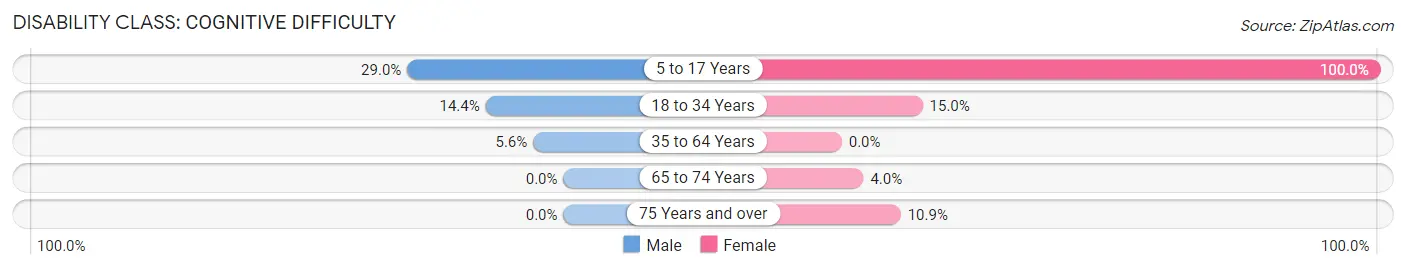
| Age Bracket | Male | Female |
| 5 to 17 Years | 20 (29.0%) | 17 (100.0%) |
| 18 to 34 Years | 13 (14.4%) | 15 (15.0%) |
| 35 to 64 Years | 11 (5.6%) | 0 (0.0%) |
| 65 to 74 Years | 0 (0.0%) | 10 (4.0%) |
| 75 Years and over | 0 (0.0%) | 29 (10.9%) |
Disability Class: Ambulatory Difficulty
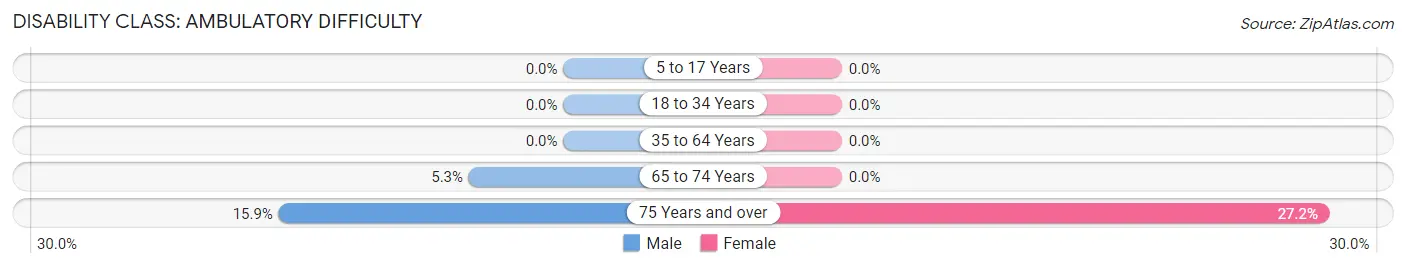
| Age Bracket | Male | Female |
| 5 to 17 Years | 0 (0.0%) | 0 (0.0%) |
| 18 to 34 Years | 0 (0.0%) | 0 (0.0%) |
| 35 to 64 Years | 0 (0.0%) | 0 (0.0%) |
| 65 to 74 Years | 12 (5.3%) | 0 (0.0%) |
| 75 Years and over | 29 (15.9%) | 72 (27.2%) |
Disability Class: Self-Care Difficulty
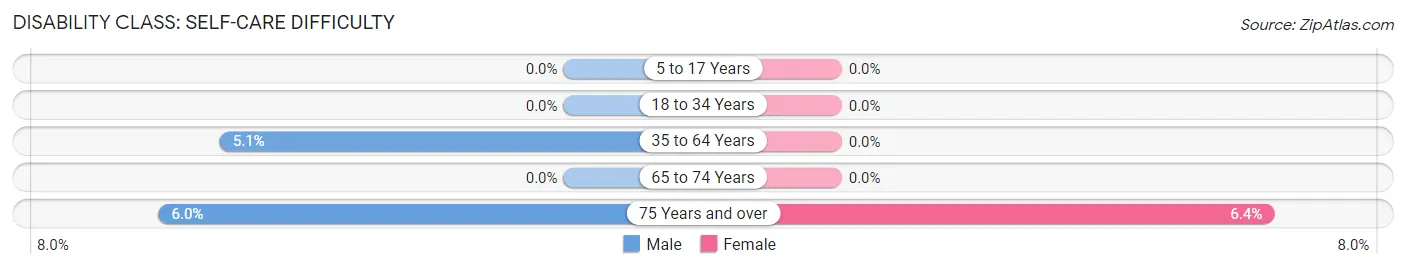
| Age Bracket | Male | Female |
| 5 to 17 Years | 0 (0.0%) | 0 (0.0%) |
| 18 to 34 Years | 0 (0.0%) | 0 (0.0%) |
| 35 to 64 Years | 10 (5.1%) | 0 (0.0%) |
| 65 to 74 Years | 0 (0.0%) | 0 (0.0%) |
| 75 Years and over | 11 (6.0%) | 17 (6.4%) |
Technology Access in Chatham
Computing Device Access in Chatham
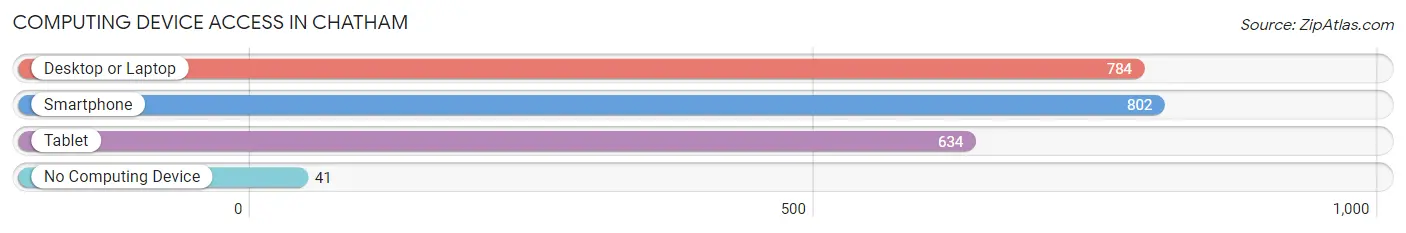
| Device Type | # Households | % Households |
| Desktop or Laptop | 784 | 85.7% |
| Smartphone | 802 | 87.6% |
| Tablet | 634 | 69.3% |
| No Computing Device | 41 | 4.5% |
| Total | 915 | 100.0% |
Internet Access in Chatham
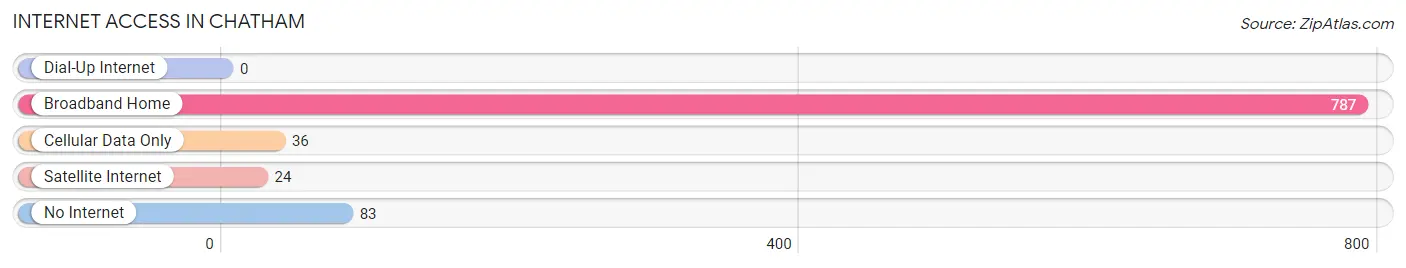
| Internet Type | # Households | % Households |
| Dial-Up Internet | 0 | 0.0% |
| Broadband Home | 787 | 86.0% |
| Cellular Data Only | 36 | 3.9% |
| Satellite Internet | 24 | 2.6% |
| No Internet | 83 | 9.1% |
| Total | 915 | 100.0% |
Chatham Summary
Chatham is a town located in Barnstable County, Massachusetts, United States. It is located on the south side of Cape Cod, and is bordered by Harwich to the west, Orleans to the north, and Brewster to the east. The town is known for its beautiful beaches, fishing, and other recreational activities.
History
Chatham was first settled in 1656 by a group of English settlers from the Plymouth Colony. The town was originally known as Monomoit, and was part of the town of Harwich. In 1712, the town was officially incorporated as Chatham, named after the Earl of Chatham, William Pitt.
In the late 1700s, Chatham became a popular summer destination for wealthy Bostonians. The town was known for its beautiful beaches, fishing, and other recreational activities. In the early 1800s, the town became a major whaling port, and the industry provided much of the town’s income.
In the late 1800s, the town began to decline as the whaling industry declined. The town’s economy shifted to fishing and tourism, and the town began to attract more visitors. In the early 1900s, the town began to develop into a popular summer destination for wealthy Bostonians.
Geography
Chatham is located on the south side of Cape Cod, and is bordered by Harwich to the west, Orleans to the north, and Brewster to the east. The town is located on the Atlantic Ocean, and is known for its beautiful beaches and coastal scenery. The town is also home to several ponds, including Ryder’s Pond, Mill Pond, and Oyster Pond.
The town has a total area of 28.2 square miles, of which 25.2 square miles is land and 3.0 square miles is water. The town is located in a temperate climate, with warm summers and mild winters.
Economy
The economy of Chatham is largely based on tourism and fishing. The town is known for its beautiful beaches, fishing, and other recreational activities. The town is also home to several seafood restaurants, as well as a number of art galleries and shops.
The town is also home to several businesses, including a number of boat builders, a marina, and a number of other businesses. The town is also home to a number of small businesses, including a number of restaurants, shops, and other businesses.
Demographics
As of the 2010 census, the town had a population of 2,127. The racial makeup of the town was 97.2% White, 0.7% African American, 0.3% Native American, 0.4% Asian, 0.1% Pacific Islander, 0.2% from other races, and 1.1% from two or more races. Hispanic or Latino of any race were 1.2% of the population.
The median income for a household in the town was $62,917, and the median income for a family was $76,250. The per capita income for the town was $37,945. About 5.2% of families and 8.2% of the population were below the poverty line, including 10.2% of those under age 18 and 4.2% of those age 65 or over.
Common Questions
What is Per Capita Income in Chatham?
Per Capita income in Chatham is $88,295.
What is the Median Family Income in Chatham?
Median Family Income in Chatham is $122,214.
What is the Median Household income in Chatham?
Median Household Income in Chatham is $84,554.
What is Income or Wage Gap in Chatham?
Income or Wage Gap in Chatham is 38.7%.
Women in Chatham earn 61.3 cents for every dollar earned by a man.
What is Inequality or Gini Index in Chatham?
Inequality or Gini Index in Chatham is 0.50.
What is the Total Population of Chatham?
Total Population of Chatham is 1,637.
What is the Total Male Population of Chatham?
Total Male Population of Chatham is 783.
What is the Total Female Population of Chatham?
Total Female Population of Chatham is 854.
What is the Ratio of Males per 100 Females in Chatham?
There are 91.69 Males per 100 Females in Chatham.
What is the Ratio of Females per 100 Males in Chatham?
There are 109.07 Females per 100 Males in Chatham.
What is the Median Population Age in Chatham?
Median Population Age in Chatham is 67.8 Years.
What is the Average Family Size in Chatham
Average Family Size in Chatham is 2.3 People.
What is the Average Household Size in Chatham
Average Household Size in Chatham is 1.8 People.
How Large is the Labor Force in Chatham?
There are 549 People in the Labor Forcein in Chatham.
What is the Percentage of People in the Labor Force in Chatham?
34.3% of People are in the Labor Force in Chatham.
What is the Unemployment Rate in Chatham?
Unemployment Rate in Chatham is 8.6%.