Nahant, MA Map & Demographics
Nahant Map
Nahant Overview
$78,467
PER CAPITA INCOME
$140,625
AVG FAMILY INCOME
$105,867
AVG HOUSEHOLD INCOME
6.0%
WAGE / INCOME GAP [ % ]
94.0¢/ $1
WAGE / INCOME GAP [ $ ]
0.51
INEQUALITY / GINI INDEX
3,336
TOTAL POPULATION
1,519
MALE POPULATION
1,817
FEMALE POPULATION
83.60
MALES / 100 FEMALES
119.62
FEMALES / 100 MALES
58.1
MEDIAN AGE
2.7
AVG FAMILY SIZE
2.0
AVG HOUSEHOLD SIZE
1,971
LABOR FORCE [ PEOPLE ]
65.5%
PERCENT IN LABOR FORCE
4.2%
UNEMPLOYMENT RATE
Nahant Zip Codes
Income in Nahant
Income Overview in Nahant
Per Capita Income in Nahant is $78,467, while median incomes of families and households are $140,625 and $105,867 respectively.
| Characteristic | Number | Measure |
| Per Capita Income | 3,336 | $78,467 |
| Median Family Income | 922 | $140,625 |
| Mean Family Income | 922 | $202,391 |
| Median Household Income | 1,626 | $105,867 |
| Mean Household Income | 1,626 | $159,011 |
| Income Deficit | 922 | $0 |
| Wage / Income Gap (%) | 3,336 | 6.00% |
| Wage / Income Gap ($) | 3,336 | 94.00¢ per $1 |
| Gini / Inequality Index | 3,336 | 0.51 |
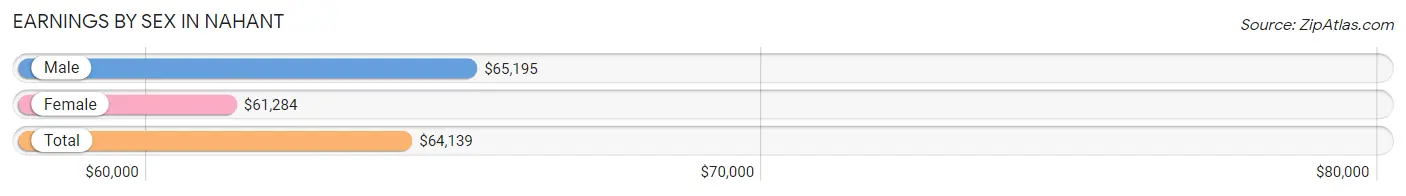
Earnings by Sex in Nahant
Average Earnings in Nahant are $64,139, $65,195 for men and $61,284 for women, a difference of 6.0%.
| Sex | Number | Average Earnings |
| Male | 951 (47.2%) | $65,195 |
| Female | 1,062 (52.8%) | $61,284 |
| Total | 2,013 (100.0%) | $64,139 |
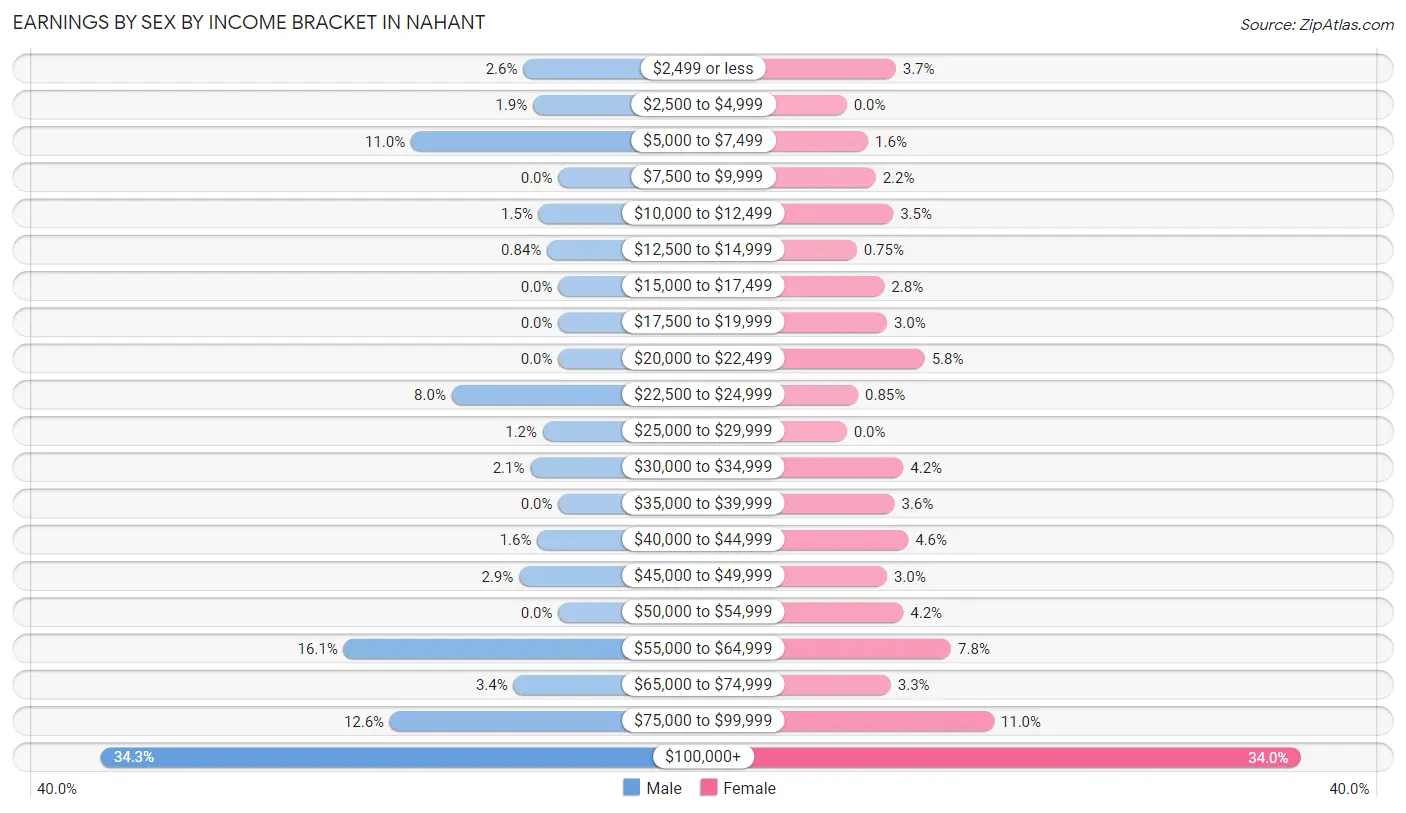
Earnings by Sex by Income Bracket in Nahant
The most common earnings brackets in Nahant are $100,000+ for men (326 | 34.3%) and $100,000+ for women (361 | 34.0%).
| Income | Male | Female |
| $2,499 or less | 25 (2.6%) | 39 (3.7%) |
| $2,500 to $4,999 | 18 (1.9%) | 0 (0.0%) |
| $5,000 to $7,499 | 105 (11.0%) | 17 (1.6%) |
| $7,500 to $9,999 | 0 (0.0%) | 23 (2.2%) |
| $10,000 to $12,499 | 14 (1.5%) | 37 (3.5%) |
| $12,500 to $14,999 | 8 (0.8%) | 8 (0.7%) |
| $15,000 to $17,499 | 0 (0.0%) | 30 (2.8%) |
| $17,500 to $19,999 | 0 (0.0%) | 32 (3.0%) |
| $20,000 to $22,499 | 0 (0.0%) | 62 (5.8%) |
| $22,500 to $24,999 | 76 (8.0%) | 9 (0.9%) |
| $25,000 to $29,999 | 11 (1.2%) | 0 (0.0%) |
| $30,000 to $34,999 | 20 (2.1%) | 45 (4.2%) |
| $35,000 to $39,999 | 0 (0.0%) | 38 (3.6%) |
| $40,000 to $44,999 | 15 (1.6%) | 49 (4.6%) |
| $45,000 to $49,999 | 28 (2.9%) | 32 (3.0%) |
| $50,000 to $54,999 | 0 (0.0%) | 45 (4.2%) |
| $55,000 to $64,999 | 153 (16.1%) | 83 (7.8%) |
| $65,000 to $74,999 | 32 (3.4%) | 35 (3.3%) |
| $75,000 to $99,999 | 120 (12.6%) | 117 (11.0%) |
| $100,000+ | 326 (34.3%) | 361 (34.0%) |
| Total | 951 (100.0%) | 1,062 (100.0%) |
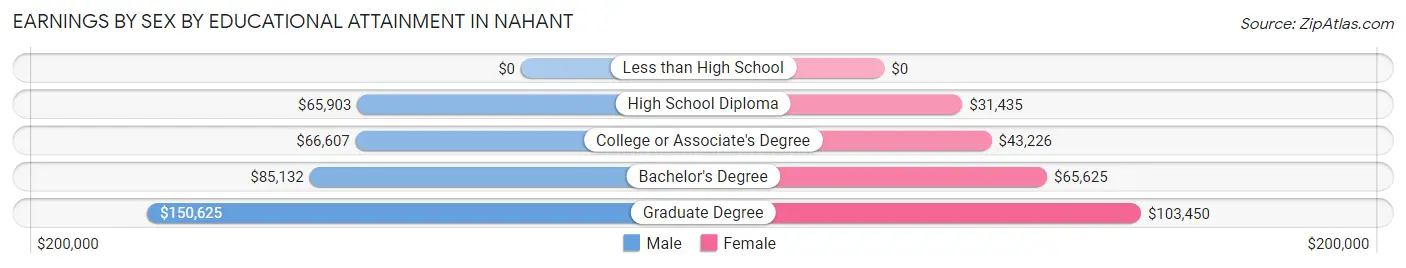
Earnings by Sex by Educational Attainment in Nahant
Average earnings in Nahant are $90,776 for men and $71,563 for women, a difference of 21.2%. Men with an educational attainment of graduate degree enjoy the highest average annual earnings of $150,625, while those with high school diploma education earn the least with $65,903. Women with an educational attainment of graduate degree earn the most with the average annual earnings of $103,450, while those with high school diploma education have the smallest earnings of $31,435.
| Educational Attainment | Male Income | Female Income |
| Less than High School | - | - |
| High School Diploma | $65,903 | $31,435 |
| College or Associate's Degree | $66,607 | $43,226 |
| Bachelor's Degree | $85,132 | $65,625 |
| Graduate Degree | $150,625 | $103,450 |
| Total | $90,776 | $71,563 |
Family Income in Nahant
Family Income Brackets in Nahant
According to the Nahant family income data, there are 321 families falling into the $200,000+ income range, which is the most common income bracket and makes up 34.8% of all families.
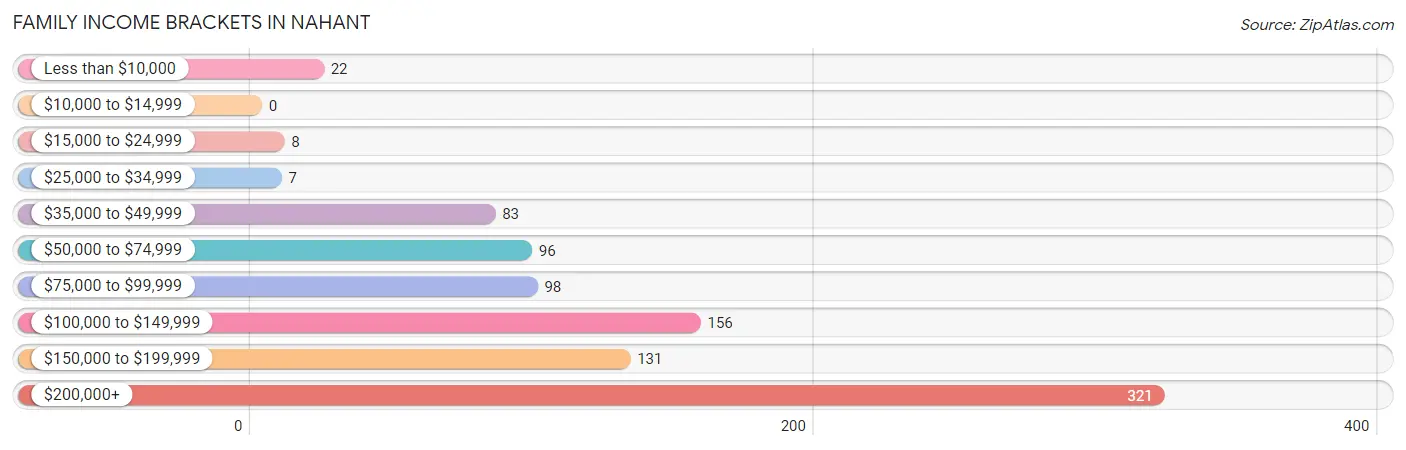
| Income Bracket | # Families | % Families |
| Less than $10,000 | 22 | 2.4% |
| $10,000 to $14,999 | 0 | 0.0% |
| $15,000 to $24,999 | 8 | 0.9% |
| $25,000 to $34,999 | 7 | 0.8% |
| $35,000 to $49,999 | 83 | 9.0% |
| $50,000 to $74,999 | 96 | 10.4% |
| $75,000 to $99,999 | 98 | 10.6% |
| $100,000 to $149,999 | 156 | 16.9% |
| $150,000 to $199,999 | 131 | 14.2% |
| $200,000+ | 321 | 34.8% |
Family Income by Famaliy Size in Nahant
5-person families (6 | 0.6%) account for the highest median family income in Nahant with $250,001 per family, while 3-person families (154 | 16.7%) have the highest median income of $66,574 per family member.
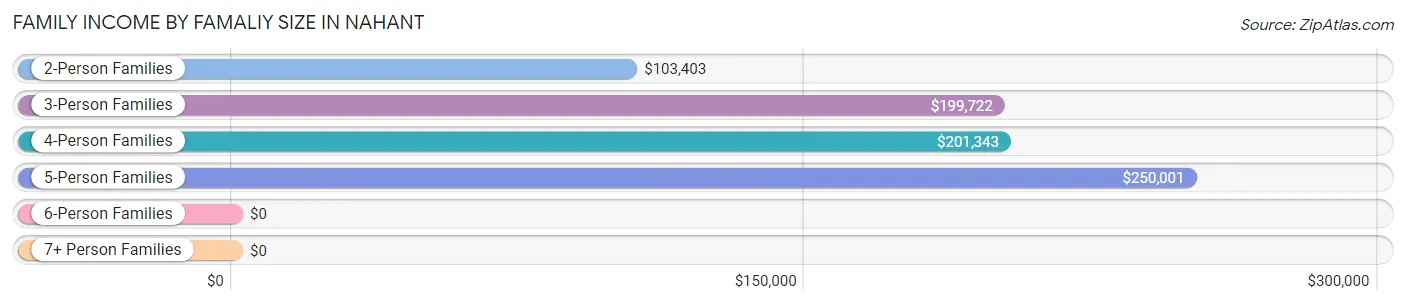
| Income Bracket | # Families | Median Income |
| 2-Person Families | 555 (60.2%) | $103,403 |
| 3-Person Families | 154 (16.7%) | $199,722 |
| 4-Person Families | 207 (22.5%) | $201,343 |
| 5-Person Families | 6 (0.6%) | $250,001 |
| 6-Person Families | 0 (0.0%) | $0 |
| 7+ Person Families | 0 (0.0%) | $0 |
| Total | 922 (100.0%) | $140,625 |
Family Income by Number of Earners in Nahant
The median family income in Nahant is $140,625, with families comprising 3+ earners (155) having the highest median family income of $217,697, while families with no earners (214) have the lowest median family income of $58,148, accounting for 16.8% and 23.2% of families, respectively.
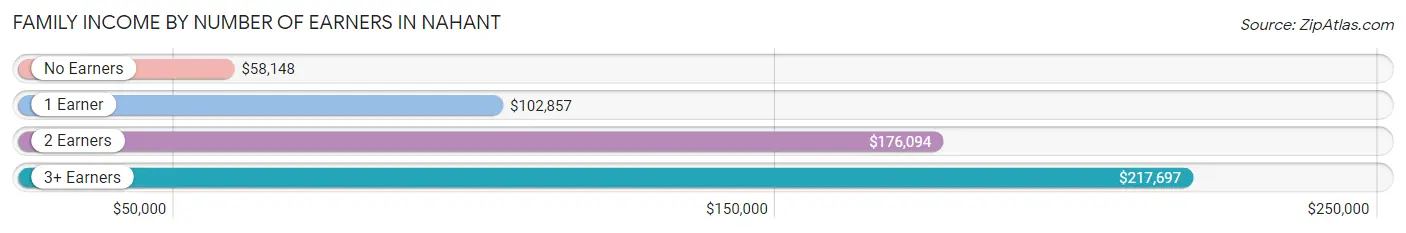
| Number of Earners | # Families | Median Income |
| No Earners | 214 (23.2%) | $58,148 |
| 1 Earner | 200 (21.7%) | $102,857 |
| 2 Earners | 353 (38.3%) | $176,094 |
| 3+ Earners | 155 (16.8%) | $217,697 |
| Total | 922 (100.0%) | $140,625 |
Household Income in Nahant
Household Income Brackets in Nahant
With 384 households falling in the category, the $200,000+ income range is the most frequent in Nahant, accounting for 23.6% of all households. In contrast, only 21 households (1.3%) fall into the $25,000 to $34,999 income bracket, making it the least populous group.
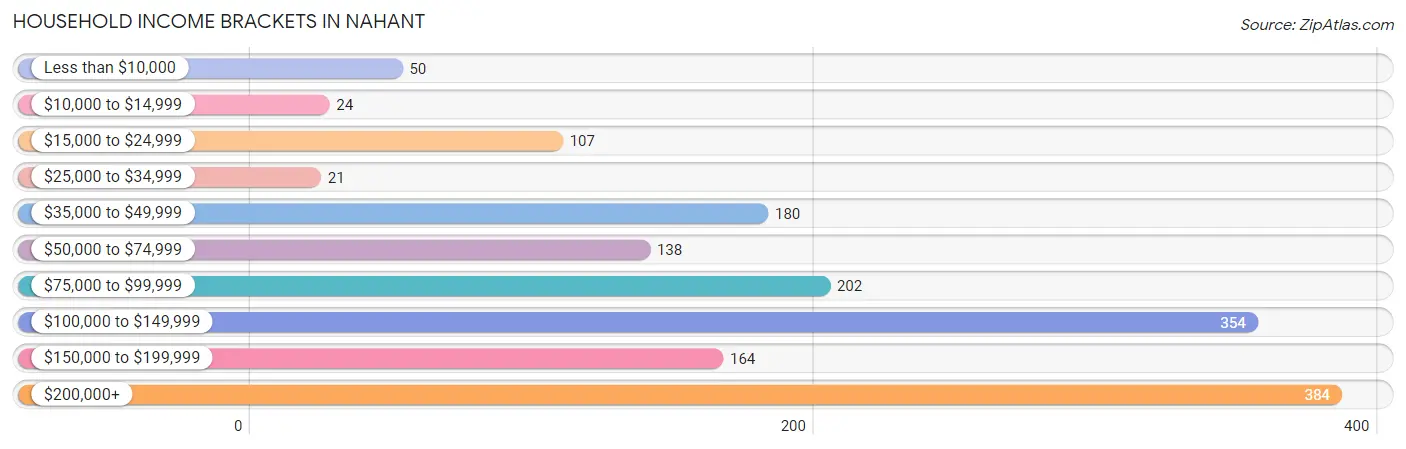
| Income Bracket | # Households | % Households |
| Less than $10,000 | 50 | 3.1% |
| $10,000 to $14,999 | 24 | 1.5% |
| $15,000 to $24,999 | 107 | 6.6% |
| $25,000 to $34,999 | 21 | 1.3% |
| $35,000 to $49,999 | 180 | 11.1% |
| $50,000 to $74,999 | 138 | 8.5% |
| $75,000 to $99,999 | 202 | 12.4% |
| $100,000 to $149,999 | 354 | 21.8% |
| $150,000 to $199,999 | 164 | 10.1% |
| $200,000+ | 384 | 23.6% |
Household Income by Householder Age in Nahant
The median household income in Nahant is $105,867, with the highest median household income of $137,188 found in the 45 to 64 years age bracket for the primary householder. A total of 744 households (45.8%) fall into this category. Meanwhile, the 15 to 24 years age bracket for the primary householder has the lowest median household income of $0, with 11 households (0.7%) in this group.
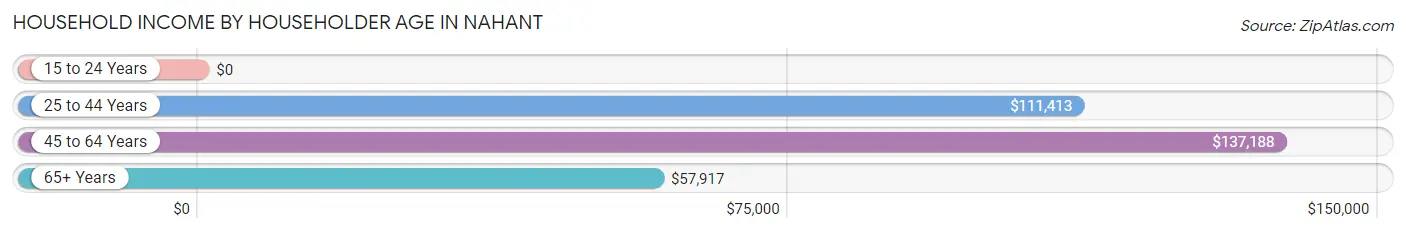
| Income Bracket | # Households | Median Income |
| 15 to 24 Years | 11 (0.7%) | $0 |
| 25 to 44 Years | 216 (13.3%) | $111,413 |
| 45 to 64 Years | 744 (45.8%) | $137,188 |
| 65+ Years | 655 (40.3%) | $57,917 |
| Total | 1,626 (100.0%) | $105,867 |
Poverty in Nahant
Income Below Poverty by Sex and Age in Nahant
With 3.4% poverty level for males and 5.6% for females among the residents of Nahant, 25 to 34 year old males and under 5 year old females are the most vulnerable to poverty, with 9 males (13.2%) and 12 females (41.4%) in their respective age groups living below the poverty level.
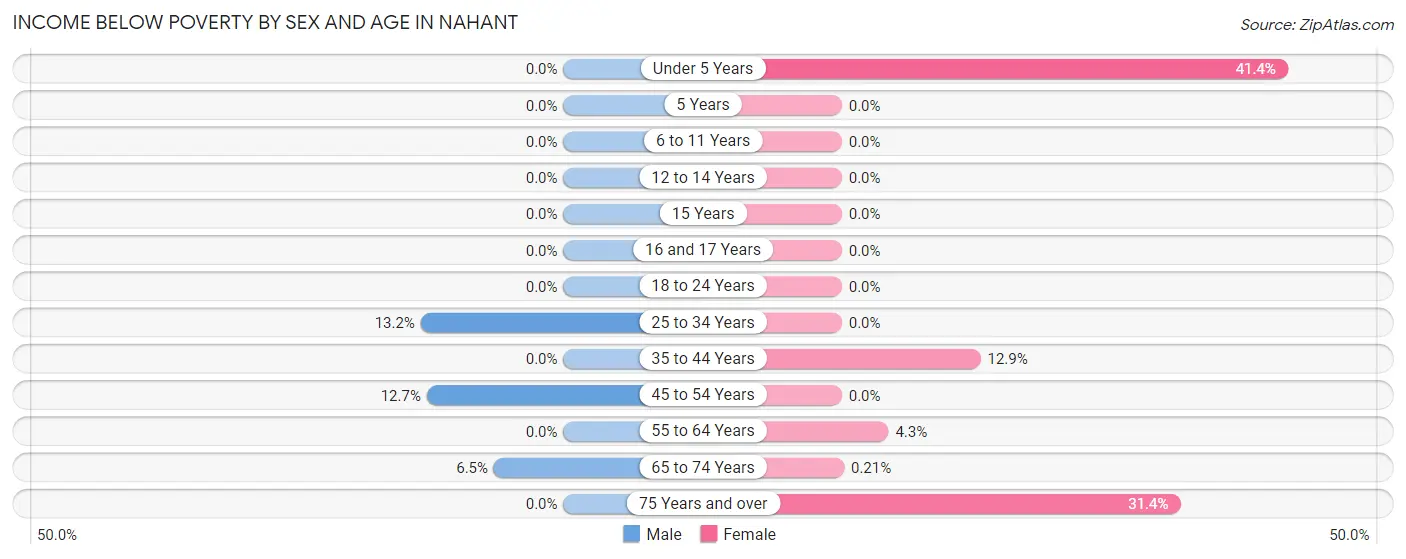
| Age Bracket | Male | Female |
| Under 5 Years | 0 (0.0%) | 12 (41.4%) |
| 5 Years | 0 (0.0%) | 0 (0.0%) |
| 6 to 11 Years | 0 (0.0%) | 0 (0.0%) |
| 12 to 14 Years | 0 (0.0%) | 0 (0.0%) |
| 15 Years | 0 (0.0%) | 0 (0.0%) |
| 16 and 17 Years | 0 (0.0%) | 0 (0.0%) |
| 18 to 24 Years | 0 (0.0%) | 0 (0.0%) |
| 25 to 34 Years | 9 (13.2%) | 0 (0.0%) |
| 35 to 44 Years | 0 (0.0%) | 21 (12.9%) |
| 45 to 54 Years | 26 (12.7%) | 0 (0.0%) |
| 55 to 64 Years | 0 (0.0%) | 17 (4.3%) |
| 65 to 74 Years | 16 (6.5%) | 1 (0.2%) |
| 75 Years and over | 0 (0.0%) | 49 (31.4%) |
| Total | 51 (3.4%) | 100 (5.6%) |
Income Above Poverty by Sex and Age in Nahant
According to the poverty statistics in Nahant, males aged under 5 years and females aged 6 to 11 years are the age groups that are most secure financially, with 100.0% of males and 100.0% of females in these age groups living above the poverty line.
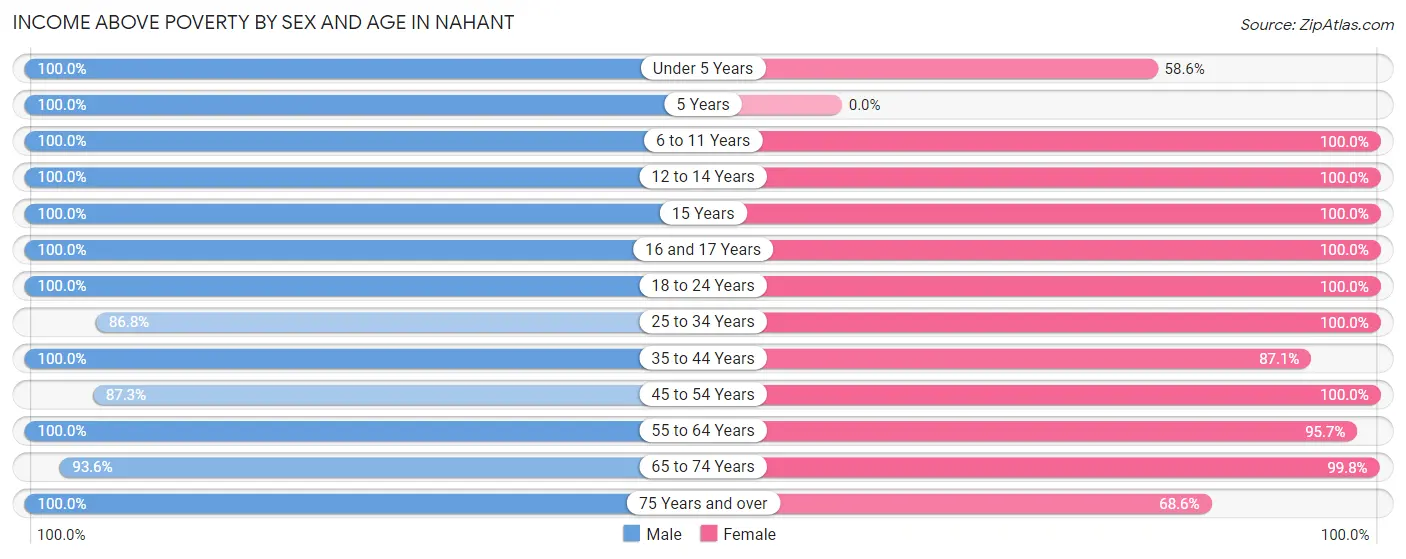
| Age Bracket | Male | Female |
| Under 5 Years | 80 (100.0%) | 17 (58.6%) |
| 5 Years | 7 (100.0%) | 0 (0.0%) |
| 6 to 11 Years | 58 (100.0%) | 19 (100.0%) |
| 12 to 14 Years | 43 (100.0%) | 7 (100.0%) |
| 15 Years | 9 (100.0%) | 75 (100.0%) |
| 16 and 17 Years | 13 (100.0%) | 30 (100.0%) |
| 18 to 24 Years | 191 (100.0%) | 78 (100.0%) |
| 25 to 34 Years | 59 (86.8%) | 89 (100.0%) |
| 35 to 44 Years | 157 (100.0%) | 142 (87.1%) |
| 45 to 54 Years | 179 (87.3%) | 265 (100.0%) |
| 55 to 64 Years | 303 (100.0%) | 376 (95.7%) |
| 65 to 74 Years | 232 (93.5%) | 482 (99.8%) |
| 75 Years and over | 120 (100.0%) | 107 (68.6%) |
| Total | 1,451 (96.6%) | 1,687 (94.4%) |
Income Below Poverty Among Married-Couple Families in Nahant
The poverty statistics for married-couple families in Nahant show that 1.1% or 8 of the total 759 families live below the poverty line. Families with 1 or 2 children have the highest poverty rate of 4.6%, comprising of 8 families. On the other hand, families with no children have the lowest poverty rate of 0.0%, which includes 0 families.
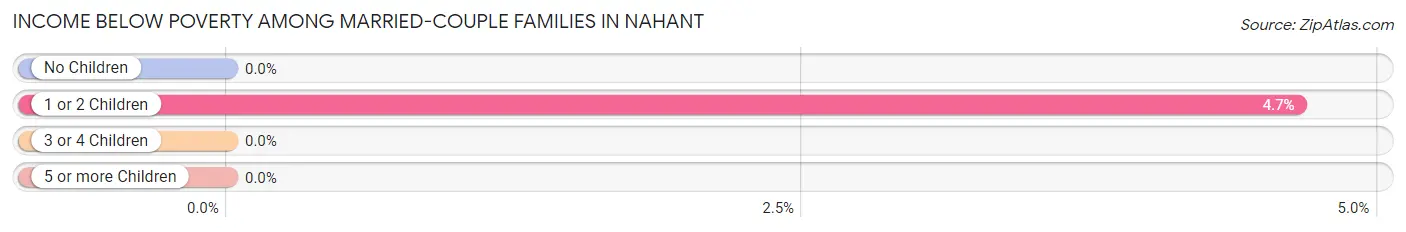
| Children | Above Poverty | Below Poverty |
| No Children | 581 (100.0%) | 0 (0.0%) |
| 1 or 2 Children | 164 (95.4%) | 8 (4.6%) |
| 3 or 4 Children | 6 (100.0%) | 0 (0.0%) |
| 5 or more Children | 0 (0.0%) | 0 (0.0%) |
| Total | 751 (99.0%) | 8 (1.1%) |
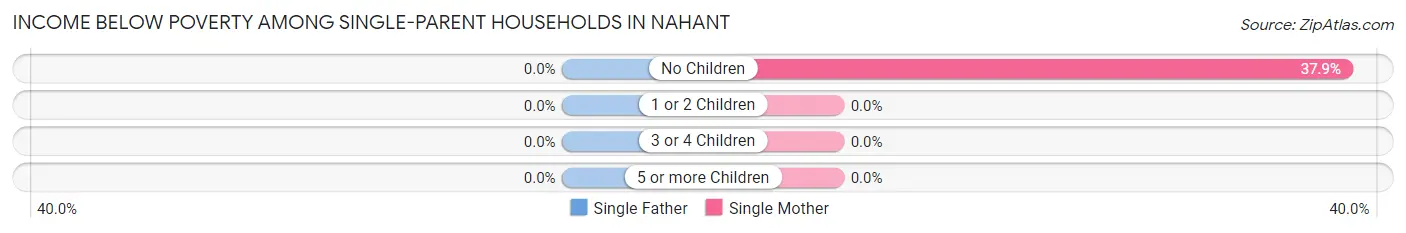
Income Below Poverty Among Single-Parent Households in Nahant
| Children | Single Father | Single Mother |
| No Children | 0 (0.0%) | 22 (37.9%) |
| 1 or 2 Children | 0 (0.0%) | 0 (0.0%) |
| 3 or 4 Children | 0 (0.0%) | 0 (0.0%) |
| 5 or more Children | 0 (0.0%) | 0 (0.0%) |
| Total | 0 (0.0%) | 22 (19.6%) |
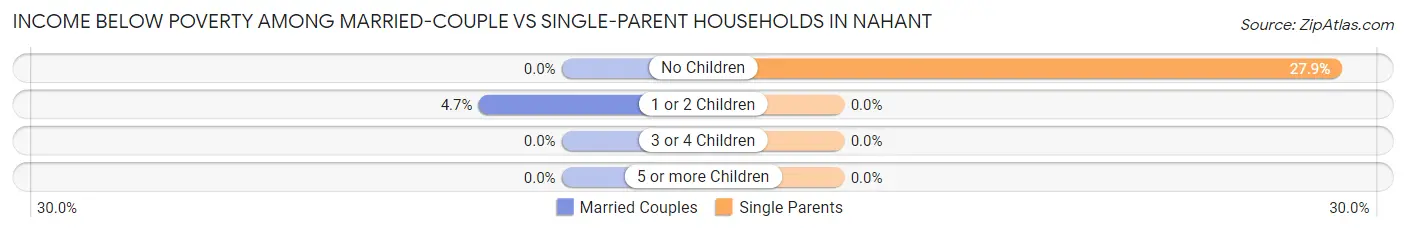
Income Below Poverty Among Married-Couple vs Single-Parent Households in Nahant
The poverty data for Nahant shows that 8 of the married-couple family households (1.1%) and 22 of the single-parent households (13.5%) are living below the poverty level. Within the married-couple family households, those with 1 or 2 children have the highest poverty rate, with 8 households (4.6%) falling below the poverty line. Among the single-parent households, those with no children have the highest poverty rate, with 22 household (27.9%) living below poverty.
| Children | Married-Couple Families | Single-Parent Households |
| No Children | 0 (0.0%) | 22 (27.9%) |
| 1 or 2 Children | 8 (4.6%) | 0 (0.0%) |
| 3 or 4 Children | 0 (0.0%) | 0 (0.0%) |
| 5 or more Children | 0 (0.0%) | 0 (0.0%) |
| Total | 8 (1.1%) | 22 (13.5%) |
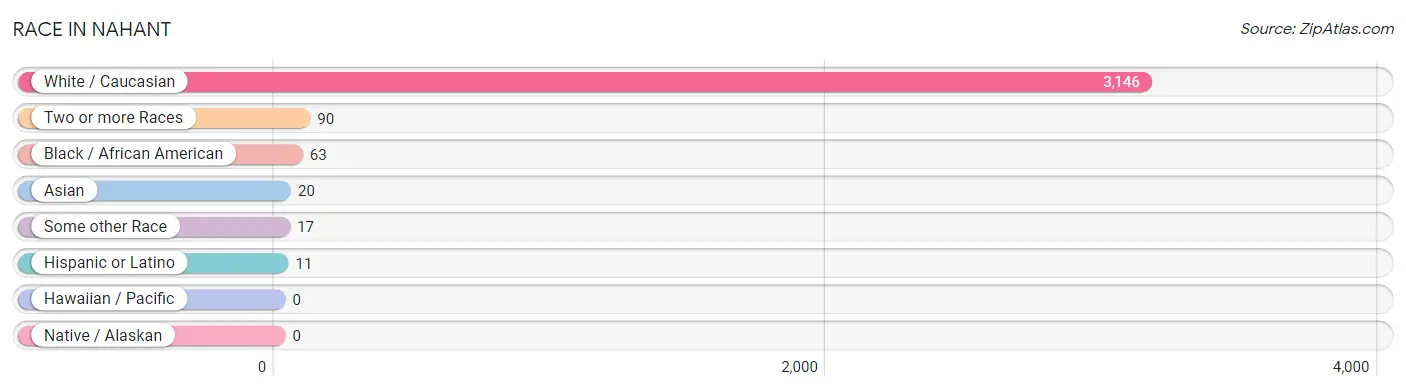
Race in Nahant
The most populous races in Nahant are White / Caucasian (3,146 | 94.3%), Two or more Races (90 | 2.7%), and Black / African American (63 | 1.9%).
| Race | # Population | % Population |
| Asian | 20 | 0.6% |
| Black / African American | 63 | 1.9% |
| Hawaiian / Pacific | 0 | 0.0% |
| Hispanic or Latino | 11 | 0.3% |
| Native / Alaskan | 0 | 0.0% |
| White / Caucasian | 3,146 | 94.3% |
| Two or more Races | 90 | 2.7% |
| Some other Race | 17 | 0.5% |
| Total | 3,336 | 100.0% |
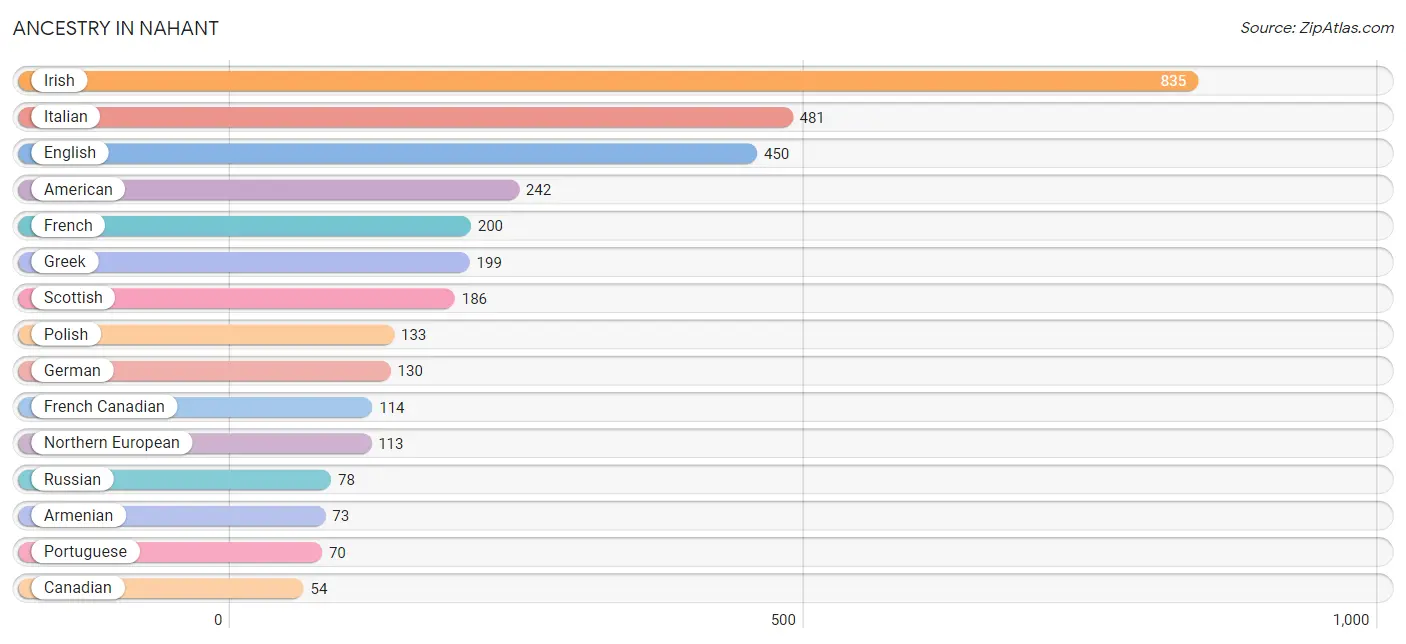
Ancestry in Nahant
The most populous ancestries reported in Nahant are Irish (835 | 25.0%), Italian (481 | 14.4%), English (450 | 13.5%), American (242 | 7.2%), and French (200 | 6.0%), together accounting for 66.2% of all Nahant residents.
| Ancestry | # Population | % Population |
| American | 242 | 7.2% |
| Armenian | 73 | 2.2% |
| Austrian | 16 | 0.5% |
| British | 48 | 1.4% |
| Burmese | 15 | 0.4% |
| Canadian | 54 | 1.6% |
| Colombian | 8 | 0.2% |
| Croatian | 19 | 0.6% |
| Dutch | 9 | 0.3% |
| Eastern European | 49 | 1.5% |
| English | 450 | 13.5% |
| Finnish | 21 | 0.6% |
| French | 200 | 6.0% |
| French Canadian | 114 | 3.4% |
| German | 130 | 3.9% |
| Greek | 199 | 6.0% |
| Hungarian | 24 | 0.7% |
| Irish | 835 | 25.0% |
| Iroquois | 7 | 0.2% |
| Italian | 481 | 14.4% |
| Japanese | 7 | 0.2% |
| Northern European | 113 | 3.4% |
| Norwegian | 7 | 0.2% |
| Pakistani | 5 | 0.2% |
| Polish | 133 | 4.0% |
| Portuguese | 70 | 2.1% |
| Russian | 78 | 2.3% |
| Scotch-Irish | 22 | 0.7% |
| Scottish | 186 | 5.6% |
| South American | 8 | 0.2% |
| Swedish | 8 | 0.2% |
| Welsh | 40 | 1.2% |
| Yugoslavian | 1 | 0.0% | View All 33 Rows |
Immigrants in Nahant
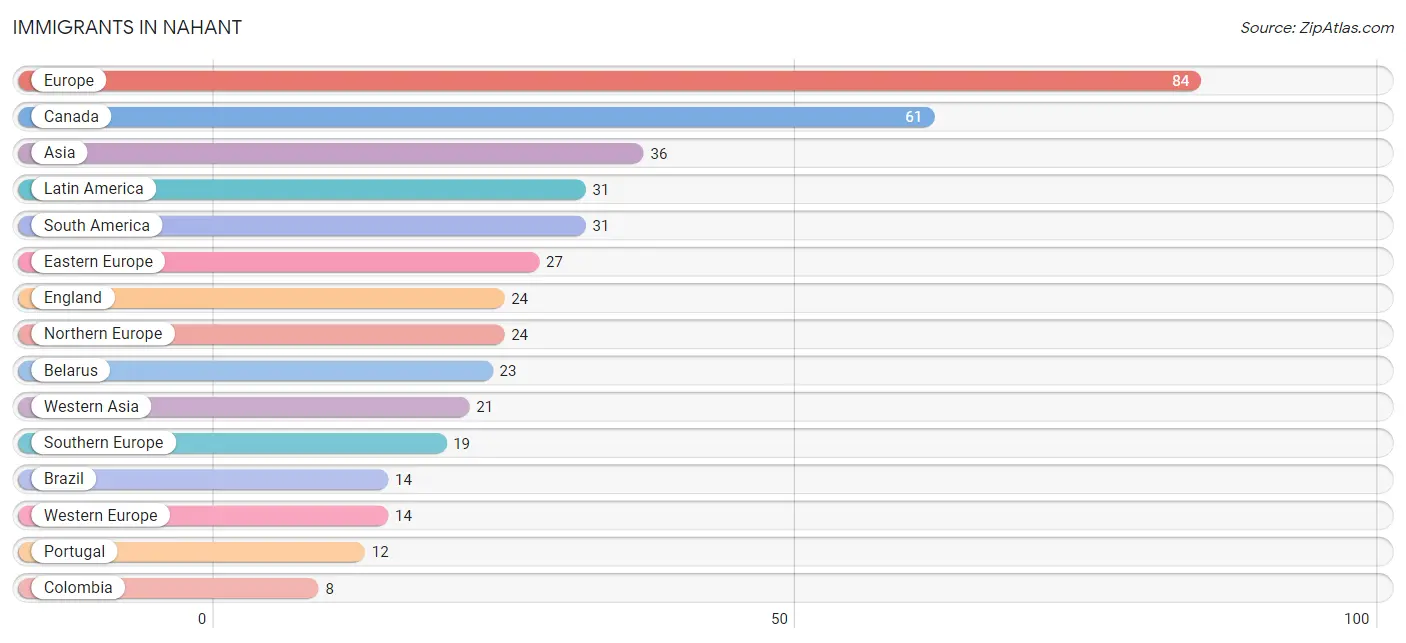
The most numerous immigrant groups reported in Nahant came from Europe (84 | 2.5%), Canada (61 | 1.8%), Asia (36 | 1.1%), Latin America (31 | 0.9%), and South America (31 | 0.9%), together accounting for 7.3% of all Nahant residents.
| Immigration Origin | # Population | % Population |
| Asia | 36 | 1.1% |
| Austria | 7 | 0.2% |
| Belarus | 23 | 0.7% |
| Brazil | 14 | 0.4% |
| Cambodia | 7 | 0.2% |
| Canada | 61 | 1.8% |
| Colombia | 8 | 0.2% |
| Eastern Asia | 8 | 0.2% |
| Eastern Europe | 27 | 0.8% |
| England | 24 | 0.7% |
| Europe | 84 | 2.5% |
| Germany | 7 | 0.2% |
| Italy | 7 | 0.2% |
| Korea | 8 | 0.2% |
| Latin America | 31 | 0.9% |
| Northern Europe | 24 | 0.7% |
| Poland | 1 | 0.0% |
| Portugal | 12 | 0.4% |
| South America | 31 | 0.9% |
| South Eastern Asia | 7 | 0.2% |
| Southern Europe | 19 | 0.6% |
| Western Asia | 21 | 0.6% |
| Western Europe | 14 | 0.4% | View All 23 Rows |
Sex and Age in Nahant
Sex and Age in Nahant
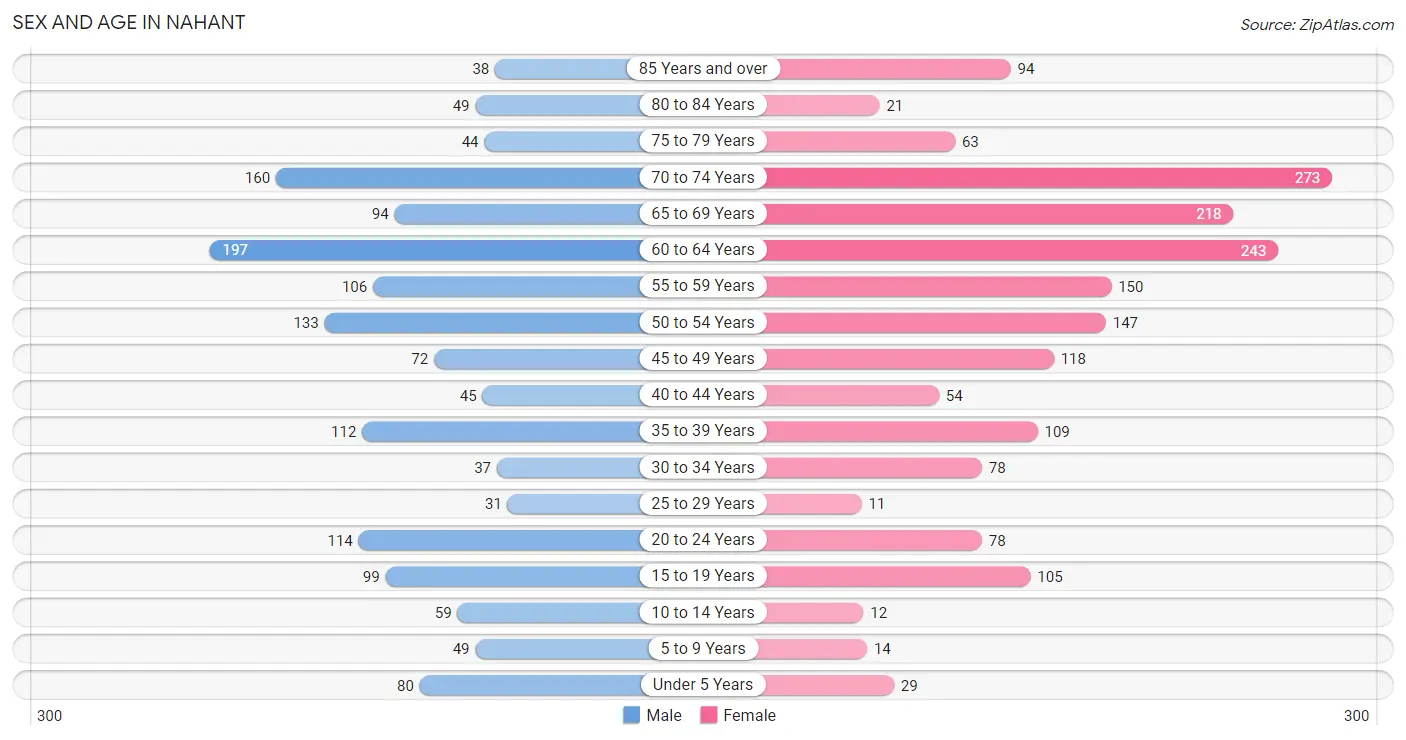
The most populous age groups in Nahant are 60 to 64 Years (197 | 13.0%) for men and 70 to 74 Years (273 | 15.0%) for women.
| Age Bracket | Male | Female |
| Under 5 Years | 80 (5.3%) | 29 (1.6%) |
| 5 to 9 Years | 49 (3.2%) | 14 (0.8%) |
| 10 to 14 Years | 59 (3.9%) | 12 (0.7%) |
| 15 to 19 Years | 99 (6.5%) | 105 (5.8%) |
| 20 to 24 Years | 114 (7.5%) | 78 (4.3%) |
| 25 to 29 Years | 31 (2.0%) | 11 (0.6%) |
| 30 to 34 Years | 37 (2.4%) | 78 (4.3%) |
| 35 to 39 Years | 112 (7.4%) | 109 (6.0%) |
| 40 to 44 Years | 45 (3.0%) | 54 (3.0%) |
| 45 to 49 Years | 72 (4.7%) | 118 (6.5%) |
| 50 to 54 Years | 133 (8.8%) | 147 (8.1%) |
| 55 to 59 Years | 106 (7.0%) | 150 (8.3%) |
| 60 to 64 Years | 197 (13.0%) | 243 (13.4%) |
| 65 to 69 Years | 94 (6.2%) | 218 (12.0%) |
| 70 to 74 Years | 160 (10.5%) | 273 (15.0%) |
| 75 to 79 Years | 44 (2.9%) | 63 (3.5%) |
| 80 to 84 Years | 49 (3.2%) | 21 (1.2%) |
| 85 Years and over | 38 (2.5%) | 94 (5.2%) |
| Total | 1,519 (100.0%) | 1,817 (100.0%) |
Families and Households in Nahant
Median Family Size in Nahant
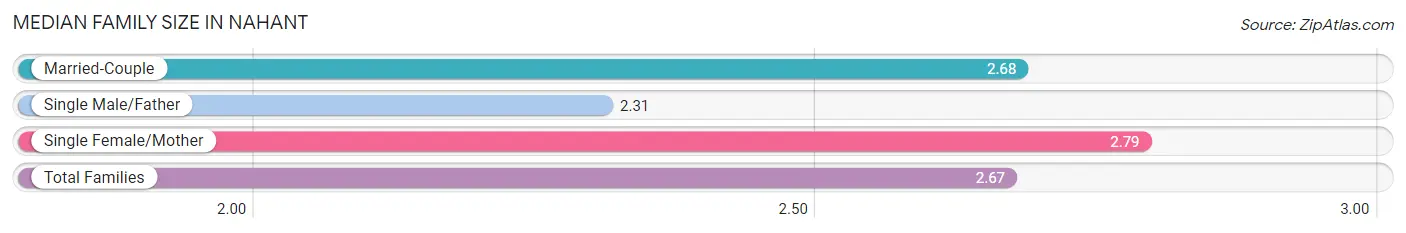
The median family size in Nahant is 2.67 persons per family, with single female/mother families (112 | 12.1%) accounting for the largest median family size of 2.79 persons per family. On the other hand, single male/father families (51 | 5.5%) represent the smallest median family size with 2.31 persons per family.
| Family Type | # Families | Family Size |
| Married-Couple | 759 (82.3%) | 2.68 |
| Single Male/Father | 51 (5.5%) | 2.31 |
| Single Female/Mother | 112 (12.1%) | 2.79 |
| Total Families | 922 (100.0%) | 2.67 |
Median Household Size in Nahant
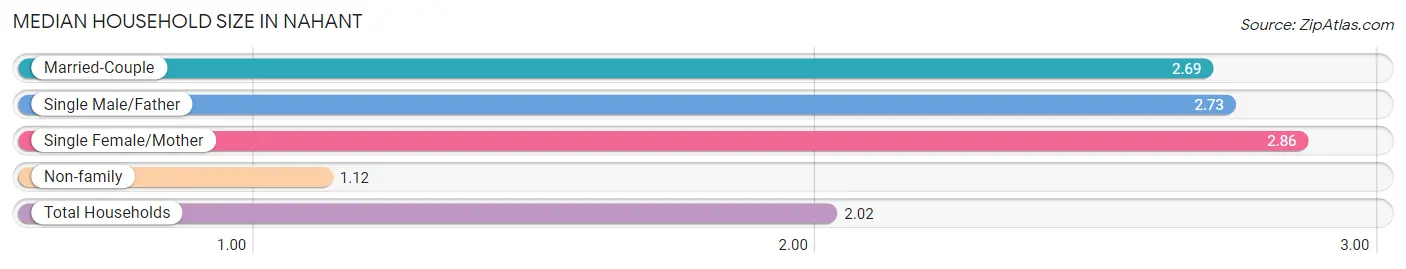
The median household size in Nahant is 2.02 persons per household, with single female/mother households (112 | 6.9%) accounting for the largest median household size of 2.86 persons per household. non-family households (704 | 43.3%) represent the smallest median household size with 1.12 persons per household.
| Household Type | # Households | Household Size |
| Married-Couple | 759 (46.7%) | 2.69 |
| Single Male/Father | 51 (3.1%) | 2.73 |
| Single Female/Mother | 112 (6.9%) | 2.86 |
| Non-family | 704 (43.3%) | 1.12 |
| Total Households | 1,626 (100.0%) | 2.02 |
Household Size by Marriage Status in Nahant
Out of a total of 1,626 households in Nahant, 922 (56.7%) are family households, while 704 (43.3%) are nonfamily households. The most numerous type of family households are 2-person households, comprising 548, and the most common type of nonfamily households are 1-person households, comprising 628.
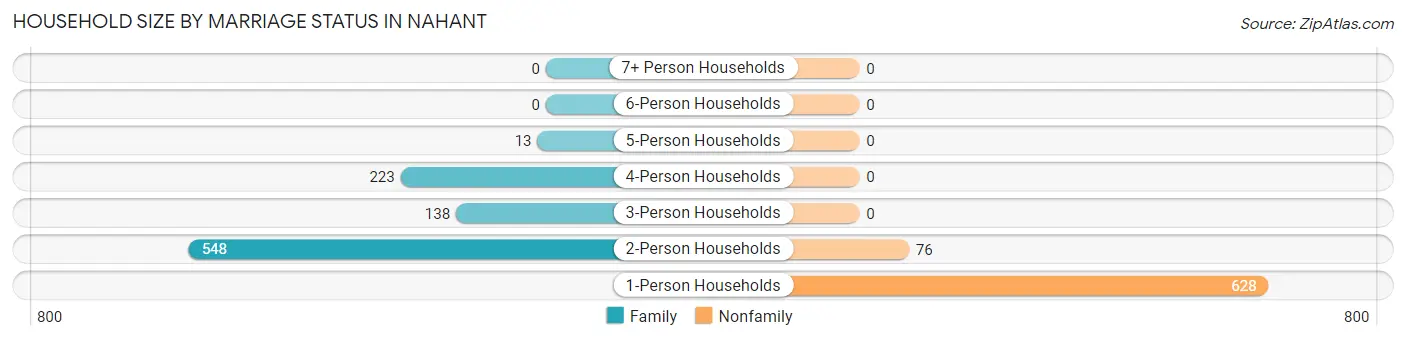
| Household Size | Family Households | Nonfamily Households |
| 1-Person Households | - | 628 (38.6%) |
| 2-Person Households | 548 (33.7%) | 76 (4.7%) |
| 3-Person Households | 138 (8.5%) | 0 (0.0%) |
| 4-Person Households | 223 (13.7%) | 0 (0.0%) |
| 5-Person Households | 13 (0.8%) | 0 (0.0%) |
| 6-Person Households | 0 (0.0%) | 0 (0.0%) |
| 7+ Person Households | 0 (0.0%) | 0 (0.0%) |
| Total | 922 (56.7%) | 704 (43.3%) |
Female Fertility in Nahant
Fertility by Age in Nahant
Average fertility rate in Nahant is 43.0 births per 1,000 women. Women in the age bracket of 20 to 34 years have the highest fertility rate with 144.0 births per 1,000 women. Women in the age bracket of 20 to 34 years acount for 100.0% of all women with births.
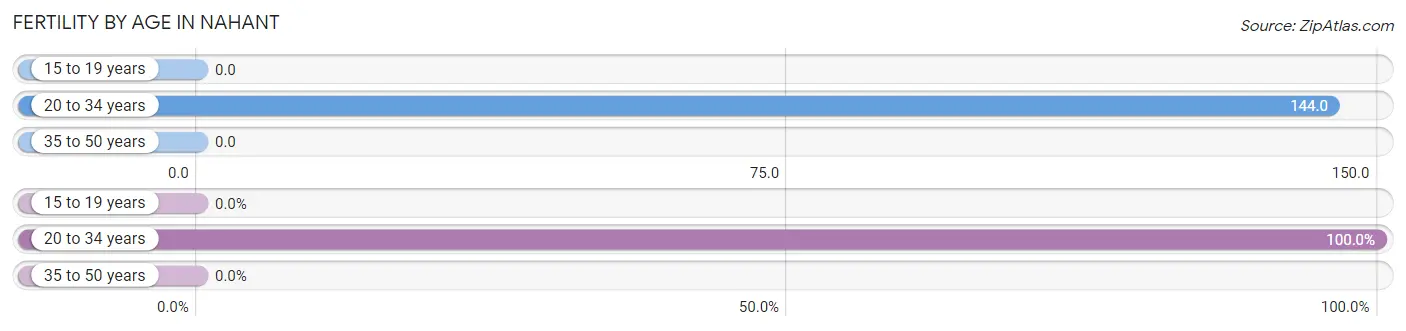
| Age Bracket | Women with Births | Births / 1,000 Women |
| 15 to 19 years | 0 (0.0%) | 0.0 |
| 20 to 34 years | 24 (100.0%) | 144.0 |
| 35 to 50 years | 0 (0.0%) | 0.0 |
| Total | 24 (100.0%) | 43.0 |
Fertility by Age by Marriage Status in Nahant
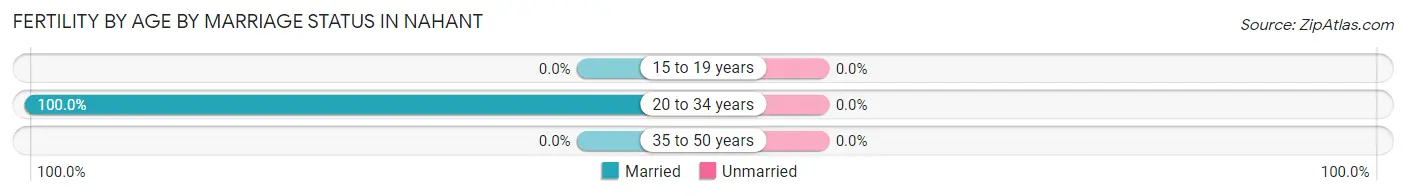
| Age Bracket | Married | Unmarried |
| 15 to 19 years | 0 (0.0%) | 0 (0.0%) |
| 20 to 34 years | 24 (100.0%) | 0 (0.0%) |
| 35 to 50 years | 0 (0.0%) | 0 (0.0%) |
| Total | 24 (100.0%) | 0 (0.0%) |
Fertility by Education in Nahant
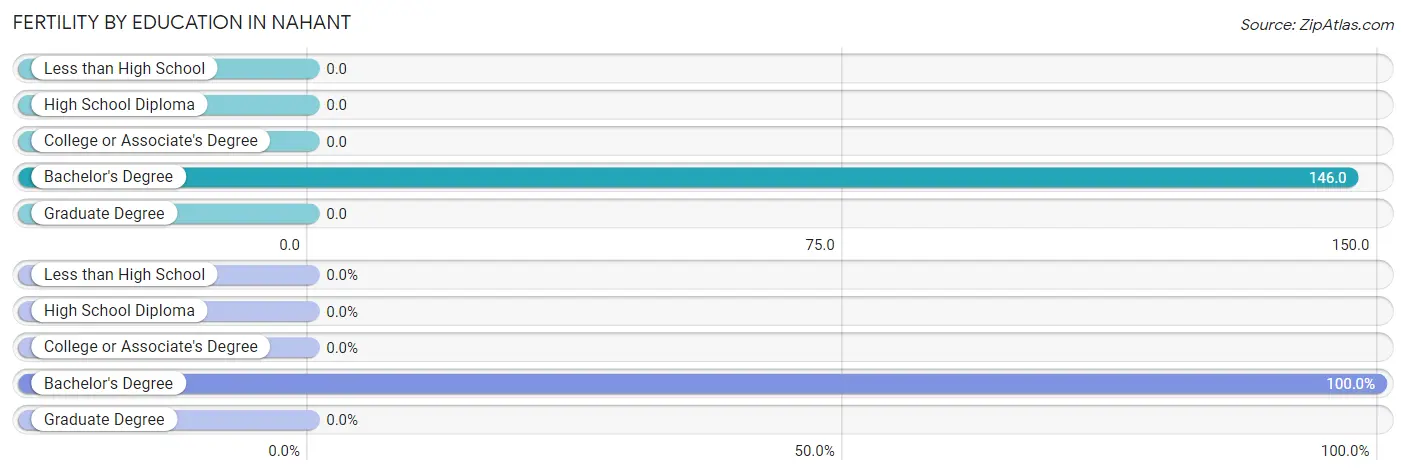
| Educational Attainment | Women with Births | Births / 1,000 Women |
| Less than High School | 0 (0.0%) | 0.0 |
| High School Diploma | 0 (0.0%) | 0.0 |
| College or Associate's Degree | 0 (0.0%) | 0.0 |
| Bachelor's Degree | 24 (100.0%) | 146.0 |
| Graduate Degree | 0 (0.0%) | 0.0 |
| Total | 24 (100.0%) | 43.0 |
Fertility by Education by Marriage Status in Nahant
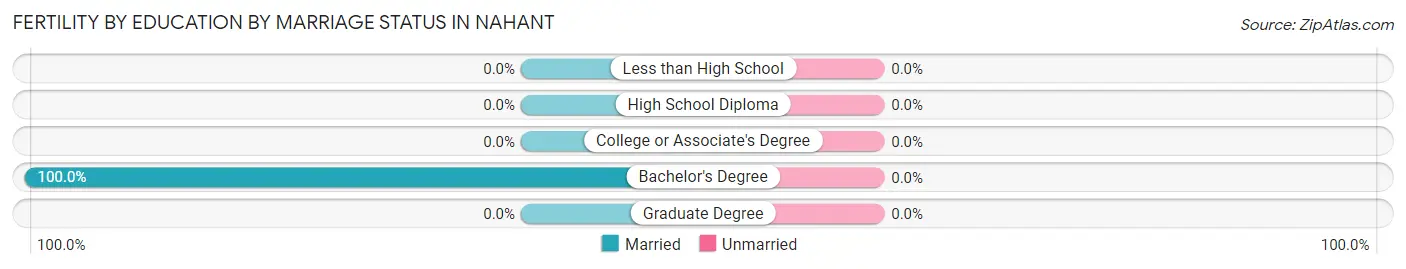
| Educational Attainment | Married | Unmarried |
| Less than High School | 0 (0.0%) | 0 (0.0%) |
| High School Diploma | 0 (0.0%) | 0 (0.0%) |
| College or Associate's Degree | 0 (0.0%) | 0 (0.0%) |
| Bachelor's Degree | 24 (100.0%) | 0 (0.0%) |
| Graduate Degree | 0 (0.0%) | 0 (0.0%) |
| Total | 24 (100.0%) | 0 (0.0%) |
Employment Characteristics in Nahant
Employment by Class of Employer in Nahant
Among the 1,876 employed individuals in Nahant, private company employees (1,065 | 56.8%), local government employees (253 | 13.5%), and not-for-profit organizations (247 | 13.2%) make up the most common classes of employment.
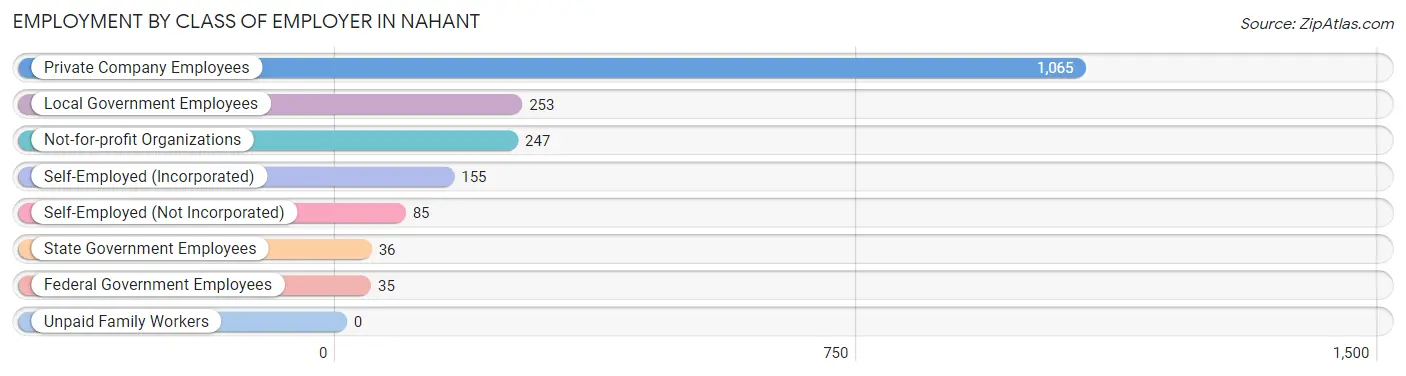
| Employer Class | # Employees | % Employees |
| Private Company Employees | 1,065 | 56.8% |
| Self-Employed (Incorporated) | 155 | 8.3% |
| Self-Employed (Not Incorporated) | 85 | 4.5% |
| Not-for-profit Organizations | 247 | 13.2% |
| Local Government Employees | 253 | 13.5% |
| State Government Employees | 36 | 1.9% |
| Federal Government Employees | 35 | 1.9% |
| Unpaid Family Workers | 0 | 0.0% |
| Total | 1,876 | 100.0% |
Employment Status by Age in Nahant
According to the labor force statistics for Nahant, out of the total population over 16 years of age (3,009), 65.5% or 1,971 individuals are in the labor force, with 4.2% or 83 of them unemployed. The age group with the highest labor force participation rate is 25 to 29 years, with 100.0% or 42 individuals in the labor force. Within the labor force, the 65 to 74 years age range has the highest percentage of unemployed individuals, with 9.8% or 25 of them being unemployed.
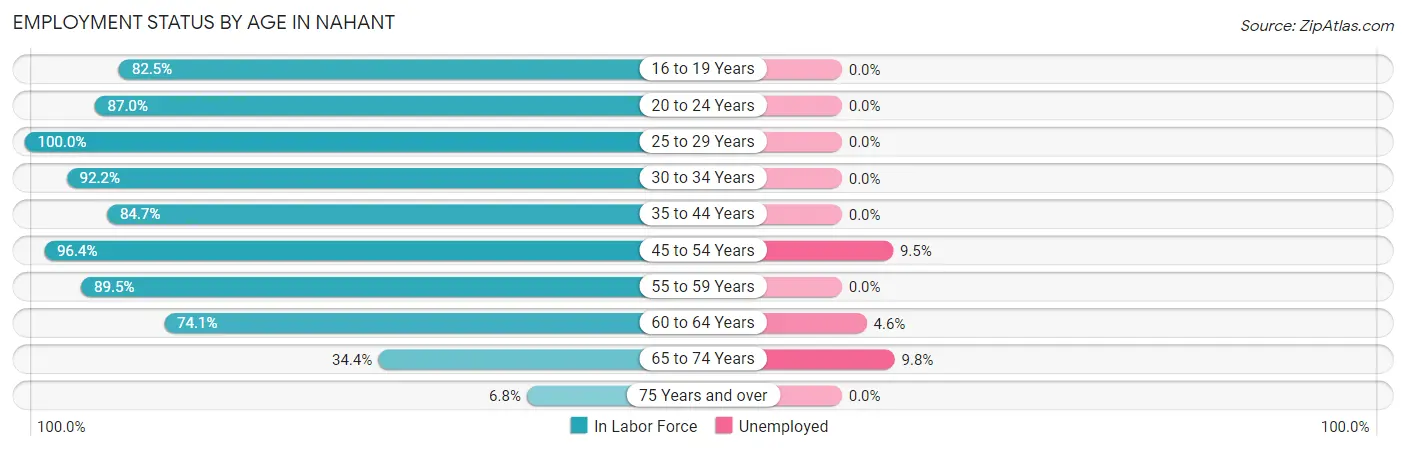
| Age Bracket | In Labor Force | Unemployed |
| 16 to 19 Years | 99 (82.5%) | 0 (0.0%) |
| 20 to 24 Years | 167 (87.0%) | 0 (0.0%) |
| 25 to 29 Years | 42 (100.0%) | 0 (0.0%) |
| 30 to 34 Years | 106 (92.2%) | 0 (0.0%) |
| 35 to 44 Years | 271 (84.7%) | 0 (0.0%) |
| 45 to 54 Years | 453 (96.4%) | 43 (9.5%) |
| 55 to 59 Years | 229 (89.5%) | 0 (0.0%) |
| 60 to 64 Years | 326 (74.1%) | 15 (4.6%) |
| 65 to 74 Years | 256 (34.4%) | 25 (9.8%) |
| 75 Years and over | 21 (6.8%) | 0 (0.0%) |
| Total | 1,971 (65.5%) | 83 (4.2%) |
Employment Status by Educational Attainment in Nahant
According to labor force statistics for Nahant, 86.9% of individuals (1,428) out of the total population between 25 and 64 years of age (1,643) are in the labor force, with 4.1% or 59 of them being unemployed. The group with the highest labor force participation rate are those with the educational attainment of bachelor's degree or higher, with 89.7% or 938 individuals in the labor force. Within the labor force, individuals with high school diploma education have the highest percentage of unemployment, with 10.1% or 26 of them being unemployed.
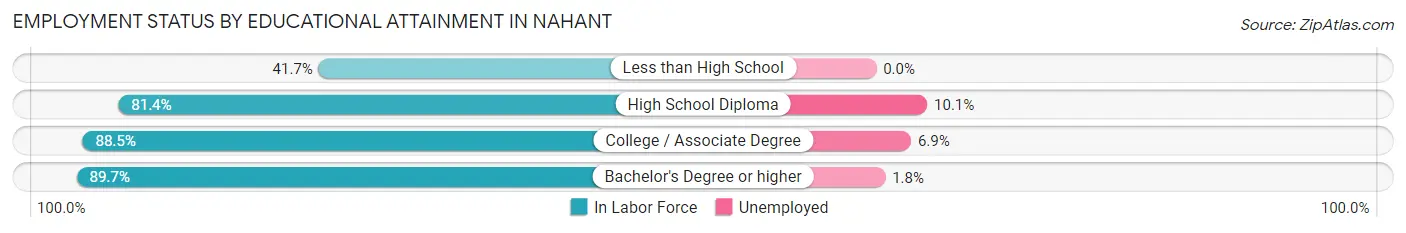
| Educational Attainment | In Labor Force | Unemployed |
| Less than High School | 15 (41.7%) | 0 (0.0%) |
| High School Diploma | 258 (81.4%) | 32 (10.1%) |
| College / Associate Degree | 216 (88.5%) | 17 (6.9%) |
| Bachelor's Degree or higher | 938 (89.7%) | 19 (1.8%) |
| Total | 1,428 (86.9%) | 67 (4.1%) |
Employment Occupations by Sex in Nahant
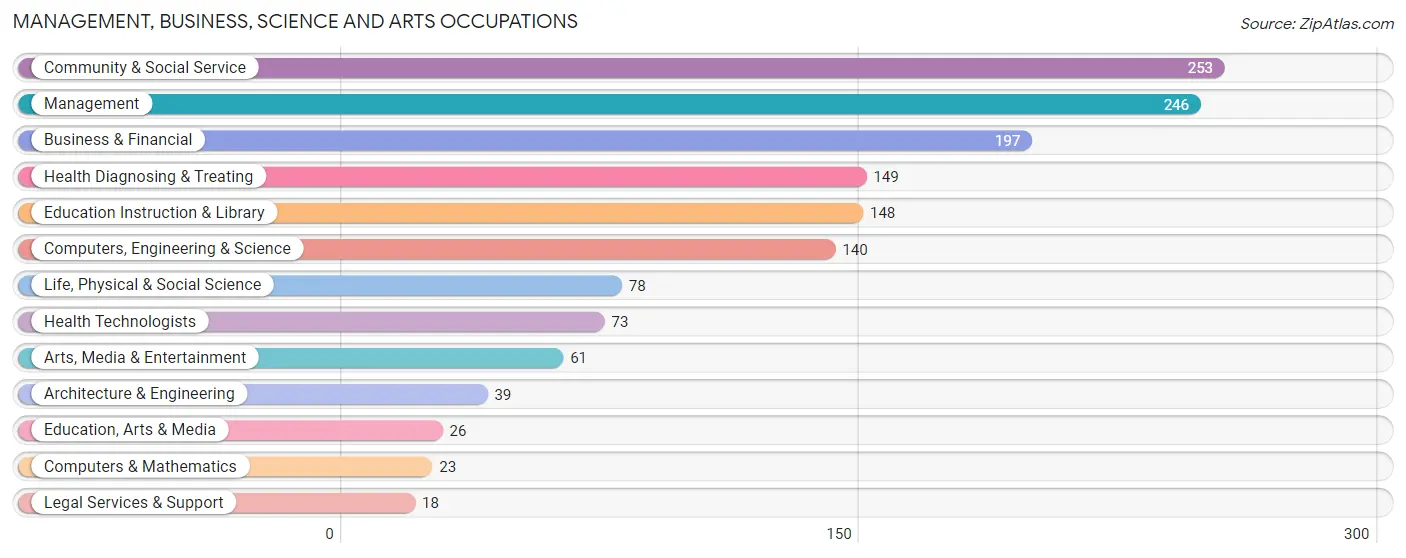
Management, Business, Science and Arts Occupations
The most common Management, Business, Science and Arts occupations in Nahant are Community & Social Service (253 | 13.4%), Management (246 | 13.0%), Business & Financial (197 | 10.4%), Health Diagnosing & Treating (149 | 7.9%), and Education Instruction & Library (148 | 7.8%).
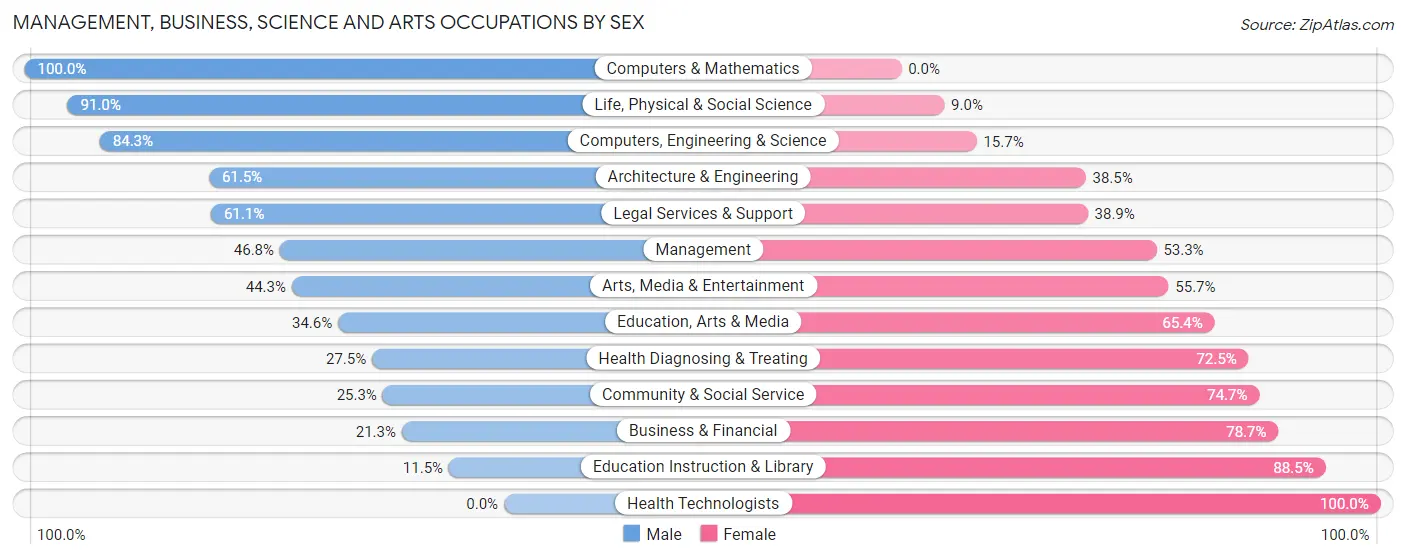
Management, Business, Science and Arts Occupations by Sex
Within the Management, Business, Science and Arts occupations in Nahant, the most male-oriented occupations are Computers & Mathematics (100.0%), Life, Physical & Social Science (91.0%), and Computers, Engineering & Science (84.3%), while the most female-oriented occupations are Health Technologists (100.0%), Education Instruction & Library (88.5%), and Business & Financial (78.7%).
| Occupation | Male | Female |
| Management | 115 (46.8%) | 131 (53.2%) |
| Business & Financial | 42 (21.3%) | 155 (78.7%) |
| Computers, Engineering & Science | 118 (84.3%) | 22 (15.7%) |
| Computers & Mathematics | 23 (100.0%) | 0 (0.0%) |
| Architecture & Engineering | 24 (61.5%) | 15 (38.5%) |
| Life, Physical & Social Science | 71 (91.0%) | 7 (9.0%) |
| Community & Social Service | 64 (25.3%) | 189 (74.7%) |
| Education, Arts & Media | 9 (34.6%) | 17 (65.4%) |
| Legal Services & Support | 11 (61.1%) | 7 (38.9%) |
| Education Instruction & Library | 17 (11.5%) | 131 (88.5%) |
| Arts, Media & Entertainment | 27 (44.3%) | 34 (55.7%) |
| Health Diagnosing & Treating | 41 (27.5%) | 108 (72.5%) |
| Health Technologists | 0 (0.0%) | 73 (100.0%) |
| Total (Category) | 380 (38.6%) | 605 (61.4%) |
| Total (Overall) | 886 (46.9%) | 1,001 (53.0%) |
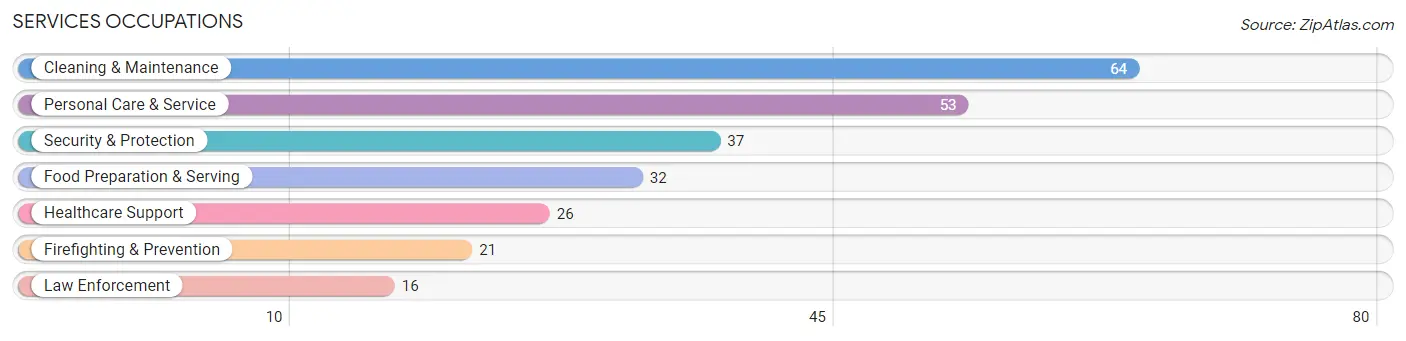
Services Occupations
The most common Services occupations in Nahant are Cleaning & Maintenance (64 | 3.4%), Personal Care & Service (53 | 2.8%), Security & Protection (37 | 2.0%), Food Preparation & Serving (32 | 1.7%), and Healthcare Support (26 | 1.4%).
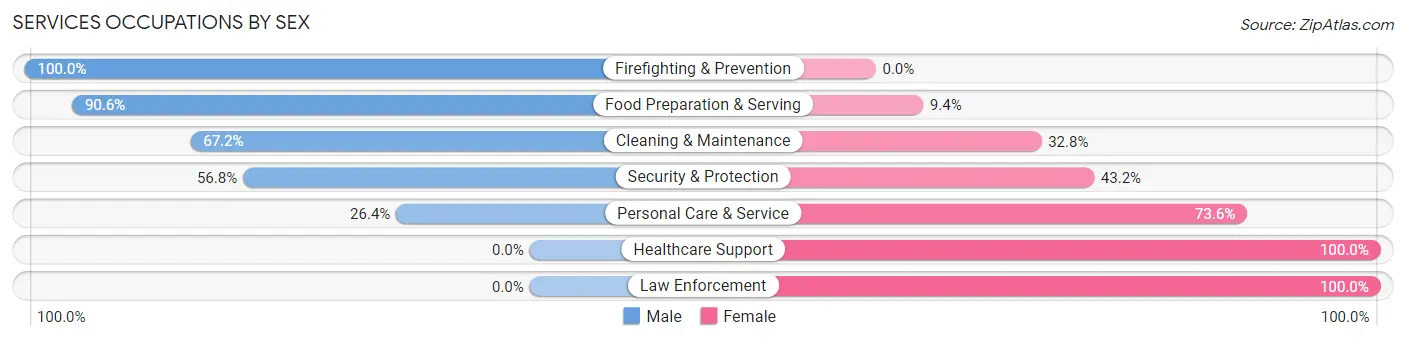
Services Occupations by Sex
Within the Services occupations in Nahant, the most male-oriented occupations are Firefighting & Prevention (100.0%), Food Preparation & Serving (90.6%), and Cleaning & Maintenance (67.2%), while the most female-oriented occupations are Healthcare Support (100.0%), Law Enforcement (100.0%), and Personal Care & Service (73.6%).
| Occupation | Male | Female |
| Healthcare Support | 0 (0.0%) | 26 (100.0%) |
| Security & Protection | 21 (56.8%) | 16 (43.2%) |
| Firefighting & Prevention | 21 (100.0%) | 0 (0.0%) |
| Law Enforcement | 0 (0.0%) | 16 (100.0%) |
| Food Preparation & Serving | 29 (90.6%) | 3 (9.4%) |
| Cleaning & Maintenance | 43 (67.2%) | 21 (32.8%) |
| Personal Care & Service | 14 (26.4%) | 39 (73.6%) |
| Total (Category) | 107 (50.5%) | 105 (49.5%) |
| Total (Overall) | 886 (46.9%) | 1,001 (53.0%) |
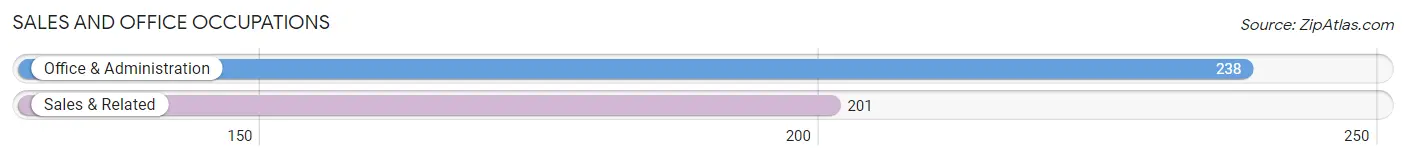
Sales and Office Occupations
The most common Sales and Office occupations in Nahant are Office & Administration (238 | 12.6%), and Sales & Related (201 | 10.6%).
Sales and Office Occupations by Sex
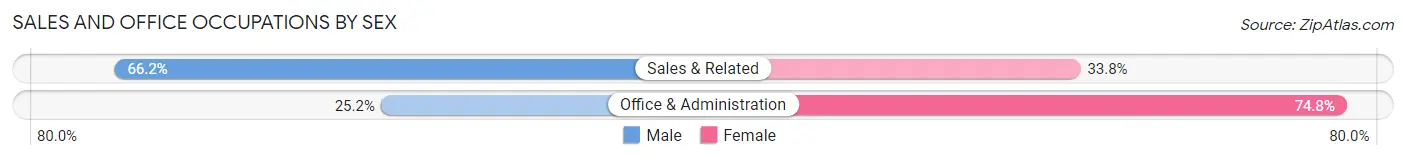
| Occupation | Male | Female |
| Sales & Related | 133 (66.2%) | 68 (33.8%) |
| Office & Administration | 60 (25.2%) | 178 (74.8%) |
| Total (Category) | 193 (44.0%) | 246 (56.0%) |
| Total (Overall) | 886 (46.9%) | 1,001 (53.0%) |
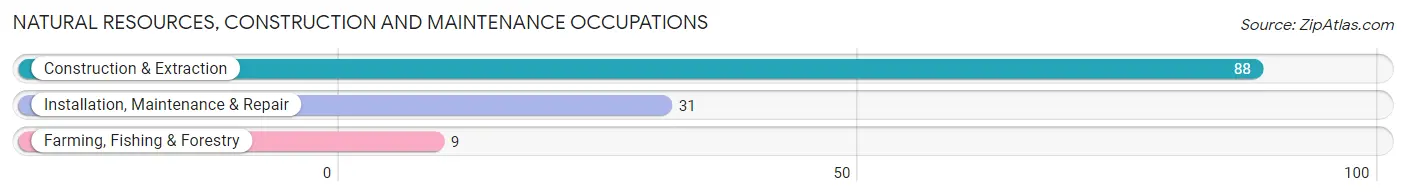
Natural Resources, Construction and Maintenance Occupations
The most common Natural Resources, Construction and Maintenance occupations in Nahant are Construction & Extraction (88 | 4.7%), Installation, Maintenance & Repair (31 | 1.6%), and Farming, Fishing & Forestry (9 | 0.5%).
Natural Resources, Construction and Maintenance Occupations by Sex
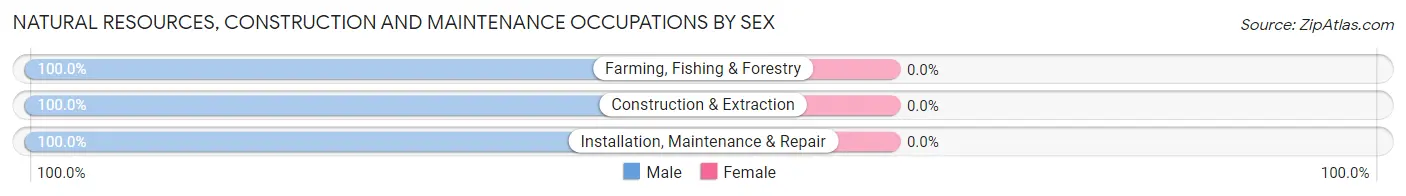
| Occupation | Male | Female |
| Farming, Fishing & Forestry | 9 (100.0%) | 0 (0.0%) |
| Construction & Extraction | 88 (100.0%) | 0 (0.0%) |
| Installation, Maintenance & Repair | 31 (100.0%) | 0 (0.0%) |
| Total (Category) | 128 (100.0%) | 0 (0.0%) |
| Total (Overall) | 886 (46.9%) | 1,001 (53.0%) |
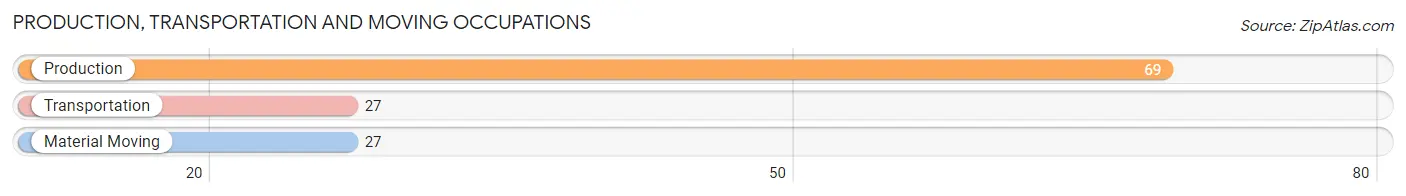
Production, Transportation and Moving Occupations
The most common Production, Transportation and Moving occupations in Nahant are Production (69 | 3.7%), Transportation (27 | 1.4%), and Material Moving (27 | 1.4%).
Production, Transportation and Moving Occupations by Sex
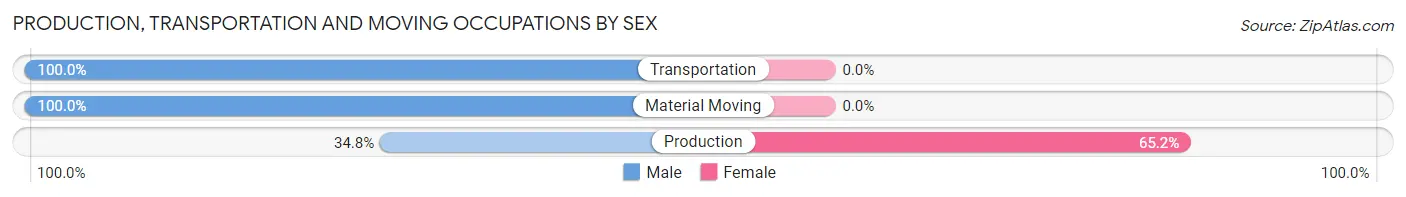
| Occupation | Male | Female |
| Production | 24 (34.8%) | 45 (65.2%) |
| Transportation | 27 (100.0%) | 0 (0.0%) |
| Material Moving | 27 (100.0%) | 0 (0.0%) |
| Total (Category) | 78 (63.4%) | 45 (36.6%) |
| Total (Overall) | 886 (46.9%) | 1,001 (53.0%) |
Employment Industries by Sex in Nahant
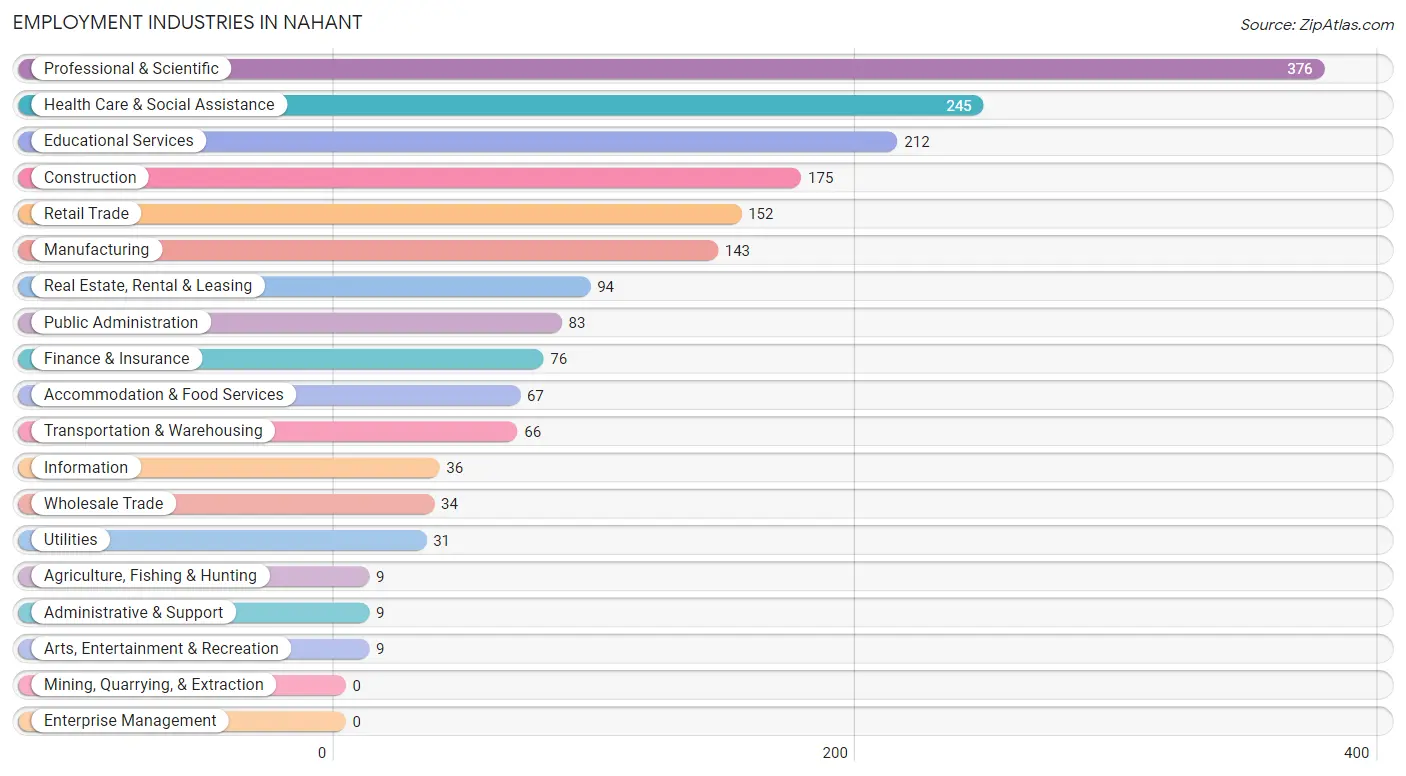
Employment Industries in Nahant
The major employment industries in Nahant include Professional & Scientific (376 | 19.9%), Health Care & Social Assistance (245 | 13.0%), Educational Services (212 | 11.2%), Construction (175 | 9.3%), and Retail Trade (152 | 8.1%).
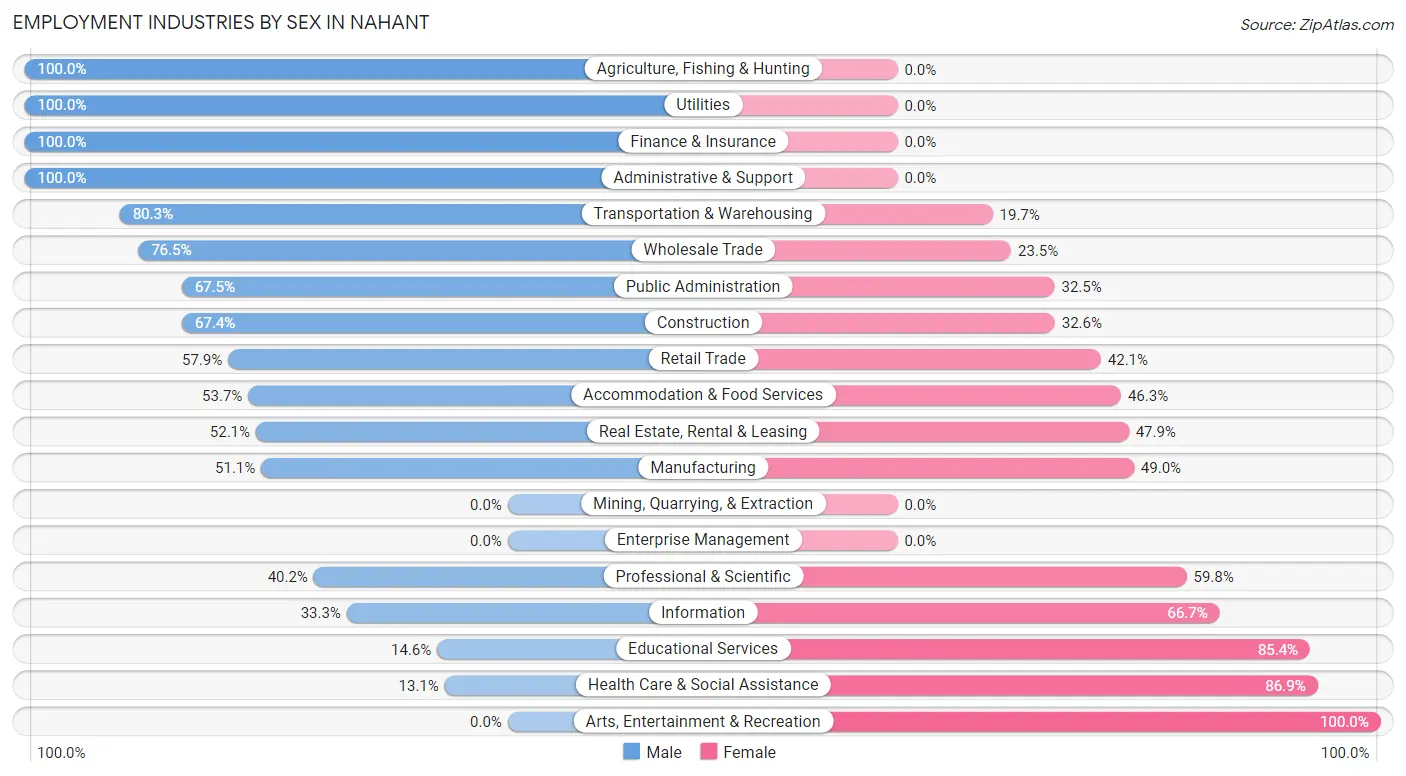
Employment Industries by Sex in Nahant
The Nahant industries that see more men than women are Agriculture, Fishing & Hunting (100.0%), Utilities (100.0%), and Finance & Insurance (100.0%), whereas the industries that tend to have a higher number of women are Arts, Entertainment & Recreation (100.0%), Health Care & Social Assistance (86.9%), and Educational Services (85.4%).
| Industry | Male | Female |
| Agriculture, Fishing & Hunting | 9 (100.0%) | 0 (0.0%) |
| Mining, Quarrying, & Extraction | 0 (0.0%) | 0 (0.0%) |
| Construction | 118 (67.4%) | 57 (32.6%) |
| Manufacturing | 73 (51.0%) | 70 (48.9%) |
| Wholesale Trade | 26 (76.5%) | 8 (23.5%) |
| Retail Trade | 88 (57.9%) | 64 (42.1%) |
| Transportation & Warehousing | 53 (80.3%) | 13 (19.7%) |
| Utilities | 31 (100.0%) | 0 (0.0%) |
| Information | 12 (33.3%) | 24 (66.7%) |
| Finance & Insurance | 76 (100.0%) | 0 (0.0%) |
| Real Estate, Rental & Leasing | 49 (52.1%) | 45 (47.9%) |
| Professional & Scientific | 151 (40.2%) | 225 (59.8%) |
| Enterprise Management | 0 (0.0%) | 0 (0.0%) |
| Administrative & Support | 9 (100.0%) | 0 (0.0%) |
| Educational Services | 31 (14.6%) | 181 (85.4%) |
| Health Care & Social Assistance | 32 (13.1%) | 213 (86.9%) |
| Arts, Entertainment & Recreation | 0 (0.0%) | 9 (100.0%) |
| Accommodation & Food Services | 36 (53.7%) | 31 (46.3%) |
| Public Administration | 56 (67.5%) | 27 (32.5%) |
| Total | 886 (46.9%) | 1,001 (53.0%) |
Education in Nahant
School Enrollment in Nahant
The most common levels of schooling among the 471 students in Nahant are high school (167 | 35.5%), college / undergraduate (143 | 30.4%), and elementary school (67 | 14.2%).
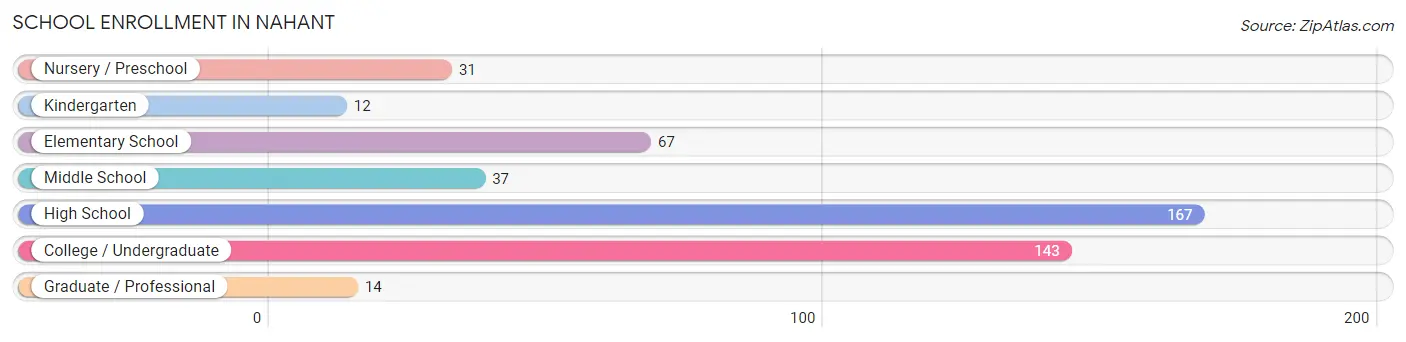
| School Level | # Students | % Students |
| Nursery / Preschool | 31 | 6.6% |
| Kindergarten | 12 | 2.5% |
| Elementary School | 67 | 14.2% |
| Middle School | 37 | 7.9% |
| High School | 167 | 35.5% |
| College / Undergraduate | 143 | 30.4% |
| Graduate / Professional | 14 | 3.0% |
| Total | 471 | 100.0% |
School Enrollment by Age by Funding Source in Nahant
Out of a total of 471 students who are enrolled in schools in Nahant, 169 (35.9%) attend a private institution, while the remaining 302 (64.1%) are enrolled in public schools. The age group of 35 years and over has the highest likelihood of being enrolled in private schools, with 21 (100.0% in the age bracket) enrolled. Conversely, the age group of 10 to 14 year olds has the lowest likelihood of being enrolled in a private school, with 71 (100.0% in the age bracket) attending a public institution.
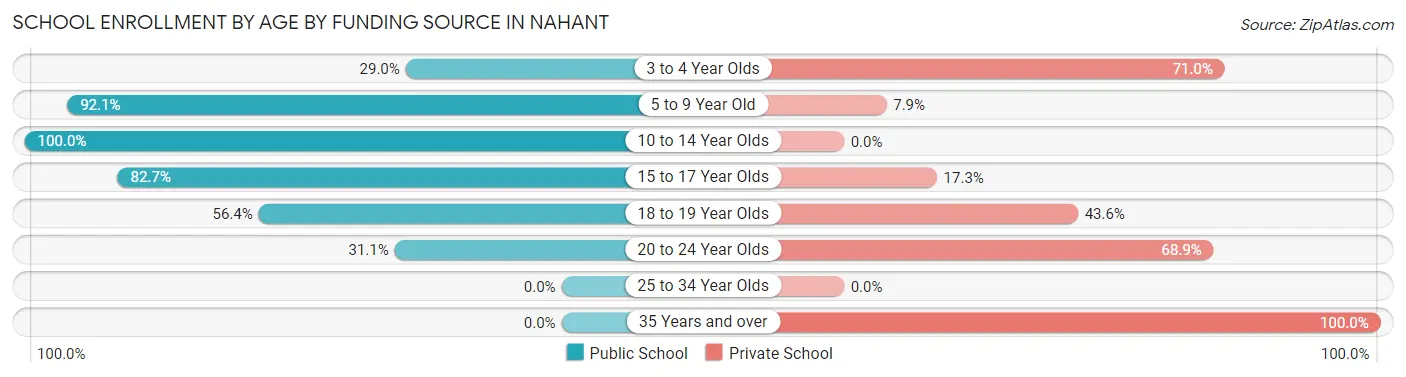
| Age Bracket | Public School | Private School |
| 3 to 4 Year Olds | 9 (29.0%) | 22 (71.0%) |
| 5 to 9 Year Old | 58 (92.1%) | 5 (7.9%) |
| 10 to 14 Year Olds | 71 (100.0%) | 0 (0.0%) |
| 15 to 17 Year Olds | 105 (82.7%) | 22 (17.3%) |
| 18 to 19 Year Olds | 22 (56.4%) | 17 (43.6%) |
| 20 to 24 Year Olds | 37 (31.1%) | 82 (68.9%) |
| 25 to 34 Year Olds | 0 (0.0%) | 0 (0.0%) |
| 35 Years and over | 0 (0.0%) | 21 (100.0%) |
| Total | 302 (64.1%) | 169 (35.9%) |
Educational Attainment by Field of Study in Nahant
Social sciences (421 | 21.2%), business (333 | 16.8%), education (222 | 11.2%), visual & performing arts (205 | 10.3%), and literature & languages (146 | 7.4%) are the most common fields of study among 1,983 individuals in Nahant who have obtained a bachelor's degree or higher.
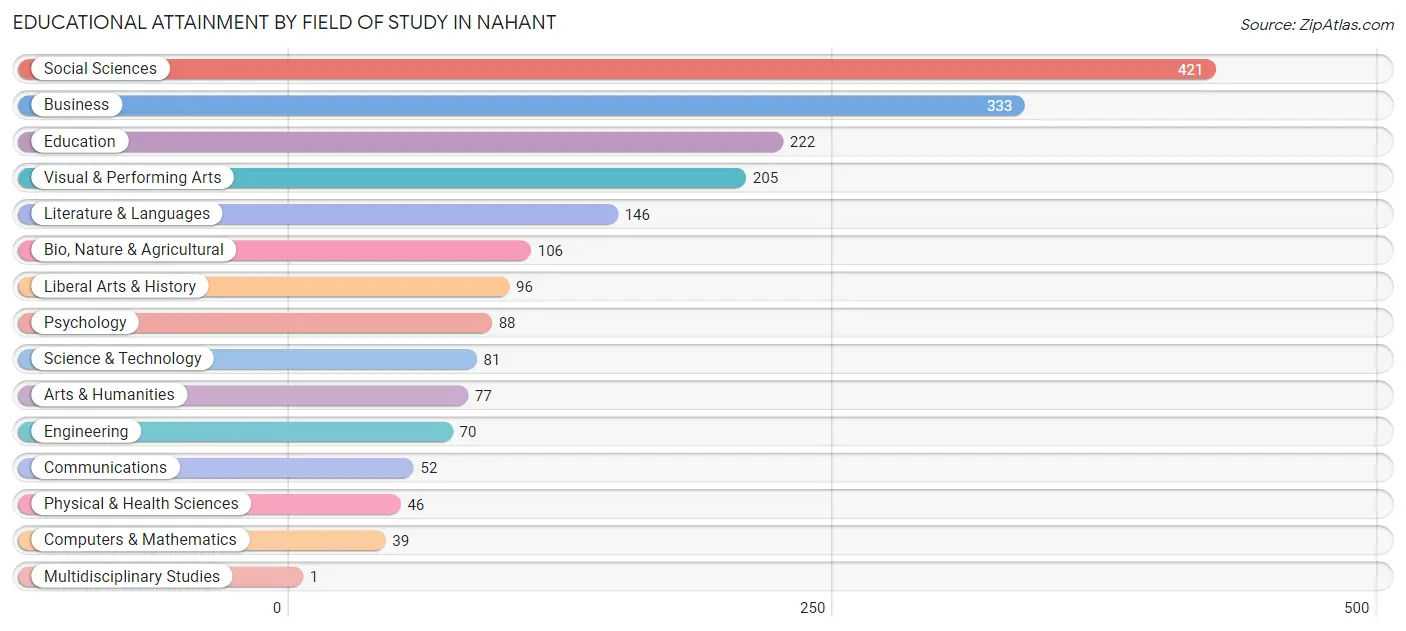
| Field of Study | # Graduates | % Graduates |
| Computers & Mathematics | 39 | 2.0% |
| Bio, Nature & Agricultural | 106 | 5.3% |
| Physical & Health Sciences | 46 | 2.3% |
| Psychology | 88 | 4.4% |
| Social Sciences | 421 | 21.2% |
| Engineering | 70 | 3.5% |
| Multidisciplinary Studies | 1 | 0.1% |
| Science & Technology | 81 | 4.1% |
| Business | 333 | 16.8% |
| Education | 222 | 11.2% |
| Literature & Languages | 146 | 7.4% |
| Liberal Arts & History | 96 | 4.8% |
| Visual & Performing Arts | 205 | 10.3% |
| Communications | 52 | 2.6% |
| Arts & Humanities | 77 | 3.9% |
| Total | 1,983 | 100.0% |
Transportation & Commute in Nahant
Vehicle Availability by Sex in Nahant
The most prevalent vehicle ownership categories in Nahant are males with 2 vehicles (422, accounting for 47.7%) and females with 2 vehicles (355, making up 42.7%).
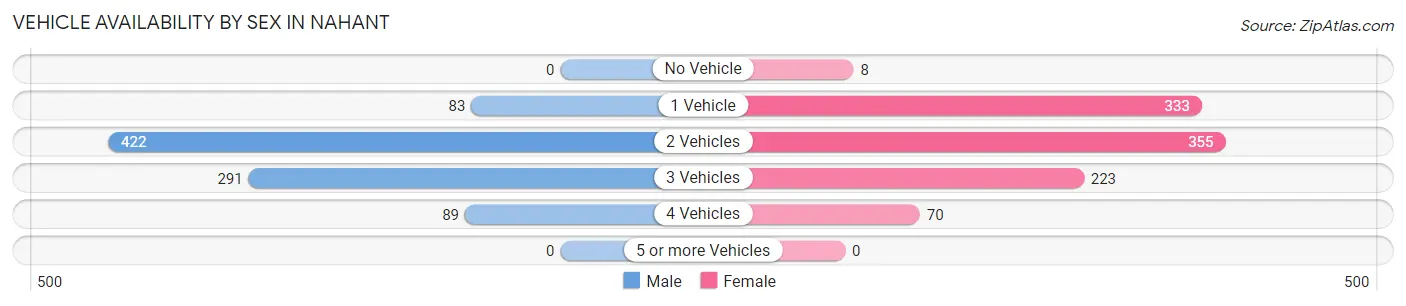
| Vehicles Available | Male | Female |
| No Vehicle | 0 (0.0%) | 8 (0.8%) |
| 1 Vehicle | 83 (9.4%) | 333 (33.7%) |
| 2 Vehicles | 422 (47.7%) | 355 (35.9%) |
| 3 Vehicles | 291 (32.9%) | 223 (22.6%) |
| 4 Vehicles | 89 (10.1%) | 70 (7.1%) |
| 5 or more Vehicles | 0 (0.0%) | 0 (0.0%) |
| Total | 885 (100.0%) | 989 (100.0%) |
Commute Time in Nahant
The most frequently occuring commute durations in Nahant are 60 to 89 minutes (318 commuters, 18.5%), 40 to 44 minutes (281 commuters, 16.4%), and 45 to 59 minutes (209 commuters, 12.2%).
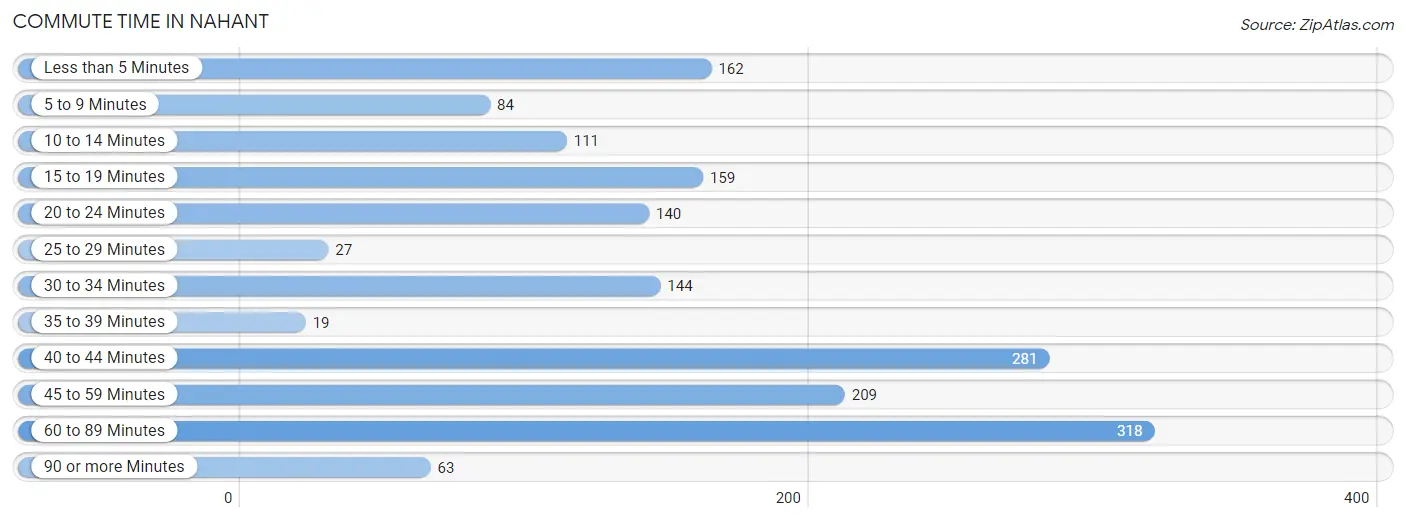
| Commute Time | # Commuters | % Commuters |
| Less than 5 Minutes | 162 | 9.4% |
| 5 to 9 Minutes | 84 | 4.9% |
| 10 to 14 Minutes | 111 | 6.5% |
| 15 to 19 Minutes | 159 | 9.3% |
| 20 to 24 Minutes | 140 | 8.2% |
| 25 to 29 Minutes | 27 | 1.6% |
| 30 to 34 Minutes | 144 | 8.4% |
| 35 to 39 Minutes | 19 | 1.1% |
| 40 to 44 Minutes | 281 | 16.4% |
| 45 to 59 Minutes | 209 | 12.2% |
| 60 to 89 Minutes | 318 | 18.5% |
| 90 or more Minutes | 63 | 3.7% |
Commute Time by Sex in Nahant
The most common commute times in Nahant are 60 to 89 minutes (153 commuters, 18.1%) for males and 60 to 89 minutes (165 commuters, 18.9%) for females.
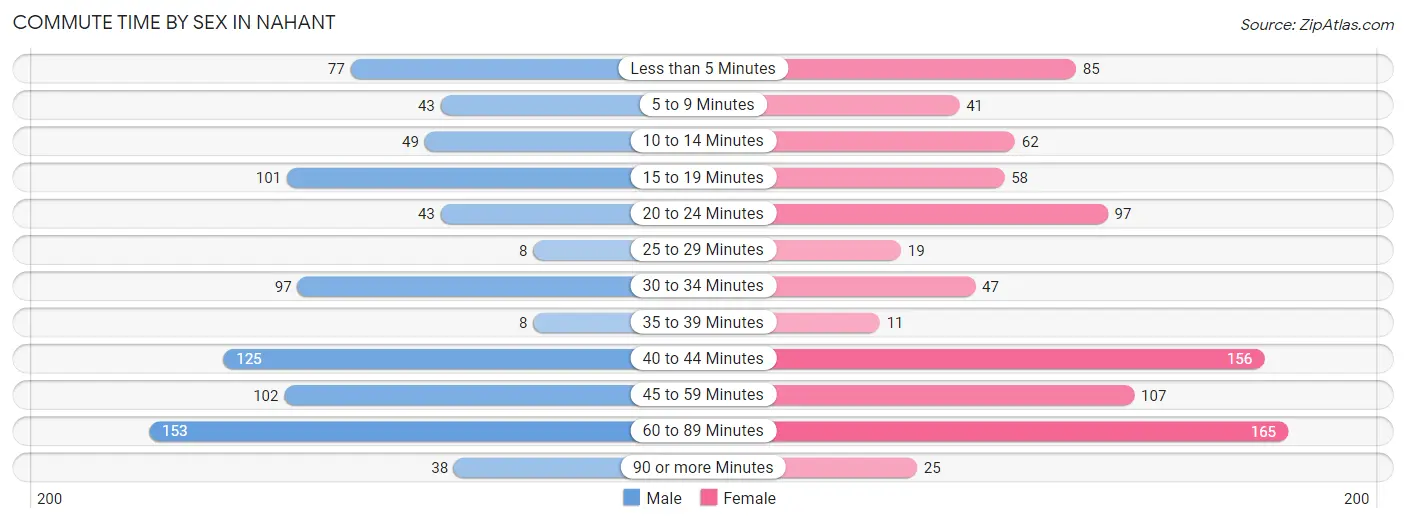
| Commute Time | Male | Female |
| Less than 5 Minutes | 77 (9.1%) | 85 (9.7%) |
| 5 to 9 Minutes | 43 (5.1%) | 41 (4.7%) |
| 10 to 14 Minutes | 49 (5.8%) | 62 (7.1%) |
| 15 to 19 Minutes | 101 (12.0%) | 58 (6.6%) |
| 20 to 24 Minutes | 43 (5.1%) | 97 (11.1%) |
| 25 to 29 Minutes | 8 (0.9%) | 19 (2.2%) |
| 30 to 34 Minutes | 97 (11.5%) | 47 (5.4%) |
| 35 to 39 Minutes | 8 (0.9%) | 11 (1.3%) |
| 40 to 44 Minutes | 125 (14.8%) | 156 (17.9%) |
| 45 to 59 Minutes | 102 (12.1%) | 107 (12.3%) |
| 60 to 89 Minutes | 153 (18.1%) | 165 (18.9%) |
| 90 or more Minutes | 38 (4.5%) | 25 (2.9%) |
Time of Departure to Work by Sex in Nahant
The most frequent times of departure to work in Nahant are 9:00 AM to 9:59 AM (147, 17.4%) for males and 7:00 AM to 7:29 AM (185, 21.2%) for females.
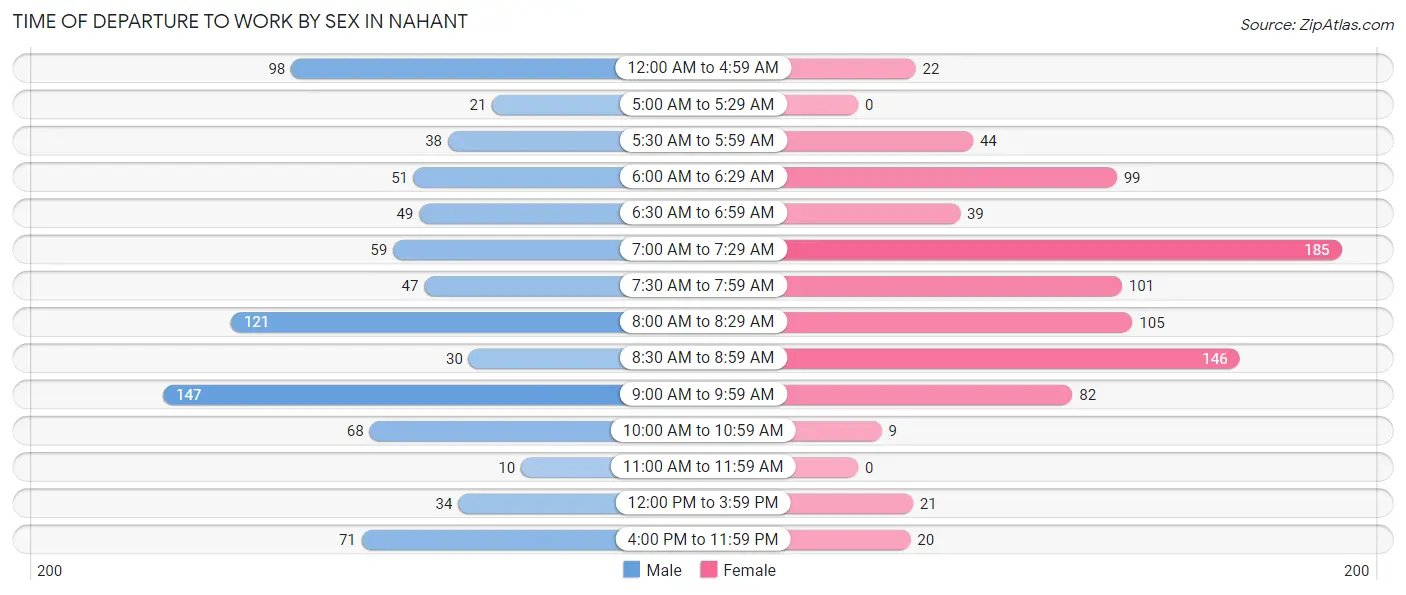
| Time of Departure | Male | Female |
| 12:00 AM to 4:59 AM | 98 (11.6%) | 22 (2.5%) |
| 5:00 AM to 5:29 AM | 21 (2.5%) | 0 (0.0%) |
| 5:30 AM to 5:59 AM | 38 (4.5%) | 44 (5.0%) |
| 6:00 AM to 6:29 AM | 51 (6.0%) | 99 (11.3%) |
| 6:30 AM to 6:59 AM | 49 (5.8%) | 39 (4.5%) |
| 7:00 AM to 7:29 AM | 59 (7.0%) | 185 (21.2%) |
| 7:30 AM to 7:59 AM | 47 (5.6%) | 101 (11.6%) |
| 8:00 AM to 8:29 AM | 121 (14.3%) | 105 (12.0%) |
| 8:30 AM to 8:59 AM | 30 (3.5%) | 146 (16.7%) |
| 9:00 AM to 9:59 AM | 147 (17.4%) | 82 (9.4%) |
| 10:00 AM to 10:59 AM | 68 (8.1%) | 9 (1.0%) |
| 11:00 AM to 11:59 AM | 10 (1.2%) | 0 (0.0%) |
| 12:00 PM to 3:59 PM | 34 (4.0%) | 21 (2.4%) |
| 4:00 PM to 11:59 PM | 71 (8.4%) | 20 (2.3%) |
| Total | 844 (100.0%) | 873 (100.0%) |
Housing Occupancy in Nahant
Occupancy by Ownership in Nahant
Of the total 1,626 dwellings in Nahant, owner-occupied units account for 1,345 (82.7%), while renter-occupied units make up 281 (17.3%).
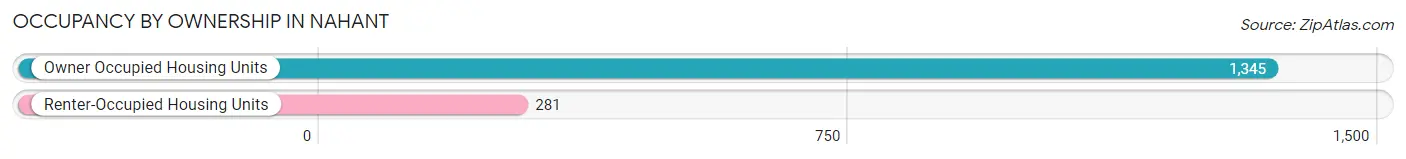
| Occupancy | # Housing Units | % Housing Units |
| Owner Occupied Housing Units | 1,345 | 82.7% |
| Renter-Occupied Housing Units | 281 | 17.3% |
| Total Occupied Housing Units | 1,626 | 100.0% |
Occupancy by Household Size in Nahant
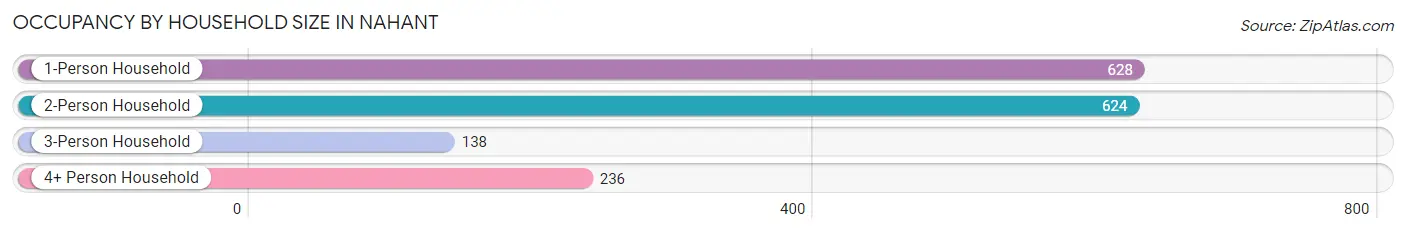
| Household Size | # Housing Units | % Housing Units |
| 1-Person Household | 628 | 38.6% |
| 2-Person Household | 624 | 38.4% |
| 3-Person Household | 138 | 8.5% |
| 4+ Person Household | 236 | 14.5% |
| Total Housing Units | 1,626 | 100.0% |
Occupancy by Ownership by Household Size in Nahant
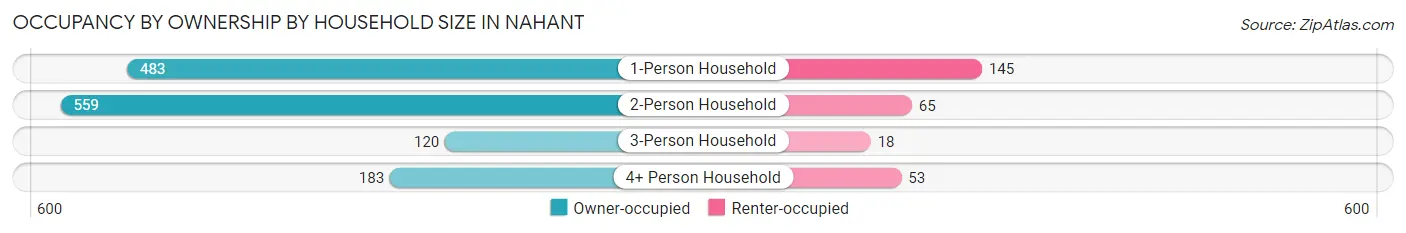
| Household Size | Owner-occupied | Renter-occupied |
| 1-Person Household | 483 (76.9%) | 145 (23.1%) |
| 2-Person Household | 559 (89.6%) | 65 (10.4%) |
| 3-Person Household | 120 (87.0%) | 18 (13.0%) |
| 4+ Person Household | 183 (77.5%) | 53 (22.5%) |
| Total Housing Units | 1,345 (82.7%) | 281 (17.3%) |
Occupancy by Educational Attainment in Nahant
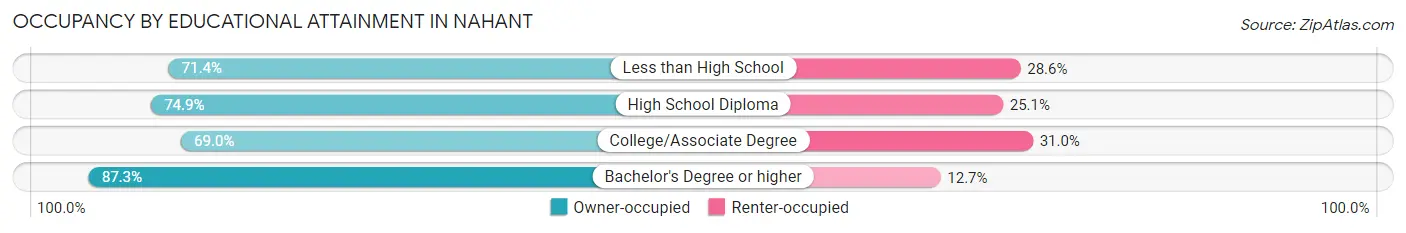
| Household Size | Owner-occupied | Renter-occupied |
| Less than High School | 20 (71.4%) | 8 (28.6%) |
| High School Diploma | 164 (74.9%) | 55 (25.1%) |
| College/Associate Degree | 160 (69.0%) | 72 (31.0%) |
| Bachelor's Degree or higher | 1,001 (87.3%) | 146 (12.7%) |
Occupancy by Age of Householder in Nahant
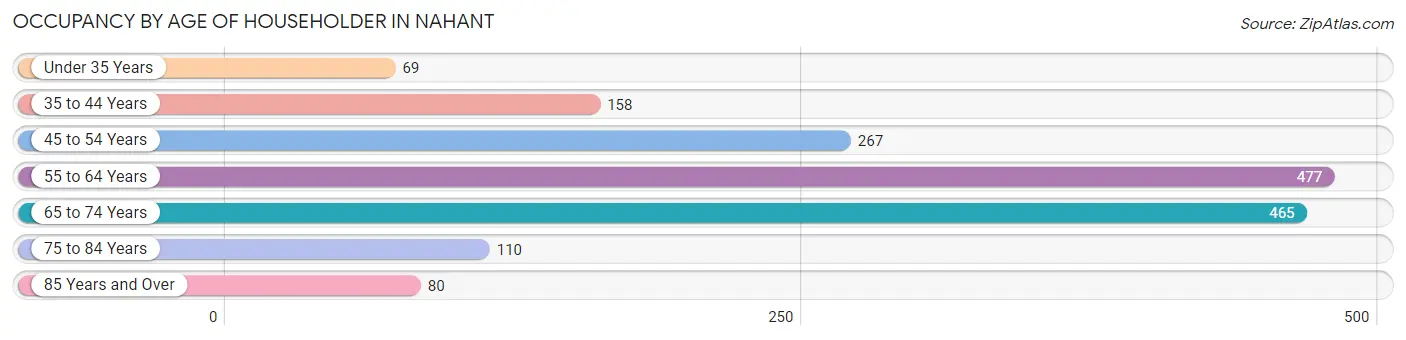
| Age Bracket | # Households | % Households |
| Under 35 Years | 69 | 4.2% |
| 35 to 44 Years | 158 | 9.7% |
| 45 to 54 Years | 267 | 16.4% |
| 55 to 64 Years | 477 | 29.3% |
| 65 to 74 Years | 465 | 28.6% |
| 75 to 84 Years | 110 | 6.8% |
| 85 Years and Over | 80 | 4.9% |
| Total | 1,626 | 100.0% |
Housing Finances in Nahant
Median Income by Occupancy in Nahant
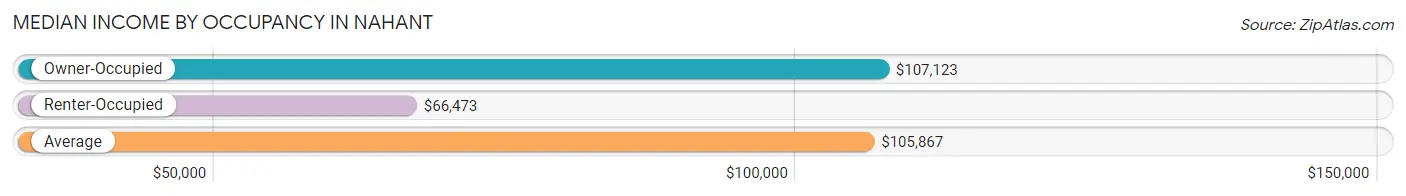
| Occupancy Type | # Households | Median Income |
| Owner-Occupied | 1,345 (82.7%) | $107,123 |
| Renter-Occupied | 281 (17.3%) | $66,473 |
| Average | 1,626 (100.0%) | $105,867 |
Occupancy by Householder Income Bracket in Nahant
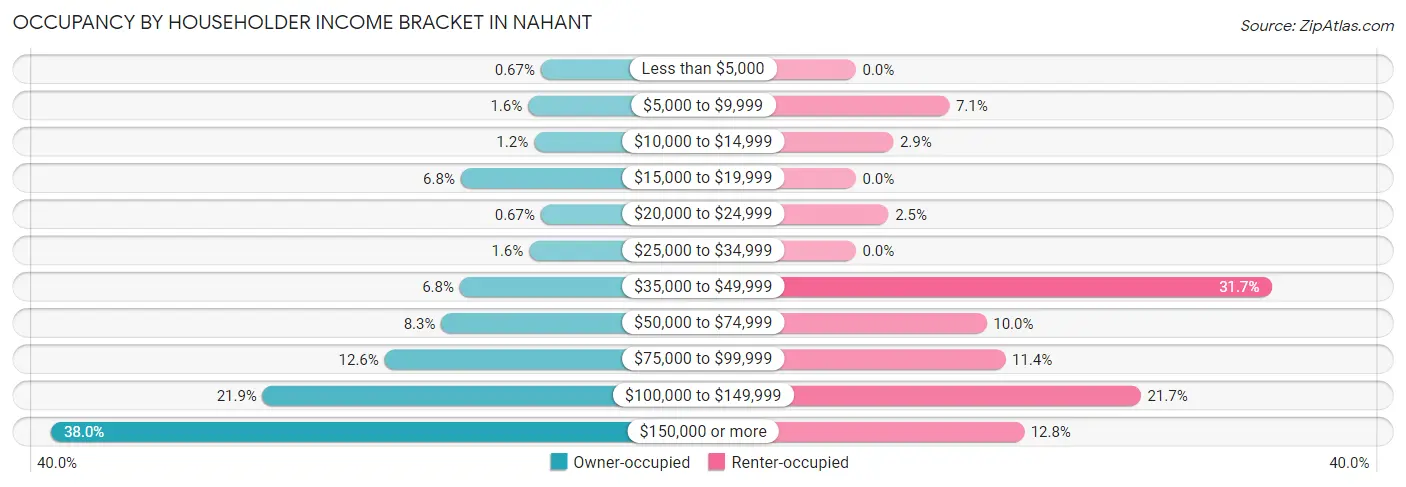
| Income Bracket | Owner-occupied | Renter-occupied |
| Less than $5,000 | 9 (0.7%) | 0 (0.0%) |
| $5,000 to $9,999 | 22 (1.6%) | 20 (7.1%) |
| $10,000 to $14,999 | 16 (1.2%) | 8 (2.9%) |
| $15,000 to $19,999 | 91 (6.8%) | 0 (0.0%) |
| $20,000 to $24,999 | 9 (0.7%) | 7 (2.5%) |
| $25,000 to $34,999 | 21 (1.6%) | 0 (0.0%) |
| $35,000 to $49,999 | 92 (6.8%) | 89 (31.7%) |
| $50,000 to $74,999 | 111 (8.3%) | 28 (10.0%) |
| $75,000 to $99,999 | 169 (12.6%) | 32 (11.4%) |
| $100,000 to $149,999 | 294 (21.9%) | 61 (21.7%) |
| $150,000 or more | 511 (38.0%) | 36 (12.8%) |
| Total | 1,345 (100.0%) | 281 (100.0%) |
Monthly Housing Cost Tiers in Nahant
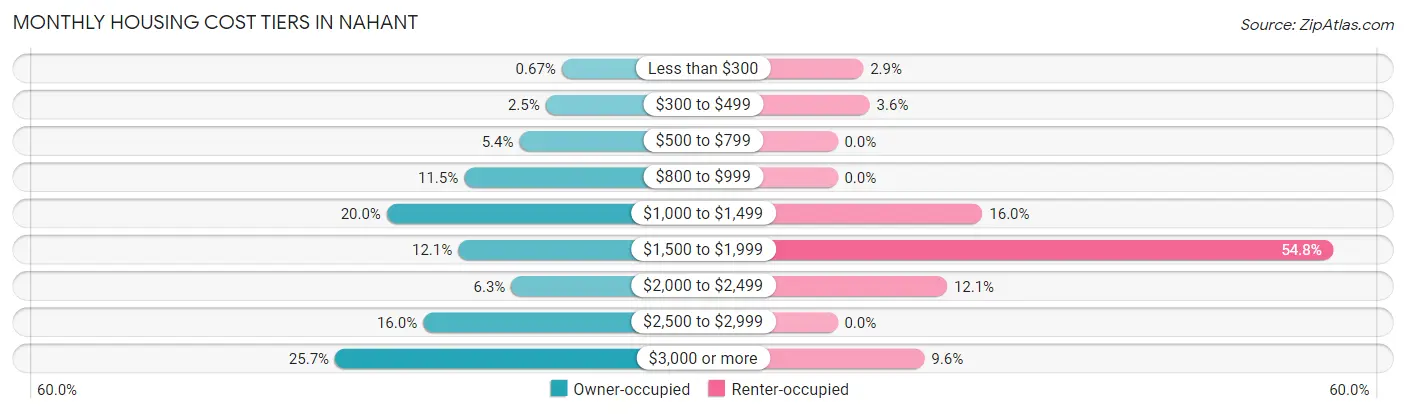
| Monthly Cost | Owner-occupied | Renter-occupied |
| Less than $300 | 9 (0.7%) | 8 (2.9%) |
| $300 to $499 | 33 (2.5%) | 10 (3.6%) |
| $500 to $799 | 72 (5.3%) | 0 (0.0%) |
| $800 to $999 | 154 (11.5%) | 0 (0.0%) |
| $1,000 to $1,499 | 269 (20.0%) | 45 (16.0%) |
| $1,500 to $1,999 | 163 (12.1%) | 154 (54.8%) |
| $2,000 to $2,499 | 84 (6.2%) | 34 (12.1%) |
| $2,500 to $2,999 | 215 (16.0%) | 0 (0.0%) |
| $3,000 or more | 346 (25.7%) | 27 (9.6%) |
| Total | 1,345 (100.0%) | 281 (100.0%) |
Physical Housing Characteristics in Nahant
Housing Structures in Nahant
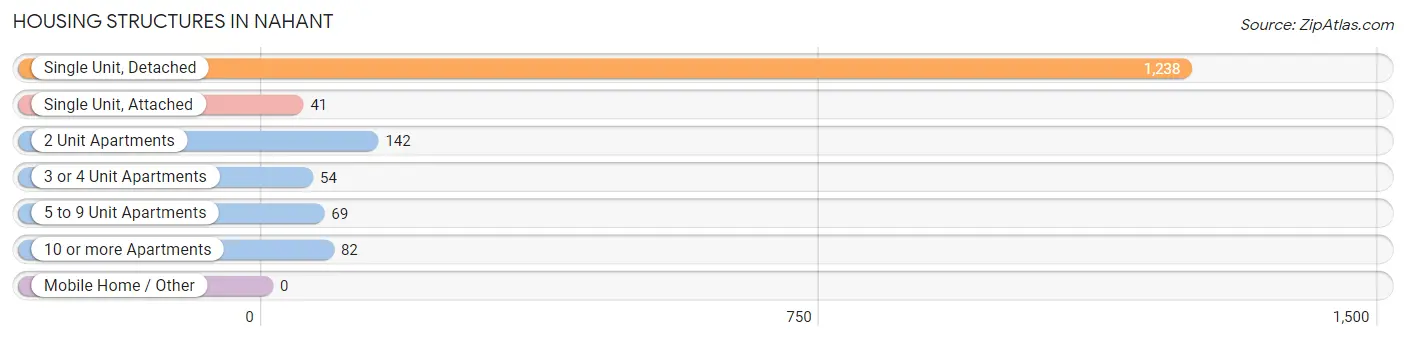
| Structure Type | # Housing Units | % Housing Units |
| Single Unit, Detached | 1,238 | 76.1% |
| Single Unit, Attached | 41 | 2.5% |
| 2 Unit Apartments | 142 | 8.7% |
| 3 or 4 Unit Apartments | 54 | 3.3% |
| 5 to 9 Unit Apartments | 69 | 4.2% |
| 10 or more Apartments | 82 | 5.0% |
| Mobile Home / Other | 0 | 0.0% |
| Total | 1,626 | 100.0% |
Housing Structures by Occupancy in Nahant
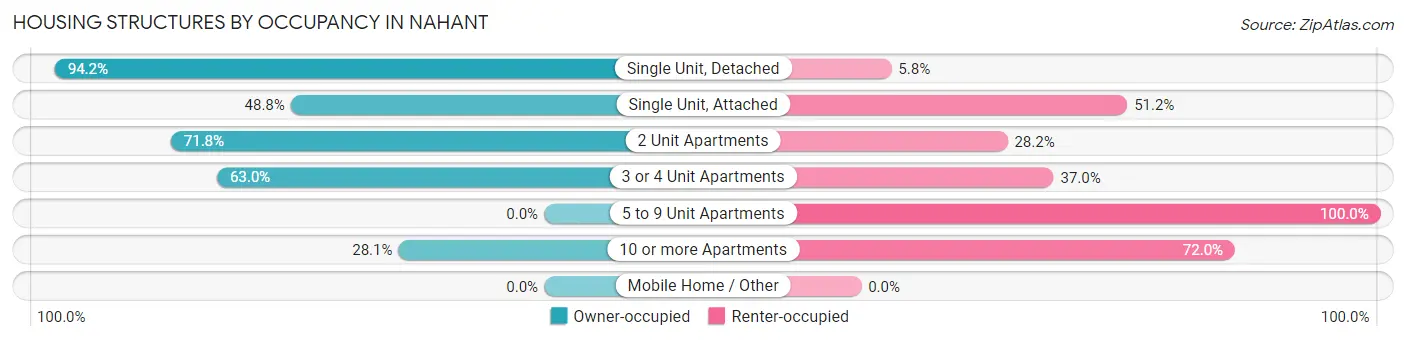
| Structure Type | Owner-occupied | Renter-occupied |
| Single Unit, Detached | 1,166 (94.2%) | 72 (5.8%) |
| Single Unit, Attached | 20 (48.8%) | 21 (51.2%) |
| 2 Unit Apartments | 102 (71.8%) | 40 (28.2%) |
| 3 or 4 Unit Apartments | 34 (63.0%) | 20 (37.0%) |
| 5 to 9 Unit Apartments | 0 (0.0%) | 69 (100.0%) |
| 10 or more Apartments | 23 (28.1%) | 59 (72.0%) |
| Mobile Home / Other | 0 (0.0%) | 0 (0.0%) |
| Total | 1,345 (82.7%) | 281 (17.3%) |
Housing Structures by Number of Rooms in Nahant
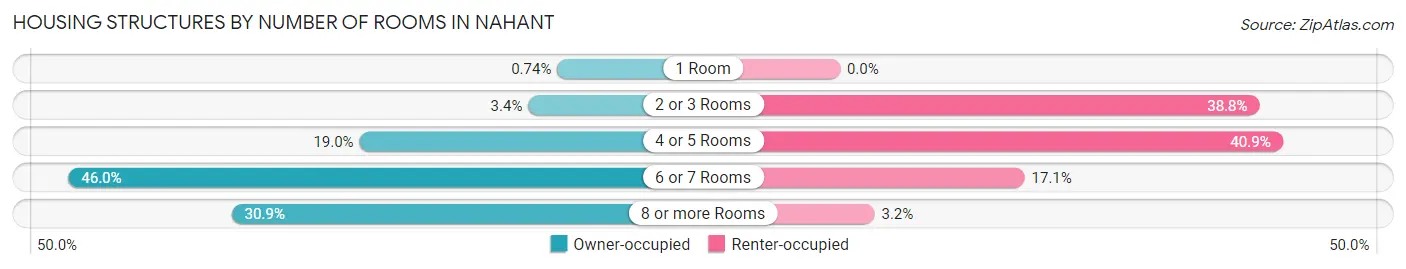
| Number of Rooms | Owner-occupied | Renter-occupied |
| 1 Room | 10 (0.7%) | 0 (0.0%) |
| 2 or 3 Rooms | 46 (3.4%) | 109 (38.8%) |
| 4 or 5 Rooms | 256 (19.0%) | 115 (40.9%) |
| 6 or 7 Rooms | 618 (46.0%) | 48 (17.1%) |
| 8 or more Rooms | 415 (30.9%) | 9 (3.2%) |
| Total | 1,345 (100.0%) | 281 (100.0%) |
Housing Structure by Heating Type in Nahant
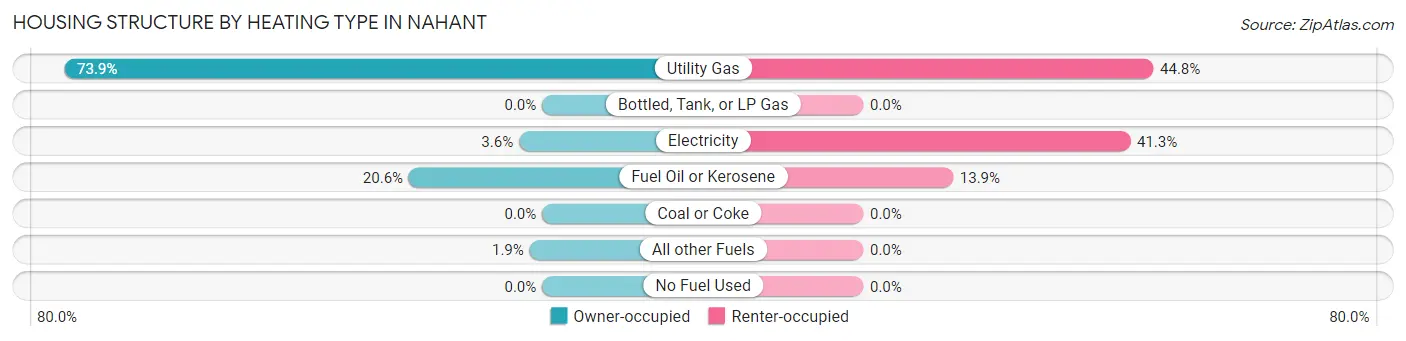
| Heating Type | Owner-occupied | Renter-occupied |
| Utility Gas | 994 (73.9%) | 126 (44.8%) |
| Bottled, Tank, or LP Gas | 0 (0.0%) | 0 (0.0%) |
| Electricity | 48 (3.6%) | 116 (41.3%) |
| Fuel Oil or Kerosene | 277 (20.6%) | 39 (13.9%) |
| Coal or Coke | 0 (0.0%) | 0 (0.0%) |
| All other Fuels | 26 (1.9%) | 0 (0.0%) |
| No Fuel Used | 0 (0.0%) | 0 (0.0%) |
| Total | 1,345 (100.0%) | 281 (100.0%) |
Household Vehicle Usage in Nahant
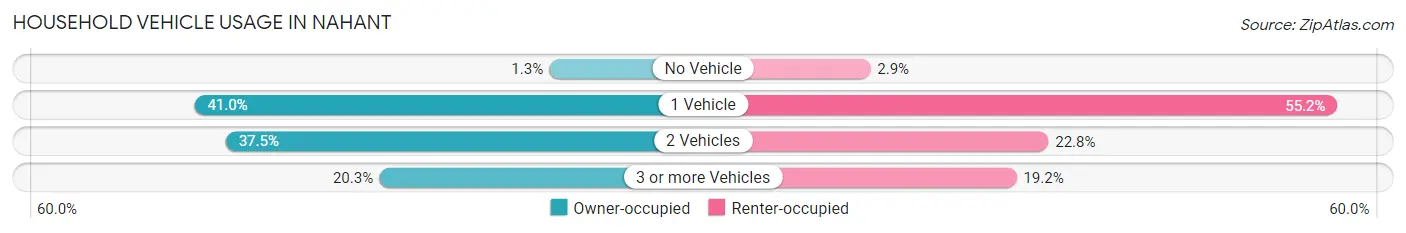
| Vehicles per Household | Owner-occupied | Renter-occupied |
| No Vehicle | 17 (1.3%) | 8 (2.9%) |
| 1 Vehicle | 551 (41.0%) | 155 (55.2%) |
| 2 Vehicles | 504 (37.5%) | 64 (22.8%) |
| 3 or more Vehicles | 273 (20.3%) | 54 (19.2%) |
| Total | 1,345 (100.0%) | 281 (100.0%) |
Real Estate & Mortgages in Nahant
Real Estate and Mortgage Overview in Nahant
| Characteristic | Without Mortgage | With Mortgage |
| Housing Units | 567 | 778 |
| Median Property Value | $695,400 | $638,300 |
| Median Household Income | $83,533 | $345 |
| Monthly Housing Costs | $1,053 | $346 |
| Real Estate Taxes | $6,558 | $33 |
Property Value by Mortgage Status in Nahant
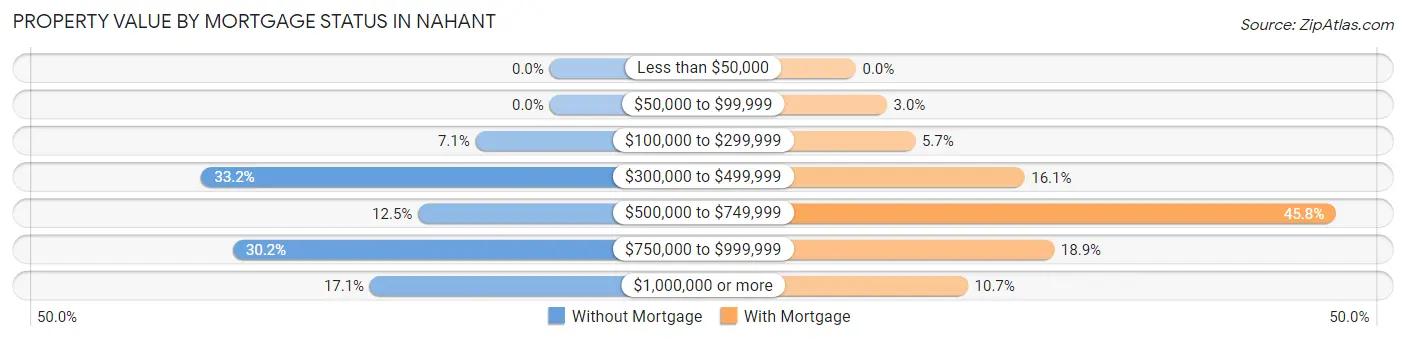
| Property Value | Without Mortgage | With Mortgage |
| Less than $50,000 | 0 (0.0%) | 0 (0.0%) |
| $50,000 to $99,999 | 0 (0.0%) | 23 (3.0%) |
| $100,000 to $299,999 | 40 (7.0%) | 44 (5.7%) |
| $300,000 to $499,999 | 188 (33.2%) | 125 (16.1%) |
| $500,000 to $749,999 | 71 (12.5%) | 356 (45.8%) |
| $750,000 to $999,999 | 171 (30.2%) | 147 (18.9%) |
| $1,000,000 or more | 97 (17.1%) | 83 (10.7%) |
| Total | 567 (100.0%) | 778 (100.0%) |
Household Income by Mortgage Status in Nahant
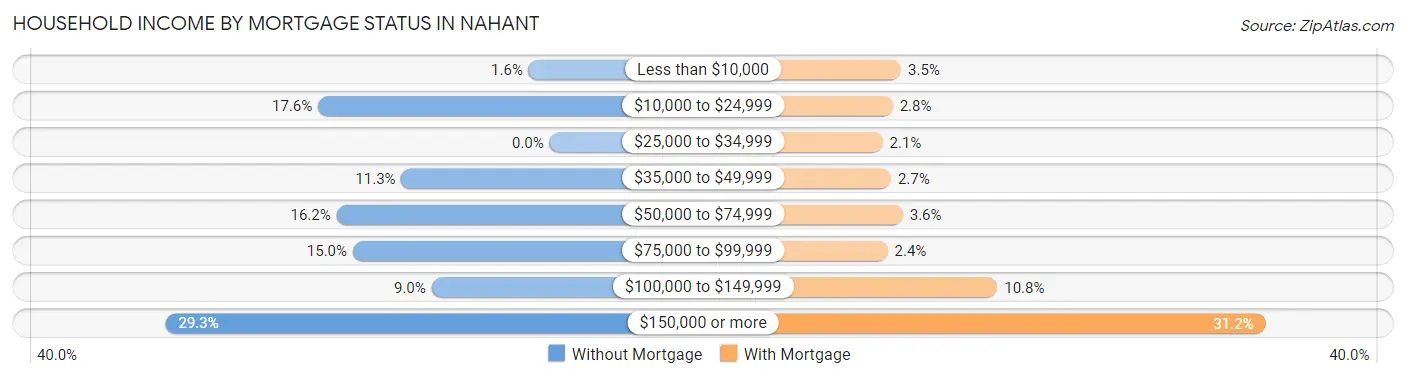
| Household Income | Without Mortgage | With Mortgage |
| Less than $10,000 | 9 (1.6%) | 27 (3.5%) |
| $10,000 to $24,999 | 100 (17.6%) | 22 (2.8%) |
| $25,000 to $34,999 | 0 (0.0%) | 16 (2.1%) |
| $35,000 to $49,999 | 64 (11.3%) | 21 (2.7%) |
| $50,000 to $74,999 | 92 (16.2%) | 28 (3.6%) |
| $75,000 to $99,999 | 85 (15.0%) | 19 (2.4%) |
| $100,000 to $149,999 | 51 (9.0%) | 84 (10.8%) |
| $150,000 or more | 166 (29.3%) | 243 (31.2%) |
| Total | 567 (100.0%) | 778 (100.0%) |
Property Value to Household Income Ratio in Nahant
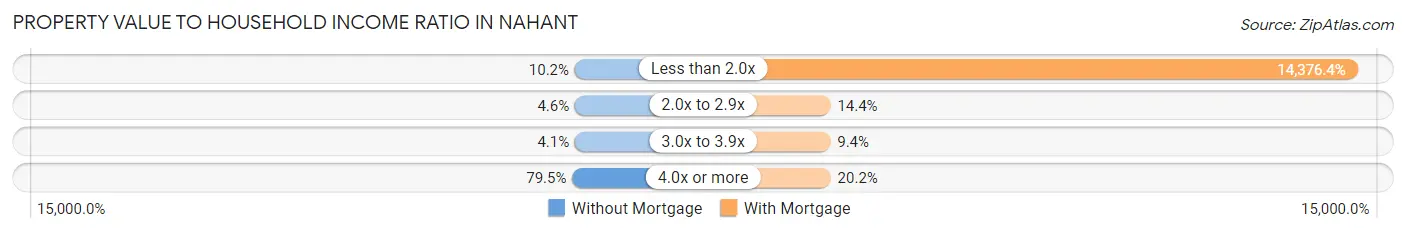
| Value-to-Income Ratio | Without Mortgage | With Mortgage |
| Less than 2.0x | 58 (10.2%) | 111,848 (14,376.3%) |
| 2.0x to 2.9x | 26 (4.6%) | 112 (14.4%) |
| 3.0x to 3.9x | 23 (4.1%) | 73 (9.4%) |
| 4.0x or more | 451 (79.5%) | 157 (20.2%) |
| Total | 567 (100.0%) | 778 (100.0%) |
Real Estate Taxes by Mortgage Status in Nahant
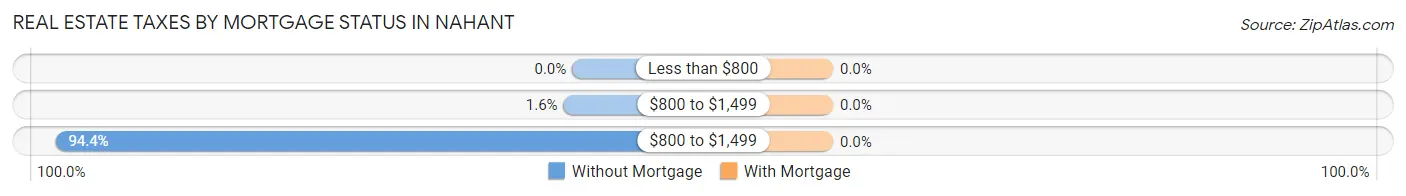
| Property Taxes | Without Mortgage | With Mortgage |
| Less than $800 | 0 (0.0%) | 0 (0.0%) |
| $800 to $1,499 | 9 (1.6%) | 0 (0.0%) |
| $800 to $1,499 | 535 (94.4%) | 0 (0.0%) |
| Total | 567 (100.0%) | 778 (100.0%) |
Health & Disability in Nahant
Health Insurance Coverage by Age in Nahant
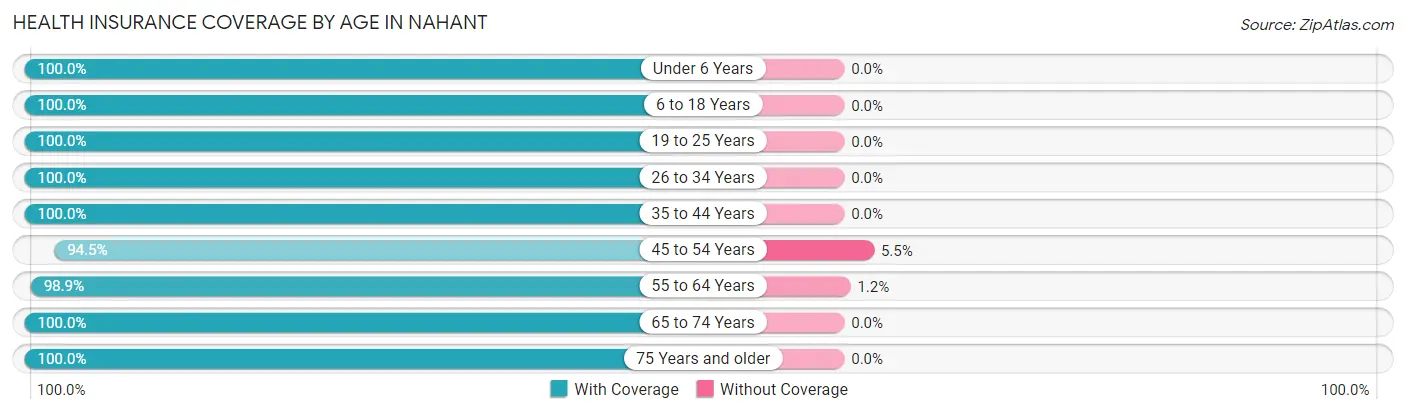
| Age Bracket | With Coverage | Without Coverage |
| Under 6 Years | 116 (100.0%) | 0 (0.0%) |
| 6 to 18 Years | 283 (100.0%) | 0 (0.0%) |
| 19 to 25 Years | 240 (100.0%) | 0 (0.0%) |
| 26 to 34 Years | 157 (100.0%) | 0 (0.0%) |
| 35 to 44 Years | 320 (100.0%) | 0 (0.0%) |
| 45 to 54 Years | 444 (94.5%) | 26 (5.5%) |
| 55 to 64 Years | 688 (98.9%) | 8 (1.1%) |
| 65 to 74 Years | 731 (100.0%) | 0 (0.0%) |
| 75 Years and older | 276 (100.0%) | 0 (0.0%) |
| Total | 3,255 (99.0%) | 34 (1.0%) |
Health Insurance Coverage by Citizenship Status in Nahant
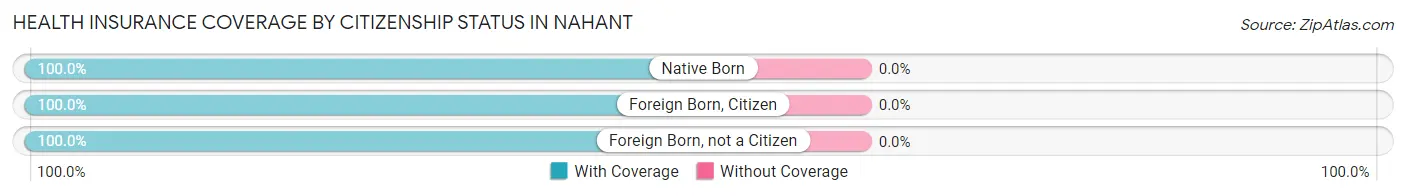
| Citizenship Status | With Coverage | Without Coverage |
| Native Born | 116 (100.0%) | 0 (0.0%) |
| Foreign Born, Citizen | 283 (100.0%) | 0 (0.0%) |
| Foreign Born, not a Citizen | 240 (100.0%) | 0 (0.0%) |
Health Insurance Coverage by Household Income in Nahant
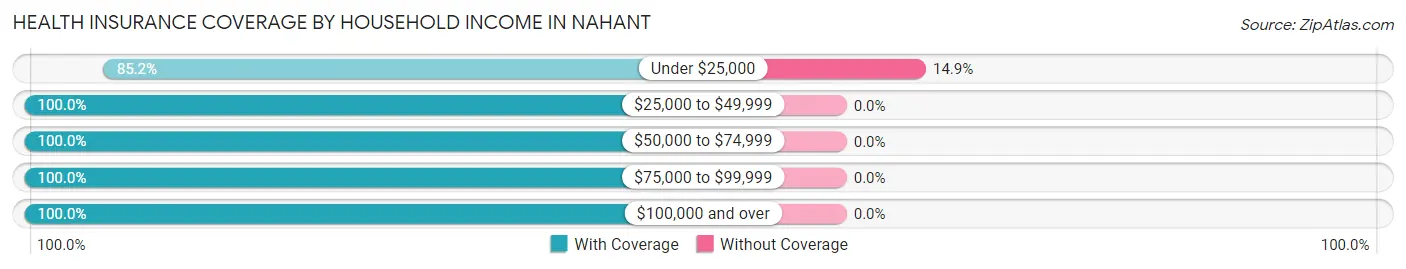
| Household Income | With Coverage | Without Coverage |
| Under $25,000 | 195 (85.2%) | 34 (14.8%) |
| $25,000 to $49,999 | 314 (100.0%) | 0 (0.0%) |
| $50,000 to $74,999 | 314 (100.0%) | 0 (0.0%) |
| $75,000 to $99,999 | 316 (100.0%) | 0 (0.0%) |
| $100,000 and over | 2,112 (100.0%) | 0 (0.0%) |
Public vs Private Health Insurance Coverage by Age in Nahant
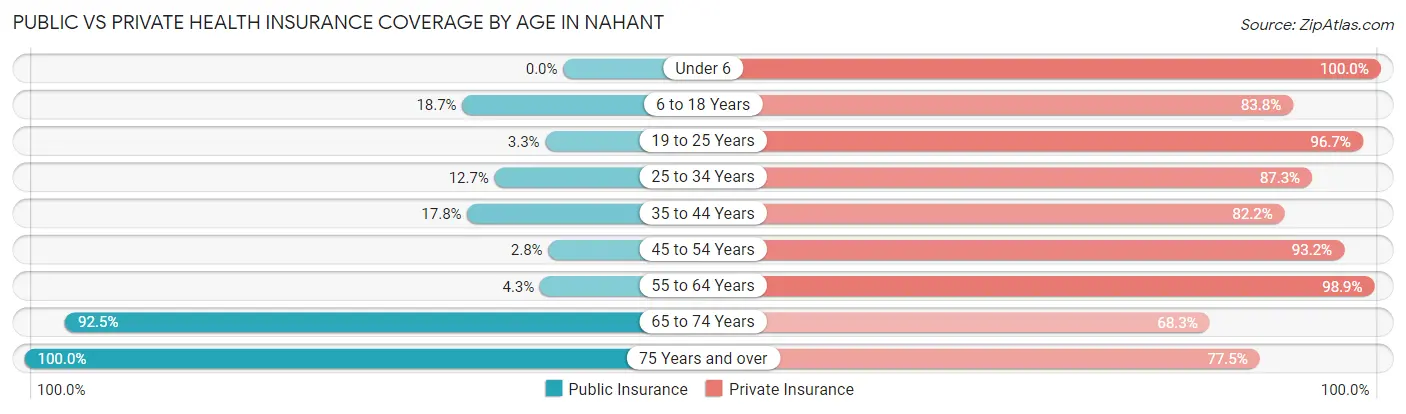
| Age Bracket | Public Insurance | Private Insurance |
| Under 6 | 0 (0.0%) | 116 (100.0%) |
| 6 to 18 Years | 53 (18.7%) | 237 (83.8%) |
| 19 to 25 Years | 8 (3.3%) | 232 (96.7%) |
| 25 to 34 Years | 20 (12.7%) | 137 (87.3%) |
| 35 to 44 Years | 57 (17.8%) | 263 (82.2%) |
| 45 to 54 Years | 13 (2.8%) | 438 (93.2%) |
| 55 to 64 Years | 30 (4.3%) | 688 (98.9%) |
| 65 to 74 Years | 676 (92.5%) | 499 (68.3%) |
| 75 Years and over | 276 (100.0%) | 214 (77.5%) |
| Total | 1,133 (34.4%) | 2,824 (85.9%) |
Disability Status by Sex by Age in Nahant
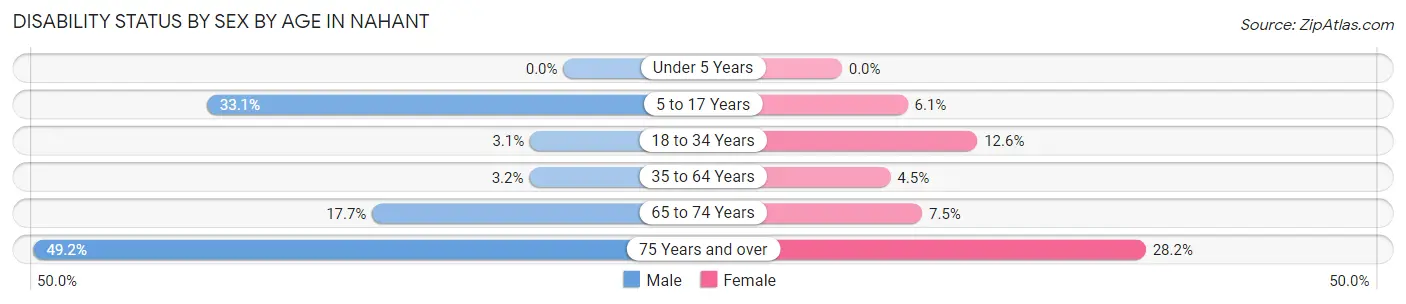
| Age Bracket | Male | Female |
| Under 5 Years | 0 (0.0%) | 0 (0.0%) |
| 5 to 17 Years | 43 (33.1%) | 8 (6.1%) |
| 18 to 34 Years | 8 (3.1%) | 21 (12.6%) |
| 35 to 64 Years | 21 (3.2%) | 37 (4.5%) |
| 65 to 74 Years | 44 (17.7%) | 36 (7.4%) |
| 75 Years and over | 59 (49.2%) | 44 (28.2%) |
Disability Class by Sex by Age in Nahant
Disability Class: Hearing Difficulty
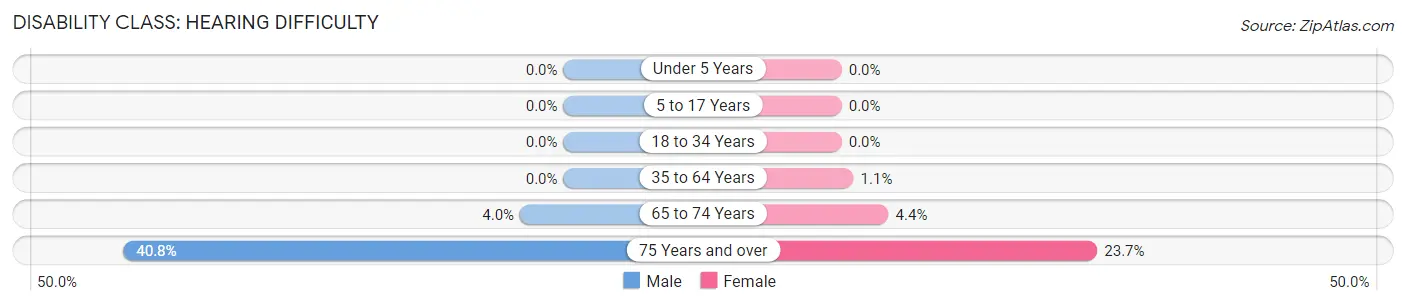
| Age Bracket | Male | Female |
| Under 5 Years | 0 (0.0%) | 0 (0.0%) |
| 5 to 17 Years | 0 (0.0%) | 0 (0.0%) |
| 18 to 34 Years | 0 (0.0%) | 0 (0.0%) |
| 35 to 64 Years | 0 (0.0%) | 9 (1.1%) |
| 65 to 74 Years | 10 (4.0%) | 21 (4.3%) |
| 75 Years and over | 49 (40.8%) | 37 (23.7%) |
Disability Class: Vision Difficulty
| Age Bracket | Male | Female |
| Under 5 Years | 0 (0.0%) | 0 (0.0%) |
| 5 to 17 Years | 0 (0.0%) | 0 (0.0%) |
| 18 to 34 Years | 0 (0.0%) | 0 (0.0%) |
| 35 to 64 Years | 0 (0.0%) | 0 (0.0%) |
| 65 to 74 Years | 0 (0.0%) | 0 (0.0%) |
| 75 Years and over | 0 (0.0%) | 0 (0.0%) |
Disability Class: Cognitive Difficulty
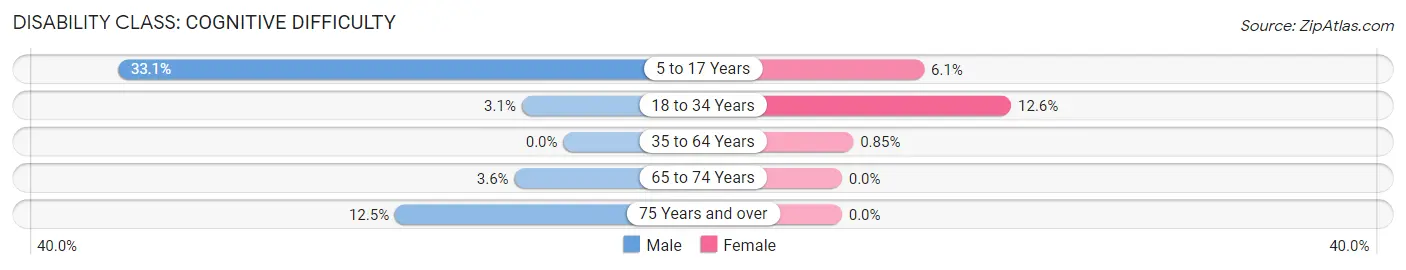
| Age Bracket | Male | Female |
| 5 to 17 Years | 43 (33.1%) | 8 (6.1%) |
| 18 to 34 Years | 8 (3.1%) | 21 (12.6%) |
| 35 to 64 Years | 0 (0.0%) | 7 (0.9%) |
| 65 to 74 Years | 9 (3.6%) | 0 (0.0%) |
| 75 Years and over | 15 (12.5%) | 0 (0.0%) |
Disability Class: Ambulatory Difficulty
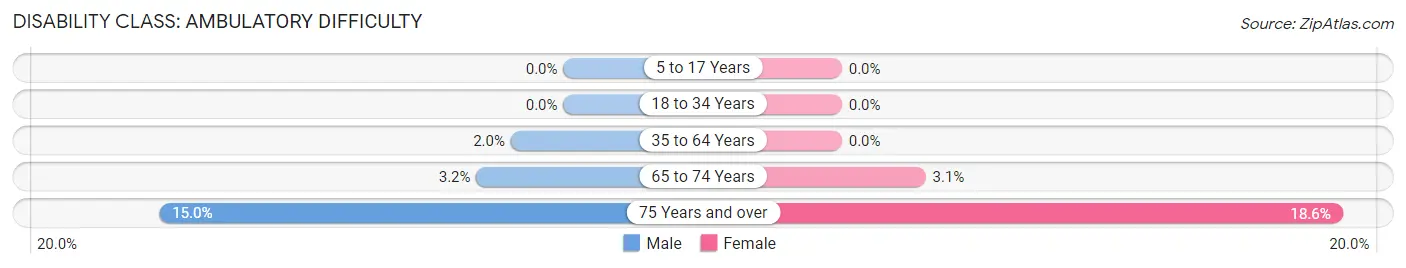
| Age Bracket | Male | Female |
| 5 to 17 Years | 0 (0.0%) | 0 (0.0%) |
| 18 to 34 Years | 0 (0.0%) | 0 (0.0%) |
| 35 to 64 Years | 13 (1.9%) | 0 (0.0%) |
| 65 to 74 Years | 8 (3.2%) | 15 (3.1%) |
| 75 Years and over | 18 (15.0%) | 29 (18.6%) |
Disability Class: Self-Care Difficulty
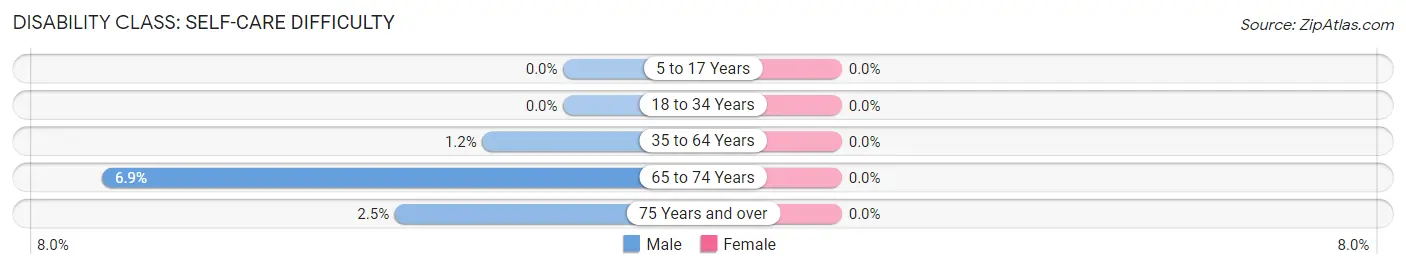
| Age Bracket | Male | Female |
| 5 to 17 Years | 0 (0.0%) | 0 (0.0%) |
| 18 to 34 Years | 0 (0.0%) | 0 (0.0%) |
| 35 to 64 Years | 8 (1.2%) | 0 (0.0%) |
| 65 to 74 Years | 17 (6.9%) | 0 (0.0%) |
| 75 Years and over | 3 (2.5%) | 0 (0.0%) |
Technology Access in Nahant
Computing Device Access in Nahant
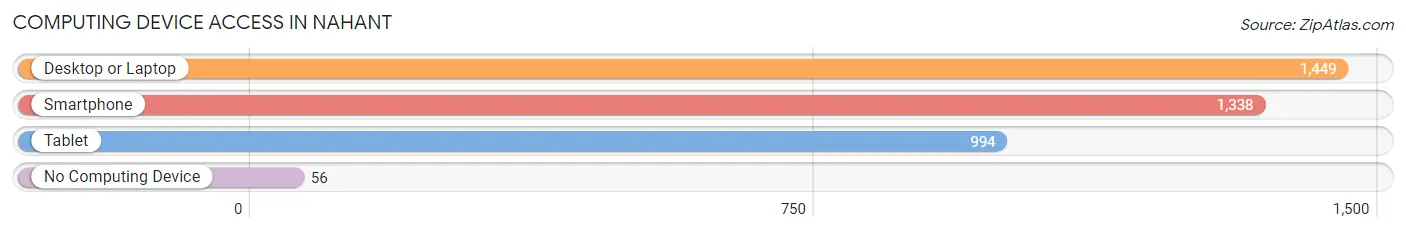
| Device Type | # Households | % Households |
| Desktop or Laptop | 1,449 | 89.1% |
| Smartphone | 1,338 | 82.3% |
| Tablet | 994 | 61.1% |
| No Computing Device | 56 | 3.4% |
| Total | 1,626 | 100.0% |
Internet Access in Nahant
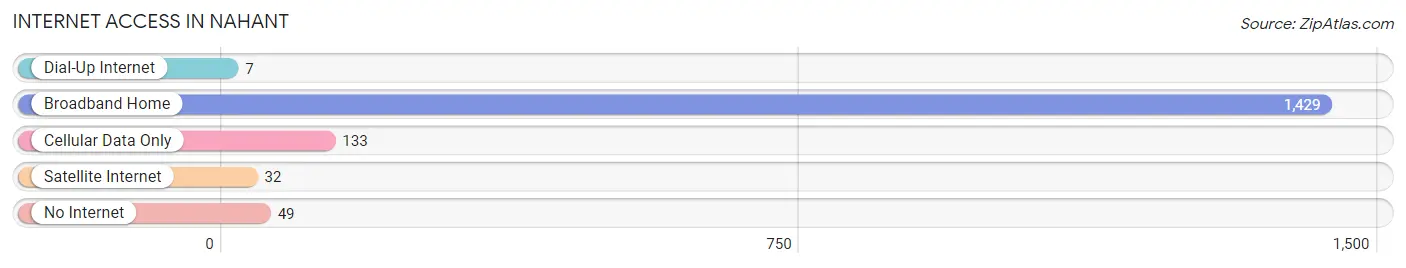
| Internet Type | # Households | % Households |
| Dial-Up Internet | 7 | 0.4% |
| Broadband Home | 1,429 | 87.9% |
| Cellular Data Only | 133 | 8.2% |
| Satellite Internet | 32 | 2.0% |
| No Internet | 49 | 3.0% |
| Total | 1,626 | 100.0% |
Nahant Summary
Nahant is a small town located in Essex County, Massachusetts, United States. It is situated on a peninsula that juts out into the Atlantic Ocean, and is surrounded by the towns of Lynn, Revere, and Swampscott. The town is approximately 4.2 square miles in size, and has a population of approximately 3,410 people as of the 2010 census.
History
Nahant was first settled in 1630 by the English, and was originally part of Lynn. It was officially incorporated as a town in 1853. The town was named after the Native American word for “point of land”, and was originally used as a fishing and farming community. In the 19th century, Nahant became a popular summer resort destination for wealthy Bostonians, and many of the town’s grand Victorian-style homes were built during this time.
Geography
Nahant is located on a peninsula that juts out into the Atlantic Ocean. The town is bordered by the towns of Lynn, Revere, and Swampscott. The town is approximately 4.2 square miles in size, and is made up of mostly rocky coastline and beaches. The highest point in the town is at the summit of Bear Hill, which is approximately 150 feet above sea level.
Economy
Nahant’s economy is largely based on tourism and fishing. The town is home to several popular beaches, including Long Beach, Short Beach, and Nahant Beach. These beaches attract visitors from all over the region, and are popular spots for swimming, fishing, and other recreational activities. The town is also home to several restaurants, shops, and other businesses that cater to tourists.
Demographics
As of the 2010 census, Nahant had a population of 3,410 people. The racial makeup of the town was 94.2% White, 1.2% African American, 0.3% Native American, 1.2% Asian, 0.1% Pacific Islander, 1.2% from other races, and 1.9% from two or more races. The median household income in the town was $76,944, and the median family income was $90,917. The per capita income for the town was $37,945.
Nahant is a small town with a rich history and a unique geography. It is a popular summer destination for tourists, and is home to several beaches and businesses that cater to visitors. The town has a diverse population, and a strong economy based on tourism and fishing.
Common Questions
What is Per Capita Income in Nahant?
Per Capita income in Nahant is $78,467.
What is the Median Family Income in Nahant?
Median Family Income in Nahant is $140,625.
What is the Median Household income in Nahant?
Median Household Income in Nahant is $105,867.
What is Income or Wage Gap in Nahant?
Income or Wage Gap in Nahant is 6.0%.
Women in Nahant earn 94.0 cents for every dollar earned by a man.
What is Inequality or Gini Index in Nahant?
Inequality or Gini Index in Nahant is 0.51.
What is the Total Population of Nahant?
Total Population of Nahant is 3,336.
What is the Total Male Population of Nahant?
Total Male Population of Nahant is 1,519.
What is the Total Female Population of Nahant?
Total Female Population of Nahant is 1,817.
What is the Ratio of Males per 100 Females in Nahant?
There are 83.60 Males per 100 Females in Nahant.
What is the Ratio of Females per 100 Males in Nahant?
There are 119.62 Females per 100 Males in Nahant.
What is the Median Population Age in Nahant?
Median Population Age in Nahant is 58.1 Years.
What is the Average Family Size in Nahant
Average Family Size in Nahant is 2.7 People.
What is the Average Household Size in Nahant
Average Household Size in Nahant is 2.0 People.
How Large is the Labor Force in Nahant?
There are 1,971 People in the Labor Forcein in Nahant.
What is the Percentage of People in the Labor Force in Nahant?
65.5% of People are in the Labor Force in Nahant.
What is the Unemployment Rate in Nahant?
Unemployment Rate in Nahant is 4.2%.