Cities with the Highest Percentage of Population with a Degree in Computers and Mathematics in Massachusetts
RELATED REPORTS & OPTIONS
Computers and Mathematics
Massachusetts
Compare Cities
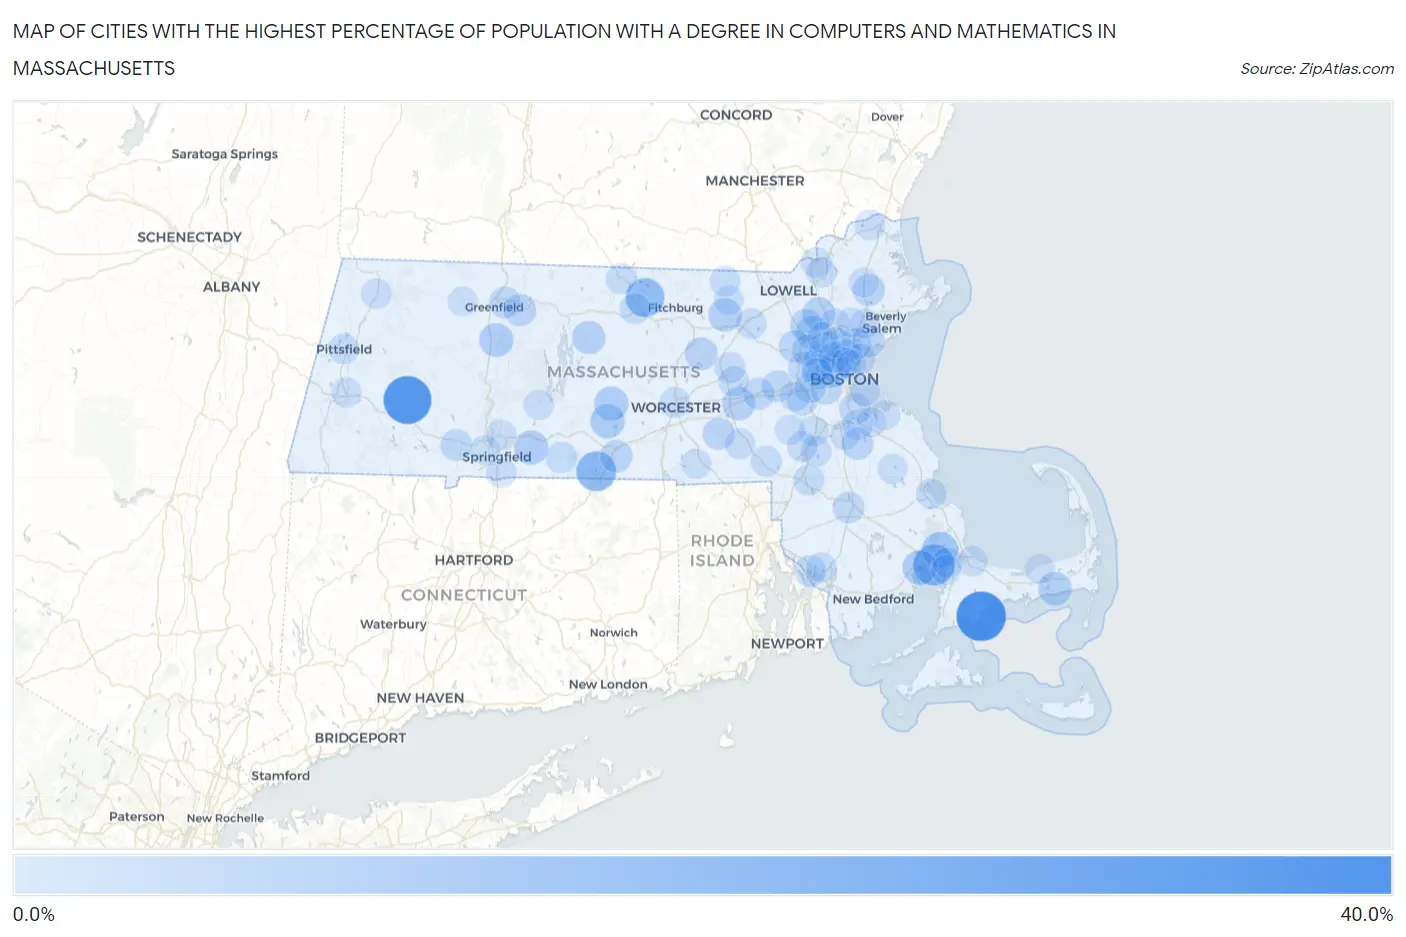
Map of Cities with the Highest Percentage of Population with a Degree in Computers and Mathematics in Massachusetts
0.0%
40.0%
Cities with the Highest Percentage of Population with a Degree in Computers and Mathematics in Massachusetts
| City | % Graduates | vs State | vs National | |
| 1. | Popponesset | 38.2% | 5.3%(+33.0)#1 | 4.9%(+33.3)#187 |
| 2. | Chester | 35.3% | 5.3%(+30.0)#2 | 4.9%(+30.4)#218 |
| 3. | Onset | 23.1% | 5.3%(+17.9)#3 | 4.9%(+18.2)#473 |
| 4. | Holland | 21.0% | 5.3%(+15.8)#4 | 4.9%(+16.1)#560 |
| 5. | South Ashburnham | 19.3% | 5.3%(+14.0)#5 | 4.9%(+14.4)#658 |
| 6. | White Island Shores | 14.7% | 5.3%(+9.40)#6 | 4.9%(+9.77)#1,071 |
| 7. | West Warren | 12.4% | 5.3%(+7.14)#7 | 4.9%(+7.51)#1,459 |
| 8. | Weweantic | 12.2% | 5.3%(+6.91)#8 | 4.9%(+7.28)#1,490 |
| 9. | Brookfield | 11.6% | 5.3%(+6.34)#9 | 4.9%(+6.71)#1,626 |
| 10. | North Brookfield | 11.5% | 5.3%(+6.20)#10 | 4.9%(+6.57)#1,660 |
| 11. | Wilbraham | 11.2% | 5.3%(+5.96)#11 | 4.9%(+6.32)#1,709 |
| 12. | South Deerfield | 11.1% | 5.3%(+5.80)#12 | 4.9%(+6.17)#1,778 |
| 13. | Dennis Port | 10.6% | 5.3%(+5.32)#13 | 4.9%(+5.69)#1,920 |
| 14. | Ayer | 10.2% | 5.3%(+4.90)#14 | 4.9%(+5.27)#2,073 |
| 15. | Petersham | 9.9% | 5.3%(+4.64)#15 | 4.9%(+5.01)#2,192 |
| 16. | Burlington | 9.5% | 5.3%(+4.20)#16 | 4.9%(+4.57)#2,393 |
| 17. | Wilmington | 9.4% | 5.3%(+4.12)#17 | 4.9%(+4.49)#2,428 |
| 18. | Cordaville | 9.3% | 5.3%(+4.06)#18 | 4.9%(+4.43)#2,463 |
| 19. | South Lancaster | 9.2% | 5.3%(+3.90)#19 | 4.9%(+4.27)#2,529 |
| 20. | Sturbridge | 8.7% | 5.3%(+3.42)#20 | 4.9%(+3.79)#2,802 |
| 21. | Cambridge | 8.5% | 5.3%(+3.20)#21 | 4.9%(+3.57)#2,912 |
| 22. | Pinehurst | 8.4% | 5.3%(+3.09)#22 | 4.9%(+3.46)#2,961 |
| 23. | Topsfield | 8.2% | 5.3%(+2.92)#23 | 4.9%(+3.28)#3,098 |
| 24. | Belmont | 8.2% | 5.3%(+2.89)#24 | 4.9%(+3.26)#3,116 |
| 25. | Upton | 8.1% | 5.3%(+2.84)#25 | 4.9%(+3.21)#3,144 |
| 26. | Millers Falls | 8.1% | 5.3%(+2.81)#26 | 4.9%(+3.18)#3,166 |
| 27. | Hanscom Afb | 7.9% | 5.3%(+2.65)#27 | 4.9%(+3.02)#3,278 |
| 28. | Holbrook | 7.7% | 5.3%(+2.47)#28 | 4.9%(+2.84)#3,416 |
| 29. | Lynn | 7.7% | 5.3%(+2.46)#29 | 4.9%(+2.83)#3,421 |
| 30. | Malden | 7.6% | 5.3%(+2.32)#30 | 4.9%(+2.68)#3,550 |
| 31. | Quincy | 7.4% | 5.3%(+2.18)#31 | 4.9%(+2.55)#3,632 |
| 32. | Cochituate | 7.4% | 5.3%(+2.11)#32 | 4.9%(+2.48)#3,692 |
| 33. | Somerville | 7.3% | 5.3%(+2.03)#33 | 4.9%(+2.40)#3,754 |
| 34. | Westfield | 7.2% | 5.3%(+1.98)#34 | 4.9%(+2.35)#3,798 |
| 35. | Arlington | 7.2% | 5.3%(+1.90)#35 | 4.9%(+2.27)#3,842 |
| 36. | Brookline | 7.1% | 5.3%(+1.85)#36 | 4.9%(+2.21)#3,927 |
| 37. | Turners Falls | 7.1% | 5.3%(+1.84)#37 | 4.9%(+2.21)#3,936 |
| 38. | Raynham Center | 7.1% | 5.3%(+1.82)#38 | 4.9%(+2.19)#3,953 |
| 39. | Ocean Grove | 7.0% | 5.3%(+1.77)#39 | 4.9%(+2.14)#3,990 |
| 40. | Framingham | 7.0% | 5.3%(+1.74)#40 | 4.9%(+2.11)#4,021 |
| 41. | Needham | 6.9% | 5.3%(+1.67)#41 | 4.9%(+2.03)#4,100 |
| 42. | Waltham | 6.8% | 5.3%(+1.54)#42 | 4.9%(+1.91)#4,215 |
| 43. | Lexington | 6.8% | 5.3%(+1.53)#43 | 4.9%(+1.90)#4,225 |
| 44. | Melrose | 6.7% | 5.3%(+1.44)#44 | 4.9%(+1.81)#4,314 |
| 45. | Winchester | 6.7% | 5.3%(+1.42)#45 | 4.9%(+1.79)#4,331 |
| 46. | Newton | 6.6% | 5.3%(+1.30)#46 | 4.9%(+1.67)#4,480 |
| 47. | Watertown Town | 6.4% | 5.3%(+1.14)#47 | 4.9%(+1.51)#4,672 |
| 48. | Monson Center | 6.4% | 5.3%(+1.12)#48 | 4.9%(+1.49)#4,693 |
| 49. | Mansfield Center | 6.2% | 5.3%(+0.896)#49 | 4.9%(+1.27)#4,935 |
| 50. | Franklin Town | 6.1% | 5.3%(+0.818)#50 | 4.9%(+1.19)#5,035 |
| 51. | Hudson | 6.1% | 5.3%(+0.791)#51 | 4.9%(+1.16)#5,079 |
| 52. | Gardner | 6.0% | 5.3%(+0.729)#52 | 4.9%(+1.10)#5,171 |
| 53. | Medford | 5.9% | 5.3%(+0.624)#53 | 4.9%(+0.993)#5,286 |
| 54. | Winchendon | 5.9% | 5.3%(+0.592)#54 | 4.9%(+0.961)#5,351 |
| 55. | Marlborough | 5.8% | 5.3%(+0.579)#55 | 4.9%(+0.948)#5,369 |
| 56. | Sharon | 5.8% | 5.3%(+0.521)#56 | 4.9%(+0.891)#5,439 |
| 57. | Littleton Common | 5.8% | 5.3%(+0.512)#57 | 4.9%(+0.881)#5,447 |
| 58. | Pittsfield | 5.7% | 5.3%(+0.421)#58 | 4.9%(+0.790)#5,555 |
| 59. | Saugus | 5.6% | 5.3%(+0.371)#59 | 4.9%(+0.740)#5,620 |
| 60. | Norwood | 5.6% | 5.3%(+0.332)#60 | 4.9%(+0.702)#5,690 |
| 61. | Wellesley | 5.6% | 5.3%(+0.325)#61 | 4.9%(+0.694)#5,707 |
| 62. | Worcester | 5.6% | 5.3%(+0.303)#62 | 4.9%(+0.672)#5,728 |
| 63. | Reading | 5.6% | 5.3%(+0.303)#63 | 4.9%(+0.672)#5,729 |
| 64. | Woburn | 5.6% | 5.3%(+0.292)#64 | 4.9%(+0.662)#5,738 |
| 65. | Methuen Town | 5.5% | 5.3%(+0.247)#65 | 4.9%(+0.616)#5,838 |
| 66. | Pepperell | 5.5% | 5.3%(+0.236)#66 | 4.9%(+0.605)#5,855 |
| 67. | Milford | 5.5% | 5.3%(+0.227)#67 | 4.9%(+0.596)#5,864 |
| 68. | North Plymouth | 5.4% | 5.3%(+0.164)#68 | 4.9%(+0.534)#5,957 |
| 69. | Walpole | 5.4% | 5.3%(+0.124)#69 | 4.9%(+0.494)#6,017 |
| 70. | Buzzards Bay | 5.4% | 5.3%(+0.110)#70 | 4.9%(+0.480)#6,033 |
| 71. | Revere | 5.3% | 5.3%(+0.079)#71 | 4.9%(+0.448)#6,094 |
| 72. | Braintree Town | 5.3% | 5.3%(+0.039)#72 | 4.9%(+0.409)#6,146 |
| 73. | Hingham | 5.3% | 5.3%(+0.023)#73 | 4.9%(+0.393)#6,169 |
| 74. | Chicopee | 5.2% | 5.3%(-0.033)#74 | 4.9%(+0.336)#6,293 |
| 75. | Sandwich | 5.2% | 5.3%(-0.038)#75 | 4.9%(+0.332)#6,298 |
| 76. | Longmeadow | 5.2% | 5.3%(-0.071)#76 | 4.9%(+0.299)#6,354 |
| 77. | Amesbury Town | 5.1% | 5.3%(-0.117)#77 | 4.9%(+0.253)#6,435 |
| 78. | Medfield | 5.1% | 5.3%(-0.134)#78 | 4.9%(+0.235)#6,449 |
| 79. | Amherst | 5.1% | 5.3%(-0.136)#79 | 4.9%(+0.233)#6,467 |
| 80. | Somerset | 5.1% | 5.3%(-0.189)#80 | 4.9%(+0.180)#6,547 |
| 81. | Adams | 5.0% | 5.3%(-0.216)#81 | 4.9%(+0.153)#6,599 |
| 82. | Stoneham | 5.0% | 5.3%(-0.243)#82 | 4.9%(+0.126)#6,634 |
| 83. | Lawrence | 5.0% | 5.3%(-0.309)#83 | 4.9%(+0.060)#6,750 |
| 84. | Lee | 4.9% | 5.3%(-0.328)#84 | 4.9%(+0.042)#6,782 |
| 85. | Randolph Town | 4.9% | 5.3%(-0.393)#85 | 4.9%(-0.024)#6,937 |
| 86. | Hanson | 4.9% | 5.3%(-0.411)#86 | 4.9%(-0.041)#6,969 |
| 87. | Peabody | 4.8% | 5.3%(-0.465)#87 | 4.9%(-0.096)#7,068 |
| 88. | East Douglas | 4.8% | 5.3%(-0.488)#88 | 4.9%(-0.119)#7,102 |
| 89. | Belchertown | 4.8% | 5.3%(-0.496)#89 | 4.9%(-0.127)#7,109 |
| 90. | Boston | 4.8% | 5.3%(-0.511)#90 | 4.9%(-0.142)#7,163 |
| 91. | Shelburne Falls | 4.7% | 5.3%(-0.568)#91 | 4.9%(-0.199)#7,284 |
| 92. | Boxford | 4.7% | 5.3%(-0.569)#92 | 4.9%(-0.199)#7,285 |
| 93. | West Springfield Town | 4.6% | 5.3%(-0.657)#93 | 4.9%(-0.288)#7,467 |
| 94. | Bourne | 4.6% | 5.3%(-0.668)#94 | 4.9%(-0.299)#7,480 |
| 95. | Chelsea | 4.6% | 5.3%(-0.705)#95 | 4.9%(-0.336)#7,542 |
| 96. | Weymouth Town | 4.5% | 5.3%(-0.753)#96 | 4.9%(-0.384)#7,662 |
| 97. | Lynnfield | 4.5% | 5.3%(-0.759)#97 | 4.9%(-0.390)#7,674 |
| 98. | Dennis | 4.5% | 5.3%(-0.765)#98 | 4.9%(-0.396)#7,683 |
| 99. | Everett | 4.5% | 5.3%(-0.777)#99 | 4.9%(-0.408)#7,701 |
| 100. | Groton | 4.5% | 5.3%(-0.794)#100 | 4.9%(-0.425)#7,730 |
Common Questions
What are the Top 10 Cities with the Highest Percentage of Population with a Degree in Computers and Mathematics in Massachusetts?
Top 10 Cities with the Highest Percentage of Population with a Degree in Computers and Mathematics in Massachusetts are:
#1
38.2%
#2
35.3%
#3
23.1%
#4
21.0%
#5
19.3%
#6
14.7%
#7
12.2%
#8
11.6%
#9
11.5%
#10
11.2%
What city has the Highest Percentage of Population with a Degree in Computers and Mathematics in Massachusetts?
Popponesset has the Highest Percentage of Population with a Degree in Computers and Mathematics in Massachusetts with 38.2%.
What is the Percentage of Population with a Degree in Computers and Mathematics in the State of Massachusetts?
Percentage of Population with a Degree in Computers and Mathematics in Massachusetts is 5.3%.
What is the Percentage of Population with a Degree in Computers and Mathematics in the United States?
Percentage of Population with a Degree in Computers and Mathematics in the United States is 4.9%.