Cities with the Highest Percentage of Population Enrolled in Nursery / Preschool in Massachusetts
RELATED REPORTS & OPTIONS
Nursery / Preschool
Massachusetts
Compare Cities
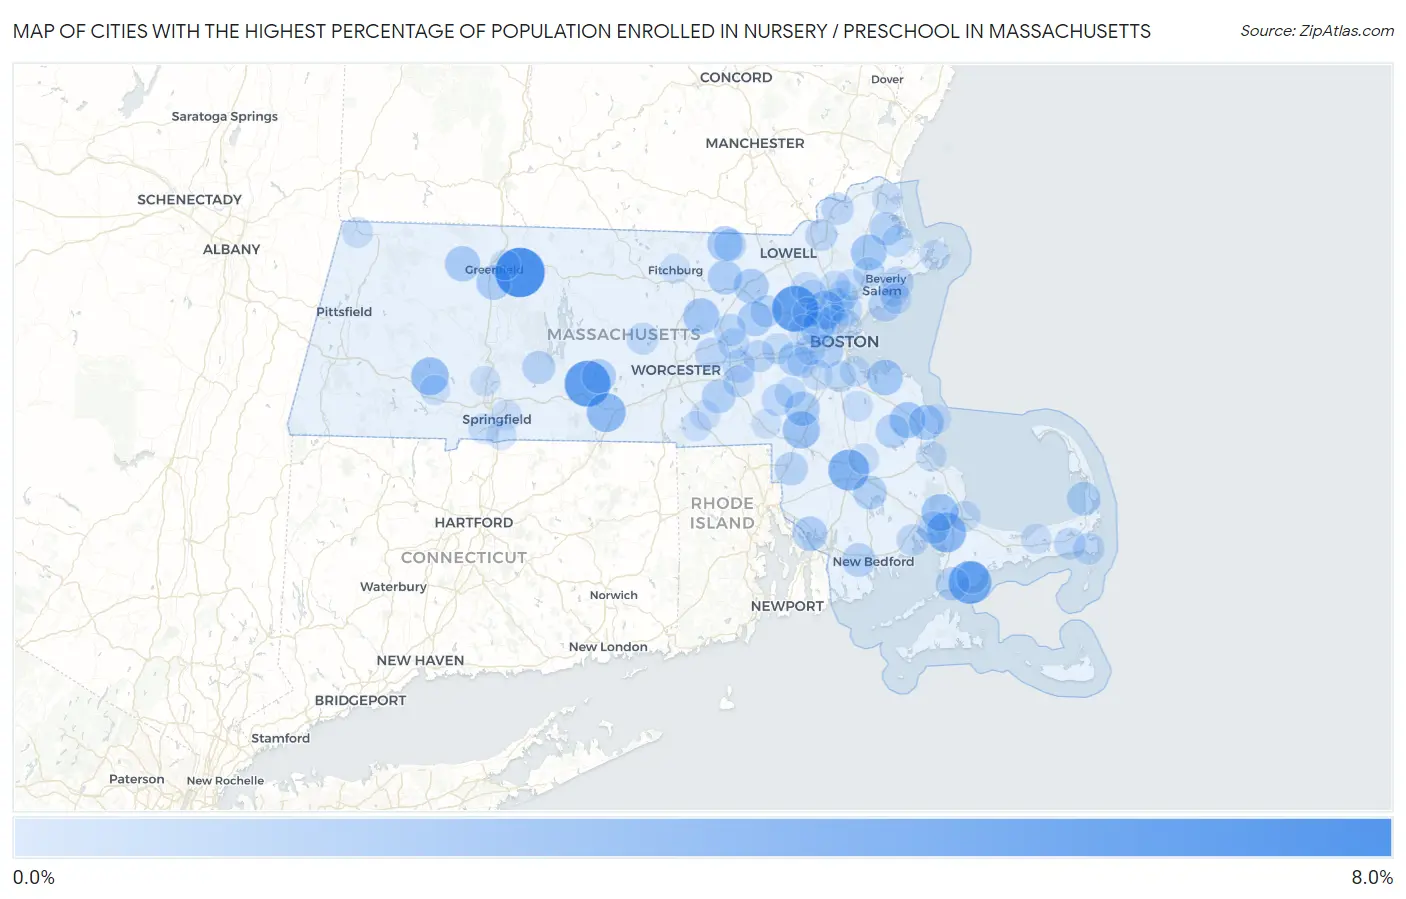
Map of Cities with the Highest Percentage of Population Enrolled in Nursery / Preschool in Massachusetts
0.0%
8.0%
Cities with the Highest Percentage of Population Enrolled in Nursery / Preschool in Massachusetts
| City | % in Nursery | vs State | vs National | |
| 1. | Millers Falls | 7.6% | 1.5%(+6.05)#1 | 1.4%(+6.11)#403 |
| 2. | Green Harbor | 7.0% | 1.5%(+5.53)#2 | 1.4%(+5.58)#488 |
| 3. | Warren | 6.4% | 1.5%(+4.87)#3 | 1.4%(+4.93)#591 |
| 4. | Hanscom Afb | 6.4% | 1.5%(+4.86)#4 | 1.4%(+4.91)#595 |
| 5. | Seconsett Island | 5.4% | 1.5%(+3.88)#5 | 1.4%(+3.94)#882 |
| 6. | Raynham Center | 4.8% | 1.5%(+3.30)#6 | 1.4%(+3.36)#1,140 |
| 7. | Bourne | 4.4% | 1.5%(+2.94)#7 | 1.4%(+3.00)#1,361 |
| 8. | Fiskdale | 4.2% | 1.5%(+2.71)#8 | 1.4%(+2.76)#1,533 |
| 9. | Winchester | 3.9% | 1.5%(+2.37)#9 | 1.4%(+2.43)#1,821 |
| 10. | Huntington | 3.8% | 1.5%(+2.32)#10 | 1.4%(+2.38)#1,877 |
| 11. | Foxborough | 3.7% | 1.5%(+2.16)#11 | 1.4%(+2.21)#2,048 |
| 12. | White Island Shores | 3.6% | 1.5%(+2.05)#12 | 1.4%(+2.11)#2,186 |
| 13. | South Lancaster | 3.3% | 1.5%(+1.84)#13 | 1.4%(+1.89)#2,516 |
| 14. | North Pembroke | 3.2% | 1.5%(+1.71)#14 | 1.4%(+1.77)#2,739 |
| 15. | Topsfield | 3.2% | 1.5%(+1.69)#15 | 1.4%(+1.75)#2,781 |
| 16. | Hingham | 3.2% | 1.5%(+1.67)#16 | 1.4%(+1.73)#2,817 |
| 17. | Shelburne Falls | 3.1% | 1.5%(+1.55)#17 | 1.4%(+1.60)#3,062 |
| 18. | Pepperell | 3.0% | 1.5%(+1.54)#18 | 1.4%(+1.60)#3,067 |
| 19. | Marshfield | 3.0% | 1.5%(+1.51)#19 | 1.4%(+1.56)#3,144 |
| 20. | Littleton Common | 2.9% | 1.5%(+1.44)#20 | 1.4%(+1.50)#3,301 |
| 21. | Maynard | 2.9% | 1.5%(+1.39)#21 | 1.4%(+1.45)#3,441 |
| 22. | Deerfield | 2.9% | 1.5%(+1.38)#22 | 1.4%(+1.43)#3,496 |
| 23. | Walpole | 2.9% | 1.5%(+1.37)#23 | 1.4%(+1.43)#3,514 |
| 24. | Ocean Grove | 2.8% | 1.5%(+1.31)#24 | 1.4%(+1.37)#3,647 |
| 25. | Ayer | 2.8% | 1.5%(+1.31)#25 | 1.4%(+1.37)#3,649 |
| 26. | West Brookfield | 2.8% | 1.5%(+1.27)#26 | 1.4%(+1.32)#3,777 |
| 27. | Wellesley | 2.7% | 1.5%(+1.21)#27 | 1.4%(+1.27)#3,910 |
| 28. | Upton | 2.6% | 1.5%(+1.12)#28 | 1.4%(+1.18)#4,178 |
| 29. | Brookline | 2.6% | 1.5%(+1.12)#29 | 1.4%(+1.18)#4,180 |
| 30. | North Lakeville | 2.6% | 1.5%(+1.11)#30 | 1.4%(+1.17)#4,198 |
| 31. | North Eastham | 2.6% | 1.5%(+1.09)#31 | 1.4%(+1.15)#4,270 |
| 32. | Hanson | 2.6% | 1.5%(+1.08)#32 | 1.4%(+1.14)#4,302 |
| 33. | Smith Mills | 2.5% | 1.5%(+1.04)#33 | 1.4%(+1.10)#4,426 |
| 34. | Belmont | 2.5% | 1.5%(+1.01)#34 | 1.4%(+1.07)#4,530 |
| 35. | Teaticket | 2.5% | 1.5%(+0.993)#35 | 1.4%(+1.05)#4,606 |
| 36. | Rowley | 2.5% | 1.5%(+0.968)#36 | 1.4%(+1.03)#4,723 |
| 37. | Attleboro | 2.5% | 1.5%(+0.948)#37 | 1.4%(+1.00)#4,809 |
| 38. | Swampscott | 2.5% | 1.5%(+0.947)#38 | 1.4%(+1.00)#4,811 |
| 39. | Arlington | 2.4% | 1.5%(+0.879)#39 | 1.4%(+0.936)#5,048 |
| 40. | Belchertown | 2.4% | 1.5%(+0.877)#40 | 1.4%(+0.934)#5,063 |
| 41. | Onset | 2.3% | 1.5%(+0.757)#41 | 1.4%(+0.815)#5,596 |
| 42. | Stoneham | 2.3% | 1.5%(+0.756)#42 | 1.4%(+0.813)#5,603 |
| 43. | Cordaville | 2.3% | 1.5%(+0.750)#43 | 1.4%(+0.807)#5,640 |
| 44. | Seabrook | 2.3% | 1.5%(+0.748)#44 | 1.4%(+0.805)#5,646 |
| 45. | Beverly | 2.2% | 1.5%(+0.733)#45 | 1.4%(+0.790)#5,723 |
| 46. | Haverhill | 2.2% | 1.5%(+0.718)#46 | 1.4%(+0.775)#5,784 |
| 47. | East Pepperell | 2.2% | 1.5%(+0.667)#47 | 1.4%(+0.724)#6,045 |
| 48. | Hudson | 2.2% | 1.5%(+0.660)#48 | 1.4%(+0.717)#6,075 |
| 49. | Northborough | 2.2% | 1.5%(+0.646)#49 | 1.4%(+0.704)#6,141 |
| 50. | West Concord | 2.1% | 1.5%(+0.638)#50 | 1.4%(+0.695)#6,193 |
| 51. | Framingham | 2.1% | 1.5%(+0.599)#51 | 1.4%(+0.657)#6,366 |
| 52. | Lawrence | 2.1% | 1.5%(+0.567)#52 | 1.4%(+0.624)#6,545 |
| 53. | Rutland | 2.1% | 1.5%(+0.548)#53 | 1.4%(+0.606)#6,640 |
| 54. | Harwich Center | 2.0% | 1.5%(+0.539)#54 | 1.4%(+0.596)#6,702 |
| 55. | West Chatham | 2.0% | 1.5%(+0.533)#55 | 1.4%(+0.590)#6,739 |
| 56. | Hopkinton | 2.0% | 1.5%(+0.532)#56 | 1.4%(+0.590)#6,741 |
| 57. | Millis Clicquot | 2.0% | 1.5%(+0.527)#57 | 1.4%(+0.584)#6,771 |
| 58. | Melrose | 2.0% | 1.5%(+0.521)#58 | 1.4%(+0.578)#6,806 |
| 59. | Marion Center | 2.0% | 1.5%(+0.508)#59 | 1.4%(+0.565)#6,873 |
| 60. | Marlborough | 1.9% | 1.5%(+0.399)#60 | 1.4%(+0.456)#7,543 |
| 61. | Milton | 1.9% | 1.5%(+0.396)#61 | 1.4%(+0.454)#7,564 |
| 62. | Wakefield | 1.9% | 1.5%(+0.384)#62 | 1.4%(+0.441)#7,628 |
| 63. | Ipswich | 1.9% | 1.5%(+0.367)#63 | 1.4%(+0.424)#7,747 |
| 64. | Cochituate | 1.9% | 1.5%(+0.357)#64 | 1.4%(+0.415)#7,830 |
| 65. | Pinehurst | 1.9% | 1.5%(+0.354)#65 | 1.4%(+0.411)#7,850 |
| 66. | Lynnfield | 1.9% | 1.5%(+0.346)#66 | 1.4%(+0.404)#7,919 |
| 67. | Medfield | 1.8% | 1.5%(+0.335)#67 | 1.4%(+0.392)#7,997 |
| 68. | Danvers | 1.8% | 1.5%(+0.324)#68 | 1.4%(+0.382)#8,065 |
| 69. | Sagamore | 1.8% | 1.5%(+0.320)#69 | 1.4%(+0.377)#8,090 |
| 70. | Needham | 1.8% | 1.5%(+0.314)#70 | 1.4%(+0.371)#8,135 |
| 71. | Everett | 1.8% | 1.5%(+0.300)#71 | 1.4%(+0.357)#8,210 |
| 72. | Reading | 1.8% | 1.5%(+0.290)#72 | 1.4%(+0.347)#8,288 |
| 73. | Quincy | 1.8% | 1.5%(+0.260)#73 | 1.4%(+0.317)#8,492 |
| 74. | Burlington | 1.8% | 1.5%(+0.254)#74 | 1.4%(+0.311)#8,534 |
| 75. | Dedham | 1.8% | 1.5%(+0.250)#75 | 1.4%(+0.307)#8,555 |
| 76. | Holbrook | 1.7% | 1.5%(+0.224)#76 | 1.4%(+0.282)#8,763 |
| 77. | Newburyport | 1.7% | 1.5%(+0.224)#77 | 1.4%(+0.282)#8,764 |
| 78. | Williamstown | 1.7% | 1.5%(+0.216)#78 | 1.4%(+0.273)#8,830 |
| 79. | North Plymouth | 1.7% | 1.5%(+0.207)#79 | 1.4%(+0.265)#8,890 |
| 80. | Agawam Town | 1.7% | 1.5%(+0.205)#80 | 1.4%(+0.263)#8,910 |
| 81. | Waltham | 1.7% | 1.5%(+0.189)#81 | 1.4%(+0.247)#9,031 |
| 82. | Bridgewater Town | 1.7% | 1.5%(+0.186)#82 | 1.4%(+0.243)#9,055 |
| 83. | Gloucester | 1.7% | 1.5%(+0.185)#83 | 1.4%(+0.242)#9,068 |
| 84. | Salem | 1.7% | 1.5%(+0.180)#84 | 1.4%(+0.237)#9,113 |
| 85. | Marblehead | 1.7% | 1.5%(+0.172)#85 | 1.4%(+0.229)#9,176 |
| 86. | Turners Falls | 1.7% | 1.5%(+0.158)#86 | 1.4%(+0.216)#9,291 |
| 87. | Springfield | 1.7% | 1.5%(+0.145)#87 | 1.4%(+0.202)#9,391 |
| 88. | Whitinsville | 1.6% | 1.5%(+0.132)#88 | 1.4%(+0.189)#9,490 |
| 89. | Newton | 1.6% | 1.5%(+0.124)#89 | 1.4%(+0.181)#9,564 |
| 90. | Holyoke | 1.6% | 1.5%(+0.105)#90 | 1.4%(+0.162)#9,707 |
| 91. | Greenfield | 1.6% | 1.5%(+0.105)#91 | 1.4%(+0.162)#9,710 |
| 92. | Yarmouth Port | 1.6% | 1.5%(+0.083)#92 | 1.4%(+0.141)#9,876 |
| 93. | Longmeadow | 1.6% | 1.5%(+0.081)#93 | 1.4%(+0.138)#9,897 |
| 94. | Russell | 1.6% | 1.5%(+0.066)#94 | 1.4%(+0.123)#10,050 |
| 95. | Ocean Bluff Brant Rock | 1.6% | 1.5%(+0.054)#95 | 1.4%(+0.111)#10,137 |
| 96. | East Douglas | 1.5% | 1.5%(+0.041)#96 | 1.4%(+0.098)#10,250 |
| 97. | Lexington | 1.5% | 1.5%(+0.029)#97 | 1.4%(+0.086)#10,344 |
| 98. | Franklin Town | 1.5% | 1.5%(+0.027)#98 | 1.4%(+0.084)#10,363 |
| 99. | Fitchburg | 1.5% | 1.5%(+0.025)#99 | 1.4%(+0.083)#10,371 |
| 100. | Medford | 1.5% | 1.5%(+0.004)#100 | 1.4%(+0.062)#10,550 |
Common Questions
What are the Top 10 Cities with the Highest Percentage of Population Enrolled in Nursery / Preschool in Massachusetts?
Top 10 Cities with the Highest Percentage of Population Enrolled in Nursery / Preschool in Massachusetts are:
#1
7.6%
#2
6.4%
#3
6.4%
#4
5.4%
#5
4.8%
#6
4.4%
#7
4.2%
#8
3.9%
#9
3.8%
#10
3.7%
What city has the Highest Percentage of Population Enrolled in Nursery / Preschool in Massachusetts?
Millers Falls has the Highest Percentage of Population Enrolled in Nursery / Preschool in Massachusetts with 7.6%.
What is the Percentage of Population Enrolled in Nursery / Preschool in the State of Massachusetts?
Percentage of Population Enrolled in Nursery / Preschool in Massachusetts is 1.5%.
What is the Percentage of Population Enrolled in Nursery / Preschool in the United States?
Percentage of Population Enrolled in Nursery / Preschool in the United States is 1.4%.