North Adams, MA Map & Demographics
North Adams Map
North Adams Overview
$34,417
PER CAPITA INCOME
$69,861
AVG FAMILY INCOME
$49,525
AVG HOUSEHOLD INCOME
29.2%
WAGE / INCOME GAP [ % ]
70.8¢/ $1
WAGE / INCOME GAP [ $ ]
0.51
INEQUALITY / GINI INDEX
12,937
TOTAL POPULATION
6,526
MALE POPULATION
6,411
FEMALE POPULATION
101.79
MALES / 100 FEMALES
98.24
FEMALES / 100 MALES
44.5
MEDIAN AGE
2.8
AVG FAMILY SIZE
2.1
AVG HOUSEHOLD SIZE
6,429
LABOR FORCE [ PEOPLE ]
58.3%
PERCENT IN LABOR FORCE
5.0%
UNEMPLOYMENT RATE
North Adams Zip Codes
North Adams Area Codes
Income in North Adams
Income Overview in North Adams
Per Capita Income in North Adams is $34,417, while median incomes of families and households are $69,861 and $49,525 respectively.
| Characteristic | Number | Measure |
| Per Capita Income | 12,937 | $34,417 |
| Median Family Income | 2,910 | $69,861 |
| Mean Family Income | 2,910 | $96,358 |
| Median Household Income | 5,816 | $49,525 |
| Mean Household Income | 5,816 | $74,258 |
| Income Deficit | 2,910 | $0 |
| Wage / Income Gap (%) | 12,937 | 29.15% |
| Wage / Income Gap ($) | 12,937 | 70.85¢ per $1 |
| Gini / Inequality Index | 12,937 | 0.51 |
Earnings by Sex in North Adams
Average Earnings in North Adams are $35,770, $40,044 for men and $28,371 for women, a difference of 29.1%.
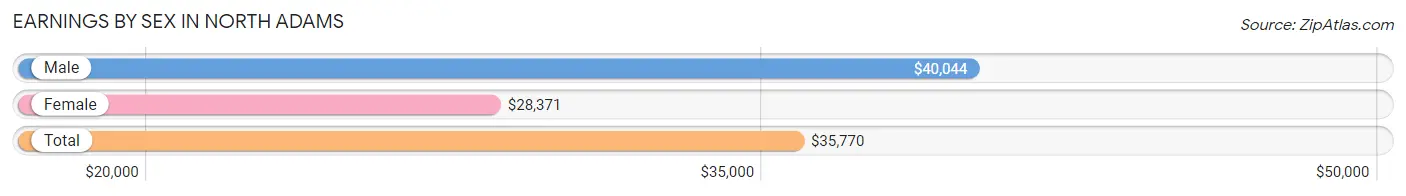
| Sex | Number | Average Earnings |
| Male | 3,457 (51.1%) | $40,044 |
| Female | 3,307 (48.9%) | $28,371 |
| Total | 6,764 (100.0%) | $35,770 |
Earnings by Sex by Income Bracket in North Adams
The most common earnings brackets in North Adams are $100,000+ for men (397 | 11.5%) and $55,000 to $64,999 for women (338 | 10.2%).
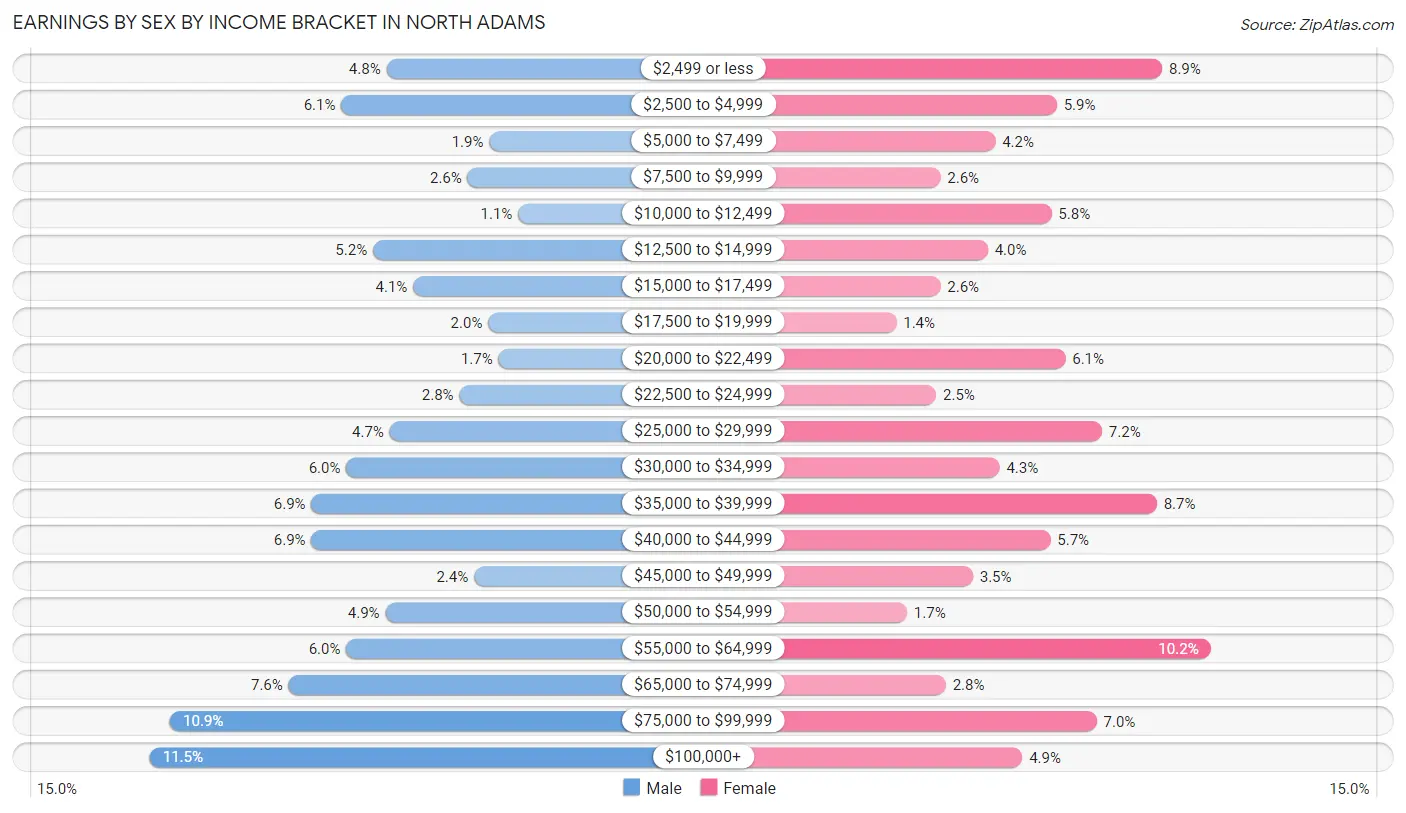
| Income | Male | Female |
| $2,499 or less | 167 (4.8%) | 293 (8.9%) |
| $2,500 to $4,999 | 211 (6.1%) | 195 (5.9%) |
| $5,000 to $7,499 | 67 (1.9%) | 138 (4.2%) |
| $7,500 to $9,999 | 88 (2.5%) | 87 (2.6%) |
| $10,000 to $12,499 | 39 (1.1%) | 190 (5.8%) |
| $12,500 to $14,999 | 180 (5.2%) | 131 (4.0%) |
| $15,000 to $17,499 | 141 (4.1%) | 87 (2.6%) |
| $17,500 to $19,999 | 68 (2.0%) | 46 (1.4%) |
| $20,000 to $22,499 | 58 (1.7%) | 203 (6.1%) |
| $22,500 to $24,999 | 96 (2.8%) | 83 (2.5%) |
| $25,000 to $29,999 | 164 (4.7%) | 237 (7.2%) |
| $30,000 to $34,999 | 206 (6.0%) | 142 (4.3%) |
| $35,000 to $39,999 | 240 (6.9%) | 288 (8.7%) |
| $40,000 to $44,999 | 240 (6.9%) | 189 (5.7%) |
| $45,000 to $49,999 | 82 (2.4%) | 117 (3.5%) |
| $50,000 to $54,999 | 168 (4.9%) | 56 (1.7%) |
| $55,000 to $64,999 | 206 (6.0%) | 338 (10.2%) |
| $65,000 to $74,999 | 262 (7.6%) | 92 (2.8%) |
| $75,000 to $99,999 | 377 (10.9%) | 232 (7.0%) |
| $100,000+ | 397 (11.5%) | 163 (4.9%) |
| Total | 3,457 (100.0%) | 3,307 (100.0%) |
Earnings by Sex by Educational Attainment in North Adams
Average earnings in North Adams are $45,550 for men and $39,071 for women, a difference of 14.2%. Men with an educational attainment of bachelor's degree enjoy the highest average annual earnings of $67,829, while those with less than high school education earn the least with $33,568. Women with an educational attainment of graduate degree earn the most with the average annual earnings of $67,100, while those with college or associate's degree education have the smallest earnings of $32,440.
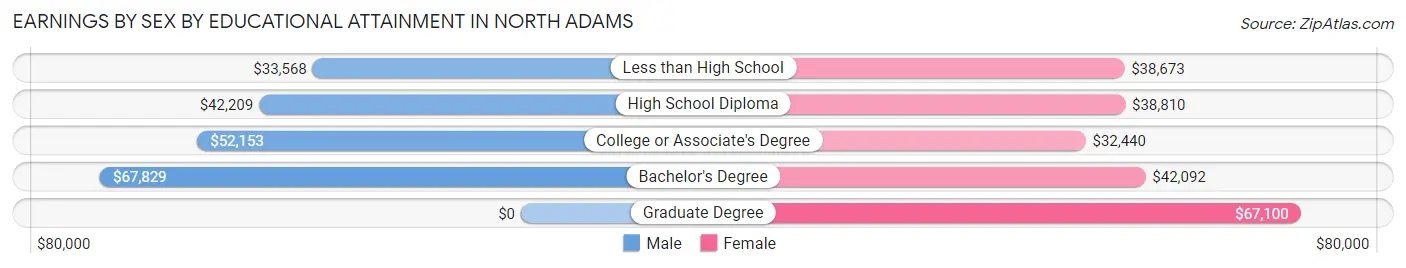
| Educational Attainment | Male Income | Female Income |
| Less than High School | $33,568 | $38,673 |
| High School Diploma | $42,209 | $38,810 |
| College or Associate's Degree | $52,153 | $32,440 |
| Bachelor's Degree | $67,829 | $42,092 |
| Graduate Degree | - | - |
| Total | $45,550 | $39,071 |
Family Income in North Adams
Family Income Brackets in North Adams
According to the North Adams family income data, there are 553 families falling into the $50,000 to $74,999 income range, which is the most common income bracket and makes up 19.0% of all families. Conversely, the $10,000 to $14,999 income bracket is the least frequent group with only 137 families (4.7%) belonging to this category.
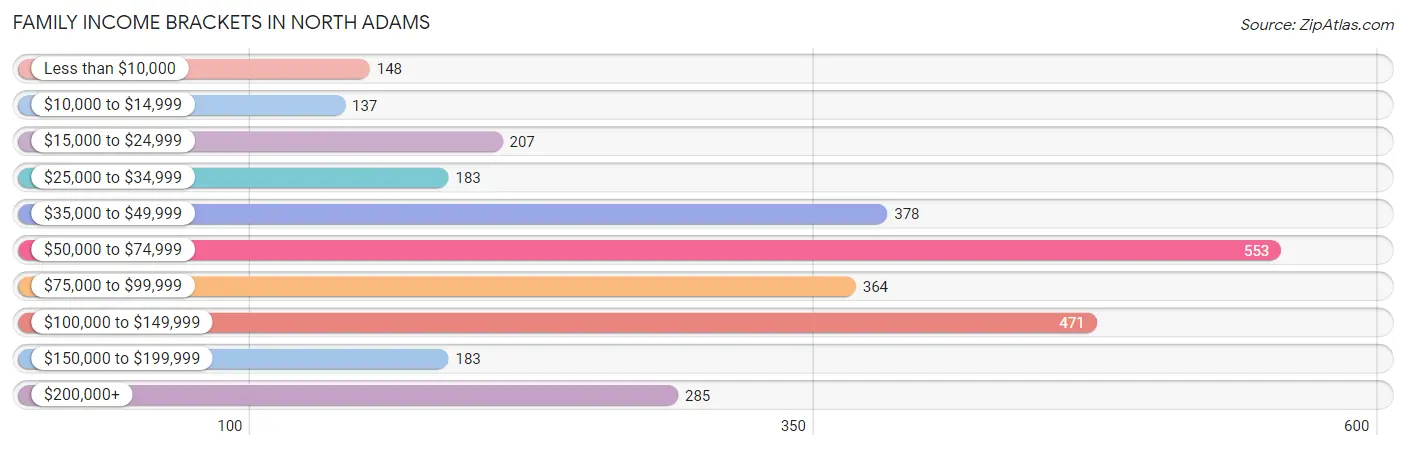
| Income Bracket | # Families | % Families |
| Less than $10,000 | 148 | 5.1% |
| $10,000 to $14,999 | 137 | 4.7% |
| $15,000 to $24,999 | 207 | 7.1% |
| $25,000 to $34,999 | 183 | 6.3% |
| $35,000 to $49,999 | 378 | 13.0% |
| $50,000 to $74,999 | 553 | 19.0% |
| $75,000 to $99,999 | 364 | 12.5% |
| $100,000 to $149,999 | 471 | 16.2% |
| $150,000 to $199,999 | 183 | 6.3% |
| $200,000+ | 285 | 9.8% |
Family Income by Famaliy Size in North Adams
5-person families (105 | 3.6%) account for the highest median family income in North Adams with $229,542 per family, while 5-person families (105 | 3.6%) have the highest median income of $45,908 per family member.
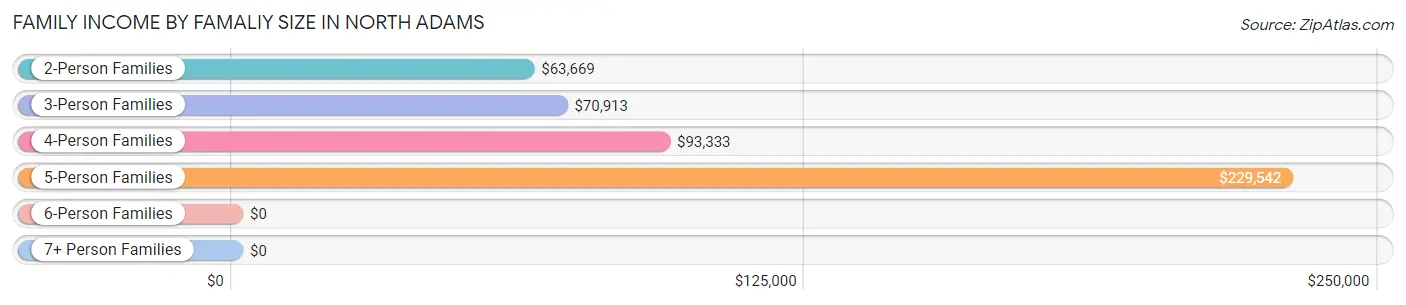
| Income Bracket | # Families | Median Income |
| 2-Person Families | 1,640 (56.4%) | $63,669 |
| 3-Person Families | 726 (24.9%) | $70,913 |
| 4-Person Families | 372 (12.8%) | $93,333 |
| 5-Person Families | 105 (3.6%) | $229,542 |
| 6-Person Families | 12 (0.4%) | $0 |
| 7+ Person Families | 55 (1.9%) | $0 |
| Total | 2,910 (100.0%) | $69,861 |
Family Income by Number of Earners in North Adams
The median family income in North Adams is $69,861, with families comprising 3+ earners (314) having the highest median family income of $145,357, while families with 1 earner (980) have the lowest median family income of $40,526, accounting for 10.8% and 33.7% of families, respectively.
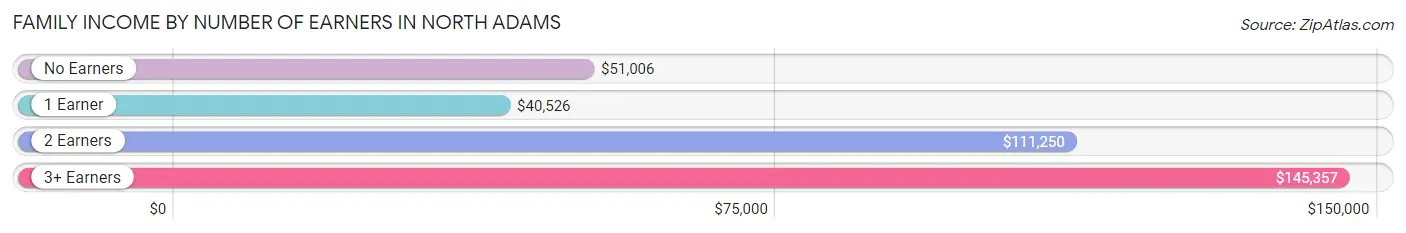
| Number of Earners | # Families | Median Income |
| No Earners | 765 (26.3%) | $51,006 |
| 1 Earner | 980 (33.7%) | $40,526 |
| 2 Earners | 851 (29.2%) | $111,250 |
| 3+ Earners | 314 (10.8%) | $145,357 |
| Total | 2,910 (100.0%) | $69,861 |
Household Income in North Adams
Household Income Brackets in North Adams
With 907 households falling in the category, the $50,000 to $74,999 income range is the most frequent in North Adams, accounting for 15.6% of all households. In contrast, only 279 households (4.8%) fall into the $150,000 to $199,999 income bracket, making it the least populous group.
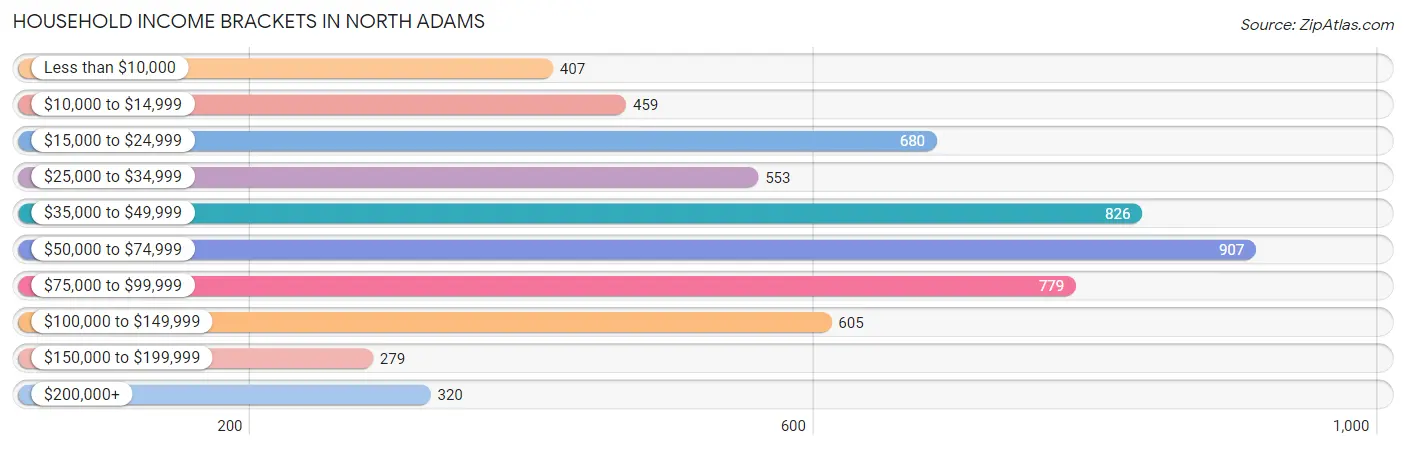
| Income Bracket | # Households | % Households |
| Less than $10,000 | 407 | 7.0% |
| $10,000 to $14,999 | 459 | 7.9% |
| $15,000 to $24,999 | 680 | 11.7% |
| $25,000 to $34,999 | 553 | 9.5% |
| $35,000 to $49,999 | 826 | 14.2% |
| $50,000 to $74,999 | 907 | 15.6% |
| $75,000 to $99,999 | 779 | 13.4% |
| $100,000 to $149,999 | 605 | 10.4% |
| $150,000 to $199,999 | 279 | 4.8% |
| $200,000+ | 320 | 5.5% |
Household Income by Householder Age in North Adams
The median household income in North Adams is $49,525, with the highest median household income of $64,479 found in the 45 to 64 years age bracket for the primary householder. A total of 2,322 households (39.9%) fall into this category. Meanwhile, the 15 to 24 years age bracket for the primary householder has the lowest median household income of $24,327, with 299 households (5.1%) in this group.
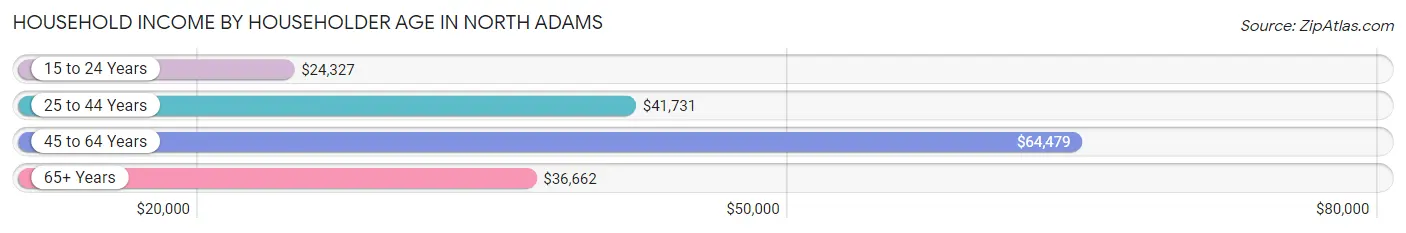
| Income Bracket | # Households | Median Income |
| 15 to 24 Years | 299 (5.1%) | $24,327 |
| 25 to 44 Years | 1,352 (23.3%) | $41,731 |
| 45 to 64 Years | 2,322 (39.9%) | $64,479 |
| 65+ Years | 1,843 (31.7%) | $36,662 |
| Total | 5,816 (100.0%) | $49,525 |
Poverty in North Adams
Income Below Poverty by Sex and Age in North Adams
With 13.1% poverty level for males and 17.1% for females among the residents of North Adams, 12 to 14 year old males and 15 year old females are the most vulnerable to poverty, with 69 males (27.5%) and 33 females (43.4%) in their respective age groups living below the poverty level.
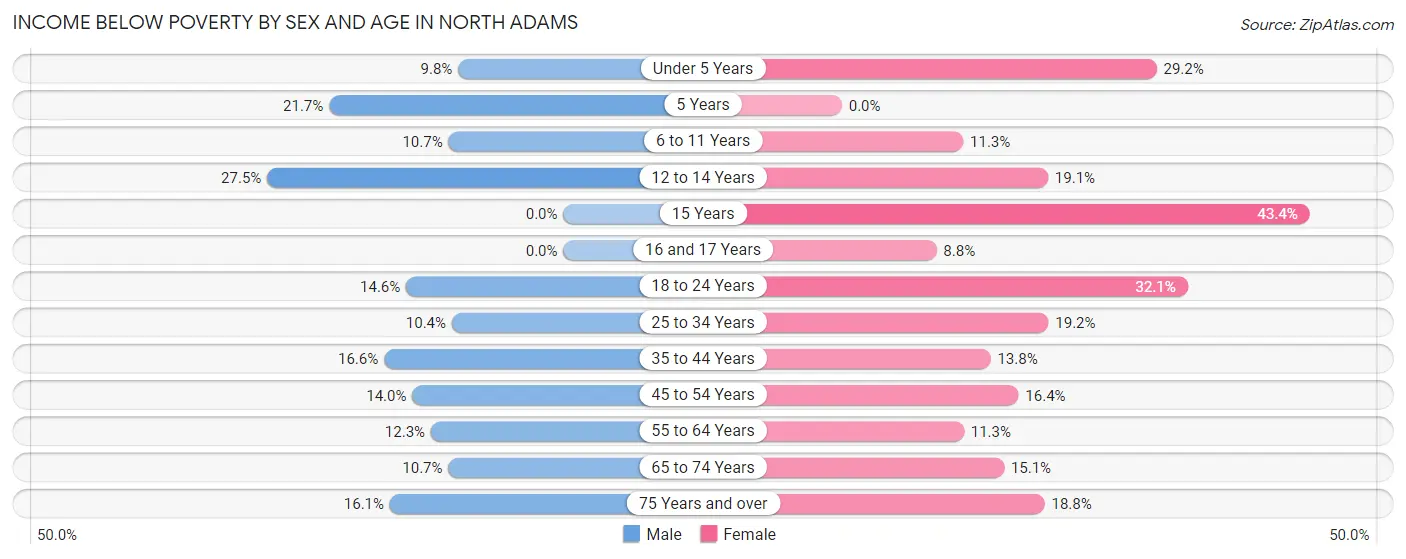
| Age Bracket | Male | Female |
| Under 5 Years | 20 (9.8%) | 78 (29.2%) |
| 5 Years | 5 (21.7%) | 0 (0.0%) |
| 6 to 11 Years | 42 (10.7%) | 34 (11.3%) |
| 12 to 14 Years | 69 (27.5%) | 22 (19.1%) |
| 15 Years | 0 (0.0%) | 33 (43.4%) |
| 16 and 17 Years | 0 (0.0%) | 18 (8.8%) |
| 18 to 24 Years | 82 (14.6%) | 138 (32.1%) |
| 25 to 34 Years | 82 (10.3%) | 111 (19.2%) |
| 35 to 44 Years | 96 (16.6%) | 106 (13.8%) |
| 45 to 54 Years | 119 (14.0%) | 147 (16.4%) |
| 55 to 64 Years | 123 (12.3%) | 97 (11.3%) |
| 65 to 74 Years | 95 (10.7%) | 104 (15.0%) |
| 75 Years and over | 62 (16.1%) | 124 (18.8%) |
| Total | 795 (13.1%) | 1,012 (17.1%) |
Income Above Poverty by Sex and Age in North Adams
According to the poverty statistics in North Adams, males aged 15 years and females aged 5 years are the age groups that are most secure financially, with 100.0% of males and 100.0% of females in these age groups living above the poverty line.
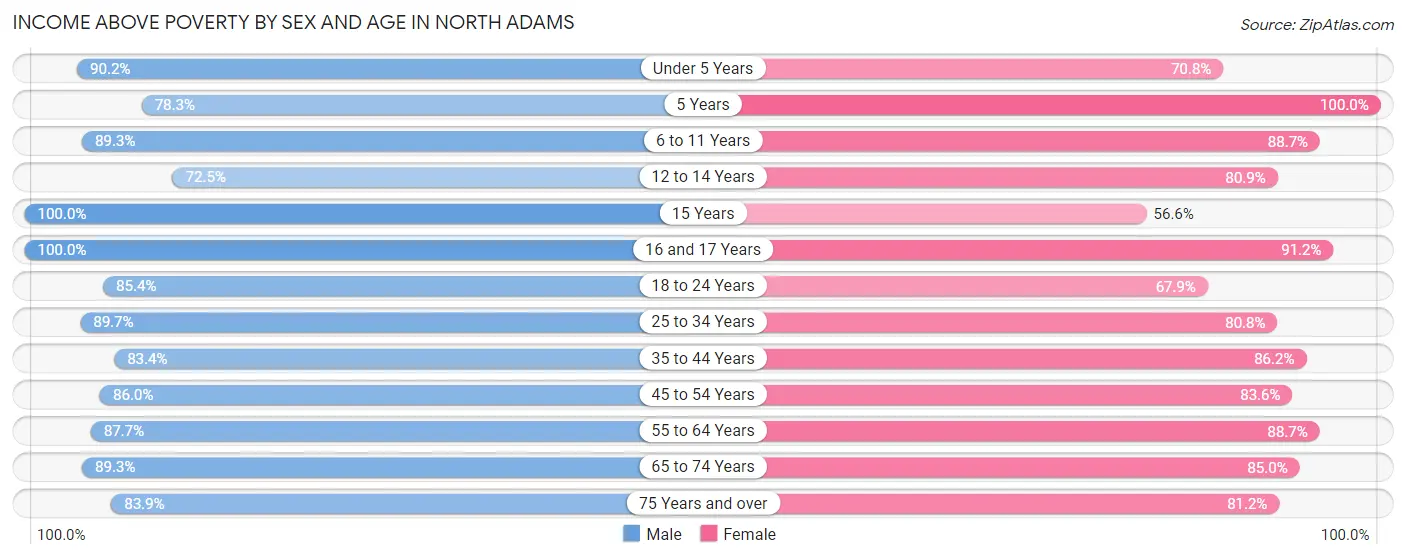
| Age Bracket | Male | Female |
| Under 5 Years | 185 (90.2%) | 189 (70.8%) |
| 5 Years | 18 (78.3%) | 65 (100.0%) |
| 6 to 11 Years | 352 (89.3%) | 268 (88.7%) |
| 12 to 14 Years | 182 (72.5%) | 93 (80.9%) |
| 15 Years | 54 (100.0%) | 43 (56.6%) |
| 16 and 17 Years | 81 (100.0%) | 187 (91.2%) |
| 18 to 24 Years | 480 (85.4%) | 292 (67.9%) |
| 25 to 34 Years | 710 (89.6%) | 468 (80.8%) |
| 35 to 44 Years | 481 (83.4%) | 662 (86.2%) |
| 45 to 54 Years | 730 (86.0%) | 750 (83.6%) |
| 55 to 64 Years | 878 (87.7%) | 760 (88.7%) |
| 65 to 74 Years | 795 (89.3%) | 587 (85.0%) |
| 75 Years and over | 323 (83.9%) | 535 (81.2%) |
| Total | 5,269 (86.9%) | 4,899 (82.9%) |
Income Below Poverty Among Married-Couple Families in North Adams
The poverty statistics for married-couple families in North Adams show that 5.5% or 105 of the total 1,899 families live below the poverty line. Families with 3 or 4 children have the highest poverty rate of 9.3%, comprising of 9 families. On the other hand, families with 5 or more children have the lowest poverty rate of 0.0%, which includes 0 families.
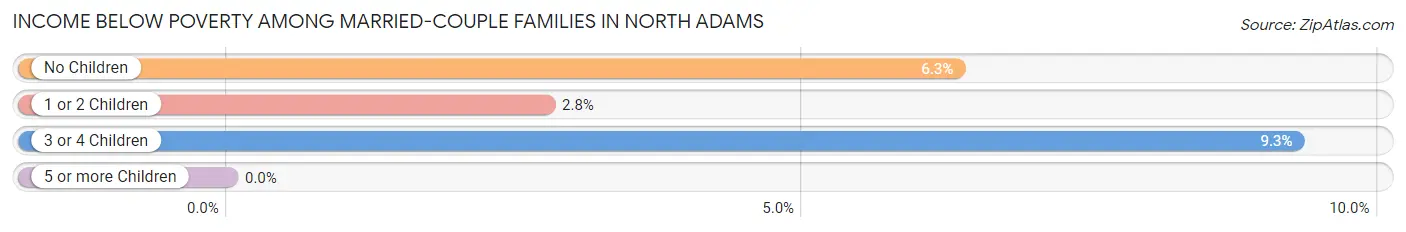
| Children | Above Poverty | Below Poverty |
| No Children | 1,243 (93.7%) | 84 (6.3%) |
| 1 or 2 Children | 422 (97.2%) | 12 (2.8%) |
| 3 or 4 Children | 88 (90.7%) | 9 (9.3%) |
| 5 or more Children | 41 (100.0%) | 0 (0.0%) |
| Total | 1,794 (94.5%) | 105 (5.5%) |
Income Below Poverty Among Single-Parent Households in North Adams
According to the poverty data in North Adams, 7.4% or 24 single-father households and 26.7% or 184 single-mother households are living below the poverty line. Among single-father households, those with no children have the highest poverty rate, with 12 households (7.5%) experiencing poverty. Likewise, among single-mother households, those with 3 or 4 children have the highest poverty rate, with 46 households (71.9%) falling below the poverty line.
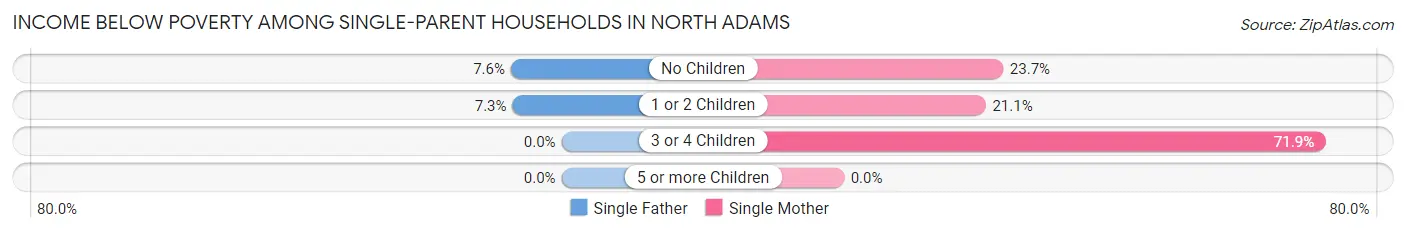
| Children | Single Father | Single Mother |
| No Children | 12 (7.5%) | 56 (23.7%) |
| 1 or 2 Children | 12 (7.3%) | 82 (21.1%) |
| 3 or 4 Children | 0 (0.0%) | 46 (71.9%) |
| 5 or more Children | 0 (0.0%) | 0 (0.0%) |
| Total | 24 (7.4%) | 184 (26.7%) |
Income Below Poverty Among Married-Couple vs Single-Parent Households in North Adams
The poverty data for North Adams shows that 105 of the married-couple family households (5.5%) and 208 of the single-parent households (20.6%) are living below the poverty level. Within the married-couple family households, those with 3 or 4 children have the highest poverty rate, with 9 households (9.3%) falling below the poverty line. Among the single-parent households, those with 3 or 4 children have the highest poverty rate, with 46 household (71.9%) living below poverty.
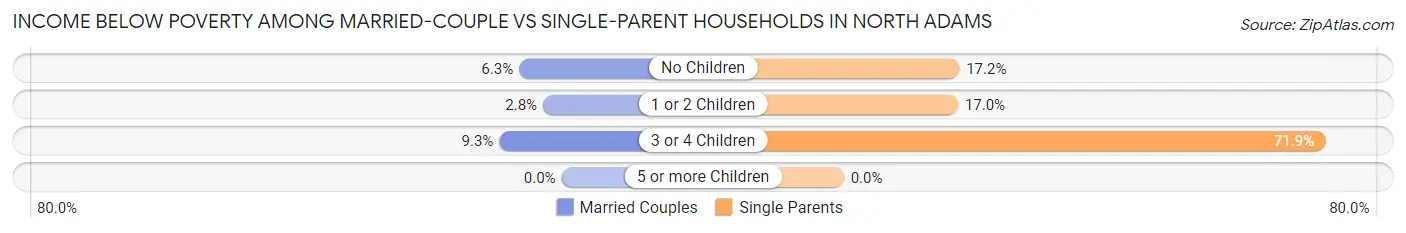
| Children | Married-Couple Families | Single-Parent Households |
| No Children | 84 (6.3%) | 68 (17.2%) |
| 1 or 2 Children | 12 (2.8%) | 94 (17.0%) |
| 3 or 4 Children | 9 (9.3%) | 46 (71.9%) |
| 5 or more Children | 0 (0.0%) | 0 (0.0%) |
| Total | 105 (5.5%) | 208 (20.6%) |
Race in North Adams
The most populous races in North Adams are White / Caucasian (11,426 | 88.3%), Hispanic or Latino (829 | 6.4%), and Two or more Races (496 | 3.8%).
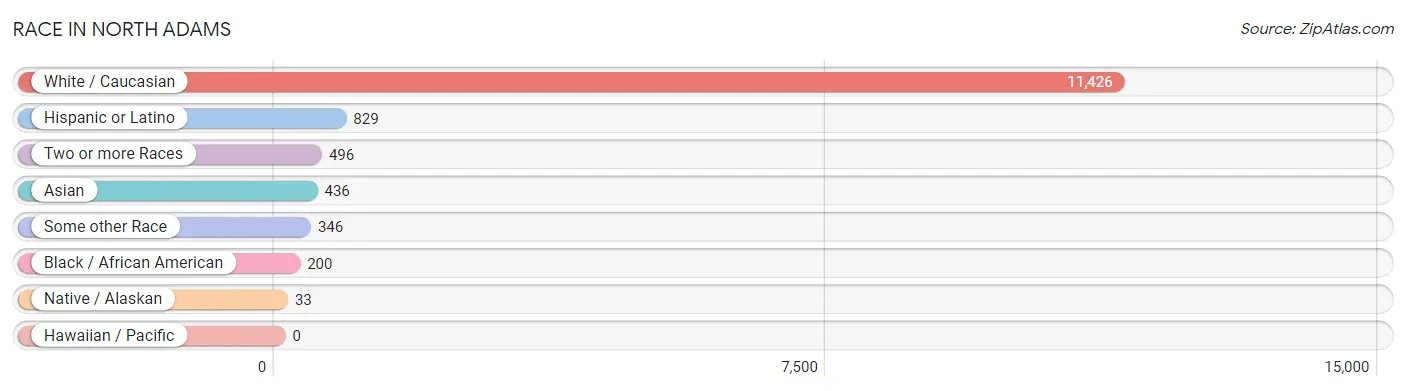
| Race | # Population | % Population |
| Asian | 436 | 3.4% |
| Black / African American | 200 | 1.5% |
| Hawaiian / Pacific | 0 | 0.0% |
| Hispanic or Latino | 829 | 6.4% |
| Native / Alaskan | 33 | 0.3% |
| White / Caucasian | 11,426 | 88.3% |
| Two or more Races | 496 | 3.8% |
| Some other Race | 346 | 2.7% |
| Total | 12,937 | 100.0% |
Ancestry in North Adams
The most populous ancestries reported in North Adams are Italian (1,901 | 14.7%), Irish (1,825 | 14.1%), French (1,780 | 13.8%), English (1,643 | 12.7%), and German (964 | 7.4%), together accounting for 62.7% of all North Adams residents.
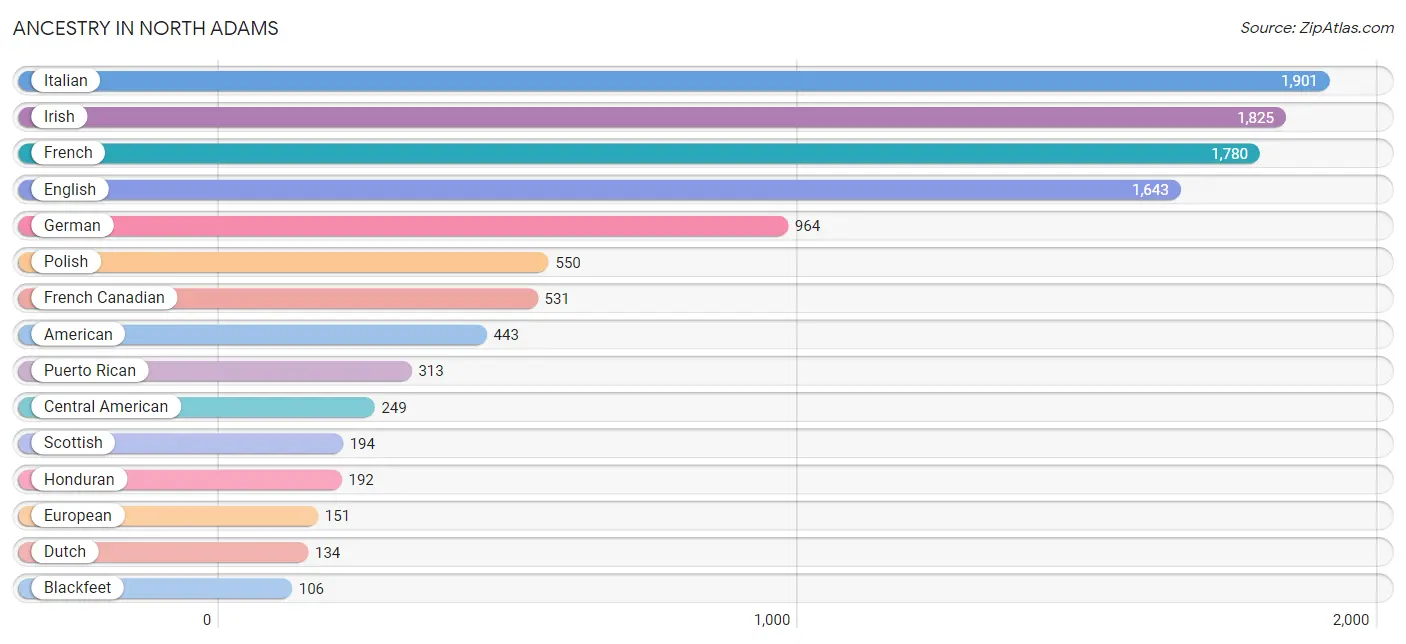
| Ancestry | # Population | % Population |
| African | 14 | 0.1% |
| Alsatian | 19 | 0.2% |
| American | 443 | 3.4% |
| Arab | 63 | 0.5% |
| Armenian | 10 | 0.1% |
| Austrian | 69 | 0.5% |
| Blackfeet | 106 | 0.8% |
| British | 37 | 0.3% |
| Burmese | 12 | 0.1% |
| Canadian | 75 | 0.6% |
| Celtic | 16 | 0.1% |
| Central American | 249 | 1.9% |
| Colombian | 4 | 0.0% |
| Croatian | 35 | 0.3% |
| Cuban | 67 | 0.5% |
| Czech | 10 | 0.1% |
| Danish | 35 | 0.3% |
| Dominican | 19 | 0.2% |
| Dutch | 134 | 1.0% |
| Eastern European | 29 | 0.2% |
| English | 1,643 | 12.7% |
| European | 151 | 1.2% |
| Finnish | 19 | 0.2% |
| French | 1,780 | 13.8% |
| French Canadian | 531 | 4.1% |
| German | 964 | 7.4% |
| Greek | 52 | 0.4% |
| Guatemalan | 57 | 0.4% |
| Guyanese | 4 | 0.0% |
| Haitian | 12 | 0.1% |
| Honduran | 192 | 1.5% |
| Hungarian | 16 | 0.1% |
| Indian (Asian) | 64 | 0.5% |
| Irish | 1,825 | 14.1% |
| Italian | 1,901 | 14.7% |
| Lebanese | 63 | 0.5% |
| Lithuanian | 39 | 0.3% |
| Mexican | 78 | 0.6% |
| Northern European | 27 | 0.2% |
| Norwegian | 49 | 0.4% |
| Peruvian | 6 | 0.1% |
| Polish | 550 | 4.3% |
| Portuguese | 32 | 0.3% |
| Puerto Rican | 313 | 2.4% |
| Romanian | 18 | 0.1% |
| Russian | 48 | 0.4% |
| Scandinavian | 61 | 0.5% |
| Scotch-Irish | 61 | 0.5% |
| Scottish | 194 | 1.5% |
| Slovak | 26 | 0.2% |
| South American | 10 | 0.1% |
| Spaniard | 8 | 0.1% |
| Sri Lankan | 11 | 0.1% |
| Subsaharan African | 14 | 0.1% |
| Swedish | 58 | 0.4% |
| Swiss | 52 | 0.4% |
| Thai | 48 | 0.4% |
| Turkish | 36 | 0.3% |
| Welsh | 68 | 0.5% |
| Yugoslavian | 5 | 0.0% | View All 60 Rows |
Immigrants in North Adams
The most numerous immigrant groups reported in North Adams came from Asia (474 | 3.7%), South Central Asia (352 | 2.7%), Nepal (304 | 2.4%), Latin America (171 | 1.3%), and Central America (141 | 1.1%), together accounting for 11.1% of all North Adams residents.
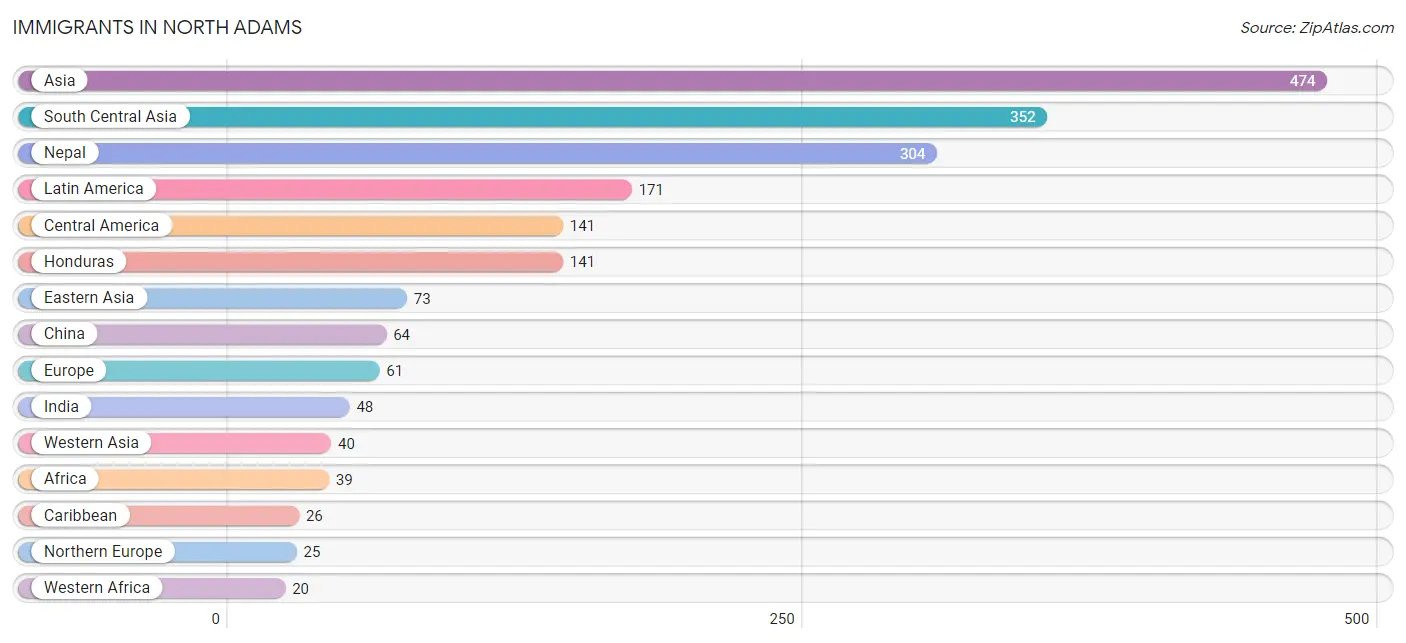
| Immigration Origin | # Population | % Population |
| Africa | 39 | 0.3% |
| Asia | 474 | 3.7% |
| Bosnia and Herzegovina | 5 | 0.0% |
| Canada | 11 | 0.1% |
| Caribbean | 26 | 0.2% |
| Central America | 141 | 1.1% |
| China | 64 | 0.5% |
| Colombia | 4 | 0.0% |
| Dominican Republic | 7 | 0.1% |
| Eastern Africa | 9 | 0.1% |
| Eastern Asia | 73 | 0.6% |
| Eastern Europe | 13 | 0.1% |
| England | 7 | 0.1% |
| Europe | 61 | 0.5% |
| France | 10 | 0.1% |
| Germany | 6 | 0.1% |
| Ghana | 10 | 0.1% |
| Greece | 7 | 0.1% |
| Haiti | 12 | 0.1% |
| Honduras | 141 | 1.1% |
| India | 48 | 0.4% |
| Jamaica | 7 | 0.1% |
| Korea | 9 | 0.1% |
| Latin America | 171 | 1.3% |
| Middle Africa | 10 | 0.1% |
| Nepal | 304 | 2.4% |
| Nigeria | 5 | 0.0% |
| Northern Europe | 25 | 0.2% |
| Russia | 8 | 0.1% |
| Sierra Leone | 5 | 0.0% |
| South America | 4 | 0.0% |
| South Central Asia | 352 | 2.7% |
| Southern Europe | 7 | 0.1% |
| Sweden | 15 | 0.1% |
| Turkey | 13 | 0.1% |
| Western Africa | 20 | 0.2% |
| Western Asia | 40 | 0.3% |
| Western Europe | 16 | 0.1% |
| Zaire | 10 | 0.1% | View All 39 Rows |
Sex and Age in North Adams
Sex and Age in North Adams
The most populous age groups in North Adams are 20 to 24 Years (547 | 8.4%) for men and 20 to 24 Years (664 | 10.4%) for women.
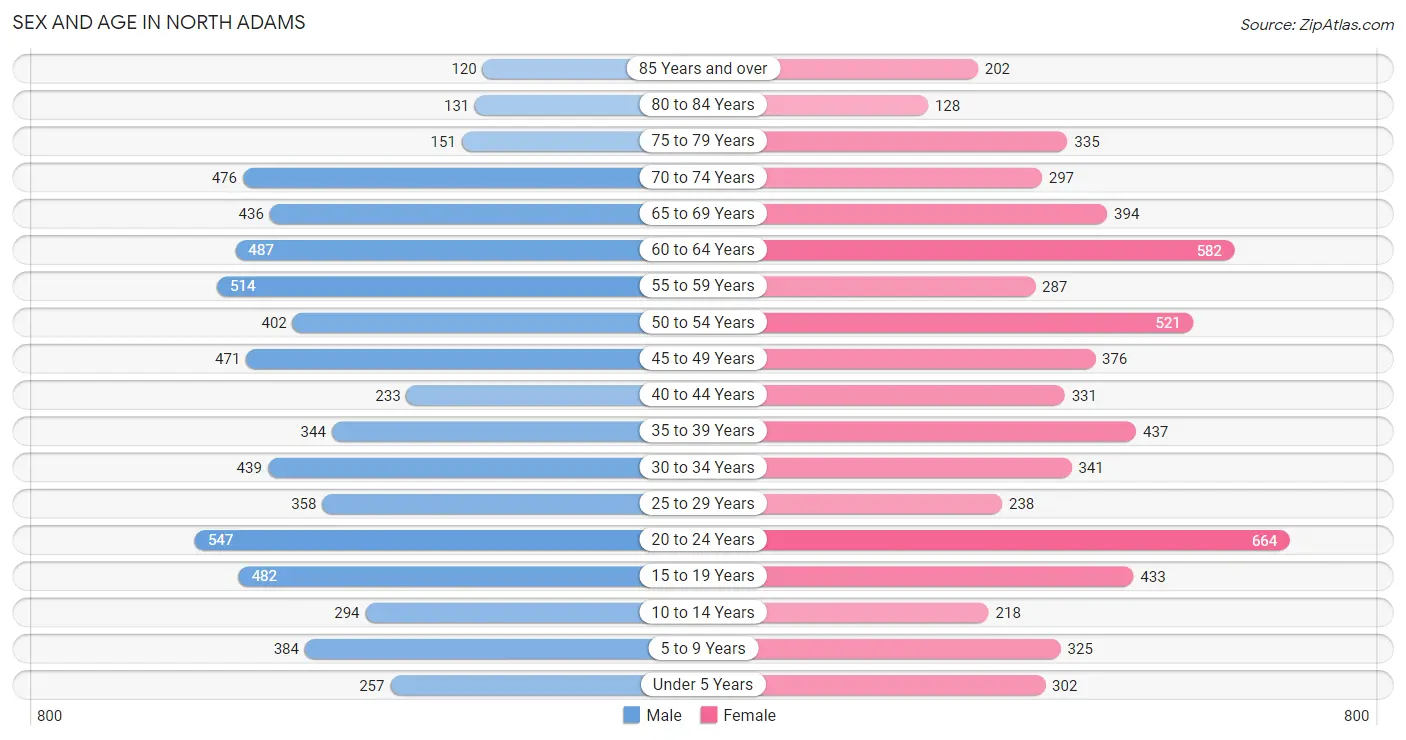
| Age Bracket | Male | Female |
| Under 5 Years | 257 (3.9%) | 302 (4.7%) |
| 5 to 9 Years | 384 (5.9%) | 325 (5.1%) |
| 10 to 14 Years | 294 (4.5%) | 218 (3.4%) |
| 15 to 19 Years | 482 (7.4%) | 433 (6.8%) |
| 20 to 24 Years | 547 (8.4%) | 664 (10.4%) |
| 25 to 29 Years | 358 (5.5%) | 238 (3.7%) |
| 30 to 34 Years | 439 (6.7%) | 341 (5.3%) |
| 35 to 39 Years | 344 (5.3%) | 437 (6.8%) |
| 40 to 44 Years | 233 (3.6%) | 331 (5.2%) |
| 45 to 49 Years | 471 (7.2%) | 376 (5.9%) |
| 50 to 54 Years | 402 (6.2%) | 521 (8.1%) |
| 55 to 59 Years | 514 (7.9%) | 287 (4.5%) |
| 60 to 64 Years | 487 (7.5%) | 582 (9.1%) |
| 65 to 69 Years | 436 (6.7%) | 394 (6.1%) |
| 70 to 74 Years | 476 (7.3%) | 297 (4.6%) |
| 75 to 79 Years | 151 (2.3%) | 335 (5.2%) |
| 80 to 84 Years | 131 (2.0%) | 128 (2.0%) |
| 85 Years and over | 120 (1.8%) | 202 (3.2%) |
| Total | 6,526 (100.0%) | 6,411 (100.0%) |
Families and Households in North Adams
Median Family Size in North Adams
The median family size in North Adams is 2.79 persons per family, with married-couple families (1,899 | 65.3%) accounting for the largest median family size of 2.83 persons per family. On the other hand, single male/father families (323 | 11.1%) represent the smallest median family size with 2.66 persons per family.
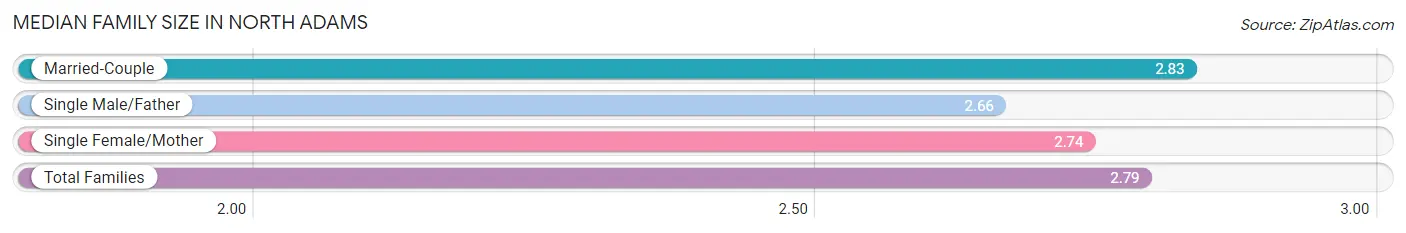
| Family Type | # Families | Family Size |
| Married-Couple | 1,899 (65.3%) | 2.83 |
| Single Male/Father | 323 (11.1%) | 2.66 |
| Single Female/Mother | 688 (23.6%) | 2.74 |
| Total Families | 2,910 (100.0%) | 2.79 |
Median Household Size in North Adams
The median household size in North Adams is 2.08 persons per household, with single male/father households (323 | 5.6%) accounting for the largest median household size of 3.22 persons per household. non-family households (2,906 | 50.0%) represent the smallest median household size with 1.22 persons per household.
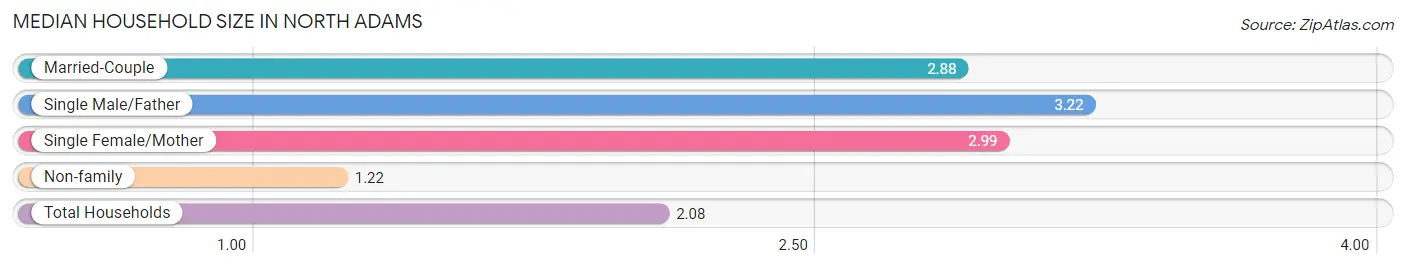
| Household Type | # Households | Household Size |
| Married-Couple | 1,899 (32.7%) | 2.88 |
| Single Male/Father | 323 (5.6%) | 3.22 |
| Single Female/Mother | 688 (11.8%) | 2.99 |
| Non-family | 2,906 (50.0%) | 1.22 |
| Total Households | 5,816 (100.0%) | 2.08 |
Household Size by Marriage Status in North Adams
Out of a total of 5,816 households in North Adams, 2,910 (50.0%) are family households, while 2,906 (50.0%) are nonfamily households. The most numerous type of family households are 2-person households, comprising 1,506, and the most common type of nonfamily households are 1-person households, comprising 2,371.
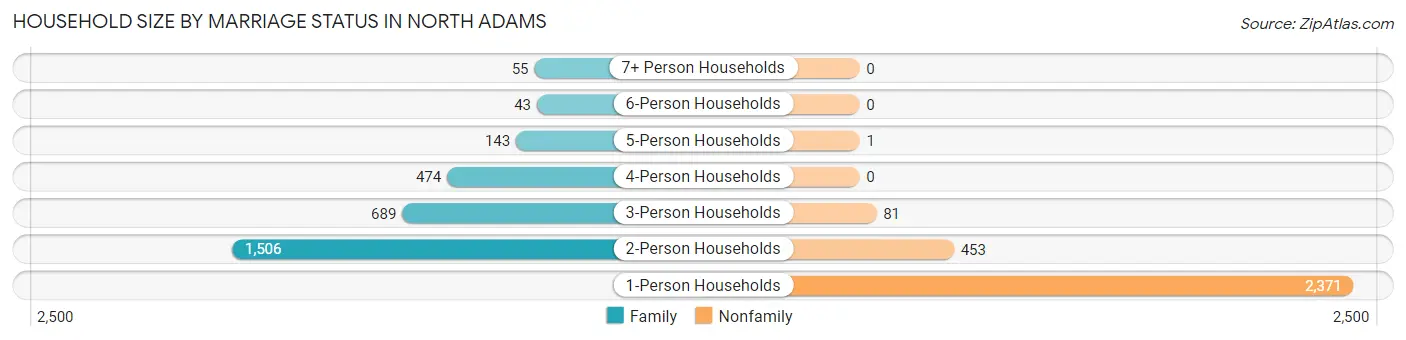
| Household Size | Family Households | Nonfamily Households |
| 1-Person Households | - | 2,371 (40.8%) |
| 2-Person Households | 1,506 (25.9%) | 453 (7.8%) |
| 3-Person Households | 689 (11.8%) | 81 (1.4%) |
| 4-Person Households | 474 (8.2%) | 0 (0.0%) |
| 5-Person Households | 143 (2.5%) | 1 (0.0%) |
| 6-Person Households | 43 (0.7%) | 0 (0.0%) |
| 7+ Person Households | 55 (0.9%) | 0 (0.0%) |
| Total | 2,910 (50.0%) | 2,906 (50.0%) |
Female Fertility in North Adams
Fertility by Age in North Adams
Average fertility rate in North Adams is 78.0 births per 1,000 women. Women in the age bracket of 20 to 34 years have the highest fertility rate with 145.0 births per 1,000 women. Women in the age bracket of 20 to 34 years acount for 81.8% of all women with births.
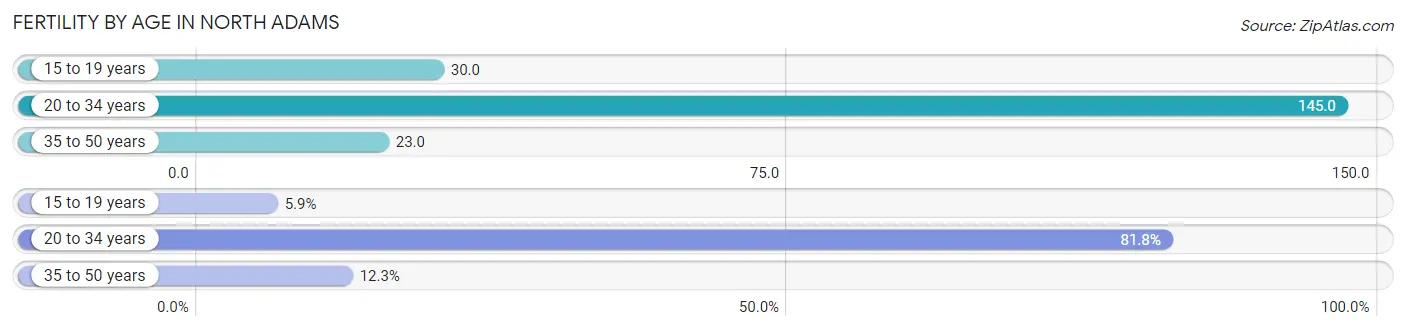
| Age Bracket | Women with Births | Births / 1,000 Women |
| 15 to 19 years | 13 (5.9%) | 30.0 |
| 20 to 34 years | 180 (81.8%) | 145.0 |
| 35 to 50 years | 27 (12.3%) | 23.0 |
| Total | 220 (100.0%) | 78.0 |
Fertility by Age by Marriage Status in North Adams
34.5% of women with births (220) in North Adams are married. The highest percentage of unmarried women with births falls into 15 to 19 years age bracket with 100.0% of them unmarried at the time of birth, while the lowest percentage of unmarried women with births belong to 35 to 50 years age bracket with 40.7% of them unmarried.
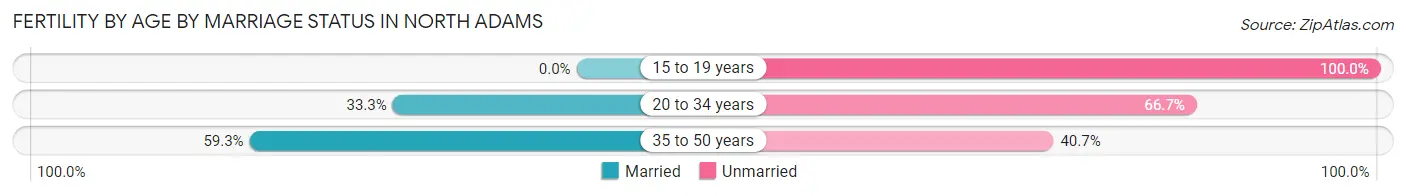
| Age Bracket | Married | Unmarried |
| 15 to 19 years | 0 (0.0%) | 13 (100.0%) |
| 20 to 34 years | 60 (33.3%) | 120 (66.7%) |
| 35 to 50 years | 16 (59.3%) | 11 (40.7%) |
| Total | 76 (34.5%) | 144 (65.4%) |
Fertility by Education in North Adams
Average fertility rate in North Adams is 78.0 births per 1,000 women. Women with the education attainment of college or associate's degree have the highest fertility rate of 129.0 births per 1,000 women, while women with the education attainment of less than high school have the lowest fertility at 31.0 births per 1,000 women. Women with the education attainment of college or associate's degree represent 64.1% of all women with births.
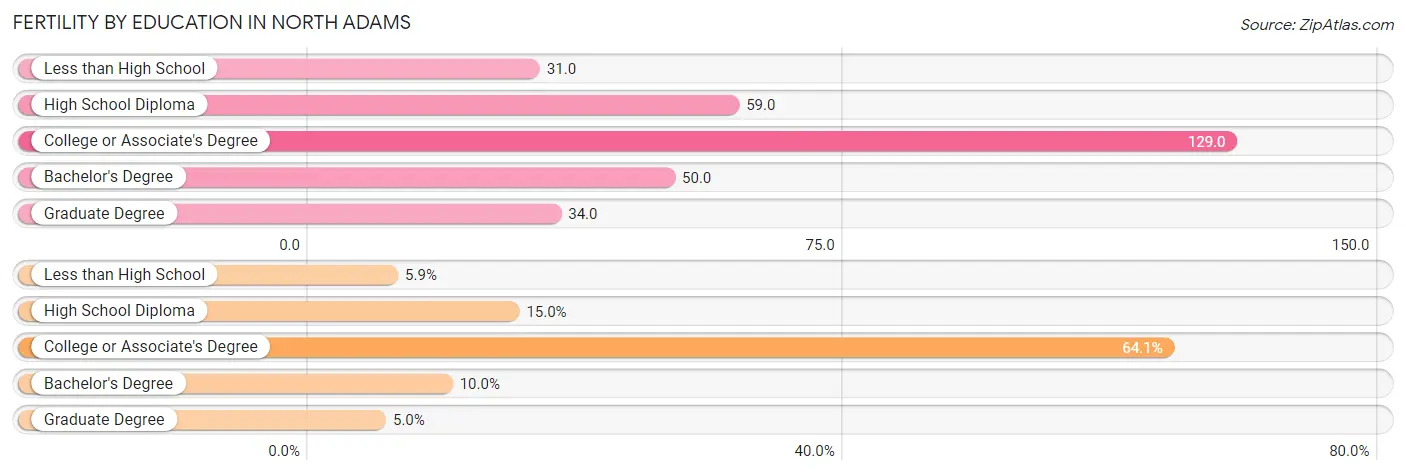
| Educational Attainment | Women with Births | Births / 1,000 Women |
| Less than High School | 13 (5.9%) | 31.0 |
| High School Diploma | 33 (15.0%) | 59.0 |
| College or Associate's Degree | 141 (64.1%) | 129.0 |
| Bachelor's Degree | 22 (10.0%) | 50.0 |
| Graduate Degree | 11 (5.0%) | 34.0 |
| Total | 220 (100.0%) | 78.0 |
Fertility by Education by Marriage Status in North Adams
65.4% of women with births in North Adams are unmarried. Women with the educational attainment of college or associate's degree are most likely to be married with 48.9% of them married at childbirth, while women with the educational attainment of less than high school are least likely to be married with 100.0% of them unmarried at childbirth.
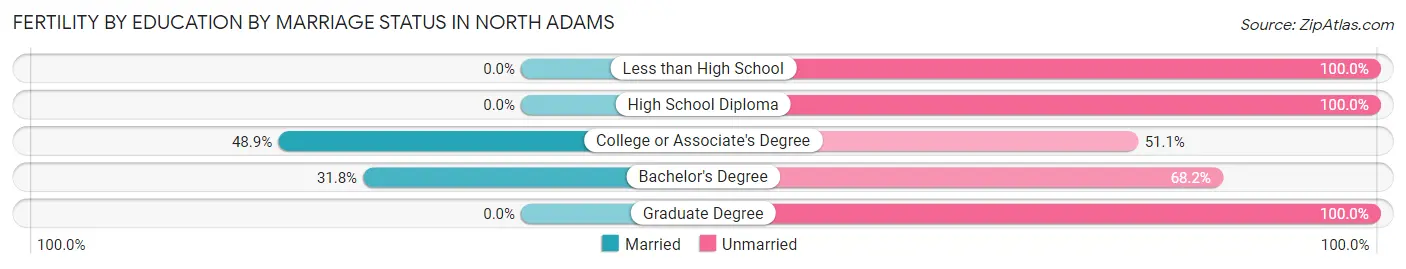
| Educational Attainment | Married | Unmarried |
| Less than High School | 0 (0.0%) | 13 (100.0%) |
| High School Diploma | 0 (0.0%) | 33 (100.0%) |
| College or Associate's Degree | 69 (48.9%) | 72 (51.1%) |
| Bachelor's Degree | 7 (31.8%) | 15 (68.2%) |
| Graduate Degree | 0 (0.0%) | 11 (100.0%) |
| Total | 76 (34.5%) | 144 (65.4%) |
Employment Characteristics in North Adams
Employment by Class of Employer in North Adams
Among the 5,855 employed individuals in North Adams, private company employees (3,159 | 53.9%), not-for-profit organizations (1,078 | 18.4%), and local government employees (591 | 10.1%) make up the most common classes of employment.
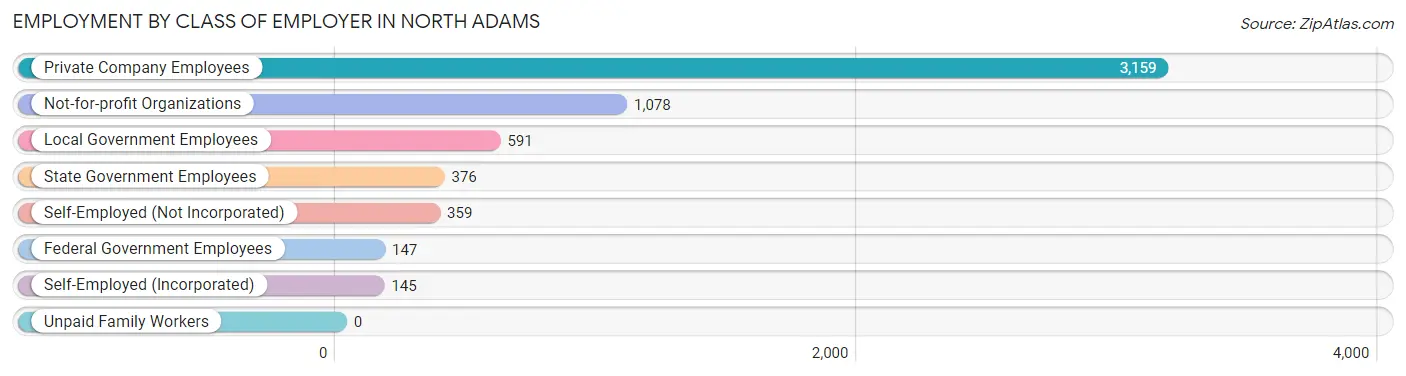
| Employer Class | # Employees | % Employees |
| Private Company Employees | 3,159 | 53.9% |
| Self-Employed (Incorporated) | 145 | 2.5% |
| Self-Employed (Not Incorporated) | 359 | 6.1% |
| Not-for-profit Organizations | 1,078 | 18.4% |
| Local Government Employees | 591 | 10.1% |
| State Government Employees | 376 | 6.4% |
| Federal Government Employees | 147 | 2.5% |
| Unpaid Family Workers | 0 | 0.0% |
| Total | 5,855 | 100.0% |
Employment Status by Age in North Adams
According to the labor force statistics for North Adams, out of the total population over 16 years of age (11,027), 58.3% or 6,429 individuals are in the labor force, with 5.0% or 321 of them unemployed. The age group with the highest labor force participation rate is 30 to 34 years, with 92.2% or 719 individuals in the labor force. Within the labor force, the 16 to 19 years age range has the highest percentage of unemployed individuals, with 14.2% or 46 of them being unemployed.
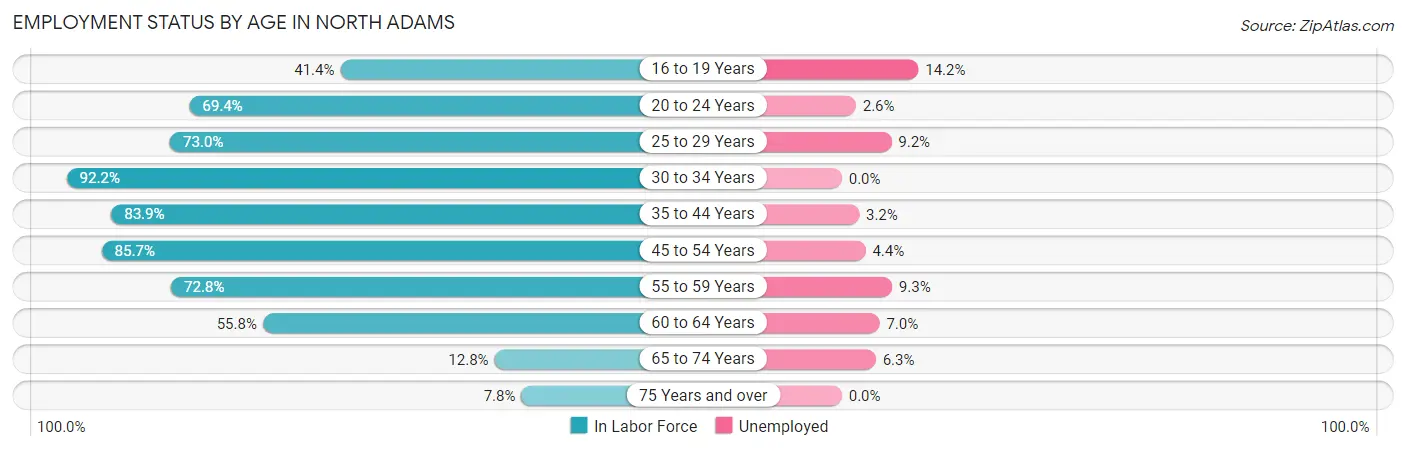
| Age Bracket | In Labor Force | Unemployed |
| 16 to 19 Years | 325 (41.4%) | 46 (14.2%) |
| 20 to 24 Years | 840 (69.4%) | 22 (2.6%) |
| 25 to 29 Years | 435 (73.0%) | 40 (9.2%) |
| 30 to 34 Years | 719 (92.2%) | 0 (0.0%) |
| 35 to 44 Years | 1,128 (83.9%) | 36 (3.2%) |
| 45 to 54 Years | 1,517 (85.7%) | 67 (4.4%) |
| 55 to 59 Years | 583 (72.8%) | 54 (9.3%) |
| 60 to 64 Years | 597 (55.8%) | 42 (7.0%) |
| 65 to 74 Years | 205 (12.8%) | 13 (6.3%) |
| 75 Years and over | 83 (7.8%) | 0 (0.0%) |
| Total | 6,429 (58.3%) | 321 (5.0%) |
Employment Status by Educational Attainment in North Adams
According to labor force statistics for North Adams, 78.3% of individuals (4,981) out of the total population between 25 and 64 years of age (6,361) are in the labor force, with 4.8% or 239 of them being unemployed. The group with the highest labor force participation rate are those with the educational attainment of bachelor's degree or higher, with 91.9% or 1,600 individuals in the labor force. Within the labor force, individuals with less than high school education have the highest percentage of unemployment, with 8.9% or 32 of them being unemployed.
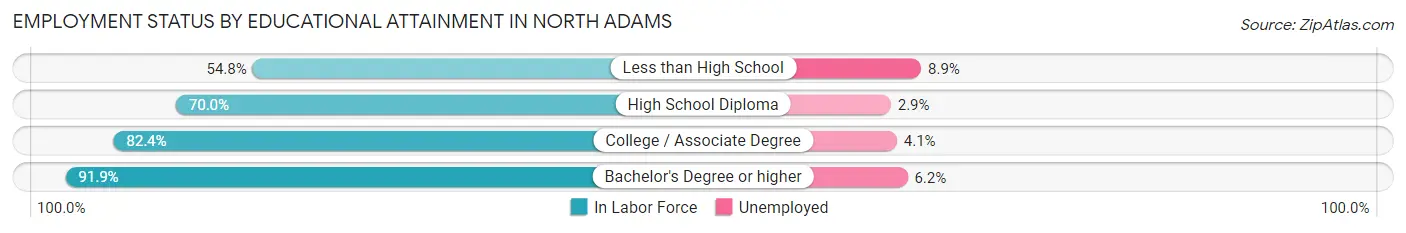
| Educational Attainment | In Labor Force | Unemployed |
| Less than High School | 358 (54.8%) | 58 (8.9%) |
| High School Diploma | 1,399 (70.0%) | 58 (2.9%) |
| College / Associate Degree | 1,622 (82.4%) | 81 (4.1%) |
| Bachelor's Degree or higher | 1,600 (91.9%) | 108 (6.2%) |
| Total | 4,981 (78.3%) | 305 (4.8%) |
Employment Occupations by Sex in North Adams
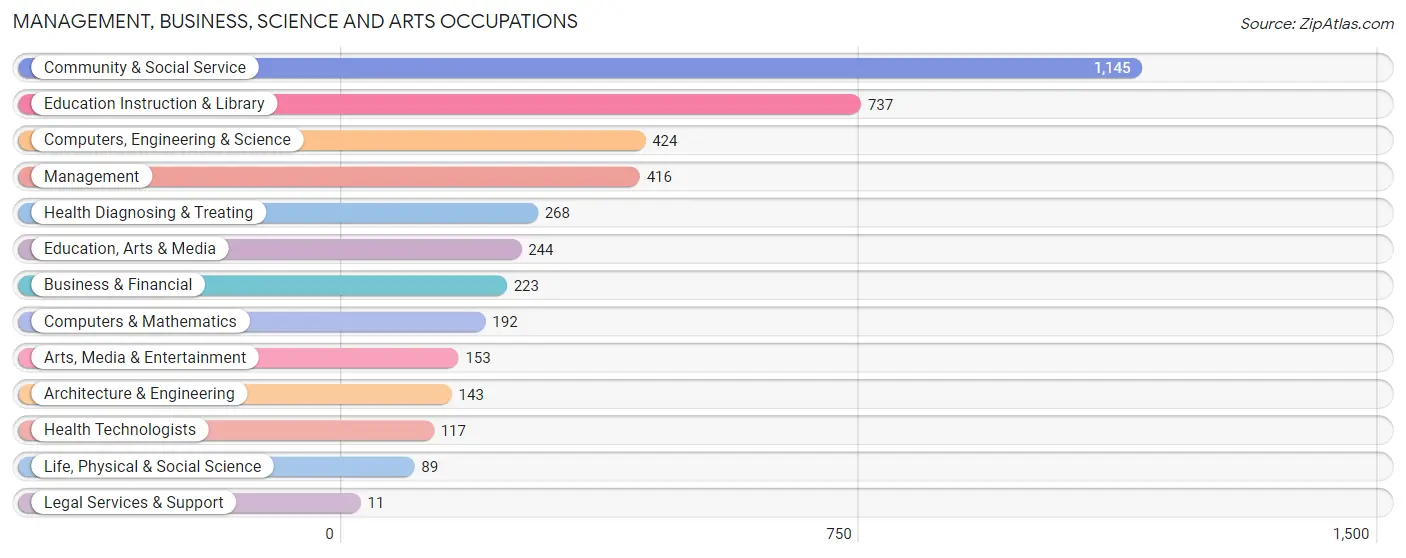
Management, Business, Science and Arts Occupations
The most common Management, Business, Science and Arts occupations in North Adams are Community & Social Service (1,145 | 18.7%), Education Instruction & Library (737 | 12.1%), Computers, Engineering & Science (424 | 6.9%), Management (416 | 6.8%), and Health Diagnosing & Treating (268 | 4.4%).
Management, Business, Science and Arts Occupations by Sex
Within the Management, Business, Science and Arts occupations in North Adams, the most male-oriented occupations are Legal Services & Support (100.0%), Computers & Mathematics (91.1%), and Computers, Engineering & Science (86.8%), while the most female-oriented occupations are Health Technologists (100.0%), Health Diagnosing & Treating (89.5%), and Arts, Media & Entertainment (69.9%).
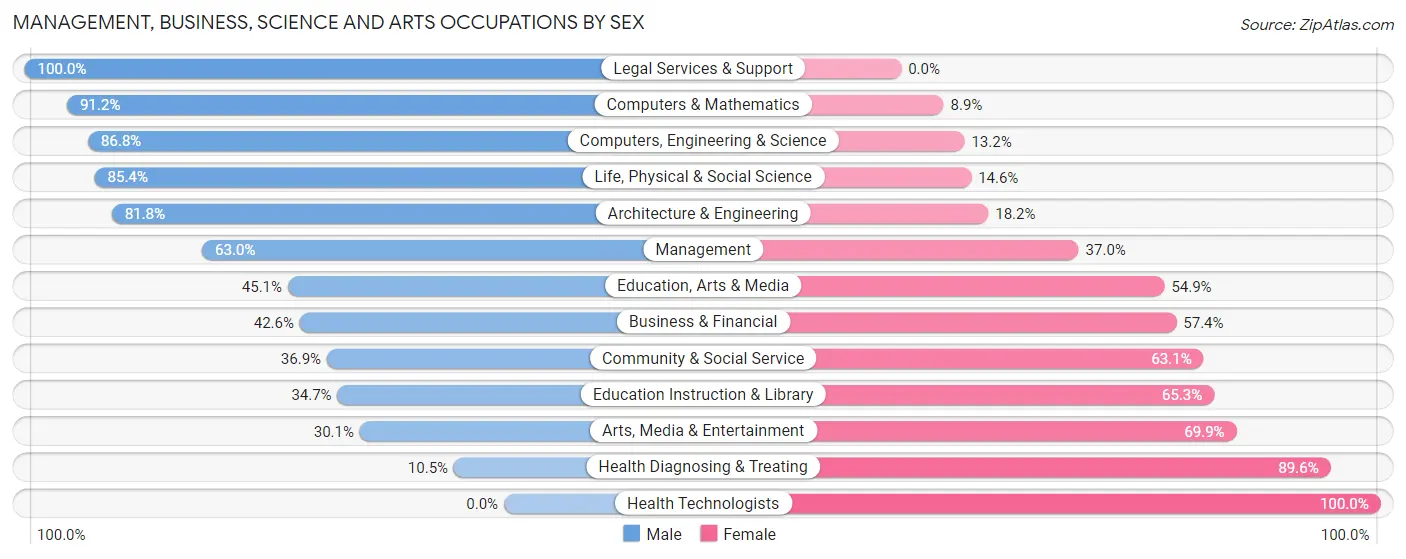
| Occupation | Male | Female |
| Management | 262 (63.0%) | 154 (37.0%) |
| Business & Financial | 95 (42.6%) | 128 (57.4%) |
| Computers, Engineering & Science | 368 (86.8%) | 56 (13.2%) |
| Computers & Mathematics | 175 (91.1%) | 17 (8.8%) |
| Architecture & Engineering | 117 (81.8%) | 26 (18.2%) |
| Life, Physical & Social Science | 76 (85.4%) | 13 (14.6%) |
| Community & Social Service | 423 (36.9%) | 722 (63.1%) |
| Education, Arts & Media | 110 (45.1%) | 134 (54.9%) |
| Legal Services & Support | 11 (100.0%) | 0 (0.0%) |
| Education Instruction & Library | 256 (34.7%) | 481 (65.3%) |
| Arts, Media & Entertainment | 46 (30.1%) | 107 (69.9%) |
| Health Diagnosing & Treating | 28 (10.4%) | 240 (89.5%) |
| Health Technologists | 0 (0.0%) | 117 (100.0%) |
| Total (Category) | 1,176 (47.5%) | 1,300 (52.5%) |
| Total (Overall) | 3,173 (51.9%) | 2,940 (48.1%) |
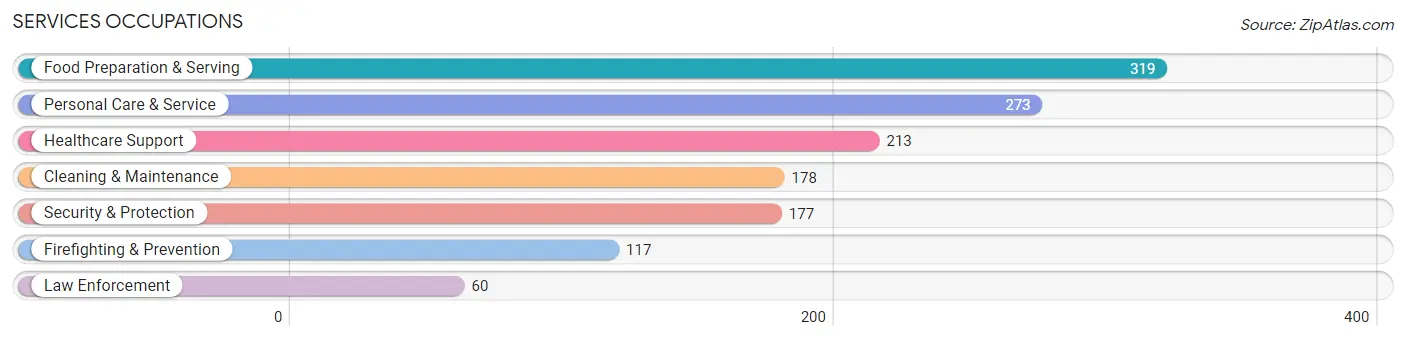
Services Occupations
The most common Services occupations in North Adams are Food Preparation & Serving (319 | 5.2%), Personal Care & Service (273 | 4.5%), Healthcare Support (213 | 3.5%), Cleaning & Maintenance (178 | 2.9%), and Security & Protection (177 | 2.9%).
Services Occupations by Sex
Within the Services occupations in North Adams, the most male-oriented occupations are Law Enforcement (100.0%), Security & Protection (93.8%), and Firefighting & Prevention (90.6%), while the most female-oriented occupations are Healthcare Support (89.7%), Personal Care & Service (87.5%), and Food Preparation & Serving (62.1%).
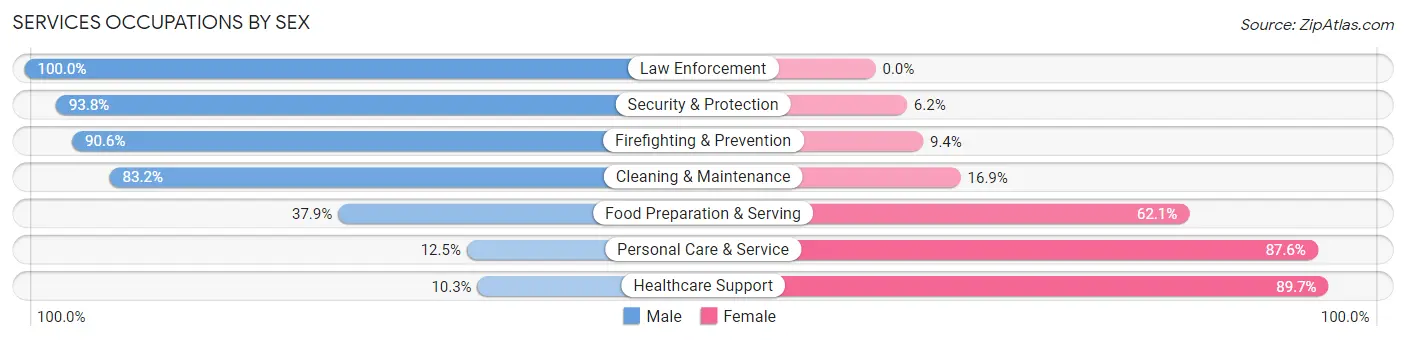
| Occupation | Male | Female |
| Healthcare Support | 22 (10.3%) | 191 (89.7%) |
| Security & Protection | 166 (93.8%) | 11 (6.2%) |
| Firefighting & Prevention | 106 (90.6%) | 11 (9.4%) |
| Law Enforcement | 60 (100.0%) | 0 (0.0%) |
| Food Preparation & Serving | 121 (37.9%) | 198 (62.1%) |
| Cleaning & Maintenance | 148 (83.2%) | 30 (16.9%) |
| Personal Care & Service | 34 (12.4%) | 239 (87.5%) |
| Total (Category) | 491 (42.3%) | 669 (57.7%) |
| Total (Overall) | 3,173 (51.9%) | 2,940 (48.1%) |
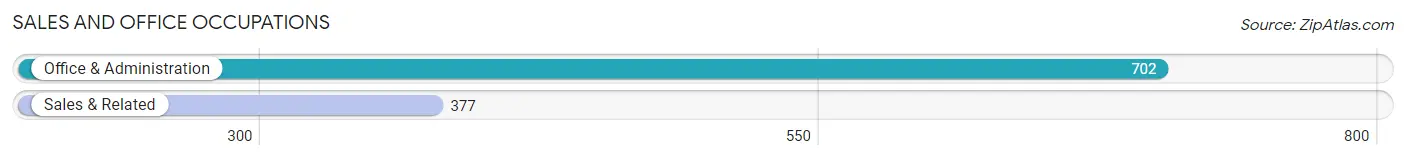
Sales and Office Occupations
The most common Sales and Office occupations in North Adams are Office & Administration (702 | 11.5%), and Sales & Related (377 | 6.2%).
Sales and Office Occupations by Sex
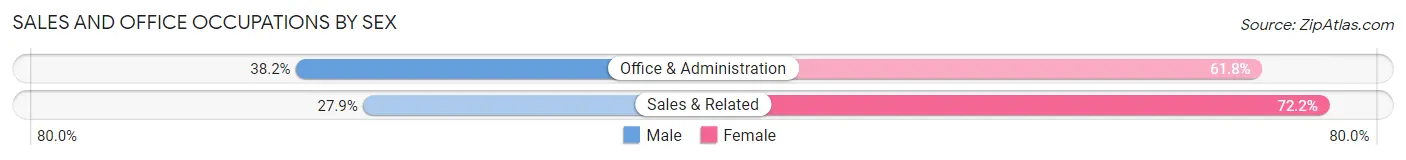
| Occupation | Male | Female |
| Sales & Related | 105 (27.9%) | 272 (72.2%) |
| Office & Administration | 268 (38.2%) | 434 (61.8%) |
| Total (Category) | 373 (34.6%) | 706 (65.4%) |
| Total (Overall) | 3,173 (51.9%) | 2,940 (48.1%) |
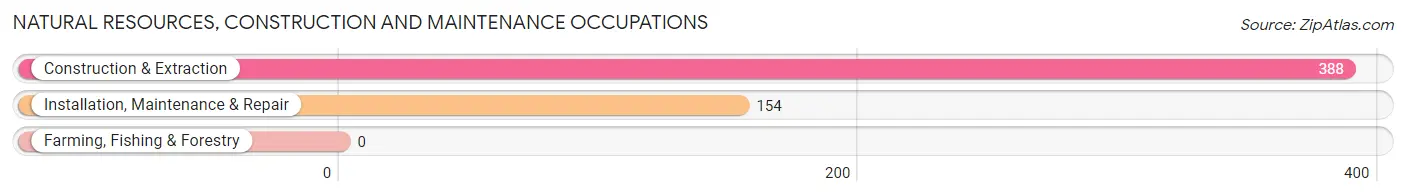
Natural Resources, Construction and Maintenance Occupations
The most common Natural Resources, Construction and Maintenance occupations in North Adams are Construction & Extraction (388 | 6.4%), and Installation, Maintenance & Repair (154 | 2.5%).
Natural Resources, Construction and Maintenance Occupations by Sex
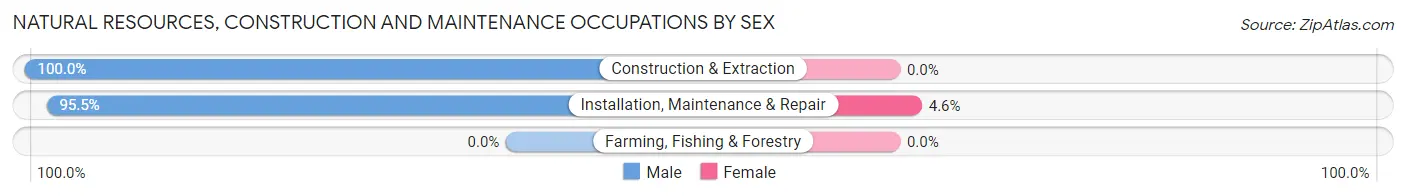
| Occupation | Male | Female |
| Farming, Fishing & Forestry | 0 (0.0%) | 0 (0.0%) |
| Construction & Extraction | 388 (100.0%) | 0 (0.0%) |
| Installation, Maintenance & Repair | 147 (95.5%) | 7 (4.5%) |
| Total (Category) | 535 (98.7%) | 7 (1.3%) |
| Total (Overall) | 3,173 (51.9%) | 2,940 (48.1%) |
Production, Transportation and Moving Occupations
The most common Production, Transportation and Moving occupations in North Adams are Production (360 | 5.9%), Transportation (286 | 4.7%), and Material Moving (210 | 3.4%).
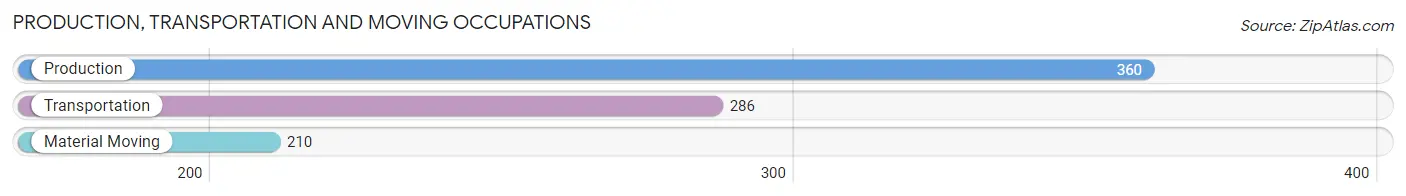
Production, Transportation and Moving Occupations by Sex
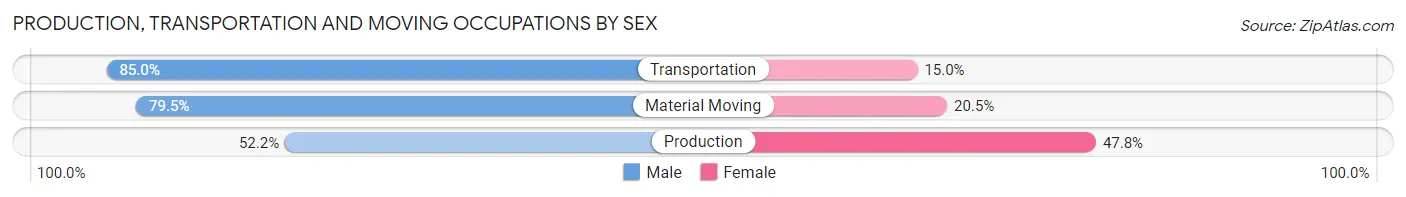
| Occupation | Male | Female |
| Production | 188 (52.2%) | 172 (47.8%) |
| Transportation | 243 (85.0%) | 43 (15.0%) |
| Material Moving | 167 (79.5%) | 43 (20.5%) |
| Total (Category) | 598 (69.9%) | 258 (30.1%) |
| Total (Overall) | 3,173 (51.9%) | 2,940 (48.1%) |
Employment Industries by Sex in North Adams
Employment Industries in North Adams
The major employment industries in North Adams include Educational Services (1,273 | 20.8%), Health Care & Social Assistance (793 | 13.0%), Retail Trade (707 | 11.6%), Manufacturing (636 | 10.4%), and Public Administration (423 | 6.9%).
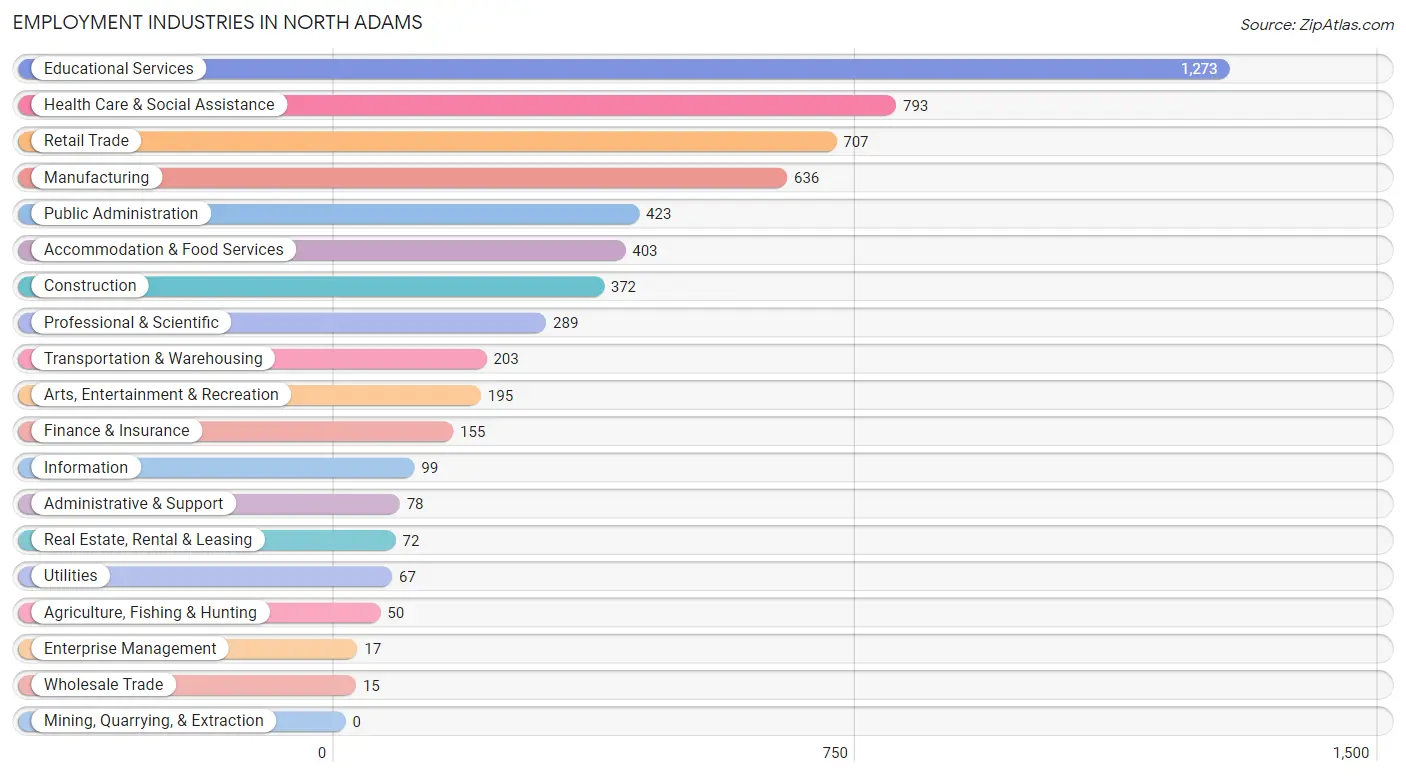
Employment Industries by Sex in North Adams
The North Adams industries that see more men than women are Wholesale Trade (100.0%), Utilities (100.0%), and Enterprise Management (100.0%), whereas the industries that tend to have a higher number of women are Agriculture, Fishing & Hunting (100.0%), Health Care & Social Assistance (80.7%), and Information (60.6%).
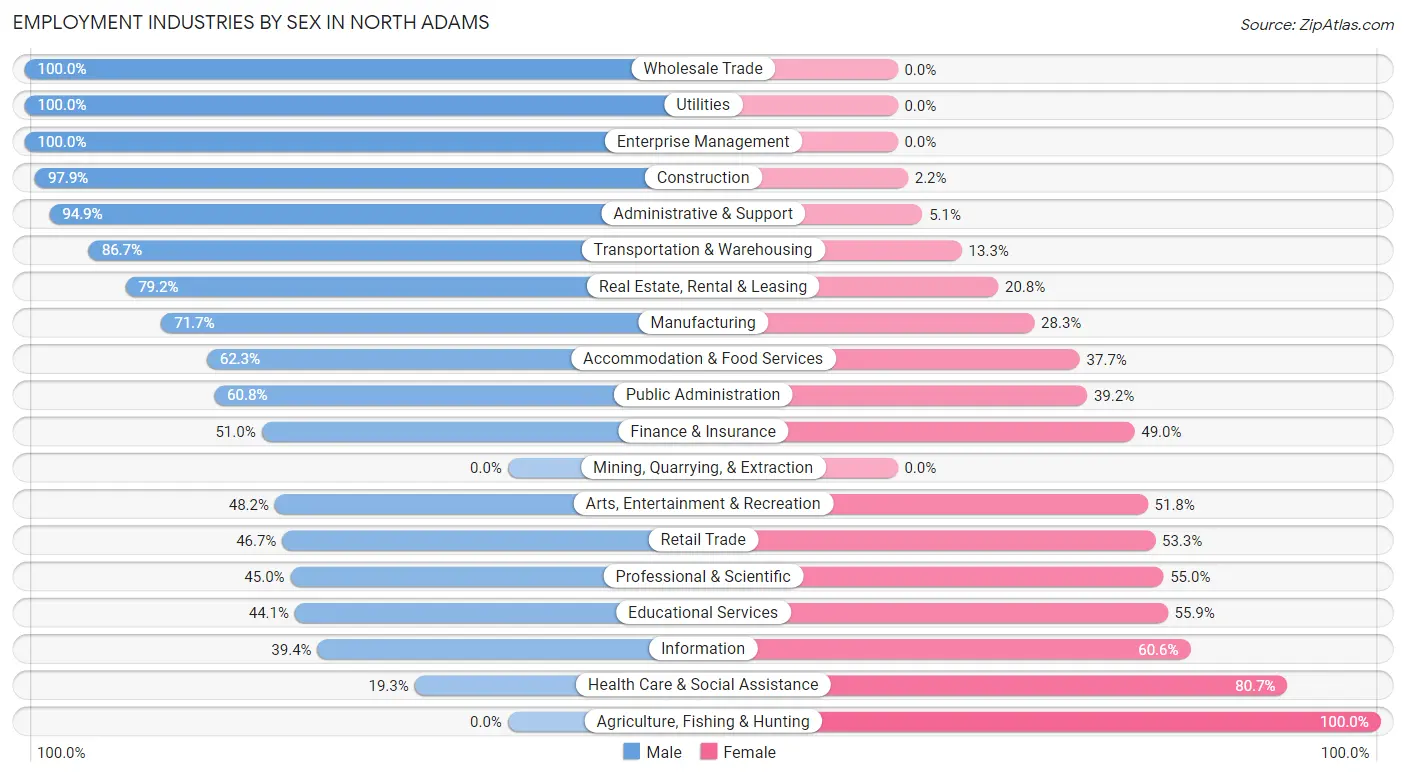
| Industry | Male | Female |
| Agriculture, Fishing & Hunting | 0 (0.0%) | 50 (100.0%) |
| Mining, Quarrying, & Extraction | 0 (0.0%) | 0 (0.0%) |
| Construction | 364 (97.9%) | 8 (2.1%) |
| Manufacturing | 456 (71.7%) | 180 (28.3%) |
| Wholesale Trade | 15 (100.0%) | 0 (0.0%) |
| Retail Trade | 330 (46.7%) | 377 (53.3%) |
| Transportation & Warehousing | 176 (86.7%) | 27 (13.3%) |
| Utilities | 67 (100.0%) | 0 (0.0%) |
| Information | 39 (39.4%) | 60 (60.6%) |
| Finance & Insurance | 79 (51.0%) | 76 (49.0%) |
| Real Estate, Rental & Leasing | 57 (79.2%) | 15 (20.8%) |
| Professional & Scientific | 130 (45.0%) | 159 (55.0%) |
| Enterprise Management | 17 (100.0%) | 0 (0.0%) |
| Administrative & Support | 74 (94.9%) | 4 (5.1%) |
| Educational Services | 561 (44.1%) | 712 (55.9%) |
| Health Care & Social Assistance | 153 (19.3%) | 640 (80.7%) |
| Arts, Entertainment & Recreation | 94 (48.2%) | 101 (51.8%) |
| Accommodation & Food Services | 251 (62.3%) | 152 (37.7%) |
| Public Administration | 257 (60.8%) | 166 (39.2%) |
| Total | 3,173 (51.9%) | 2,940 (48.1%) |
Education in North Adams
School Enrollment in North Adams
The most common levels of schooling among the 3,004 students in North Adams are college / undergraduate (1,029 | 34.3%), high school (684 | 22.8%), and elementary school (670 | 22.3%).
| School Level | # Students | % Students |
| Nursery / Preschool | 77 | 2.6% |
| Kindergarten | 81 | 2.7% |
| Elementary School | 670 | 22.3% |
| Middle School | 397 | 13.2% |
| High School | 684 | 22.8% |
| College / Undergraduate | 1,029 | 34.3% |
| Graduate / Professional | 66 | 2.2% |
| Total | 3,004 | 100.0% |
School Enrollment by Age by Funding Source in North Adams
Out of a total of 3,004 students who are enrolled in schools in North Adams, 604 (20.1%) attend a private institution, while the remaining 2,400 (79.9%) are enrolled in public schools. The age group of 35 years and over has the highest likelihood of being enrolled in private schools, with 56 (39.7% in the age bracket) enrolled. Conversely, the age group of 3 to 4 year olds has the lowest likelihood of being enrolled in a private school, with 49 (100.0% in the age bracket) attending a public institution.
| Age Bracket | Public School | Private School |
| 3 to 4 Year Olds | 49 (100.0%) | 0 (0.0%) |
| 5 to 9 Year Old | 619 (87.9%) | 85 (12.1%) |
| 10 to 14 Year Olds | 377 (74.2%) | 131 (25.8%) |
| 15 to 17 Year Olds | 401 (91.3%) | 38 (8.7%) |
| 18 to 19 Year Olds | 333 (76.9%) | 100 (23.1%) |
| 20 to 24 Year Olds | 414 (69.1%) | 185 (30.9%) |
| 25 to 34 Year Olds | 122 (93.1%) | 9 (6.9%) |
| 35 Years and over | 85 (60.3%) | 56 (39.7%) |
| Total | 2,400 (79.9%) | 604 (20.1%) |
Educational Attainment by Field of Study in North Adams
Business (356 | 13.8%), education (292 | 11.4%), social sciences (283 | 11.0%), liberal arts & history (263 | 10.2%), and bio, nature & agricultural (212 | 8.2%) are the most common fields of study among 2,572 individuals in North Adams who have obtained a bachelor's degree or higher.
| Field of Study | # Graduates | % Graduates |
| Computers & Mathematics | 81 | 3.2% |
| Bio, Nature & Agricultural | 212 | 8.2% |
| Physical & Health Sciences | 85 | 3.3% |
| Psychology | 160 | 6.2% |
| Social Sciences | 283 | 11.0% |
| Engineering | 41 | 1.6% |
| Multidisciplinary Studies | 15 | 0.6% |
| Science & Technology | 209 | 8.1% |
| Business | 356 | 13.8% |
| Education | 292 | 11.4% |
| Literature & Languages | 141 | 5.5% |
| Liberal Arts & History | 263 | 10.2% |
| Visual & Performing Arts | 205 | 8.0% |
| Communications | 102 | 4.0% |
| Arts & Humanities | 127 | 4.9% |
| Total | 2,572 | 100.0% |
Transportation & Commute in North Adams
Vehicle Availability by Sex in North Adams
The most prevalent vehicle ownership categories in North Adams are males with 2 vehicles (1,440, accounting for 48.9%) and females with 2 vehicles (959, making up 55.6%).
| Vehicles Available | Male | Female |
| No Vehicle | 178 (6.0%) | 188 (7.3%) |
| 1 Vehicle | 787 (26.7%) | 759 (29.3%) |
| 2 Vehicles | 1,440 (48.9%) | 959 (37.1%) |
| 3 Vehicles | 437 (14.8%) | 535 (20.7%) |
| 4 Vehicles | 84 (2.9%) | 114 (4.4%) |
| 5 or more Vehicles | 20 (0.7%) | 33 (1.3%) |
| Total | 2,946 (100.0%) | 2,588 (100.0%) |
Commute Time in North Adams
The most frequently occuring commute durations in North Adams are 5 to 9 minutes (1,506 commuters, 27.7%), 10 to 14 minutes (1,118 commuters, 20.6%), and less than 5 minutes (524 commuters, 9.6%).
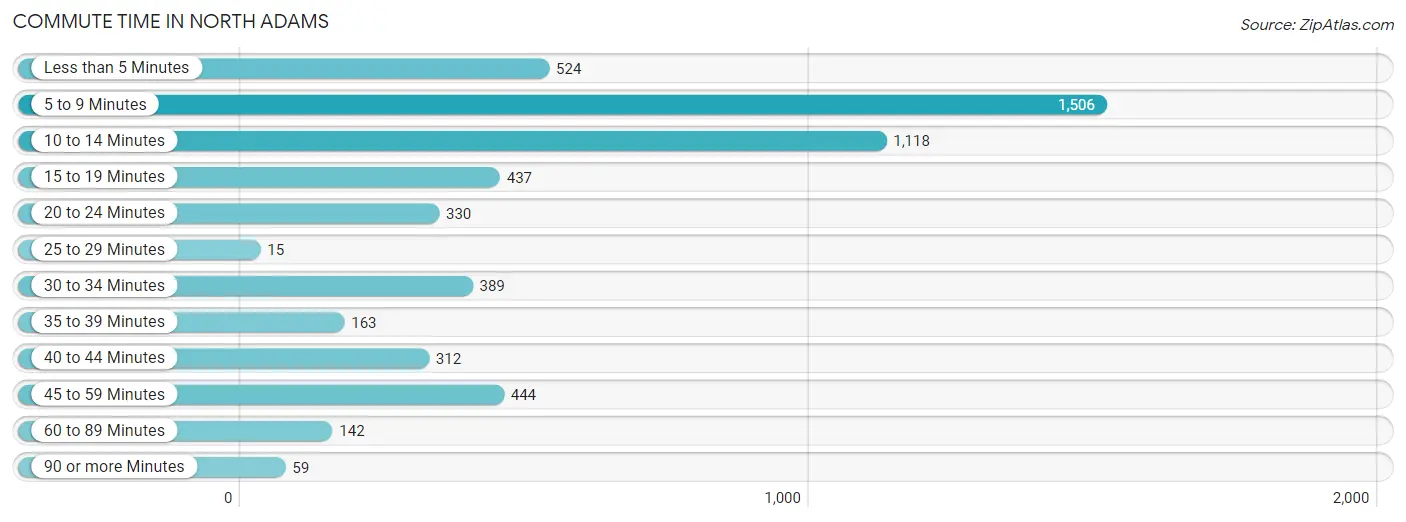
| Commute Time | # Commuters | % Commuters |
| Less than 5 Minutes | 524 | 9.6% |
| 5 to 9 Minutes | 1,506 | 27.7% |
| 10 to 14 Minutes | 1,118 | 20.6% |
| 15 to 19 Minutes | 437 | 8.0% |
| 20 to 24 Minutes | 330 | 6.1% |
| 25 to 29 Minutes | 15 | 0.3% |
| 30 to 34 Minutes | 389 | 7.1% |
| 35 to 39 Minutes | 163 | 3.0% |
| 40 to 44 Minutes | 312 | 5.7% |
| 45 to 59 Minutes | 444 | 8.2% |
| 60 to 89 Minutes | 142 | 2.6% |
| 90 or more Minutes | 59 | 1.1% |
Commute Time by Sex in North Adams
The most common commute times in North Adams are 10 to 14 minutes (719 commuters, 24.4%) for males and 5 to 9 minutes (839 commuters, 33.6%) for females.
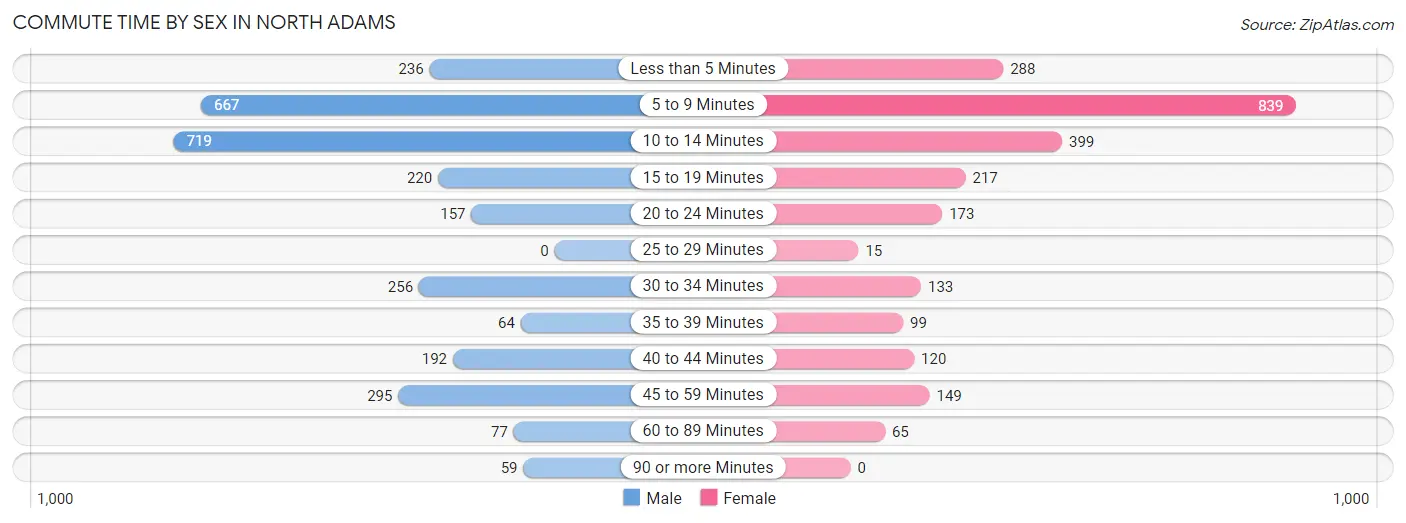
| Commute Time | Male | Female |
| Less than 5 Minutes | 236 (8.0%) | 288 (11.5%) |
| 5 to 9 Minutes | 667 (22.7%) | 839 (33.6%) |
| 10 to 14 Minutes | 719 (24.4%) | 399 (16.0%) |
| 15 to 19 Minutes | 220 (7.5%) | 217 (8.7%) |
| 20 to 24 Minutes | 157 (5.3%) | 173 (6.9%) |
| 25 to 29 Minutes | 0 (0.0%) | 15 (0.6%) |
| 30 to 34 Minutes | 256 (8.7%) | 133 (5.3%) |
| 35 to 39 Minutes | 64 (2.2%) | 99 (4.0%) |
| 40 to 44 Minutes | 192 (6.5%) | 120 (4.8%) |
| 45 to 59 Minutes | 295 (10.0%) | 149 (6.0%) |
| 60 to 89 Minutes | 77 (2.6%) | 65 (2.6%) |
| 90 or more Minutes | 59 (2.0%) | 0 (0.0%) |
Time of Departure to Work by Sex in North Adams
The most frequent times of departure to work in North Adams are 7:00 AM to 7:29 AM (404, 13.7%) for males and 8:00 AM to 8:29 AM (435, 17.4%) for females.
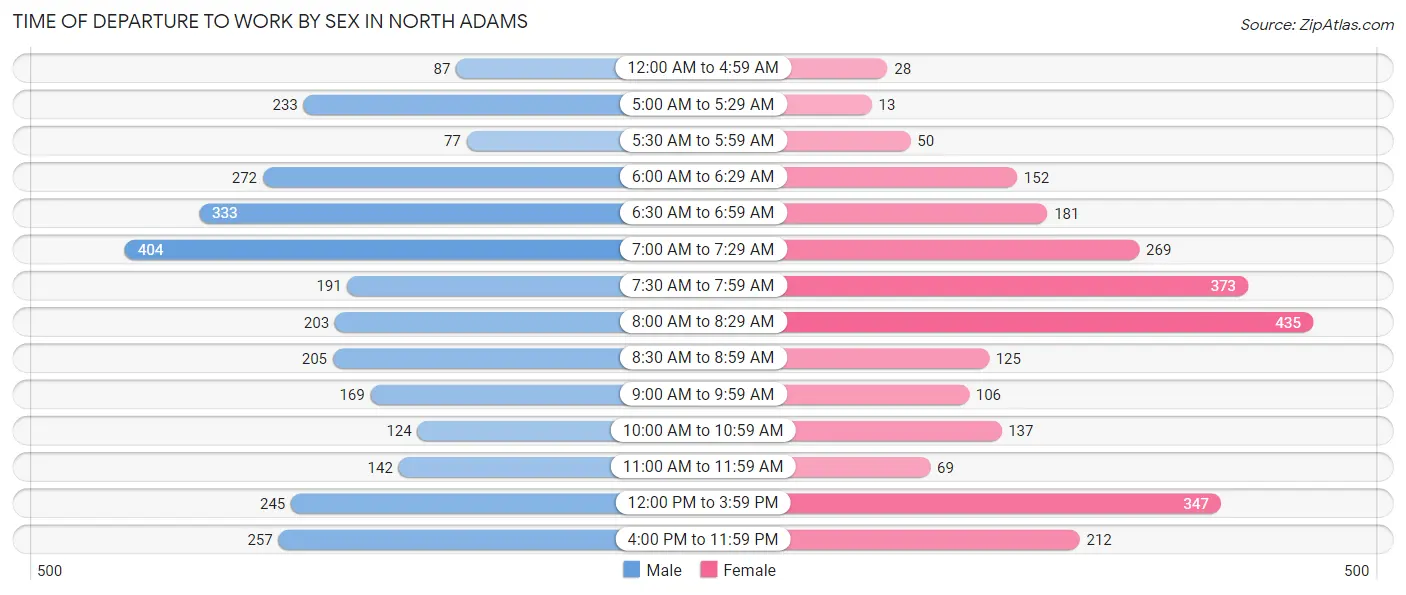
| Time of Departure | Male | Female |
| 12:00 AM to 4:59 AM | 87 (3.0%) | 28 (1.1%) |
| 5:00 AM to 5:29 AM | 233 (7.9%) | 13 (0.5%) |
| 5:30 AM to 5:59 AM | 77 (2.6%) | 50 (2.0%) |
| 6:00 AM to 6:29 AM | 272 (9.2%) | 152 (6.1%) |
| 6:30 AM to 6:59 AM | 333 (11.3%) | 181 (7.2%) |
| 7:00 AM to 7:29 AM | 404 (13.7%) | 269 (10.8%) |
| 7:30 AM to 7:59 AM | 191 (6.5%) | 373 (14.9%) |
| 8:00 AM to 8:29 AM | 203 (6.9%) | 435 (17.4%) |
| 8:30 AM to 8:59 AM | 205 (7.0%) | 125 (5.0%) |
| 9:00 AM to 9:59 AM | 169 (5.7%) | 106 (4.3%) |
| 10:00 AM to 10:59 AM | 124 (4.2%) | 137 (5.5%) |
| 11:00 AM to 11:59 AM | 142 (4.8%) | 69 (2.8%) |
| 12:00 PM to 3:59 PM | 245 (8.3%) | 347 (13.9%) |
| 4:00 PM to 11:59 PM | 257 (8.7%) | 212 (8.5%) |
| Total | 2,942 (100.0%) | 2,497 (100.0%) |
Housing Occupancy in North Adams
Occupancy by Ownership in North Adams
Of the total 5,816 dwellings in North Adams, owner-occupied units account for 3,250 (55.9%), while renter-occupied units make up 2,566 (44.1%).
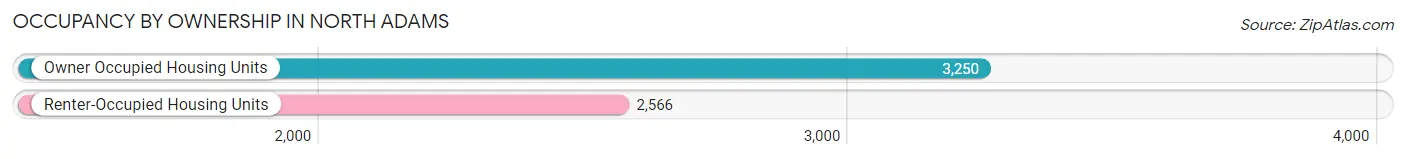
| Occupancy | # Housing Units | % Housing Units |
| Owner Occupied Housing Units | 3,250 | 55.9% |
| Renter-Occupied Housing Units | 2,566 | 44.1% |
| Total Occupied Housing Units | 5,816 | 100.0% |
Occupancy by Household Size in North Adams
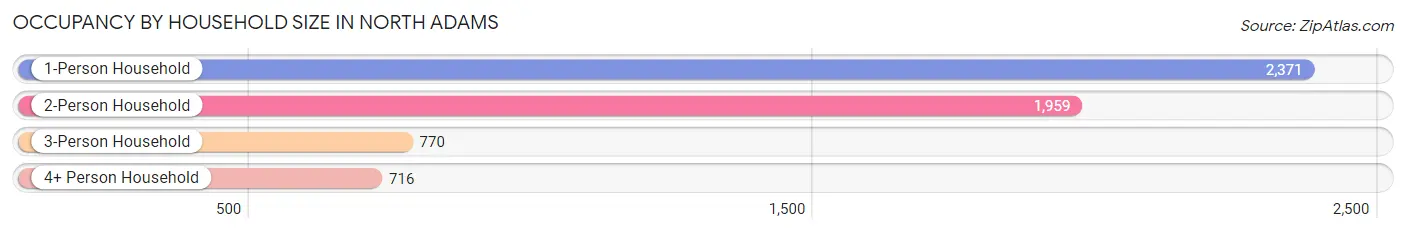
| Household Size | # Housing Units | % Housing Units |
| 1-Person Household | 2,371 | 40.8% |
| 2-Person Household | 1,959 | 33.7% |
| 3-Person Household | 770 | 13.2% |
| 4+ Person Household | 716 | 12.3% |
| Total Housing Units | 5,816 | 100.0% |
Occupancy by Ownership by Household Size in North Adams
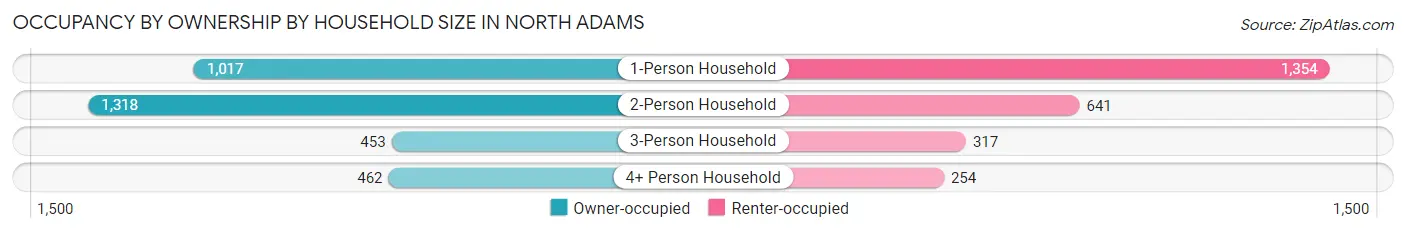
| Household Size | Owner-occupied | Renter-occupied |
| 1-Person Household | 1,017 (42.9%) | 1,354 (57.1%) |
| 2-Person Household | 1,318 (67.3%) | 641 (32.7%) |
| 3-Person Household | 453 (58.8%) | 317 (41.2%) |
| 4+ Person Household | 462 (64.5%) | 254 (35.5%) |
| Total Housing Units | 3,250 (55.9%) | 2,566 (44.1%) |
Occupancy by Educational Attainment in North Adams
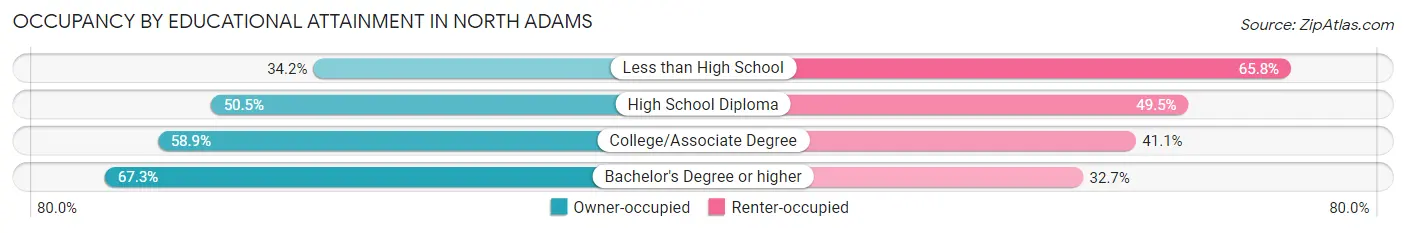
| Household Size | Owner-occupied | Renter-occupied |
| Less than High School | 194 (34.2%) | 373 (65.8%) |
| High School Diploma | 999 (50.5%) | 980 (49.5%) |
| College/Associate Degree | 1,001 (58.9%) | 699 (41.1%) |
| Bachelor's Degree or higher | 1,056 (67.3%) | 514 (32.7%) |
Occupancy by Age of Householder in North Adams
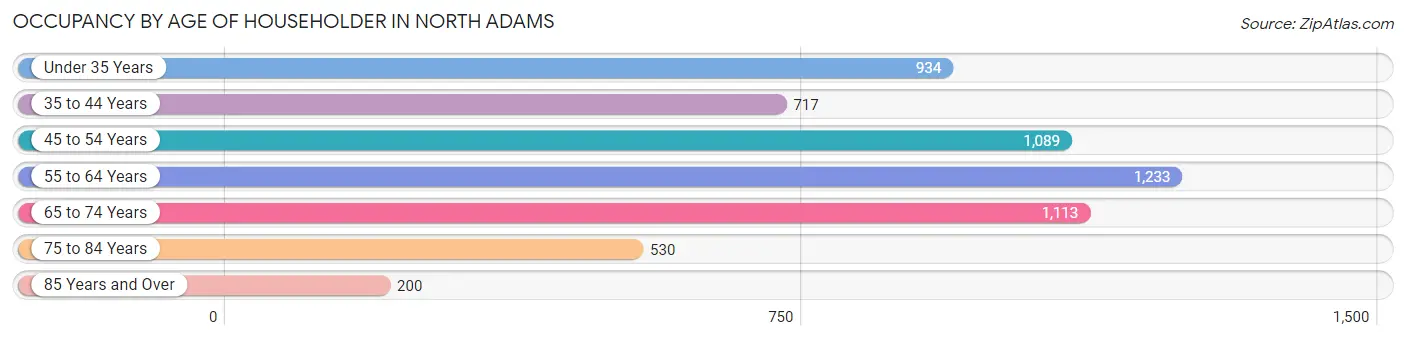
| Age Bracket | # Households | % Households |
| Under 35 Years | 934 | 16.1% |
| 35 to 44 Years | 717 | 12.3% |
| 45 to 54 Years | 1,089 | 18.7% |
| 55 to 64 Years | 1,233 | 21.2% |
| 65 to 74 Years | 1,113 | 19.1% |
| 75 to 84 Years | 530 | 9.1% |
| 85 Years and Over | 200 | 3.4% |
| Total | 5,816 | 100.0% |
Housing Finances in North Adams
Median Income by Occupancy in North Adams
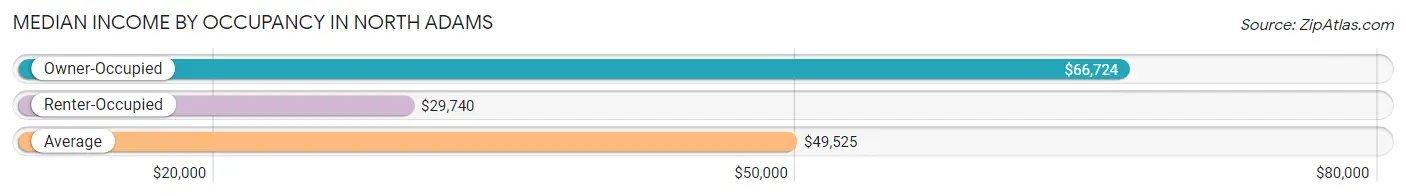
| Occupancy Type | # Households | Median Income |
| Owner-Occupied | 3,250 (55.9%) | $66,724 |
| Renter-Occupied | 2,566 (44.1%) | $29,740 |
| Average | 5,816 (100.0%) | $49,525 |
Occupancy by Householder Income Bracket in North Adams
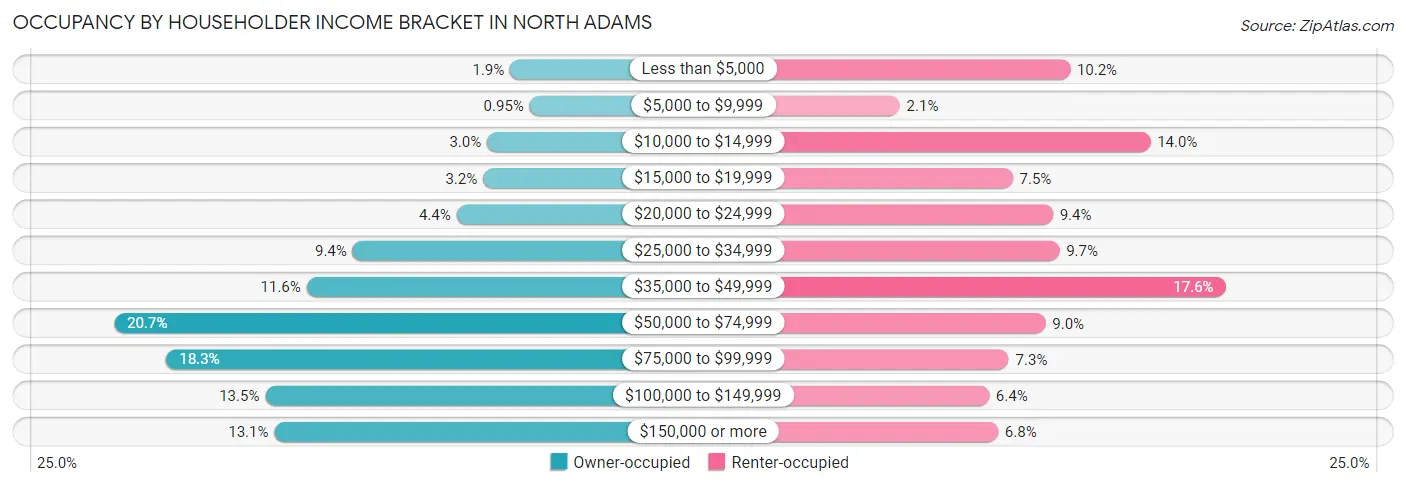
| Income Bracket | Owner-occupied | Renter-occupied |
| Less than $5,000 | 61 (1.9%) | 262 (10.2%) |
| $5,000 to $9,999 | 31 (0.9%) | 54 (2.1%) |
| $10,000 to $14,999 | 97 (3.0%) | 360 (14.0%) |
| $15,000 to $19,999 | 103 (3.2%) | 192 (7.5%) |
| $20,000 to $24,999 | 144 (4.4%) | 241 (9.4%) |
| $25,000 to $34,999 | 305 (9.4%) | 249 (9.7%) |
| $35,000 to $49,999 | 376 (11.6%) | 452 (17.6%) |
| $50,000 to $74,999 | 674 (20.7%) | 232 (9.0%) |
| $75,000 to $99,999 | 593 (18.2%) | 187 (7.3%) |
| $100,000 to $149,999 | 440 (13.5%) | 163 (6.4%) |
| $150,000 or more | 426 (13.1%) | 174 (6.8%) |
| Total | 3,250 (100.0%) | 2,566 (100.0%) |
Monthly Housing Cost Tiers in North Adams
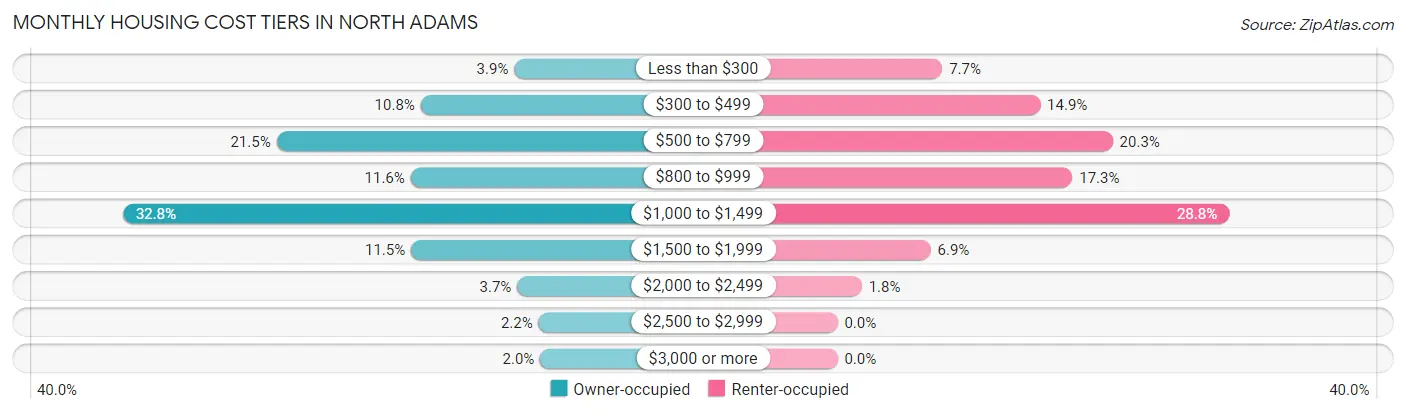
| Monthly Cost | Owner-occupied | Renter-occupied |
| Less than $300 | 128 (3.9%) | 198 (7.7%) |
| $300 to $499 | 352 (10.8%) | 383 (14.9%) |
| $500 to $799 | 697 (21.4%) | 520 (20.3%) |
| $800 to $999 | 376 (11.6%) | 444 (17.3%) |
| $1,000 to $1,499 | 1,065 (32.8%) | 740 (28.8%) |
| $1,500 to $1,999 | 375 (11.5%) | 176 (6.9%) |
| $2,000 to $2,499 | 121 (3.7%) | 46 (1.8%) |
| $2,500 to $2,999 | 70 (2.1%) | 0 (0.0%) |
| $3,000 or more | 66 (2.0%) | 0 (0.0%) |
| Total | 3,250 (100.0%) | 2,566 (100.0%) |
Physical Housing Characteristics in North Adams
Housing Structures in North Adams
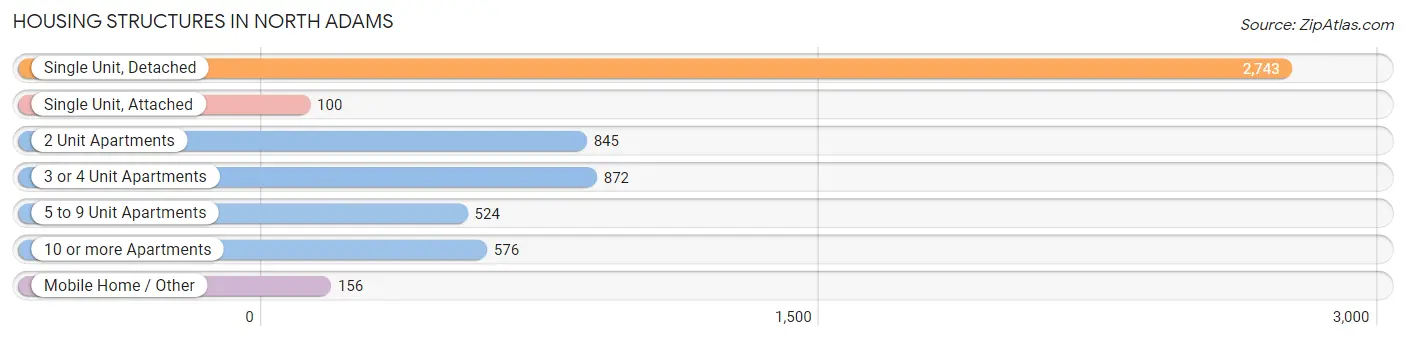
| Structure Type | # Housing Units | % Housing Units |
| Single Unit, Detached | 2,743 | 47.2% |
| Single Unit, Attached | 100 | 1.7% |
| 2 Unit Apartments | 845 | 14.5% |
| 3 or 4 Unit Apartments | 872 | 15.0% |
| 5 to 9 Unit Apartments | 524 | 9.0% |
| 10 or more Apartments | 576 | 9.9% |
| Mobile Home / Other | 156 | 2.7% |
| Total | 5,816 | 100.0% |
Housing Structures by Occupancy in North Adams
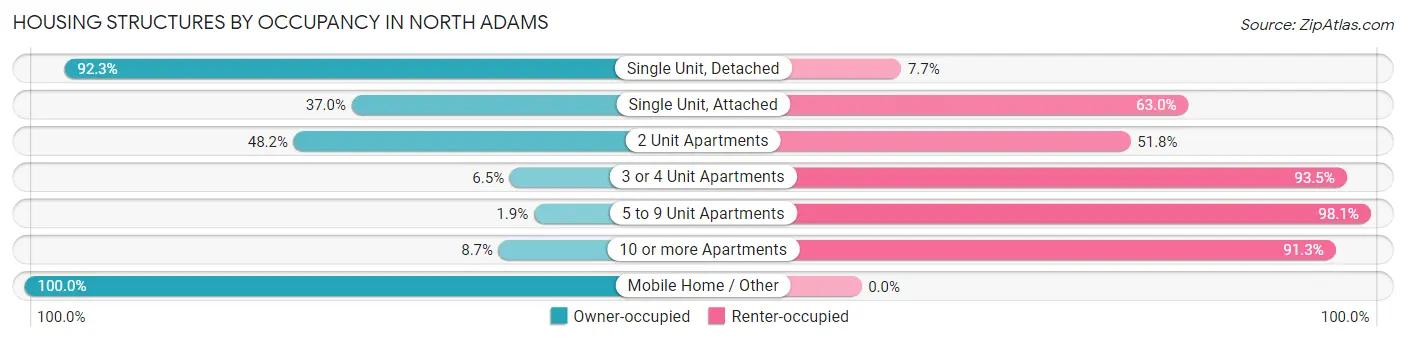
| Structure Type | Owner-occupied | Renter-occupied |
| Single Unit, Detached | 2,533 (92.3%) | 210 (7.7%) |
| Single Unit, Attached | 37 (37.0%) | 63 (63.0%) |
| 2 Unit Apartments | 407 (48.2%) | 438 (51.8%) |
| 3 or 4 Unit Apartments | 57 (6.5%) | 815 (93.5%) |
| 5 to 9 Unit Apartments | 10 (1.9%) | 514 (98.1%) |
| 10 or more Apartments | 50 (8.7%) | 526 (91.3%) |
| Mobile Home / Other | 156 (100.0%) | 0 (0.0%) |
| Total | 3,250 (55.9%) | 2,566 (44.1%) |
Housing Structures by Number of Rooms in North Adams
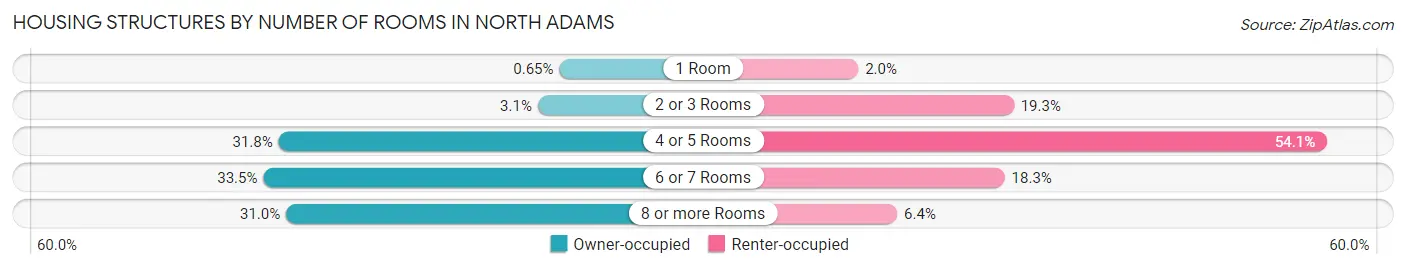
| Number of Rooms | Owner-occupied | Renter-occupied |
| 1 Room | 21 (0.6%) | 52 (2.0%) |
| 2 or 3 Rooms | 99 (3.0%) | 495 (19.3%) |
| 4 or 5 Rooms | 1,034 (31.8%) | 1,387 (54.0%) |
| 6 or 7 Rooms | 1,089 (33.5%) | 469 (18.3%) |
| 8 or more Rooms | 1,007 (31.0%) | 163 (6.4%) |
| Total | 3,250 (100.0%) | 2,566 (100.0%) |
Housing Structure by Heating Type in North Adams
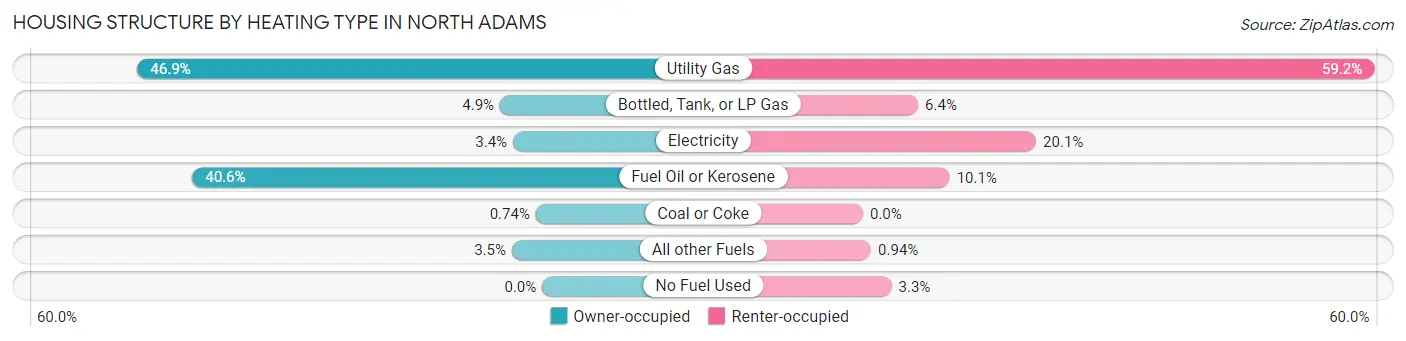
| Heating Type | Owner-occupied | Renter-occupied |
| Utility Gas | 1,525 (46.9%) | 1,520 (59.2%) |
| Bottled, Tank, or LP Gas | 159 (4.9%) | 164 (6.4%) |
| Electricity | 110 (3.4%) | 515 (20.1%) |
| Fuel Oil or Kerosene | 1,318 (40.6%) | 258 (10.1%) |
| Coal or Coke | 24 (0.7%) | 0 (0.0%) |
| All other Fuels | 114 (3.5%) | 24 (0.9%) |
| No Fuel Used | 0 (0.0%) | 85 (3.3%) |
| Total | 3,250 (100.0%) | 2,566 (100.0%) |
Household Vehicle Usage in North Adams
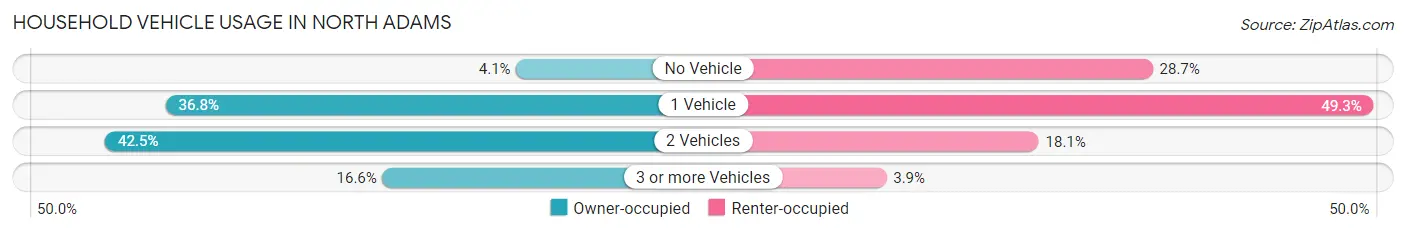
| Vehicles per Household | Owner-occupied | Renter-occupied |
| No Vehicle | 133 (4.1%) | 737 (28.7%) |
| 1 Vehicle | 1,197 (36.8%) | 1,266 (49.3%) |
| 2 Vehicles | 1,381 (42.5%) | 464 (18.1%) |
| 3 or more Vehicles | 539 (16.6%) | 99 (3.9%) |
| Total | 3,250 (100.0%) | 2,566 (100.0%) |
Real Estate & Mortgages in North Adams
Real Estate and Mortgage Overview in North Adams
| Characteristic | Without Mortgage | With Mortgage |
| Housing Units | 1,369 | 1,881 |
| Median Property Value | $157,200 | $172,500 |
| Median Household Income | $54,688 | $349 |
| Monthly Housing Costs | $591 | $66 |
| Real Estate Taxes | $2,791 | $45 |
Property Value by Mortgage Status in North Adams
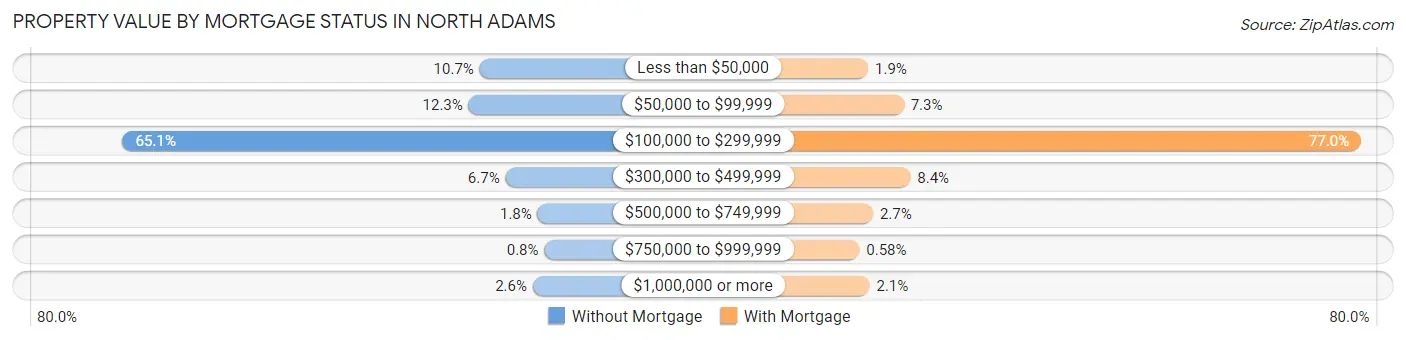
| Property Value | Without Mortgage | With Mortgage |
| Less than $50,000 | 146 (10.7%) | 36 (1.9%) |
| $50,000 to $99,999 | 169 (12.3%) | 138 (7.3%) |
| $100,000 to $299,999 | 891 (65.1%) | 1,449 (77.0%) |
| $300,000 to $499,999 | 92 (6.7%) | 157 (8.4%) |
| $500,000 to $749,999 | 25 (1.8%) | 50 (2.7%) |
| $750,000 to $999,999 | 11 (0.8%) | 11 (0.6%) |
| $1,000,000 or more | 35 (2.6%) | 40 (2.1%) |
| Total | 1,369 (100.0%) | 1,881 (100.0%) |
Household Income by Mortgage Status in North Adams
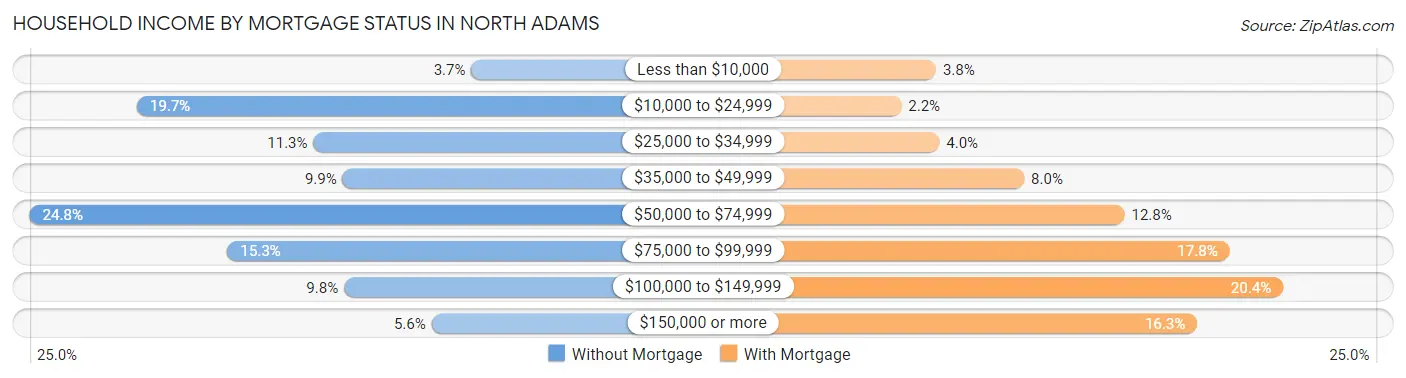
| Household Income | Without Mortgage | With Mortgage |
| Less than $10,000 | 51 (3.7%) | 72 (3.8%) |
| $10,000 to $24,999 | 269 (19.7%) | 41 (2.2%) |
| $25,000 to $34,999 | 154 (11.3%) | 75 (4.0%) |
| $35,000 to $49,999 | 135 (9.9%) | 151 (8.0%) |
| $50,000 to $74,999 | 339 (24.8%) | 241 (12.8%) |
| $75,000 to $99,999 | 210 (15.3%) | 335 (17.8%) |
| $100,000 to $149,999 | 134 (9.8%) | 383 (20.4%) |
| $150,000 or more | 77 (5.6%) | 306 (16.3%) |
| Total | 1,369 (100.0%) | 1,881 (100.0%) |
Property Value to Household Income Ratio in North Adams
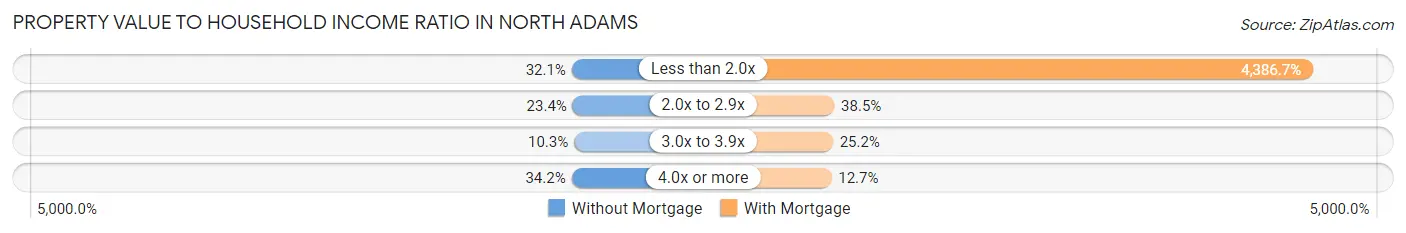
| Value-to-Income Ratio | Without Mortgage | With Mortgage |
| Less than 2.0x | 440 (32.1%) | 82,514 (4,386.7%) |
| 2.0x to 2.9x | 320 (23.4%) | 724 (38.5%) |
| 3.0x to 3.9x | 141 (10.3%) | 474 (25.2%) |
| 4.0x or more | 468 (34.2%) | 239 (12.7%) |
| Total | 1,369 (100.0%) | 1,881 (100.0%) |
Real Estate Taxes by Mortgage Status in North Adams
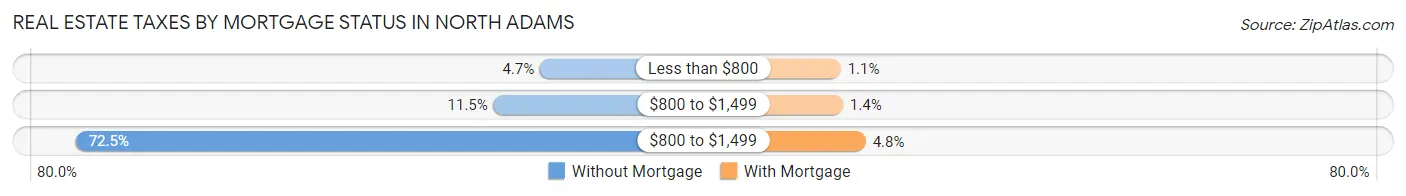
| Property Taxes | Without Mortgage | With Mortgage |
| Less than $800 | 64 (4.7%) | 21 (1.1%) |
| $800 to $1,499 | 157 (11.5%) | 27 (1.4%) |
| $800 to $1,499 | 993 (72.5%) | 90 (4.8%) |
| Total | 1,369 (100.0%) | 1,881 (100.0%) |
Health & Disability in North Adams
Health Insurance Coverage by Age in North Adams
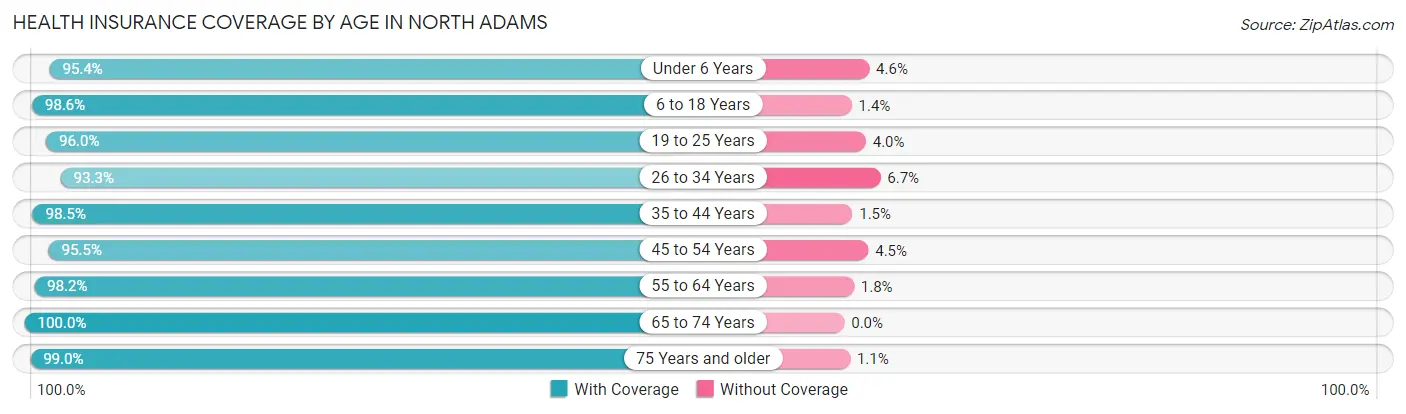
| Age Bracket | With Coverage | Without Coverage |
| Under 6 Years | 617 (95.4%) | 30 (4.6%) |
| 6 to 18 Years | 1,883 (98.6%) | 26 (1.4%) |
| 19 to 25 Years | 1,389 (96.0%) | 58 (4.0%) |
| 26 to 34 Years | 1,193 (93.3%) | 86 (6.7%) |
| 35 to 44 Years | 1,325 (98.5%) | 20 (1.5%) |
| 45 to 54 Years | 1,668 (95.5%) | 78 (4.5%) |
| 55 to 64 Years | 1,825 (98.2%) | 33 (1.8%) |
| 65 to 74 Years | 1,581 (100.0%) | 0 (0.0%) |
| 75 Years and older | 1,033 (99.0%) | 11 (1.1%) |
| Total | 12,514 (97.3%) | 342 (2.7%) |
Health Insurance Coverage by Citizenship Status in North Adams
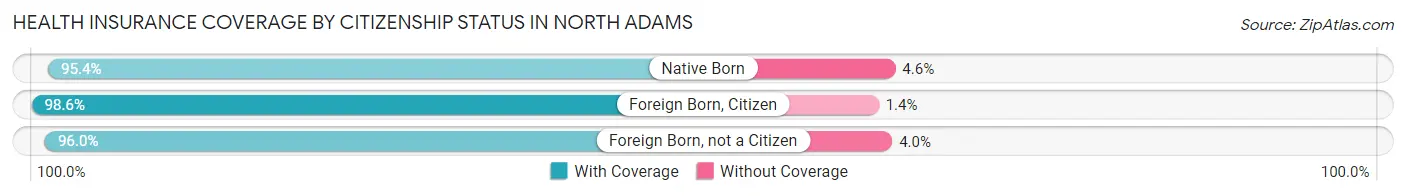
| Citizenship Status | With Coverage | Without Coverage |
| Native Born | 617 (95.4%) | 30 (4.6%) |
| Foreign Born, Citizen | 1,883 (98.6%) | 26 (1.4%) |
| Foreign Born, not a Citizen | 1,389 (96.0%) | 58 (4.0%) |
Health Insurance Coverage by Household Income in North Adams
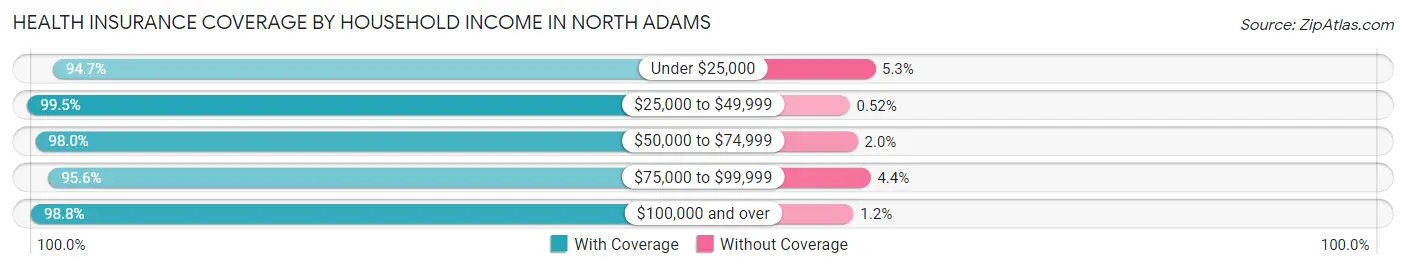
| Household Income | With Coverage | Without Coverage |
| Under $25,000 | 2,043 (94.7%) | 114 (5.3%) |
| $25,000 to $49,999 | 2,688 (99.5%) | 14 (0.5%) |
| $50,000 to $74,999 | 1,645 (98.0%) | 34 (2.0%) |
| $75,000 to $99,999 | 1,789 (95.6%) | 83 (4.4%) |
| $100,000 and over | 3,651 (98.8%) | 46 (1.2%) |
Public vs Private Health Insurance Coverage by Age in North Adams
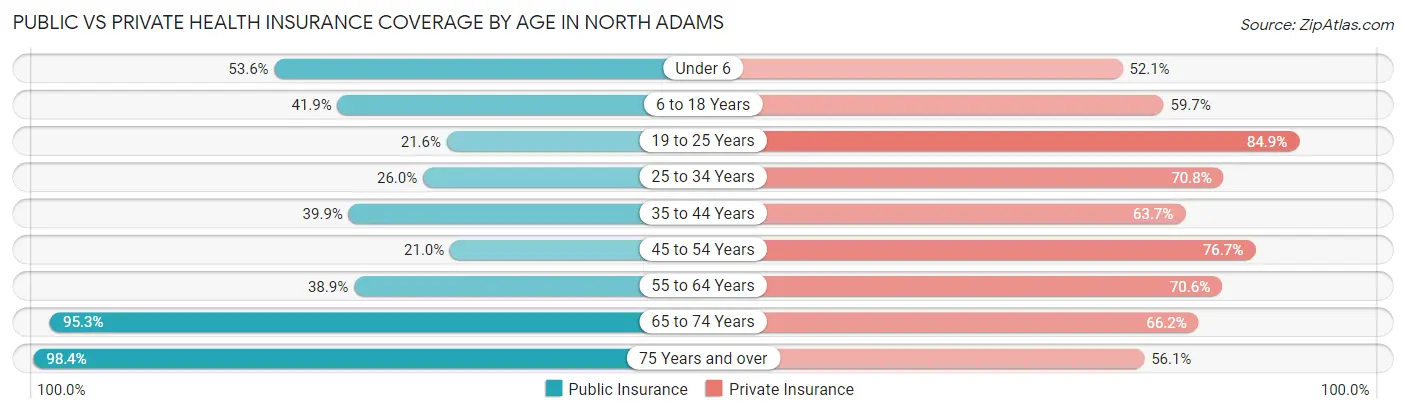
| Age Bracket | Public Insurance | Private Insurance |
| Under 6 | 347 (53.6%) | 337 (52.1%) |
| 6 to 18 Years | 800 (41.9%) | 1,140 (59.7%) |
| 19 to 25 Years | 313 (21.6%) | 1,228 (84.9%) |
| 25 to 34 Years | 333 (26.0%) | 906 (70.8%) |
| 35 to 44 Years | 536 (39.9%) | 857 (63.7%) |
| 45 to 54 Years | 367 (21.0%) | 1,339 (76.7%) |
| 55 to 64 Years | 722 (38.9%) | 1,311 (70.6%) |
| 65 to 74 Years | 1,506 (95.3%) | 1,047 (66.2%) |
| 75 Years and over | 1,027 (98.4%) | 586 (56.1%) |
| Total | 5,951 (46.3%) | 8,751 (68.1%) |
Disability Status by Sex by Age in North Adams
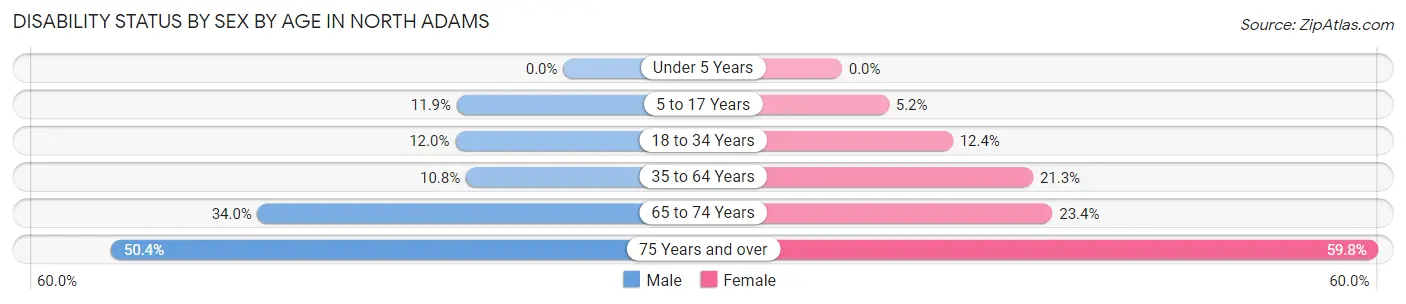
| Age Bracket | Male | Female |
| Under 5 Years | 0 (0.0%) | 0 (0.0%) |
| 5 to 17 Years | 97 (11.9%) | 44 (5.2%) |
| 18 to 34 Years | 203 (12.0%) | 170 (12.3%) |
| 35 to 64 Years | 263 (10.8%) | 537 (21.3%) |
| 65 to 74 Years | 303 (34.0%) | 162 (23.4%) |
| 75 Years and over | 194 (50.4%) | 394 (59.8%) |
Disability Class by Sex by Age in North Adams
Disability Class: Hearing Difficulty
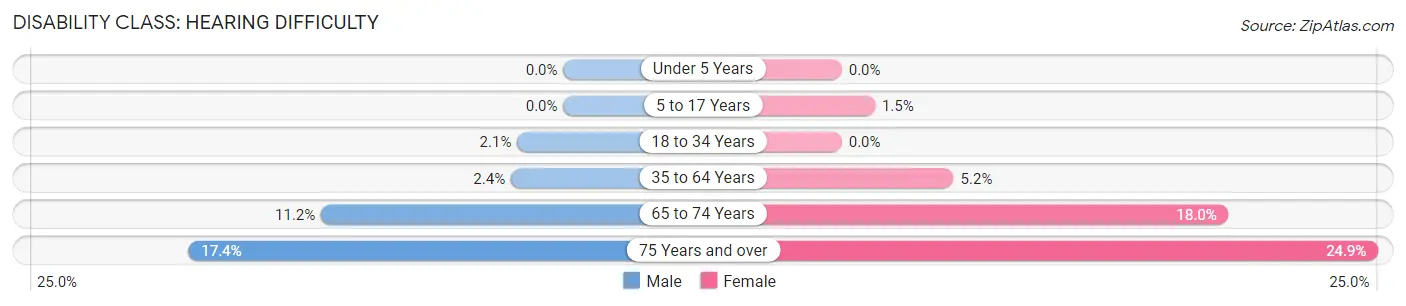
| Age Bracket | Male | Female |
| Under 5 Years | 0 (0.0%) | 0 (0.0%) |
| 5 to 17 Years | 0 (0.0%) | 13 (1.5%) |
| 18 to 34 Years | 36 (2.1%) | 0 (0.0%) |
| 35 to 64 Years | 59 (2.4%) | 131 (5.2%) |
| 65 to 74 Years | 100 (11.2%) | 124 (17.9%) |
| 75 Years and over | 67 (17.4%) | 164 (24.9%) |
Disability Class: Vision Difficulty
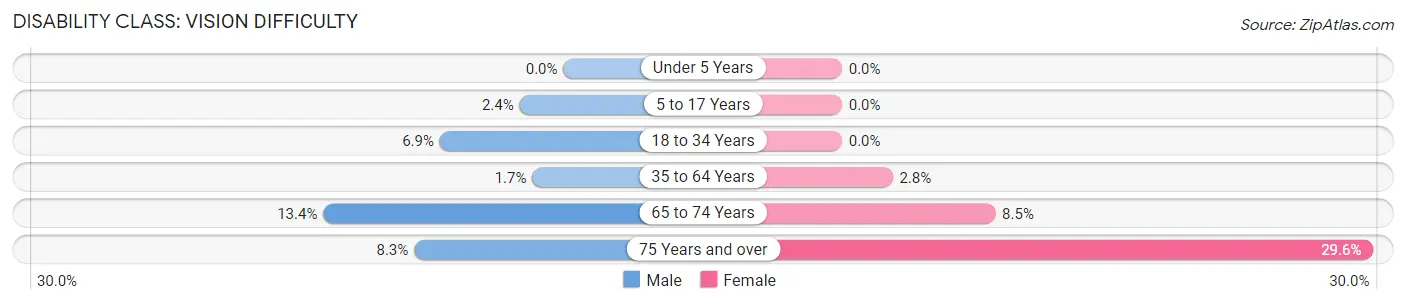
| Age Bracket | Male | Female |
| Under 5 Years | 0 (0.0%) | 0 (0.0%) |
| 5 to 17 Years | 20 (2.4%) | 0 (0.0%) |
| 18 to 34 Years | 116 (6.9%) | 0 (0.0%) |
| 35 to 64 Years | 42 (1.7%) | 71 (2.8%) |
| 65 to 74 Years | 119 (13.4%) | 59 (8.5%) |
| 75 Years and over | 32 (8.3%) | 195 (29.6%) |
Disability Class: Cognitive Difficulty
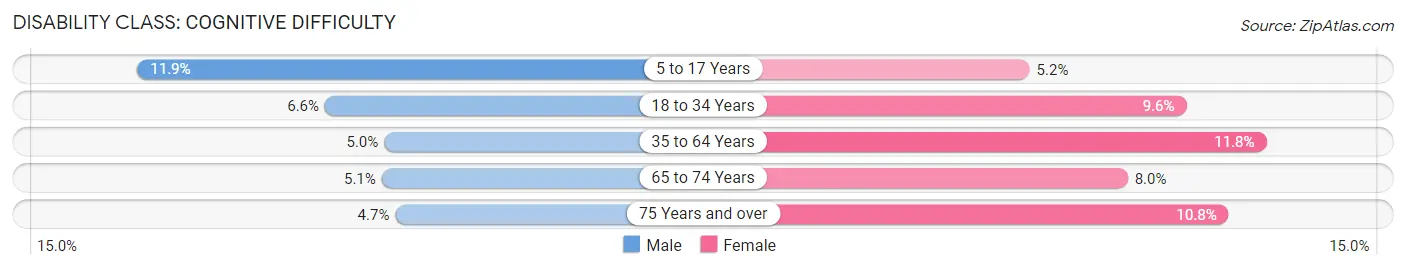
| Age Bracket | Male | Female |
| 5 to 17 Years | 97 (11.9%) | 44 (5.2%) |
| 18 to 34 Years | 112 (6.6%) | 132 (9.6%) |
| 35 to 64 Years | 121 (5.0%) | 298 (11.8%) |
| 65 to 74 Years | 45 (5.1%) | 55 (8.0%) |
| 75 Years and over | 18 (4.7%) | 71 (10.8%) |
Disability Class: Ambulatory Difficulty
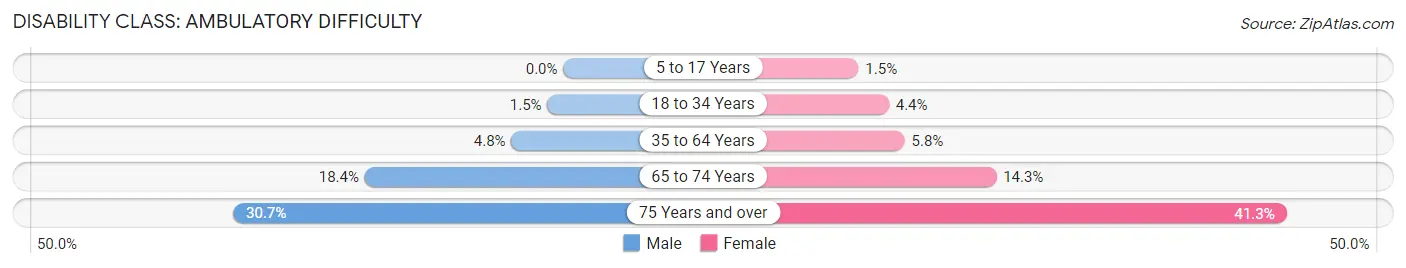
| Age Bracket | Male | Female |
| 5 to 17 Years | 0 (0.0%) | 13 (1.5%) |
| 18 to 34 Years | 25 (1.5%) | 60 (4.4%) |
| 35 to 64 Years | 117 (4.8%) | 147 (5.8%) |
| 65 to 74 Years | 164 (18.4%) | 99 (14.3%) |
| 75 Years and over | 118 (30.6%) | 272 (41.3%) |
Disability Class: Self-Care Difficulty
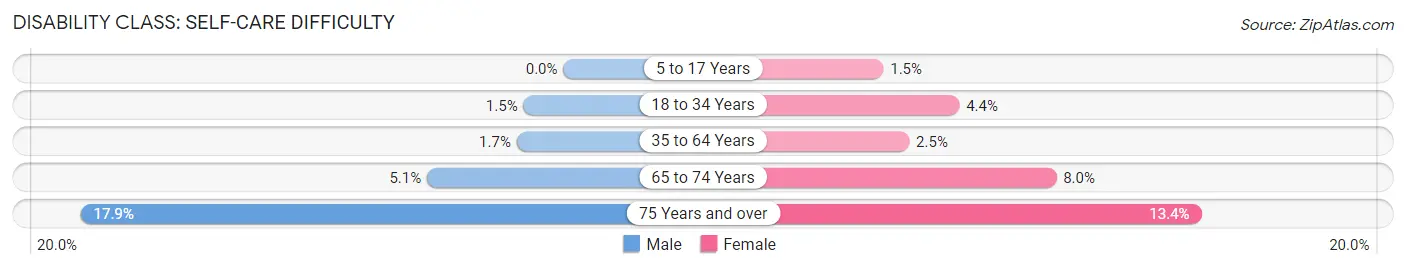
| Age Bracket | Male | Female |
| 5 to 17 Years | 0 (0.0%) | 13 (1.5%) |
| 18 to 34 Years | 25 (1.5%) | 60 (4.4%) |
| 35 to 64 Years | 42 (1.7%) | 63 (2.5%) |
| 65 to 74 Years | 45 (5.1%) | 55 (8.0%) |
| 75 Years and over | 69 (17.9%) | 88 (13.4%) |
Technology Access in North Adams
Computing Device Access in North Adams
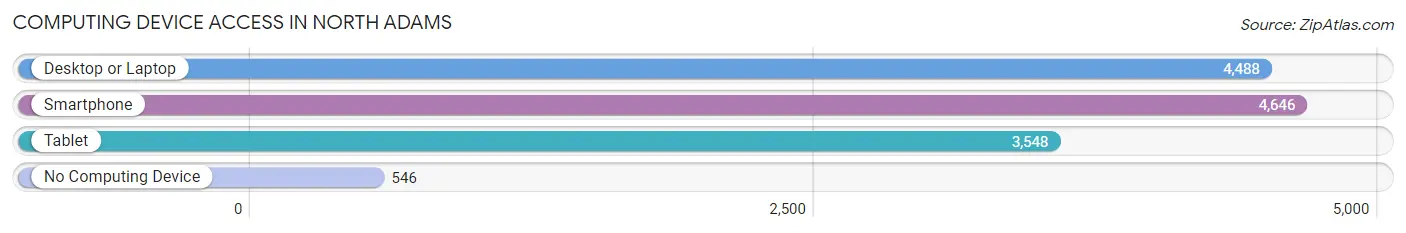
| Device Type | # Households | % Households |
| Desktop or Laptop | 4,488 | 77.2% |
| Smartphone | 4,646 | 79.9% |
| Tablet | 3,548 | 61.0% |
| No Computing Device | 546 | 9.4% |
| Total | 5,816 | 100.0% |
Internet Access in North Adams
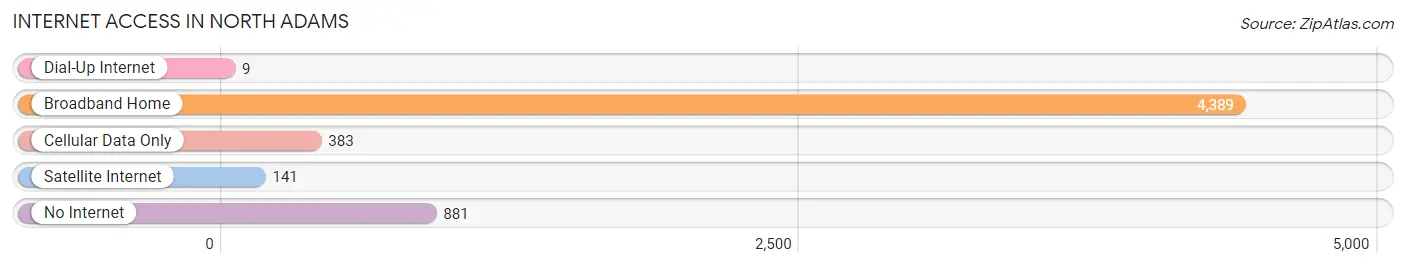
| Internet Type | # Households | % Households |
| Dial-Up Internet | 9 | 0.2% |
| Broadband Home | 4,389 | 75.5% |
| Cellular Data Only | 383 | 6.6% |
| Satellite Internet | 141 | 2.4% |
| No Internet | 881 | 15.1% |
| Total | 5,816 | 100.0% |
North Adams Summary
History
The city of North Adams, Massachusetts is located in the northwestern corner of the state, in the Berkshire Mountains. It is the northernmost city in the state, and is the smallest city in the state by population. The city was originally part of the town of Adams, which was incorporated in 1778. In 1878, the city of North Adams was incorporated from the northern part of Adams.
The city was originally a farming community, but in the late 19th century, it became an industrial center. The city was home to several large factories, including the Sprague Electric Company, which was the largest employer in the city. The Sprague Electric Company was founded in 1876 and was the first company to produce electric motors in the United States. The company was a major employer in the city until it closed in 1985.
The city was also home to several other industries, including the North Adams Textile Company, which was founded in 1891 and was the largest employer in the city until it closed in the 1950s. The city was also home to several paper mills, which were the main employers in the city until they closed in the late 20th century.
Geography
North Adams is located in the northwestern corner of Massachusetts, in the Berkshire Mountains. The city is located on the Hoosic River, which flows through the city. The city is bordered by the towns of Adams, Cheshire, Clarksburg, Florida, and Williamstown. The city is located about 25 miles north of Pittsfield, the largest city in the county, and about 90 miles west of Boston.
The city has a total area of 4.2 square miles, of which 4.1 square miles is land and 0.1 square miles is water. The city is located at an elevation of 1,000 feet above sea level. The city is located in a hilly area, with several small mountains in the area. The highest point in the city is the summit of Mount Greylock, which is located just outside the city limits and has an elevation of 3,491 feet.
Economy
North Adams has a diverse economy, with a mix of manufacturing, retail, and service industries. The city is home to several large employers, including the North Adams Regional Hospital, the North Adams Public Schools, and the North Adams Transcript newspaper. The city is also home to several small businesses, including restaurants, shops, and galleries.
The city is also home to several tourist attractions, including the Massachusetts Museum of Contemporary Art, the Natural Bridge State Park, and the North Adams Historical Society. The city is also home to several festivals, including the North Adams Jazz Festival and the North Adams Film Festival.
Demographics
As of the 2010 census, the city of North Adams had a population of 13,708. The population was 51.2% female and 48.8% male. The median age was 39.7 years. The racial makeup of the city was 94.2% White, 1.3% African American, 0.4% Native American, 1.2% Asian, 0.1% Pacific Islander, 1.2% from other races, and 1.6% from two or more races. Hispanic or Latino of any race were 3.2% of the population.
The median household income in the city was $37,945, and the median family income was $45,945. The per capita income in the city was $20,945. About 17.2% of the population was below the poverty line.
Common Questions
What is Per Capita Income in North Adams?
Per Capita income in North Adams is $34,417.
What is the Median Family Income in North Adams?
Median Family Income in North Adams is $69,861.
What is the Median Household income in North Adams?
Median Household Income in North Adams is $49,525.
What is Income or Wage Gap in North Adams?
Income or Wage Gap in North Adams is 29.2%.
Women in North Adams earn 70.8 cents for every dollar earned by a man.
What is Inequality or Gini Index in North Adams?
Inequality or Gini Index in North Adams is 0.51.
What is the Total Population of North Adams?
Total Population of North Adams is 12,937.
What is the Total Male Population of North Adams?
Total Male Population of North Adams is 6,526.
What is the Total Female Population of North Adams?
Total Female Population of North Adams is 6,411.
What is the Ratio of Males per 100 Females in North Adams?
There are 101.79 Males per 100 Females in North Adams.
What is the Ratio of Females per 100 Males in North Adams?
There are 98.24 Females per 100 Males in North Adams.
What is the Median Population Age in North Adams?
Median Population Age in North Adams is 44.5 Years.
What is the Average Family Size in North Adams
Average Family Size in North Adams is 2.8 People.
What is the Average Household Size in North Adams
Average Household Size in North Adams is 2.1 People.
How Large is the Labor Force in North Adams?
There are 6,429 People in the Labor Forcein in North Adams.
What is the Percentage of People in the Labor Force in North Adams?
58.3% of People are in the Labor Force in North Adams.
What is the Unemployment Rate in North Adams?
Unemployment Rate in North Adams is 5.0%.