Newburyport, MA Map & Demographics
Newburyport Map
Newburyport Overview
$73,247
PER CAPITA INCOME
$169,347
AVG FAMILY INCOME
$127,306
AVG HOUSEHOLD INCOME
42.9%
WAGE / INCOME GAP [ % ]
57.1¢/ $1
WAGE / INCOME GAP [ $ ]
0.48
INEQUALITY / GINI INDEX
18,356
TOTAL POPULATION
8,211
MALE POPULATION
10,145
FEMALE POPULATION
80.94
MALES / 100 FEMALES
123.55
FEMALES / 100 MALES
46.5
MEDIAN AGE
2.9
AVG FAMILY SIZE
2.4
AVG HOUSEHOLD SIZE
10,024
LABOR FORCE [ PEOPLE ]
68.9%
PERCENT IN LABOR FORCE
5.7%
UNEMPLOYMENT RATE
Newburyport Zip Codes
Newburyport Area Codes
Income in Newburyport
Income Overview in Newburyport
Per Capita Income in Newburyport is $73,247, while median incomes of families and households are $169,347 and $127,306 respectively.
| Characteristic | Number | Measure |
| Per Capita Income | 18,356 | $73,247 |
| Median Family Income | 5,035 | $169,347 |
| Mean Family Income | 5,035 | $212,446 |
| Median Household Income | 7,591 | $127,306 |
| Mean Household Income | 7,591 | $176,211 |
| Income Deficit | 5,035 | $0 |
| Wage / Income Gap (%) | 18,356 | 42.86% |
| Wage / Income Gap ($) | 18,356 | 57.14¢ per $1 |
| Gini / Inequality Index | 18,356 | 0.48 |
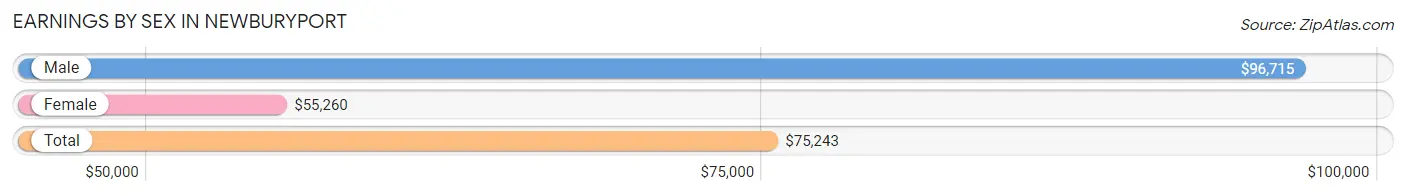
Earnings by Sex in Newburyport
Average Earnings in Newburyport are $75,243, $96,715 for men and $55,260 for women, a difference of 42.9%.
| Sex | Number | Average Earnings |
| Male | 5,022 (48.4%) | $96,715 |
| Female | 5,348 (51.6%) | $55,260 |
| Total | 10,370 (100.0%) | $75,243 |
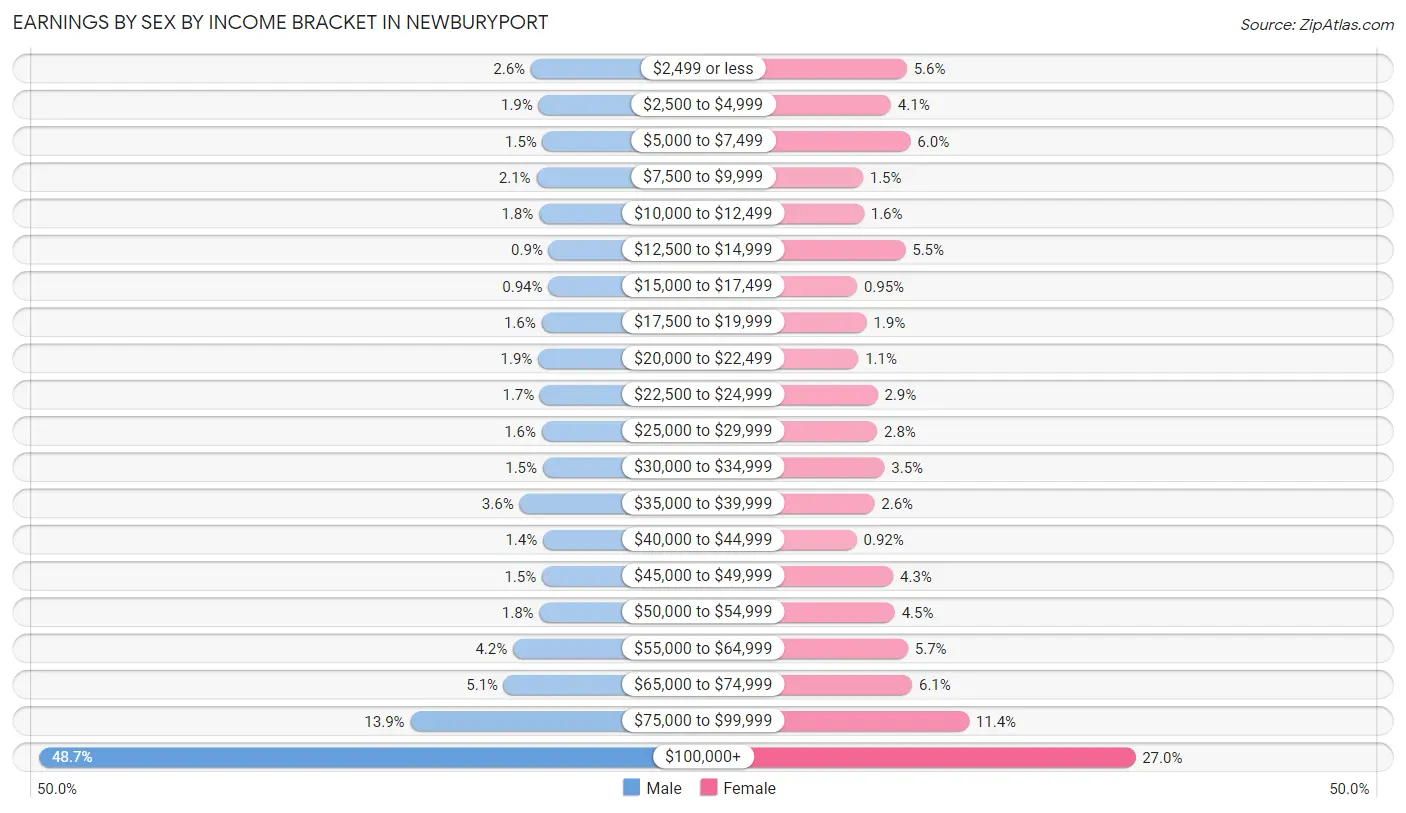
Earnings by Sex by Income Bracket in Newburyport
The most common earnings brackets in Newburyport are $100,000+ for men (2,443 | 48.6%) and $100,000+ for women (1,445 | 27.0%).
| Income | Male | Female |
| $2,499 or less | 129 (2.6%) | 300 (5.6%) |
| $2,500 to $4,999 | 93 (1.8%) | 221 (4.1%) |
| $5,000 to $7,499 | 74 (1.5%) | 319 (6.0%) |
| $7,500 to $9,999 | 103 (2.1%) | 80 (1.5%) |
| $10,000 to $12,499 | 91 (1.8%) | 85 (1.6%) |
| $12,500 to $14,999 | 45 (0.9%) | 293 (5.5%) |
| $15,000 to $17,499 | 47 (0.9%) | 51 (0.9%) |
| $17,500 to $19,999 | 79 (1.6%) | 99 (1.8%) |
| $20,000 to $22,499 | 95 (1.9%) | 57 (1.1%) |
| $22,500 to $24,999 | 86 (1.7%) | 154 (2.9%) |
| $25,000 to $29,999 | 78 (1.5%) | 152 (2.8%) |
| $30,000 to $34,999 | 73 (1.5%) | 188 (3.5%) |
| $35,000 to $39,999 | 183 (3.6%) | 138 (2.6%) |
| $40,000 to $44,999 | 72 (1.4%) | 49 (0.9%) |
| $45,000 to $49,999 | 77 (1.5%) | 232 (4.3%) |
| $50,000 to $54,999 | 89 (1.8%) | 240 (4.5%) |
| $55,000 to $64,999 | 213 (4.2%) | 306 (5.7%) |
| $65,000 to $74,999 | 256 (5.1%) | 327 (6.1%) |
| $75,000 to $99,999 | 696 (13.9%) | 612 (11.4%) |
| $100,000+ | 2,443 (48.6%) | 1,445 (27.0%) |
| Total | 5,022 (100.0%) | 5,348 (100.0%) |
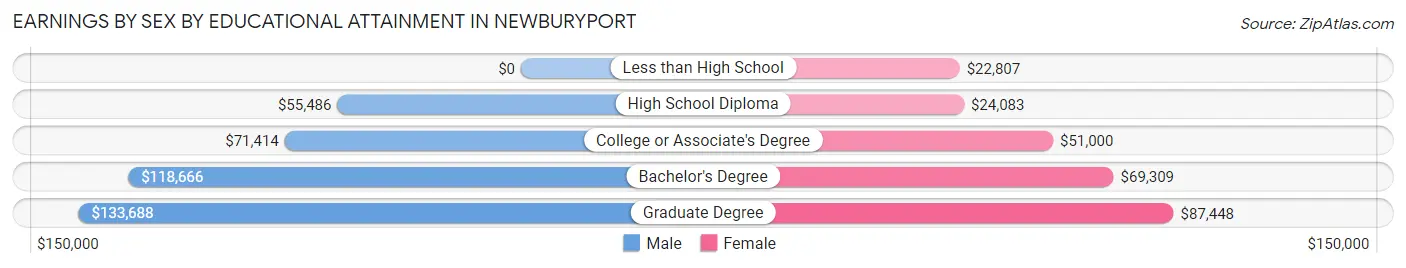
Earnings by Sex by Educational Attainment in Newburyport
Average earnings in Newburyport are $104,571 for men and $64,224 for women, a difference of 38.6%. Men with an educational attainment of graduate degree enjoy the highest average annual earnings of $133,688, while those with high school diploma education earn the least with $55,486. Women with an educational attainment of graduate degree earn the most with the average annual earnings of $87,448, while those with less than high school education have the smallest earnings of $22,807.
| Educational Attainment | Male Income | Female Income |
| Less than High School | - | - |
| High School Diploma | $55,486 | $24,083 |
| College or Associate's Degree | $71,414 | $51,000 |
| Bachelor's Degree | $118,666 | $69,309 |
| Graduate Degree | $133,688 | $87,448 |
| Total | $104,571 | $64,224 |
Family Income in Newburyport
Family Income Brackets in Newburyport
According to the Newburyport family income data, there are 1,979 families falling into the $200,000+ income range, which is the most common income bracket and makes up 39.3% of all families. Conversely, the less than $10,000 income bracket is the least frequent group with only 65 families (1.3%) belonging to this category.
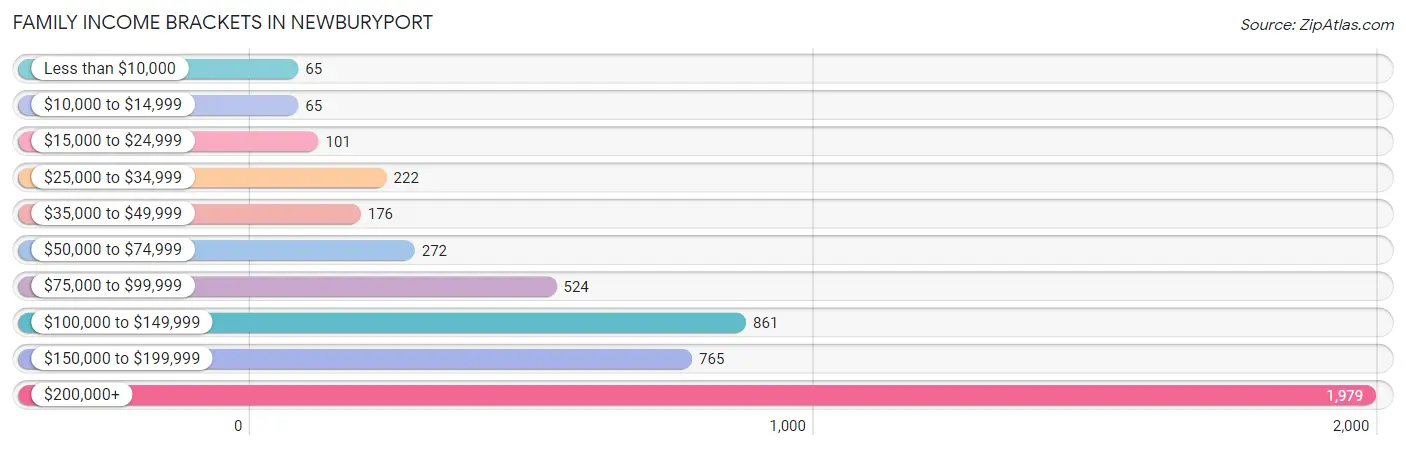
| Income Bracket | # Families | % Families |
| Less than $10,000 | 65 | 1.3% |
| $10,000 to $14,999 | 65 | 1.3% |
| $15,000 to $24,999 | 101 | 2.0% |
| $25,000 to $34,999 | 222 | 4.4% |
| $35,000 to $49,999 | 176 | 3.5% |
| $50,000 to $74,999 | 272 | 5.4% |
| $75,000 to $99,999 | 524 | 10.4% |
| $100,000 to $149,999 | 861 | 17.1% |
| $150,000 to $199,999 | 765 | 15.2% |
| $200,000+ | 1,979 | 39.3% |
Family Income by Famaliy Size in Newburyport
6-person families (245 | 4.9%) account for the highest median family income in Newburyport with $250,001 per family, while 2-person families (2,574 | 51.1%) have the highest median income of $71,340 per family member.
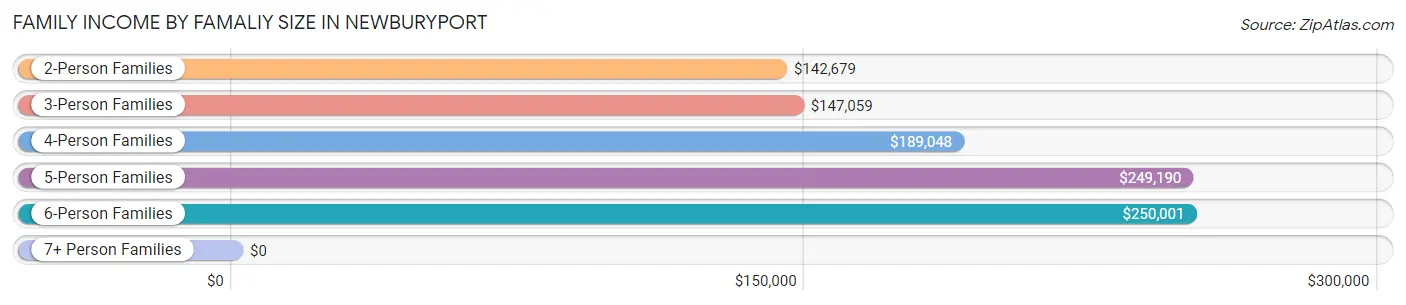
| Income Bracket | # Families | Median Income |
| 2-Person Families | 2,574 (51.1%) | $142,679 |
| 3-Person Families | 1,020 (20.3%) | $147,059 |
| 4-Person Families | 904 (17.9%) | $189,048 |
| 5-Person Families | 283 (5.6%) | $249,190 |
| 6-Person Families | 245 (4.9%) | $250,001 |
| 7+ Person Families | 9 (0.2%) | $0 |
| Total | 5,035 (100.0%) | $169,347 |
Family Income by Number of Earners in Newburyport
The median family income in Newburyport is $169,347, with families comprising 3+ earners (614) having the highest median family income of $250,001, while families with no earners (708) have the lowest median family income of $66,711, accounting for 12.2% and 14.1% of families, respectively.
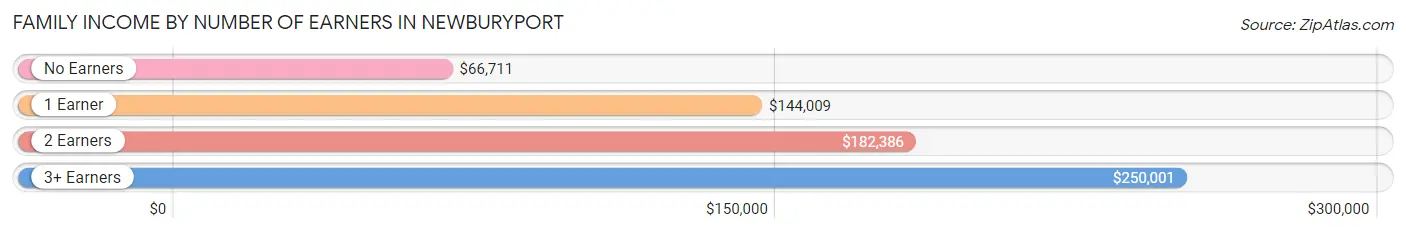
| Number of Earners | # Families | Median Income |
| No Earners | 708 (14.1%) | $66,711 |
| 1 Earner | 1,307 (26.0%) | $144,009 |
| 2 Earners | 2,406 (47.8%) | $182,386 |
| 3+ Earners | 614 (12.2%) | $250,001 |
| Total | 5,035 (100.0%) | $169,347 |
Household Income in Newburyport
Household Income Brackets in Newburyport
With 2,323 households falling in the category, the $200,000+ income range is the most frequent in Newburyport, accounting for 30.6% of all households. In contrast, only 220 households (2.9%) fall into the less than $10,000 income bracket, making it the least populous group.
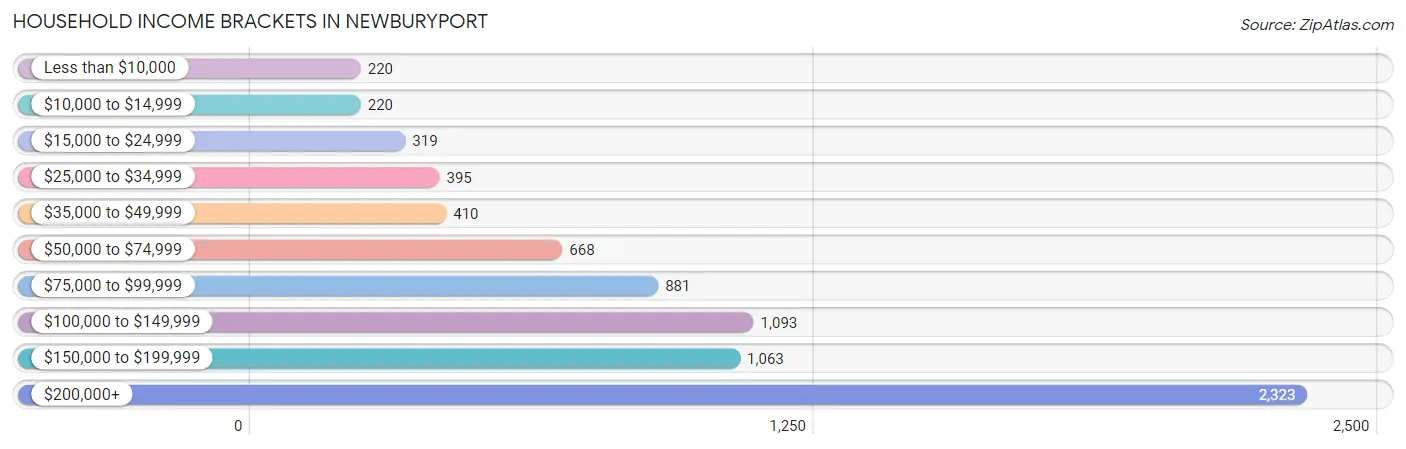
| Income Bracket | # Households | % Households |
| Less than $10,000 | 220 | 2.9% |
| $10,000 to $14,999 | 220 | 2.9% |
| $15,000 to $24,999 | 319 | 4.2% |
| $25,000 to $34,999 | 395 | 5.2% |
| $35,000 to $49,999 | 410 | 5.4% |
| $50,000 to $74,999 | 668 | 8.8% |
| $75,000 to $99,999 | 881 | 11.6% |
| $100,000 to $149,999 | 1,093 | 14.4% |
| $150,000 to $199,999 | 1,063 | 14.0% |
| $200,000+ | 2,323 | 30.6% |
Household Income by Householder Age in Newburyport
The median household income in Newburyport is $127,306, with the highest median household income of $178,800 found in the 25 to 44 years age bracket for the primary householder. A total of 1,894 households (24.9%) fall into this category. Meanwhile, the 15 to 24 years age bracket for the primary householder has the lowest median household income of $54,091, with 106 households (1.4%) in this group.
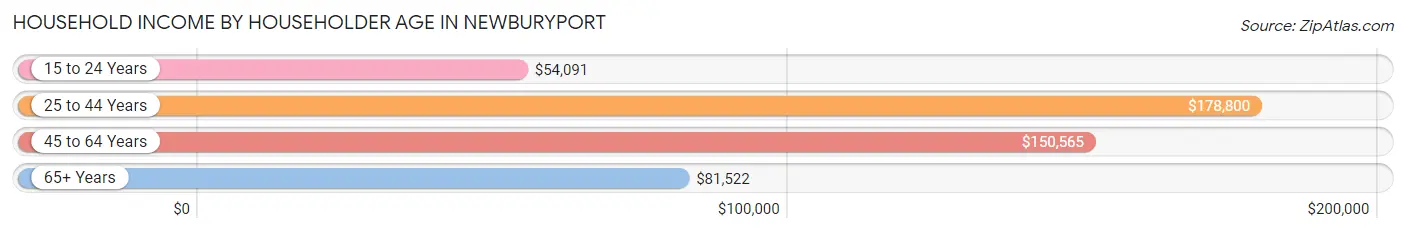
| Income Bracket | # Households | Median Income |
| 15 to 24 Years | 106 (1.4%) | $54,091 |
| 25 to 44 Years | 1,894 (24.9%) | $178,800 |
| 45 to 64 Years | 3,302 (43.5%) | $150,565 |
| 65+ Years | 2,289 (30.1%) | $81,522 |
| Total | 7,591 (100.0%) | $127,306 |
Poverty in Newburyport
Income Below Poverty by Sex and Age in Newburyport
With 5.9% poverty level for males and 5.8% for females among the residents of Newburyport, 25 to 34 year old males and 5 year old females are the most vulnerable to poverty, with 126 males (17.8%) and 41 females (22.3%) in their respective age groups living below the poverty level.
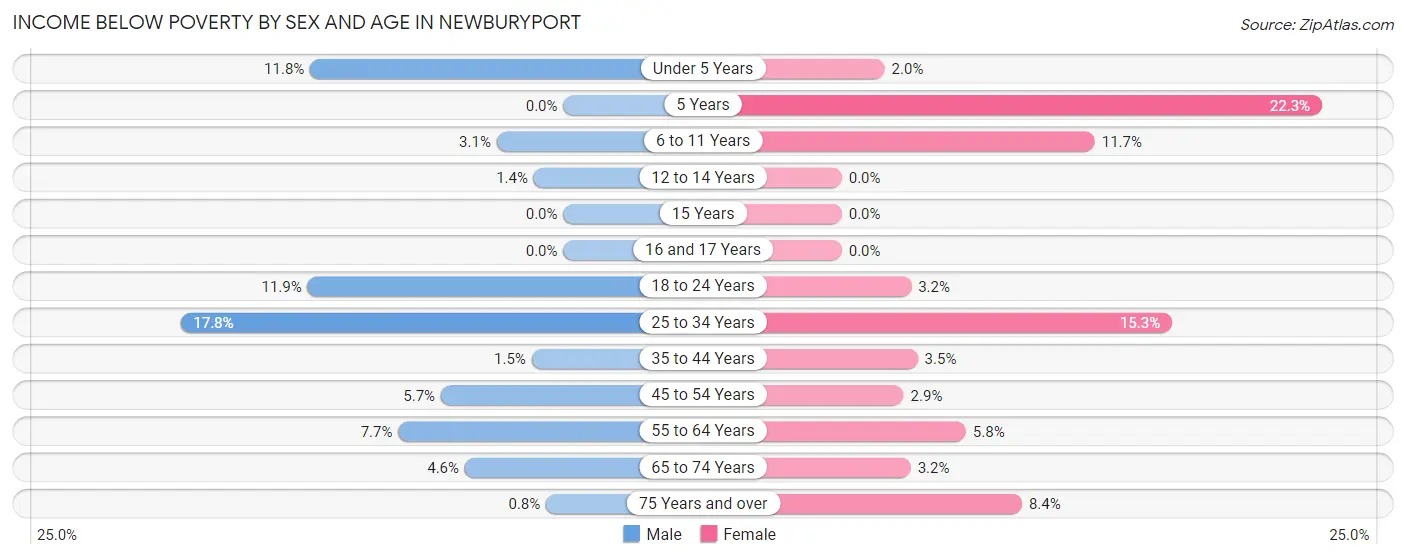
| Age Bracket | Male | Female |
| Under 5 Years | 37 (11.7%) | 7 (2.0%) |
| 5 Years | 0 (0.0%) | 41 (22.3%) |
| 6 to 11 Years | 24 (3.1%) | 87 (11.7%) |
| 12 to 14 Years | 8 (1.4%) | 0 (0.0%) |
| 15 Years | 0 (0.0%) | 0 (0.0%) |
| 16 and 17 Years | 0 (0.0%) | 0 (0.0%) |
| 18 to 24 Years | 40 (11.9%) | 20 (3.2%) |
| 25 to 34 Years | 126 (17.8%) | 136 (15.3%) |
| 35 to 44 Years | 15 (1.5%) | 38 (3.5%) |
| 45 to 54 Years | 57 (5.7%) | 38 (2.9%) |
| 55 to 64 Years | 124 (7.7%) | 97 (5.8%) |
| 65 to 74 Years | 42 (4.6%) | 42 (3.2%) |
| 75 Years and over | 5 (0.8%) | 75 (8.4%) |
| Total | 478 (5.9%) | 581 (5.8%) |
Income Above Poverty by Sex and Age in Newburyport
According to the poverty statistics in Newburyport, males aged 5 years and females aged 12 to 14 years are the age groups that are most secure financially, with 100.0% of males and 100.0% of females in these age groups living above the poverty line.
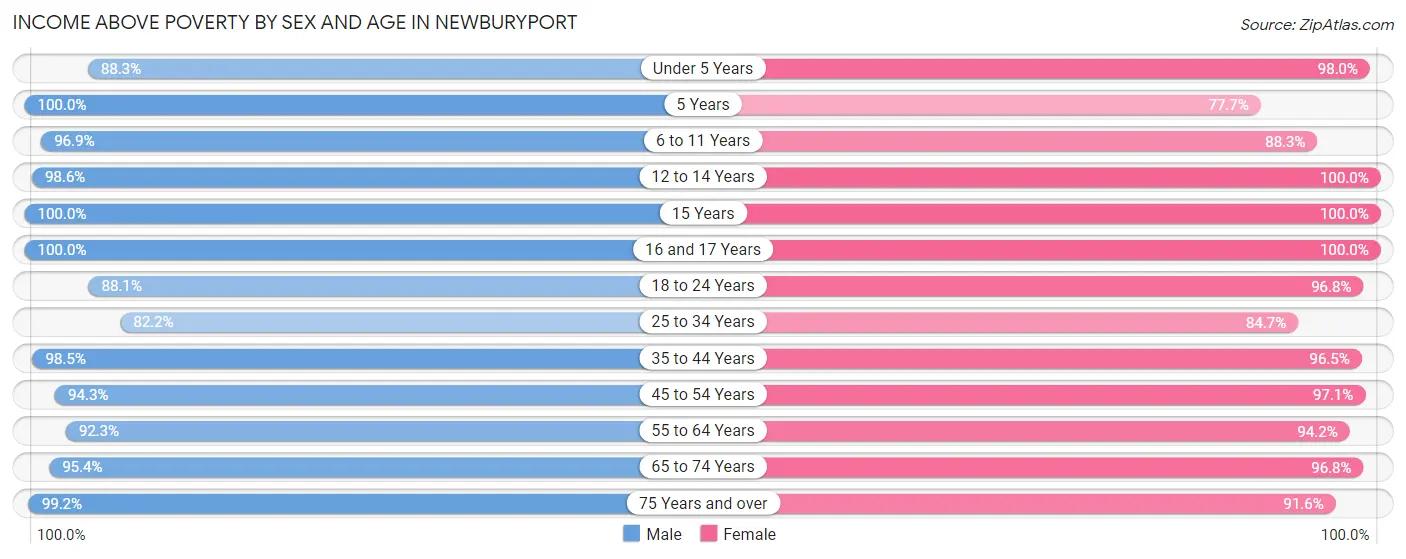
| Age Bracket | Male | Female |
| Under 5 Years | 278 (88.2%) | 344 (98.0%) |
| 5 Years | 5 (100.0%) | 143 (77.7%) |
| 6 to 11 Years | 753 (96.9%) | 654 (88.3%) |
| 12 to 14 Years | 575 (98.6%) | 645 (100.0%) |
| 15 Years | 125 (100.0%) | 65 (100.0%) |
| 16 and 17 Years | 84 (100.0%) | 182 (100.0%) |
| 18 to 24 Years | 297 (88.1%) | 601 (96.8%) |
| 25 to 34 Years | 583 (82.2%) | 752 (84.7%) |
| 35 to 44 Years | 1,008 (98.5%) | 1,043 (96.5%) |
| 45 to 54 Years | 947 (94.3%) | 1,288 (97.1%) |
| 55 to 64 Years | 1,495 (92.3%) | 1,588 (94.2%) |
| 65 to 74 Years | 878 (95.4%) | 1,271 (96.8%) |
| 75 Years and over | 619 (99.2%) | 822 (91.6%) |
| Total | 7,647 (94.1%) | 9,398 (94.2%) |
Income Below Poverty Among Married-Couple Families in Newburyport
The poverty statistics for married-couple families in Newburyport show that 3.3% or 139 of the total 4,257 families live below the poverty line. Families with 1 or 2 children have the highest poverty rate of 8.0%, comprising of 95 families. On the other hand, families with 3 or 4 children have the lowest poverty rate of 0.0%, which includes 0 families.
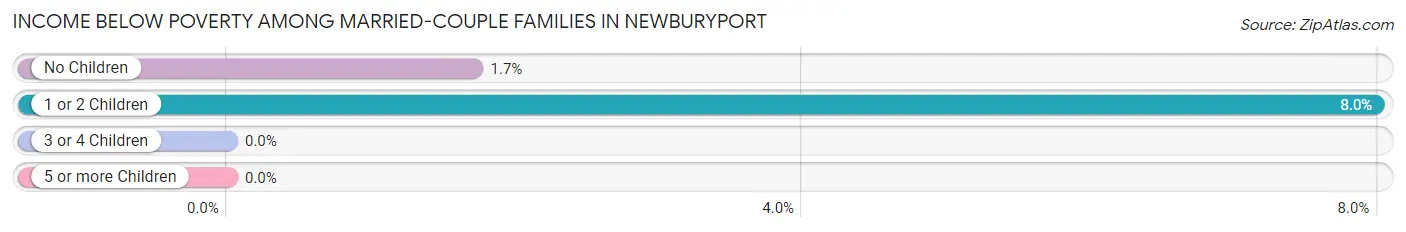
| Children | Above Poverty | Below Poverty |
| No Children | 2,535 (98.3%) | 44 (1.7%) |
| 1 or 2 Children | 1,096 (92.0%) | 95 (8.0%) |
| 3 or 4 Children | 484 (100.0%) | 0 (0.0%) |
| 5 or more Children | 3 (100.0%) | 0 (0.0%) |
| Total | 4,118 (96.7%) | 139 (3.3%) |
Income Below Poverty Among Single-Parent Households in Newburyport
According to the poverty data in Newburyport, 27.1% or 29 single-father households and 9.1% or 61 single-mother households are living below the poverty line. Among single-father households, those with 1 or 2 children have the highest poverty rate, with 29 households (51.8%) experiencing poverty. Likewise, among single-mother households, those with 1 or 2 children have the highest poverty rate, with 42 households (11.4%) falling below the poverty line.
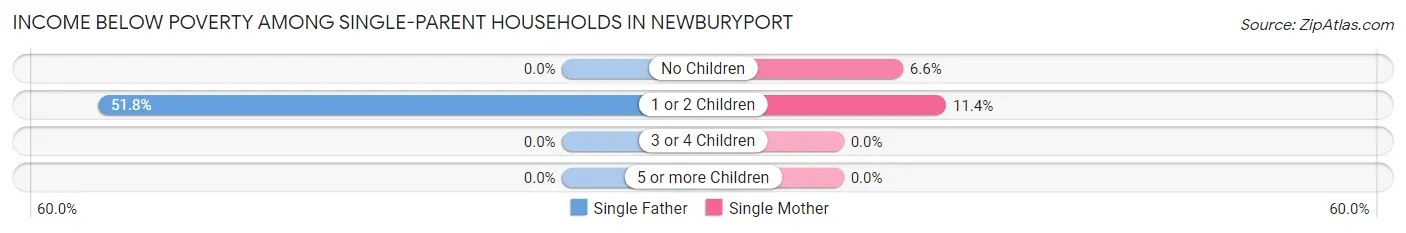
| Children | Single Father | Single Mother |
| No Children | 0 (0.0%) | 19 (6.6%) |
| 1 or 2 Children | 29 (51.8%) | 42 (11.4%) |
| 3 or 4 Children | 0 (0.0%) | 0 (0.0%) |
| 5 or more Children | 0 (0.0%) | 0 (0.0%) |
| Total | 29 (27.1%) | 61 (9.1%) |
Income Below Poverty Among Married-Couple vs Single-Parent Households in Newburyport
The poverty data for Newburyport shows that 139 of the married-couple family households (3.3%) and 90 of the single-parent households (11.6%) are living below the poverty level. Within the married-couple family households, those with 1 or 2 children have the highest poverty rate, with 95 households (8.0%) falling below the poverty line. Among the single-parent households, those with 1 or 2 children have the highest poverty rate, with 71 household (16.8%) living below poverty.
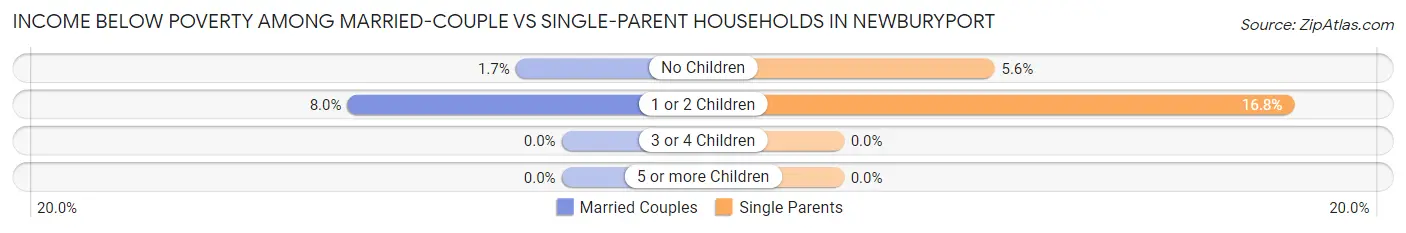
| Children | Married-Couple Families | Single-Parent Households |
| No Children | 44 (1.7%) | 19 (5.6%) |
| 1 or 2 Children | 95 (8.0%) | 71 (16.8%) |
| 3 or 4 Children | 0 (0.0%) | 0 (0.0%) |
| 5 or more Children | 0 (0.0%) | 0 (0.0%) |
| Total | 139 (3.3%) | 90 (11.6%) |
Race in Newburyport
The most populous races in Newburyport are White / Caucasian (17,198 | 93.7%), Two or more Races (727 | 4.0%), and Hispanic or Latino (521 | 2.8%).
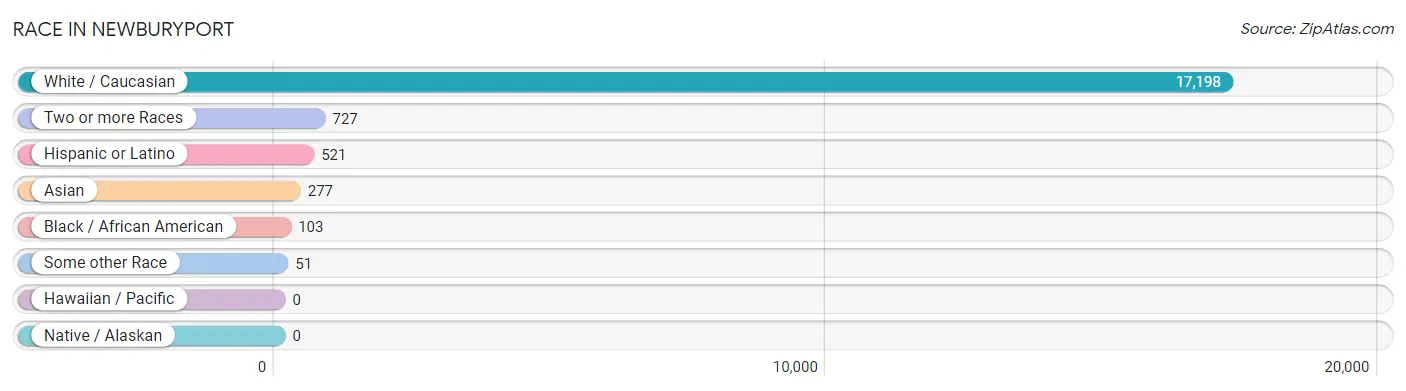
| Race | # Population | % Population |
| Asian | 277 | 1.5% |
| Black / African American | 103 | 0.6% |
| Hawaiian / Pacific | 0 | 0.0% |
| Hispanic or Latino | 521 | 2.8% |
| Native / Alaskan | 0 | 0.0% |
| White / Caucasian | 17,198 | 93.7% |
| Two or more Races | 727 | 4.0% |
| Some other Race | 51 | 0.3% |
| Total | 18,356 | 100.0% |
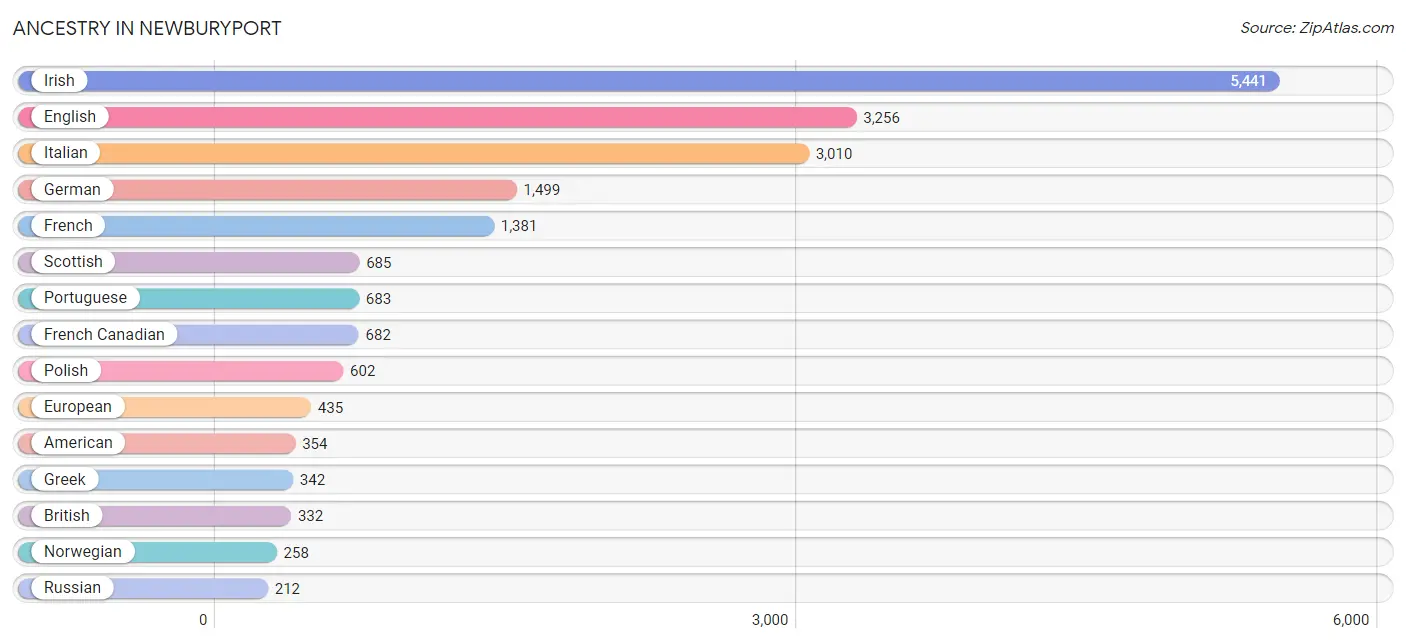
Ancestry in Newburyport
The most populous ancestries reported in Newburyport are Irish (5,441 | 29.6%), English (3,256 | 17.7%), Italian (3,010 | 16.4%), German (1,499 | 8.2%), and French (1,381 | 7.5%), together accounting for 79.5% of all Newburyport residents.
| Ancestry | # Population | % Population |
| American | 354 | 1.9% |
| Arab | 95 | 0.5% |
| Argentinean | 6 | 0.0% |
| Armenian | 161 | 0.9% |
| Austrian | 54 | 0.3% |
| Bhutanese | 59 | 0.3% |
| Blackfeet | 7 | 0.0% |
| Brazilian | 95 | 0.5% |
| British | 332 | 1.8% |
| Burmese | 37 | 0.2% |
| Cajun | 3 | 0.0% |
| Canadian | 164 | 0.9% |
| Cape Verdean | 41 | 0.2% |
| Central American | 59 | 0.3% |
| Colombian | 21 | 0.1% |
| Cuban | 38 | 0.2% |
| Czech | 13 | 0.1% |
| Danish | 80 | 0.4% |
| Dominican | 34 | 0.2% |
| Dutch | 45 | 0.3% |
| Eastern European | 61 | 0.3% |
| Ecuadorian | 142 | 0.8% |
| English | 3,256 | 17.7% |
| European | 435 | 2.4% |
| Finnish | 19 | 0.1% |
| French | 1,381 | 7.5% |
| French American Indian | 8 | 0.0% |
| French Canadian | 682 | 3.7% |
| German | 1,499 | 8.2% |
| Greek | 342 | 1.9% |
| Guatemalan | 21 | 0.1% |
| Honduran | 38 | 0.2% |
| Hungarian | 14 | 0.1% |
| Indian (Asian) | 7 | 0.0% |
| Irish | 5,441 | 29.6% |
| Italian | 3,010 | 16.4% |
| Jamaican | 11 | 0.1% |
| Kenyan | 56 | 0.3% |
| Korean | 18 | 0.1% |
| Laotian | 5 | 0.0% |
| Latvian | 5 | 0.0% |
| Lebanese | 89 | 0.5% |
| Lithuanian | 175 | 0.9% |
| Malaysian | 7 | 0.0% |
| Mexican | 31 | 0.2% |
| New Zealander | 47 | 0.3% |
| Northern European | 27 | 0.2% |
| Norwegian | 258 | 1.4% |
| Polish | 602 | 3.3% |
| Portuguese | 683 | 3.7% |
| Puerto Rican | 164 | 0.9% |
| Romanian | 55 | 0.3% |
| Russian | 212 | 1.1% |
| Scandinavian | 23 | 0.1% |
| Scotch-Irish | 161 | 0.9% |
| Scottish | 685 | 3.7% |
| Serbian | 18 | 0.1% |
| Slavic | 47 | 0.3% |
| Slovak | 12 | 0.1% |
| Slovene | 19 | 0.1% |
| South American | 169 | 0.9% |
| Spaniard | 17 | 0.1% |
| Sri Lankan | 10 | 0.1% |
| Subsaharan African | 116 | 0.6% |
| Swedish | 199 | 1.1% |
| Swiss | 163 | 0.9% |
| Thai | 89 | 0.5% |
| Ukrainian | 23 | 0.1% |
| Welsh | 111 | 0.6% | View All 69 Rows |
Immigrants in Newburyport
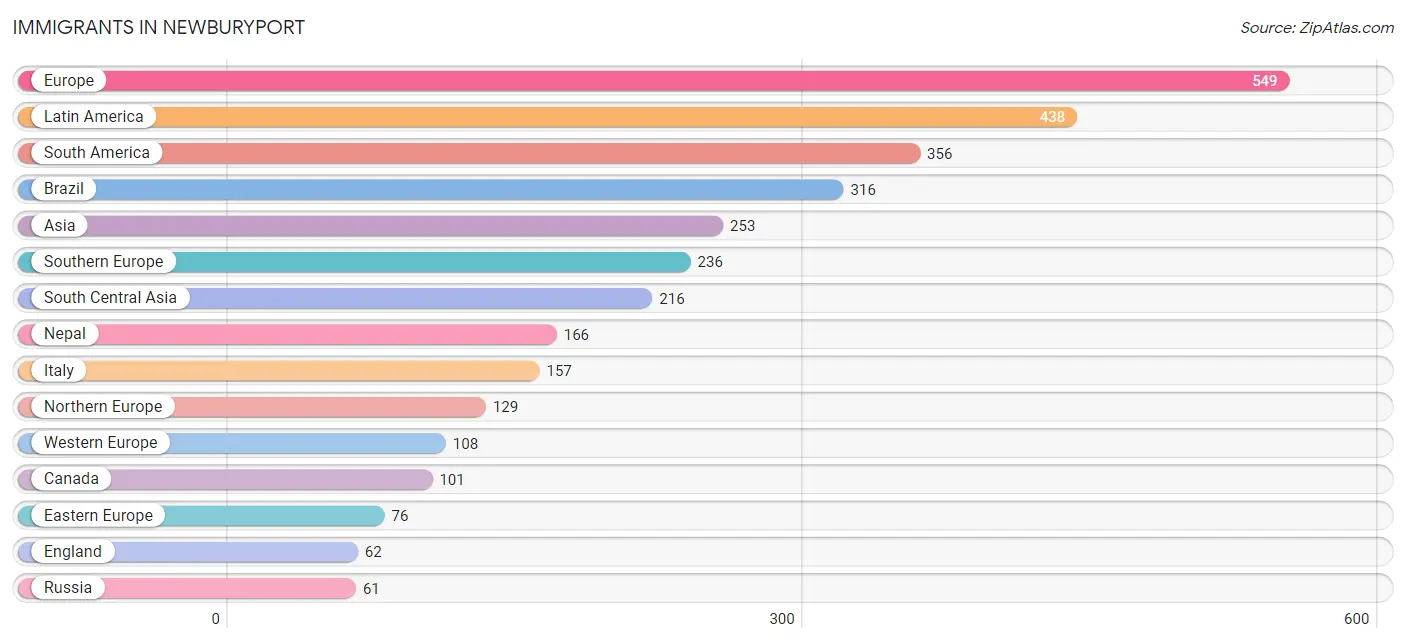
The most numerous immigrant groups reported in Newburyport came from Europe (549 | 3.0%), Latin America (438 | 2.4%), South America (356 | 1.9%), Brazil (316 | 1.7%), and Asia (253 | 1.4%), together accounting for 10.4% of all Newburyport residents.
| Immigration Origin | # Population | % Population |
| Africa | 48 | 0.3% |
| Argentina | 6 | 0.0% |
| Asia | 253 | 1.4% |
| Brazil | 316 | 1.7% |
| Canada | 101 | 0.5% |
| Caribbean | 43 | 0.2% |
| Central America | 39 | 0.2% |
| Colombia | 16 | 0.1% |
| Cuba | 19 | 0.1% |
| Dominican Republic | 17 | 0.1% |
| Eastern Africa | 19 | 0.1% |
| Eastern Asia | 11 | 0.1% |
| Eastern Europe | 76 | 0.4% |
| Ecuador | 18 | 0.1% |
| England | 62 | 0.3% |
| Europe | 549 | 3.0% |
| France | 38 | 0.2% |
| Germany | 59 | 0.3% |
| Greece | 52 | 0.3% |
| Guatemala | 21 | 0.1% |
| Haiti | 4 | 0.0% |
| Honduras | 18 | 0.1% |
| India | 50 | 0.3% |
| Ireland | 22 | 0.1% |
| Italy | 157 | 0.9% |
| Jamaica | 3 | 0.0% |
| Korea | 11 | 0.1% |
| Laos | 2 | 0.0% |
| Latin America | 438 | 2.4% |
| Lebanon | 14 | 0.1% |
| Nepal | 166 | 0.9% |
| Netherlands | 11 | 0.1% |
| Northern Europe | 129 | 0.7% |
| Oceania | 16 | 0.1% |
| Poland | 5 | 0.0% |
| Portugal | 10 | 0.1% |
| Russia | 61 | 0.3% |
| South Africa | 29 | 0.2% |
| South America | 356 | 1.9% |
| South Central Asia | 216 | 1.2% |
| South Eastern Asia | 12 | 0.1% |
| Southern Europe | 236 | 1.3% |
| Spain | 17 | 0.1% |
| Sweden | 14 | 0.1% |
| Ukraine | 10 | 0.1% |
| Vietnam | 10 | 0.1% |
| Western Asia | 14 | 0.1% |
| Western Europe | 108 | 0.6% | View All 48 Rows |
Sex and Age in Newburyport
Sex and Age in Newburyport
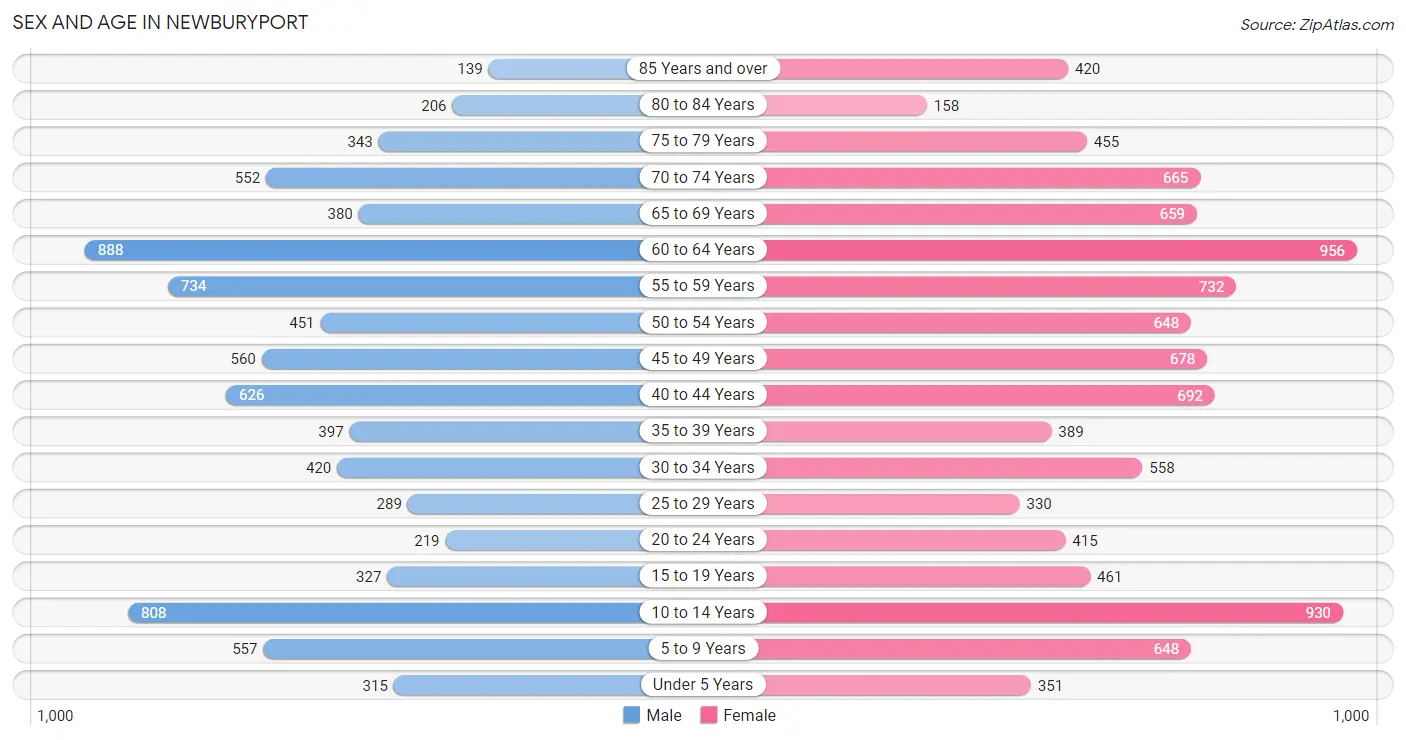
The most populous age groups in Newburyport are 60 to 64 Years (888 | 10.8%) for men and 60 to 64 Years (956 | 9.4%) for women.
| Age Bracket | Male | Female |
| Under 5 Years | 315 (3.8%) | 351 (3.5%) |
| 5 to 9 Years | 557 (6.8%) | 648 (6.4%) |
| 10 to 14 Years | 808 (9.8%) | 930 (9.2%) |
| 15 to 19 Years | 327 (4.0%) | 461 (4.5%) |
| 20 to 24 Years | 219 (2.7%) | 415 (4.1%) |
| 25 to 29 Years | 289 (3.5%) | 330 (3.3%) |
| 30 to 34 Years | 420 (5.1%) | 558 (5.5%) |
| 35 to 39 Years | 397 (4.8%) | 389 (3.8%) |
| 40 to 44 Years | 626 (7.6%) | 692 (6.8%) |
| 45 to 49 Years | 560 (6.8%) | 678 (6.7%) |
| 50 to 54 Years | 451 (5.5%) | 648 (6.4%) |
| 55 to 59 Years | 734 (8.9%) | 732 (7.2%) |
| 60 to 64 Years | 888 (10.8%) | 956 (9.4%) |
| 65 to 69 Years | 380 (4.6%) | 659 (6.5%) |
| 70 to 74 Years | 552 (6.7%) | 665 (6.6%) |
| 75 to 79 Years | 343 (4.2%) | 455 (4.5%) |
| 80 to 84 Years | 206 (2.5%) | 158 (1.6%) |
| 85 Years and over | 139 (1.7%) | 420 (4.1%) |
| Total | 8,211 (100.0%) | 10,145 (100.0%) |
Families and Households in Newburyport
Median Family Size in Newburyport
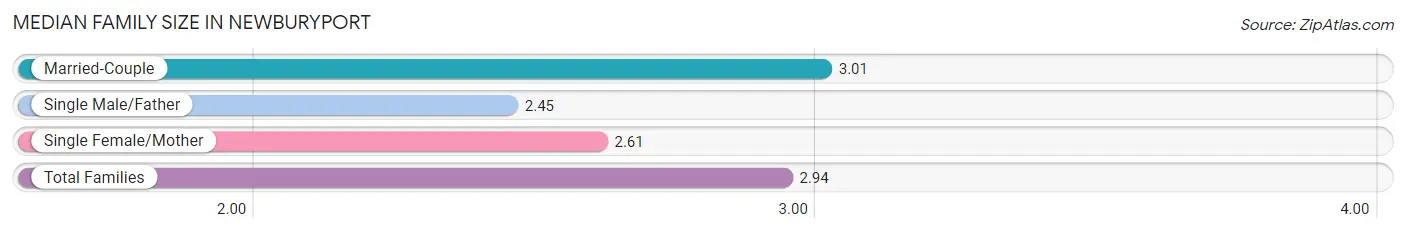
The median family size in Newburyport is 2.94 persons per family, with married-couple families (4,257 | 84.6%) accounting for the largest median family size of 3.01 persons per family. On the other hand, single male/father families (107 | 2.1%) represent the smallest median family size with 2.45 persons per family.
| Family Type | # Families | Family Size |
| Married-Couple | 4,257 (84.6%) | 3.01 |
| Single Male/Father | 107 (2.1%) | 2.45 |
| Single Female/Mother | 671 (13.3%) | 2.61 |
| Total Families | 5,035 (100.0%) | 2.94 |
Median Household Size in Newburyport
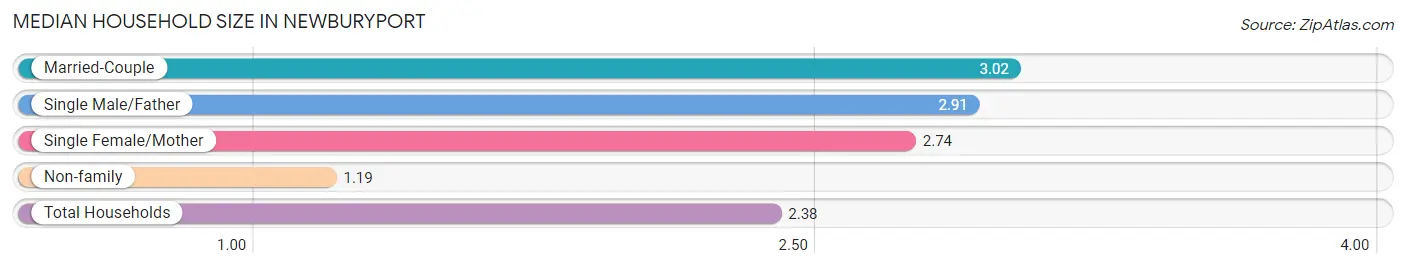
The median household size in Newburyport is 2.38 persons per household, with married-couple households (4,257 | 56.1%) accounting for the largest median household size of 3.02 persons per household. non-family households (2,556 | 33.7%) represent the smallest median household size with 1.19 persons per household.
| Household Type | # Households | Household Size |
| Married-Couple | 4,257 (56.1%) | 3.02 |
| Single Male/Father | 107 (1.4%) | 2.91 |
| Single Female/Mother | 671 (8.8%) | 2.74 |
| Non-family | 2,556 (33.7%) | 1.19 |
| Total Households | 7,591 (100.0%) | 2.38 |
Household Size by Marriage Status in Newburyport
Out of a total of 7,591 households in Newburyport, 5,035 (66.3%) are family households, while 2,556 (33.7%) are nonfamily households. The most numerous type of family households are 2-person households, comprising 2,444, and the most common type of nonfamily households are 1-person households, comprising 2,105.
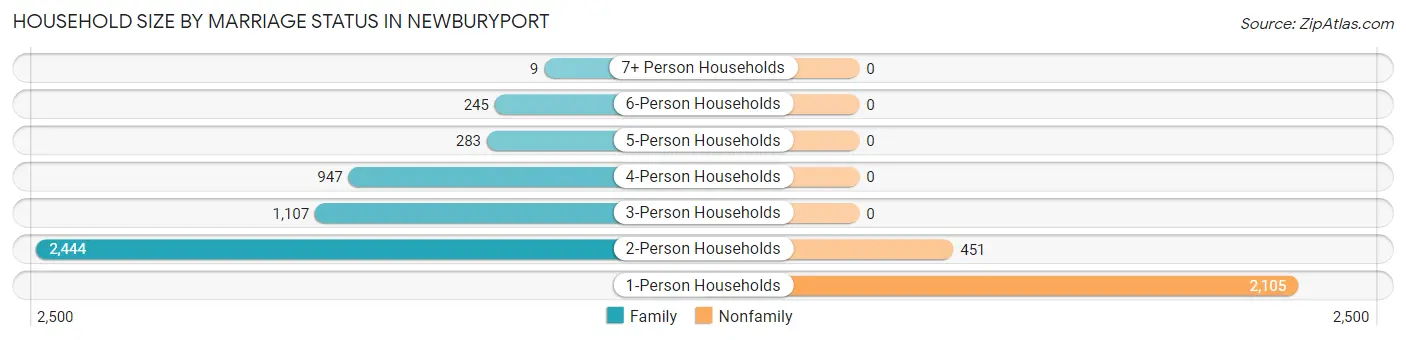
| Household Size | Family Households | Nonfamily Households |
| 1-Person Households | - | 2,105 (27.7%) |
| 2-Person Households | 2,444 (32.2%) | 451 (5.9%) |
| 3-Person Households | 1,107 (14.6%) | 0 (0.0%) |
| 4-Person Households | 947 (12.5%) | 0 (0.0%) |
| 5-Person Households | 283 (3.7%) | 0 (0.0%) |
| 6-Person Households | 245 (3.2%) | 0 (0.0%) |
| 7+ Person Households | 9 (0.1%) | 0 (0.0%) |
| Total | 5,035 (66.3%) | 2,556 (33.7%) |
Female Fertility in Newburyport
Fertility by Age in Newburyport
Average fertility rate in Newburyport is 30.0 births per 1,000 women. Women in the age bracket of 20 to 34 years have the highest fertility rate with 58.0 births per 1,000 women. Women in the age bracket of 20 to 34 years acount for 65.8% of all women with births.
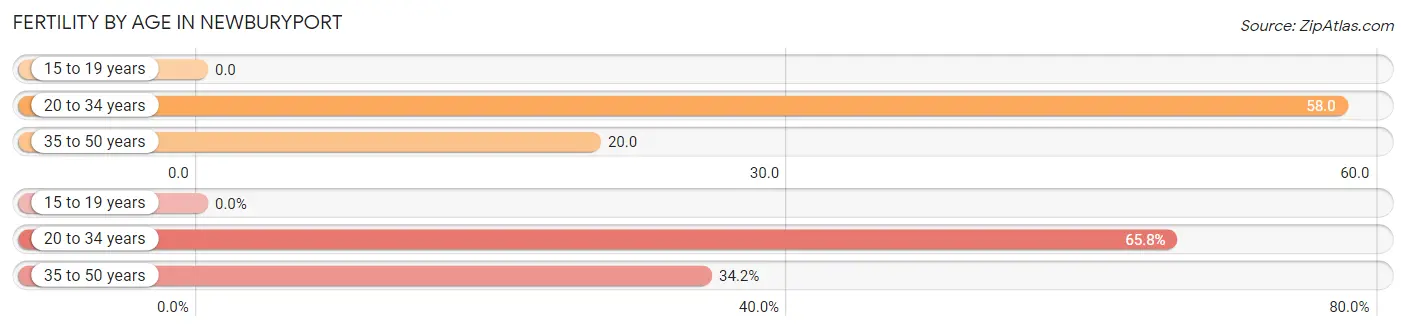
| Age Bracket | Women with Births | Births / 1,000 Women |
| 15 to 19 years | 0 (0.0%) | 0.0 |
| 20 to 34 years | 75 (65.8%) | 58.0 |
| 35 to 50 years | 39 (34.2%) | 20.0 |
| Total | 114 (100.0%) | 30.0 |
Fertility by Age by Marriage Status in Newburyport
97.4% of women with births (114) in Newburyport are married. The highest percentage of unmarried women with births falls into 20 to 34 years age bracket with 4.0% of them unmarried at the time of birth, while the lowest percentage of unmarried women with births belong to 35 to 50 years age bracket with 0.0% of them unmarried.
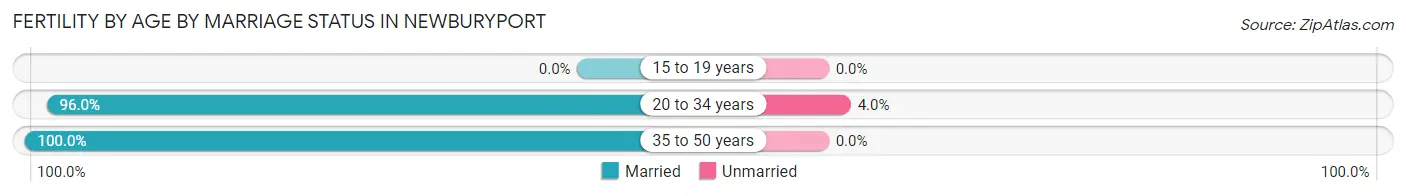
| Age Bracket | Married | Unmarried |
| 15 to 19 years | 0 (0.0%) | 0 (0.0%) |
| 20 to 34 years | 72 (96.0%) | 3 (4.0%) |
| 35 to 50 years | 39 (100.0%) | 0 (0.0%) |
| Total | 111 (97.4%) | 3 (2.6%) |
Fertility by Education in Newburyport
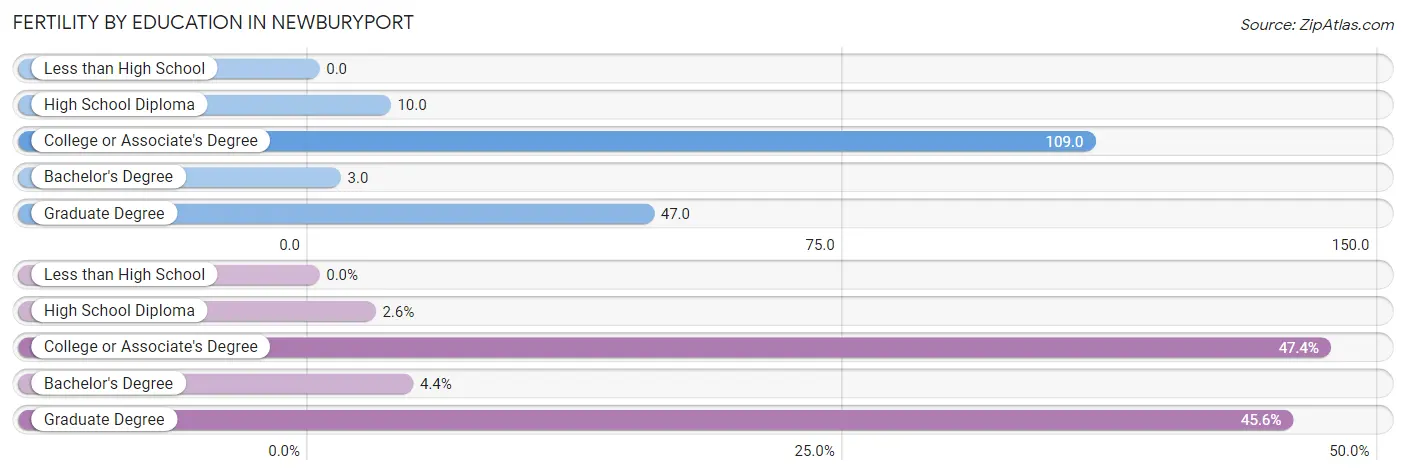
| Educational Attainment | Women with Births | Births / 1,000 Women |
| Less than High School | 0 (0.0%) | 0.0 |
| High School Diploma | 3 (2.6%) | 10.0 |
| College or Associate's Degree | 54 (47.4%) | 109.0 |
| Bachelor's Degree | 5 (4.4%) | 3.0 |
| Graduate Degree | 52 (45.6%) | 47.0 |
| Total | 114 (100.0%) | 30.0 |
Fertility by Education by Marriage Status in Newburyport
2.6% of women with births in Newburyport are unmarried. Women with the educational attainment of college or associate's degree are most likely to be married with 100.0% of them married at childbirth, while women with the educational attainment of high school diploma are least likely to be married with 100.0% of them unmarried at childbirth.
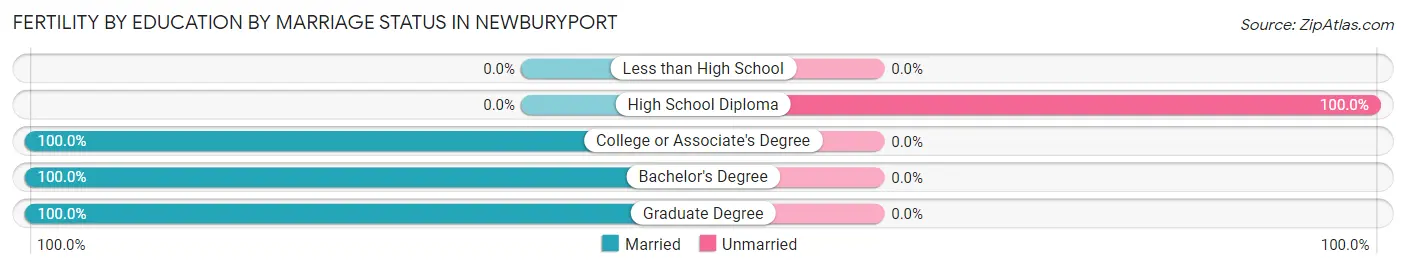
| Educational Attainment | Married | Unmarried |
| Less than High School | 0 (0.0%) | 0 (0.0%) |
| High School Diploma | 0 (0.0%) | 3 (100.0%) |
| College or Associate's Degree | 54 (100.0%) | 0 (0.0%) |
| Bachelor's Degree | 5 (100.0%) | 0 (0.0%) |
| Graduate Degree | 52 (100.0%) | 0 (0.0%) |
| Total | 111 (97.4%) | 3 (2.6%) |
Employment Characteristics in Newburyport
Employment by Class of Employer in Newburyport
Among the 9,303 employed individuals in Newburyport, private company employees (5,726 | 61.6%), not-for-profit organizations (1,029 | 11.1%), and self-employed (not incorporated) (998 | 10.7%) make up the most common classes of employment.
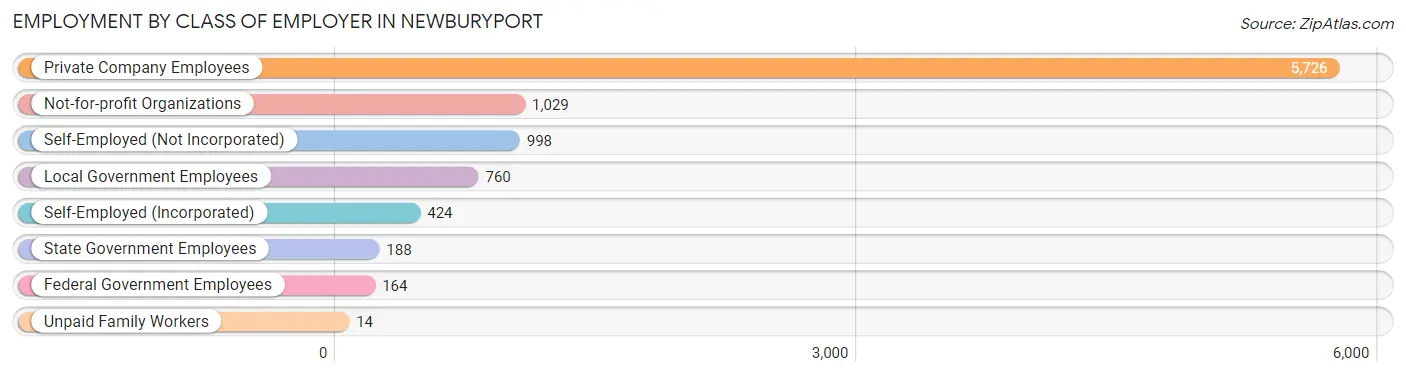
| Employer Class | # Employees | % Employees |
| Private Company Employees | 5,726 | 61.6% |
| Self-Employed (Incorporated) | 424 | 4.6% |
| Self-Employed (Not Incorporated) | 998 | 10.7% |
| Not-for-profit Organizations | 1,029 | 11.1% |
| Local Government Employees | 760 | 8.2% |
| State Government Employees | 188 | 2.0% |
| Federal Government Employees | 164 | 1.8% |
| Unpaid Family Workers | 14 | 0.2% |
| Total | 9,303 | 100.0% |
Employment Status by Age in Newburyport
According to the labor force statistics for Newburyport, out of the total population over 16 years of age (14,549), 68.9% or 10,024 individuals are in the labor force, with 5.7% or 571 of them unemployed. The age group with the highest labor force participation rate is 25 to 29 years, with 96.1% or 595 individuals in the labor force. Within the labor force, the 20 to 24 years age range has the highest percentage of unemployed individuals, with 18.8% or 109 of them being unemployed.
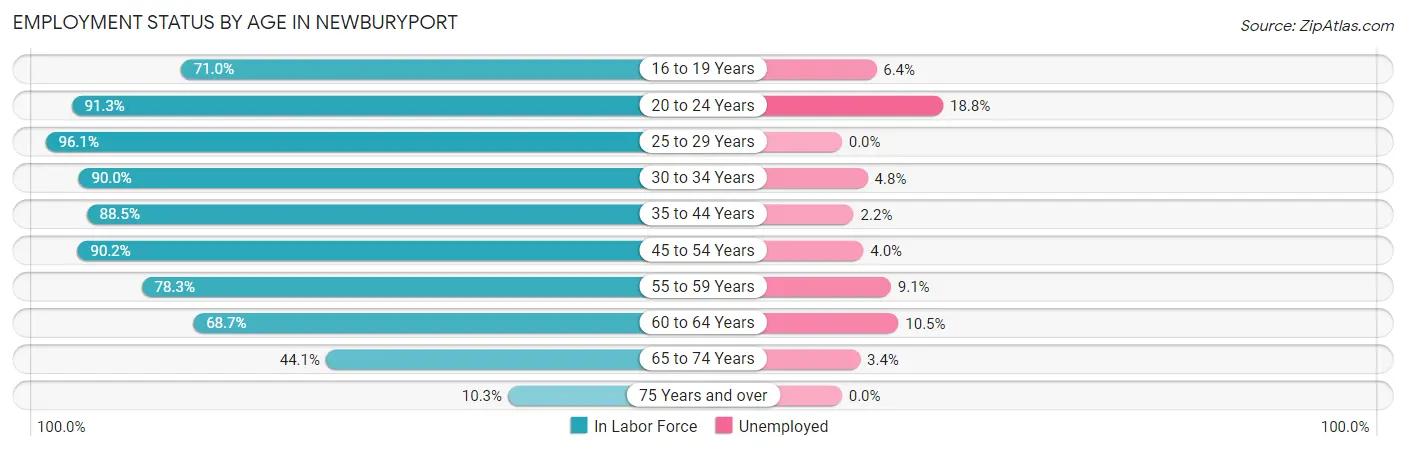
| Age Bracket | In Labor Force | Unemployed |
| 16 to 19 Years | 419 (71.0%) | 27 (6.4%) |
| 20 to 24 Years | 579 (91.3%) | 109 (18.8%) |
| 25 to 29 Years | 595 (96.1%) | 0 (0.0%) |
| 30 to 34 Years | 880 (90.0%) | 42 (4.8%) |
| 35 to 44 Years | 1,862 (88.5%) | 41 (2.2%) |
| 45 to 54 Years | 2,108 (90.2%) | 84 (4.0%) |
| 55 to 59 Years | 1,148 (78.3%) | 104 (9.1%) |
| 60 to 64 Years | 1,267 (68.7%) | 133 (10.5%) |
| 65 to 74 Years | 995 (44.1%) | 34 (3.4%) |
| 75 Years and over | 177 (10.3%) | 0 (0.0%) |
| Total | 10,024 (68.9%) | 571 (5.7%) |
Employment Status by Educational Attainment in Newburyport
According to labor force statistics for Newburyport, 84.1% of individuals (7,862) out of the total population between 25 and 64 years of age (9,348) are in the labor force, with 5.2% or 409 of them being unemployed. The group with the highest labor force participation rate are those with the educational attainment of bachelor's degree or higher, with 88.4% or 5,625 individuals in the labor force. Within the labor force, individuals with high school diploma education have the highest percentage of unemployment, with 7.6% or 62 of them being unemployed.
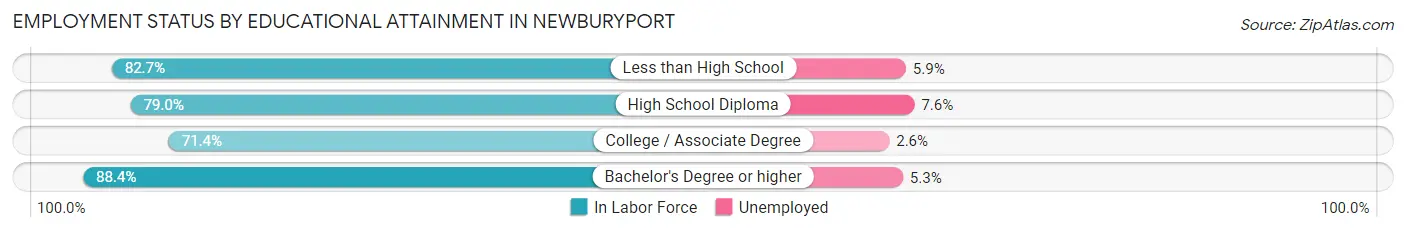
| Educational Attainment | In Labor Force | Unemployed |
| Less than High School | 187 (82.7%) | 13 (5.9%) |
| High School Diploma | 814 (79.0%) | 78 (7.6%) |
| College / Associate Degree | 1,235 (71.4%) | 45 (2.6%) |
| Bachelor's Degree or higher | 5,625 (88.4%) | 337 (5.3%) |
| Total | 7,862 (84.1%) | 486 (5.2%) |
Employment Occupations by Sex in Newburyport
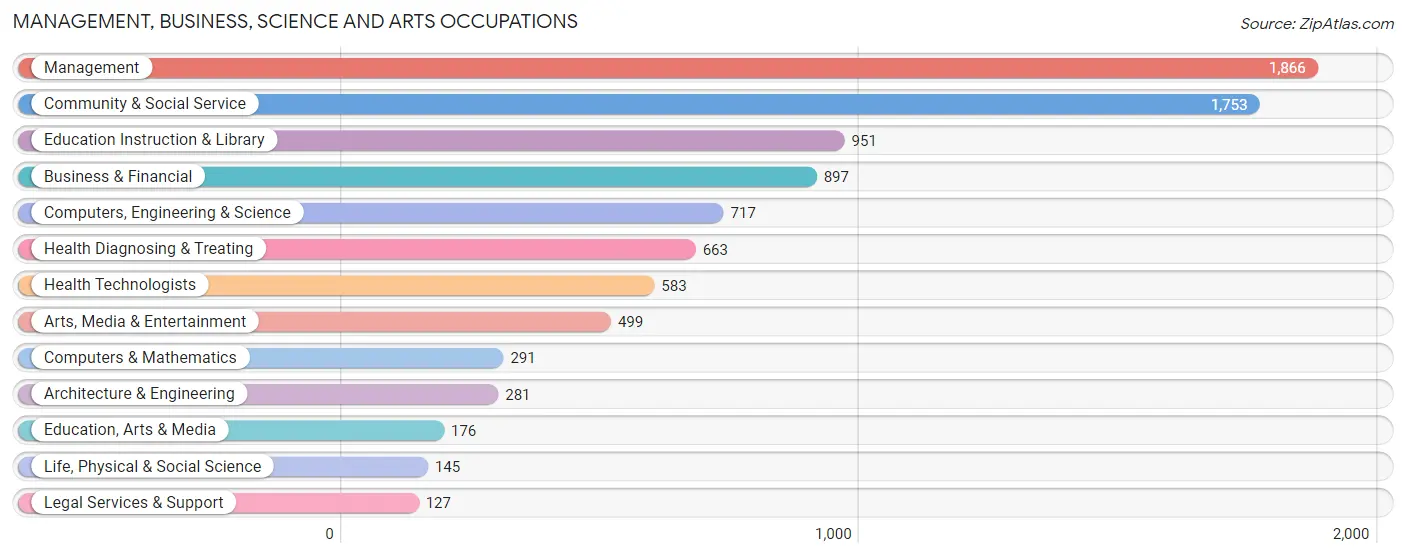
Management, Business, Science and Arts Occupations
The most common Management, Business, Science and Arts occupations in Newburyport are Management (1,866 | 19.7%), Community & Social Service (1,753 | 18.5%), Education Instruction & Library (951 | 10.1%), Business & Financial (897 | 9.5%), and Computers, Engineering & Science (717 | 7.6%).
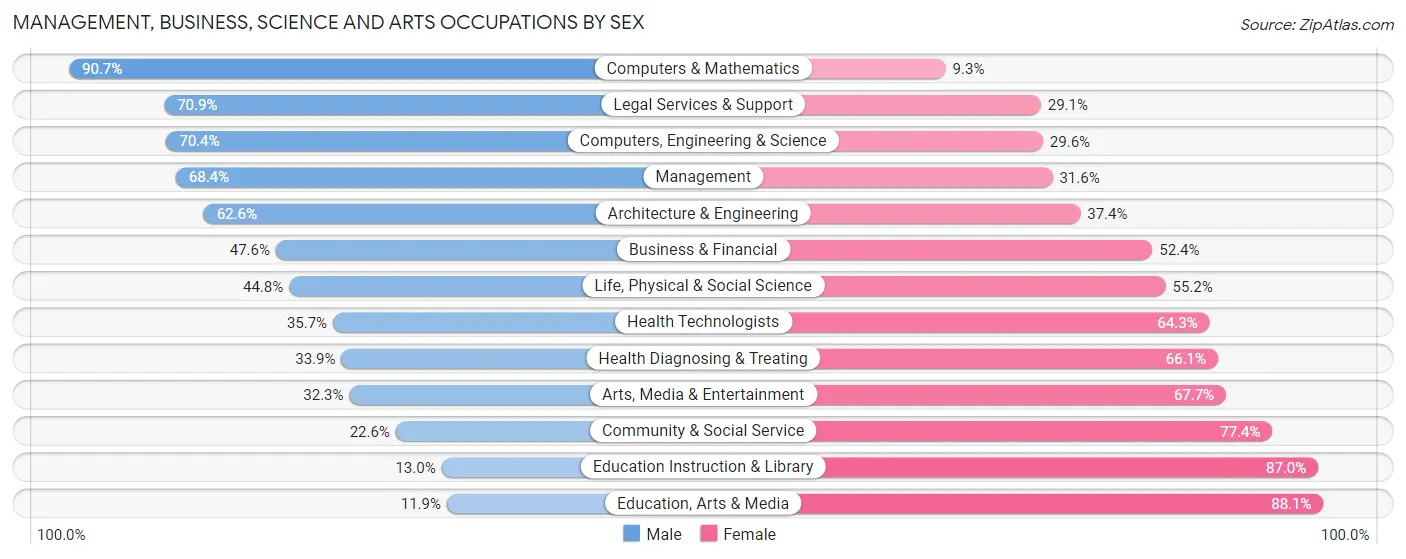
Management, Business, Science and Arts Occupations by Sex
Within the Management, Business, Science and Arts occupations in Newburyport, the most male-oriented occupations are Computers & Mathematics (90.7%), Legal Services & Support (70.9%), and Computers, Engineering & Science (70.4%), while the most female-oriented occupations are Education, Arts & Media (88.1%), Education Instruction & Library (87.0%), and Community & Social Service (77.4%).
| Occupation | Male | Female |
| Management | 1,277 (68.4%) | 589 (31.6%) |
| Business & Financial | 427 (47.6%) | 470 (52.4%) |
| Computers, Engineering & Science | 505 (70.4%) | 212 (29.6%) |
| Computers & Mathematics | 264 (90.7%) | 27 (9.3%) |
| Architecture & Engineering | 176 (62.6%) | 105 (37.4%) |
| Life, Physical & Social Science | 65 (44.8%) | 80 (55.2%) |
| Community & Social Service | 396 (22.6%) | 1,357 (77.4%) |
| Education, Arts & Media | 21 (11.9%) | 155 (88.1%) |
| Legal Services & Support | 90 (70.9%) | 37 (29.1%) |
| Education Instruction & Library | 124 (13.0%) | 827 (87.0%) |
| Arts, Media & Entertainment | 161 (32.3%) | 338 (67.7%) |
| Health Diagnosing & Treating | 225 (33.9%) | 438 (66.1%) |
| Health Technologists | 208 (35.7%) | 375 (64.3%) |
| Total (Category) | 2,830 (48.0%) | 3,066 (52.0%) |
| Total (Overall) | 4,626 (48.9%) | 4,828 (51.1%) |
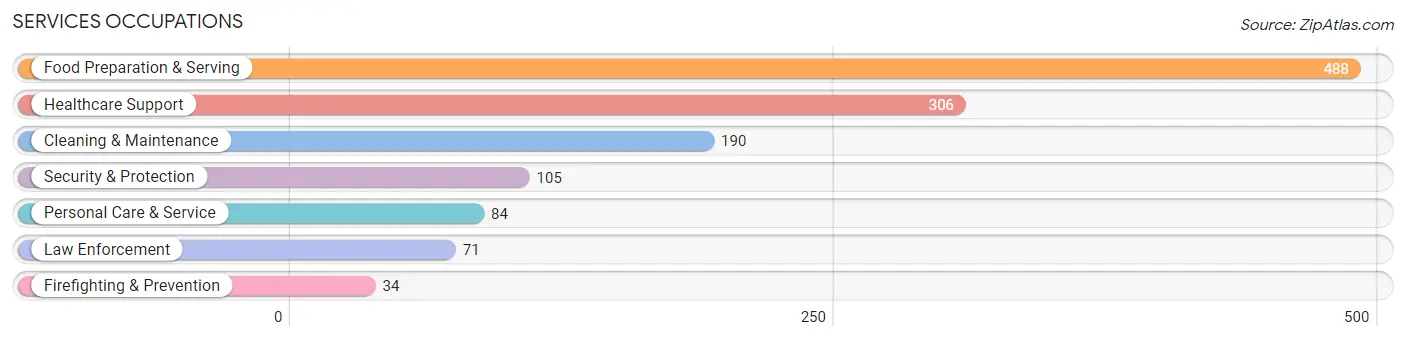
Services Occupations
The most common Services occupations in Newburyport are Food Preparation & Serving (488 | 5.2%), Healthcare Support (306 | 3.2%), Cleaning & Maintenance (190 | 2.0%), Security & Protection (105 | 1.1%), and Personal Care & Service (84 | 0.9%).
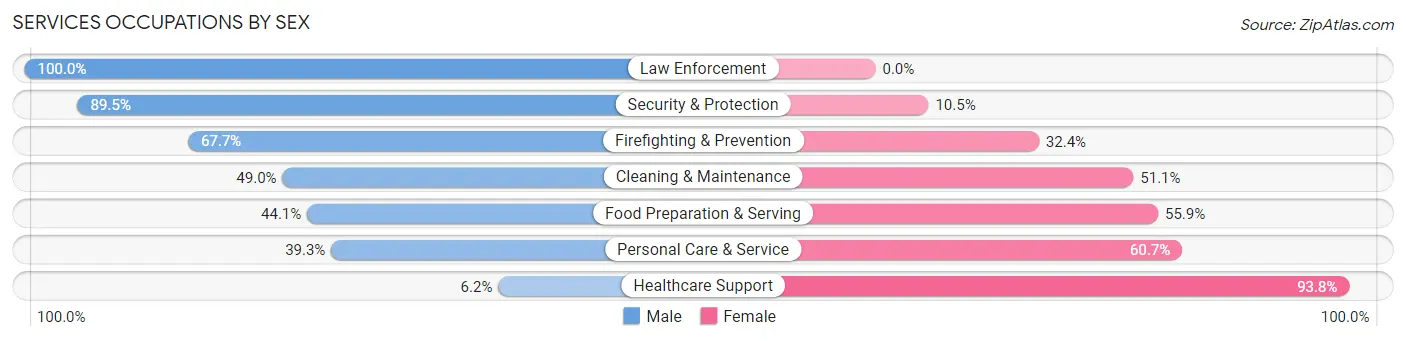
Services Occupations by Sex
Within the Services occupations in Newburyport, the most male-oriented occupations are Law Enforcement (100.0%), Security & Protection (89.5%), and Firefighting & Prevention (67.6%), while the most female-oriented occupations are Healthcare Support (93.8%), Personal Care & Service (60.7%), and Food Preparation & Serving (55.9%).
| Occupation | Male | Female |
| Healthcare Support | 19 (6.2%) | 287 (93.8%) |
| Security & Protection | 94 (89.5%) | 11 (10.5%) |
| Firefighting & Prevention | 23 (67.6%) | 11 (32.4%) |
| Law Enforcement | 71 (100.0%) | 0 (0.0%) |
| Food Preparation & Serving | 215 (44.1%) | 273 (55.9%) |
| Cleaning & Maintenance | 93 (48.9%) | 97 (51.0%) |
| Personal Care & Service | 33 (39.3%) | 51 (60.7%) |
| Total (Category) | 454 (38.7%) | 719 (61.3%) |
| Total (Overall) | 4,626 (48.9%) | 4,828 (51.1%) |
Sales and Office Occupations
The most common Sales and Office occupations in Newburyport are Sales & Related (944 | 10.0%), and Office & Administration (611 | 6.5%).
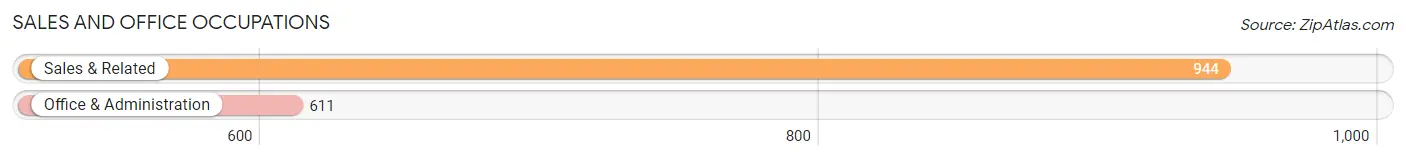
Sales and Office Occupations by Sex
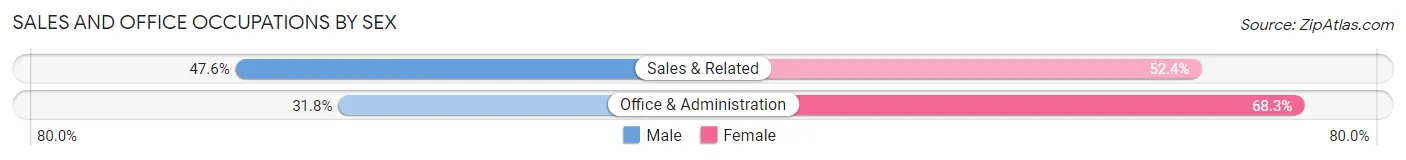
| Occupation | Male | Female |
| Sales & Related | 449 (47.6%) | 495 (52.4%) |
| Office & Administration | 194 (31.8%) | 417 (68.2%) |
| Total (Category) | 643 (41.3%) | 912 (58.7%) |
| Total (Overall) | 4,626 (48.9%) | 4,828 (51.1%) |
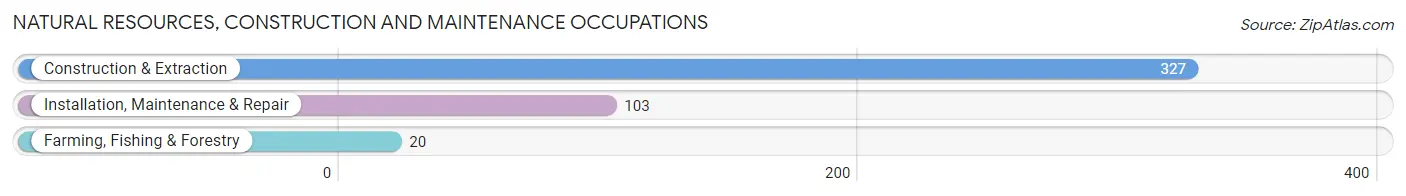
Natural Resources, Construction and Maintenance Occupations
The most common Natural Resources, Construction and Maintenance occupations in Newburyport are Construction & Extraction (327 | 3.5%), Installation, Maintenance & Repair (103 | 1.1%), and Farming, Fishing & Forestry (20 | 0.2%).
Natural Resources, Construction and Maintenance Occupations by Sex
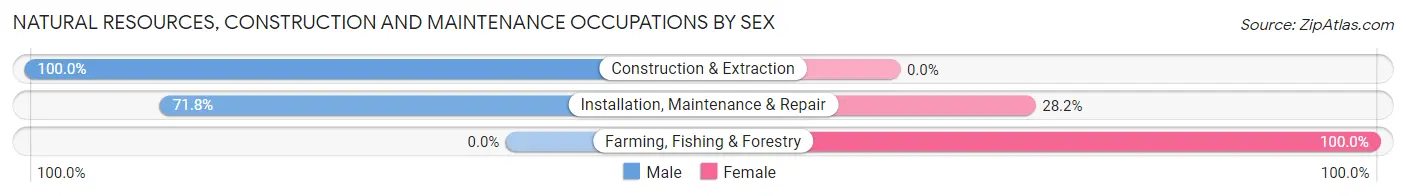
| Occupation | Male | Female |
| Farming, Fishing & Forestry | 0 (0.0%) | 20 (100.0%) |
| Construction & Extraction | 327 (100.0%) | 0 (0.0%) |
| Installation, Maintenance & Repair | 74 (71.8%) | 29 (28.2%) |
| Total (Category) | 401 (89.1%) | 49 (10.9%) |
| Total (Overall) | 4,626 (48.9%) | 4,828 (51.1%) |
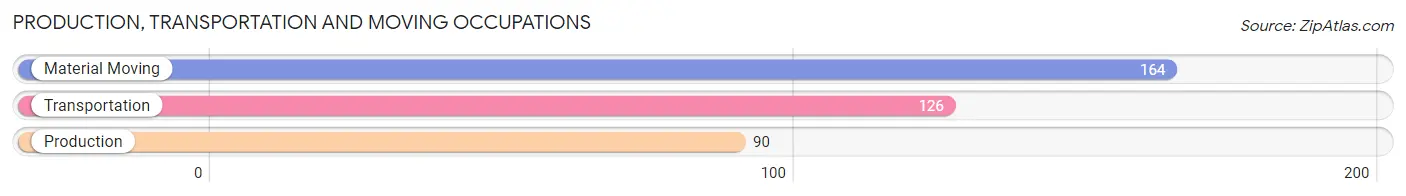
Production, Transportation and Moving Occupations
The most common Production, Transportation and Moving occupations in Newburyport are Material Moving (164 | 1.7%), Transportation (126 | 1.3%), and Production (90 | 0.9%).
Production, Transportation and Moving Occupations by Sex
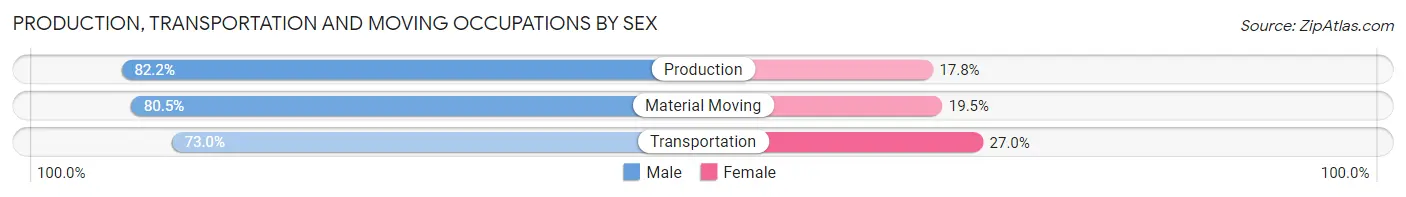
| Occupation | Male | Female |
| Production | 74 (82.2%) | 16 (17.8%) |
| Transportation | 92 (73.0%) | 34 (27.0%) |
| Material Moving | 132 (80.5%) | 32 (19.5%) |
| Total (Category) | 298 (78.4%) | 82 (21.6%) |
| Total (Overall) | 4,626 (48.9%) | 4,828 (51.1%) |
Employment Industries by Sex in Newburyport
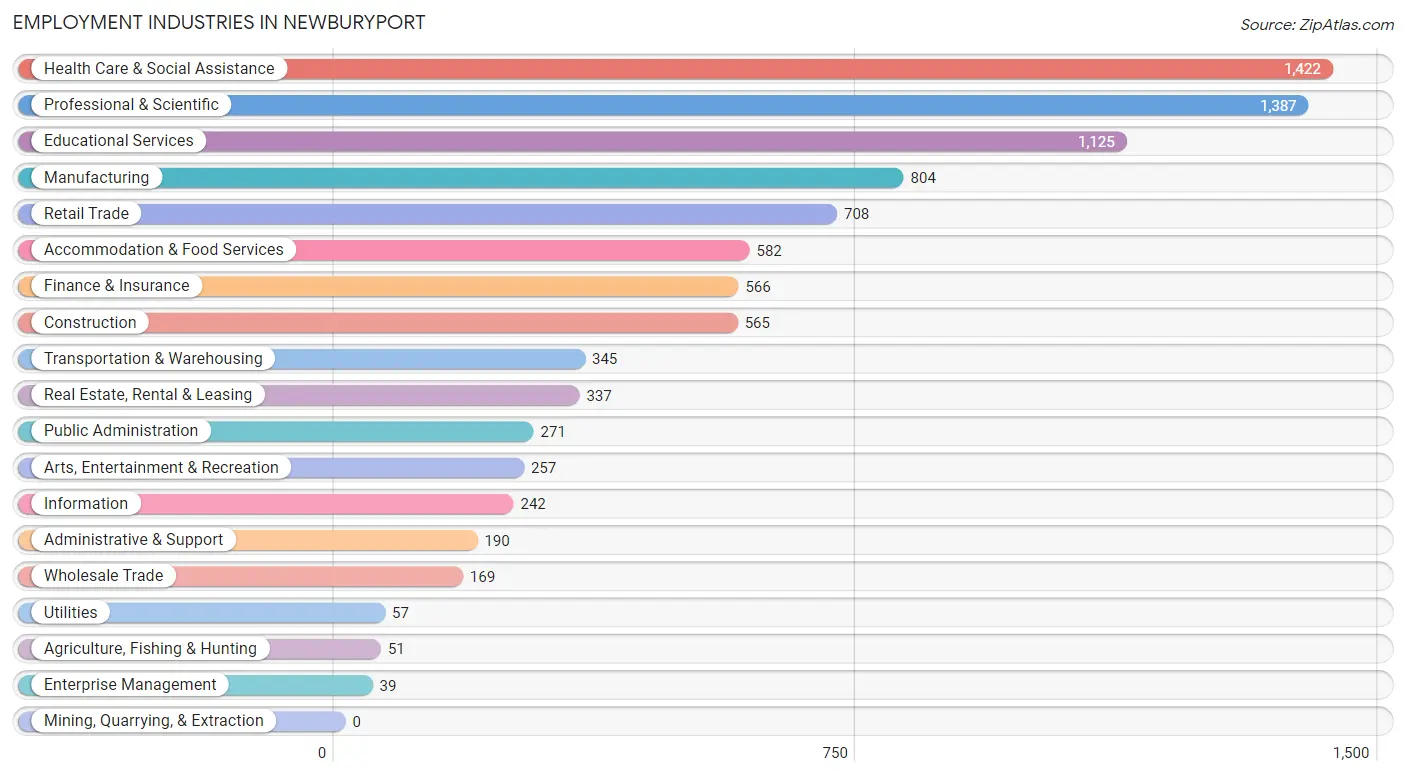
Employment Industries in Newburyport
The major employment industries in Newburyport include Health Care & Social Assistance (1,422 | 15.0%), Professional & Scientific (1,387 | 14.7%), Educational Services (1,125 | 11.9%), Manufacturing (804 | 8.5%), and Retail Trade (708 | 7.5%).
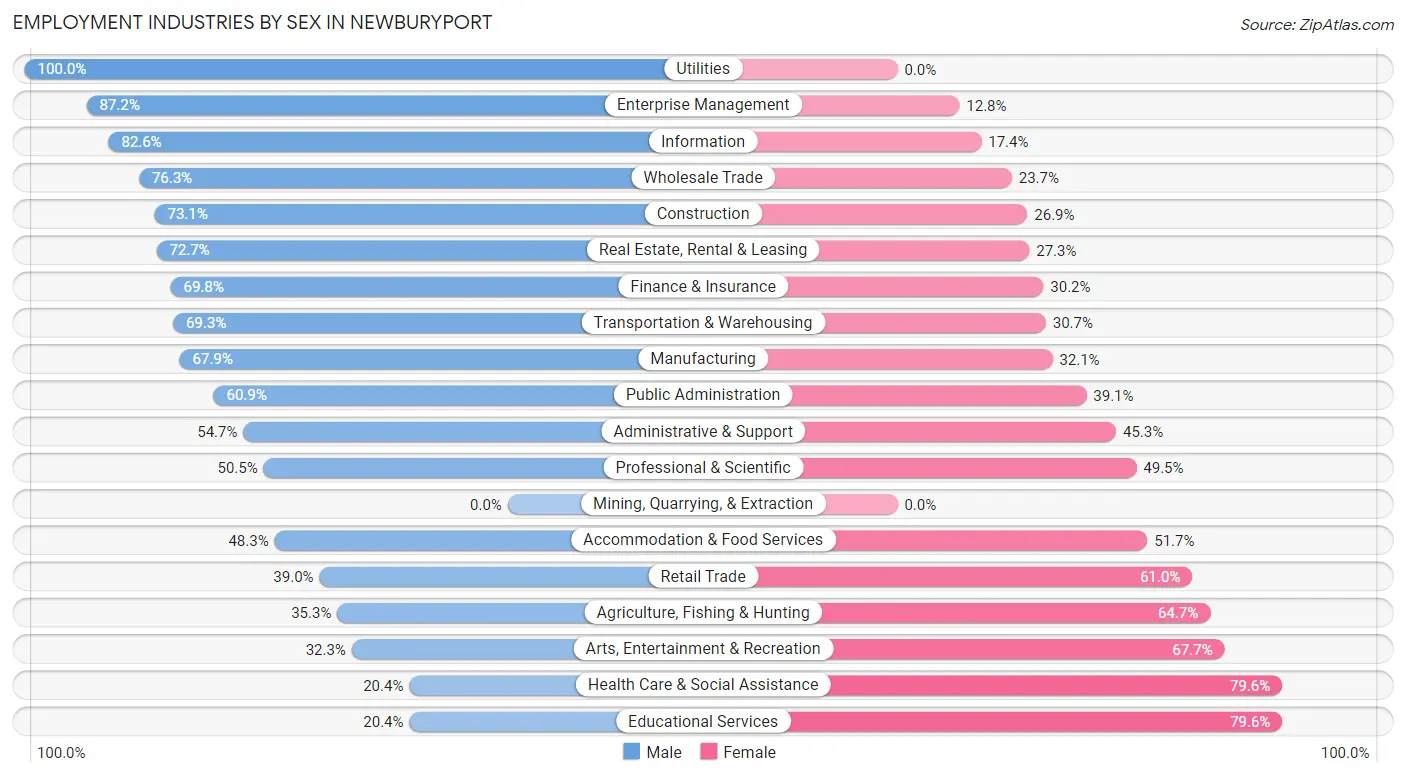
Employment Industries by Sex in Newburyport
The Newburyport industries that see more men than women are Utilities (100.0%), Enterprise Management (87.2%), and Information (82.6%), whereas the industries that tend to have a higher number of women are Educational Services (79.6%), Health Care & Social Assistance (79.6%), and Arts, Entertainment & Recreation (67.7%).
| Industry | Male | Female |
| Agriculture, Fishing & Hunting | 18 (35.3%) | 33 (64.7%) |
| Mining, Quarrying, & Extraction | 0 (0.0%) | 0 (0.0%) |
| Construction | 413 (73.1%) | 152 (26.9%) |
| Manufacturing | 546 (67.9%) | 258 (32.1%) |
| Wholesale Trade | 129 (76.3%) | 40 (23.7%) |
| Retail Trade | 276 (39.0%) | 432 (61.0%) |
| Transportation & Warehousing | 239 (69.3%) | 106 (30.7%) |
| Utilities | 57 (100.0%) | 0 (0.0%) |
| Information | 200 (82.6%) | 42 (17.4%) |
| Finance & Insurance | 395 (69.8%) | 171 (30.2%) |
| Real Estate, Rental & Leasing | 245 (72.7%) | 92 (27.3%) |
| Professional & Scientific | 701 (50.5%) | 686 (49.5%) |
| Enterprise Management | 34 (87.2%) | 5 (12.8%) |
| Administrative & Support | 104 (54.7%) | 86 (45.3%) |
| Educational Services | 229 (20.4%) | 896 (79.6%) |
| Health Care & Social Assistance | 290 (20.4%) | 1,132 (79.6%) |
| Arts, Entertainment & Recreation | 83 (32.3%) | 174 (67.7%) |
| Accommodation & Food Services | 281 (48.3%) | 301 (51.7%) |
| Public Administration | 165 (60.9%) | 106 (39.1%) |
| Total | 4,626 (48.9%) | 4,828 (51.1%) |
Education in Newburyport
School Enrollment in Newburyport
The most common levels of schooling among the 4,308 students in Newburyport are middle school (1,380 | 32.0%), elementary school (1,067 | 24.8%), and high school (666 | 15.5%).
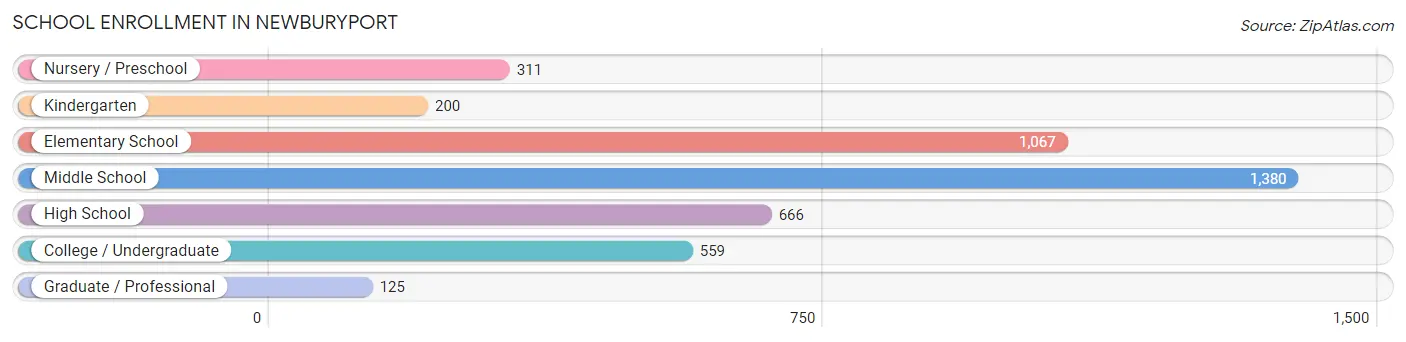
| School Level | # Students | % Students |
| Nursery / Preschool | 311 | 7.2% |
| Kindergarten | 200 | 4.6% |
| Elementary School | 1,067 | 24.8% |
| Middle School | 1,380 | 32.0% |
| High School | 666 | 15.5% |
| College / Undergraduate | 559 | 13.0% |
| Graduate / Professional | 125 | 2.9% |
| Total | 4,308 | 100.0% |
School Enrollment by Age by Funding Source in Newburyport
Out of a total of 4,308 students who are enrolled in schools in Newburyport, 883 (20.5%) attend a private institution, while the remaining 3,425 (79.5%) are enrolled in public schools. The age group of 20 to 24 year olds has the highest likelihood of being enrolled in private schools, with 141 (57.8% in the age bracket) enrolled. Conversely, the age group of 5 to 9 year old has the lowest likelihood of being enrolled in a private school, with 1,083 (90.5% in the age bracket) attending a public institution.
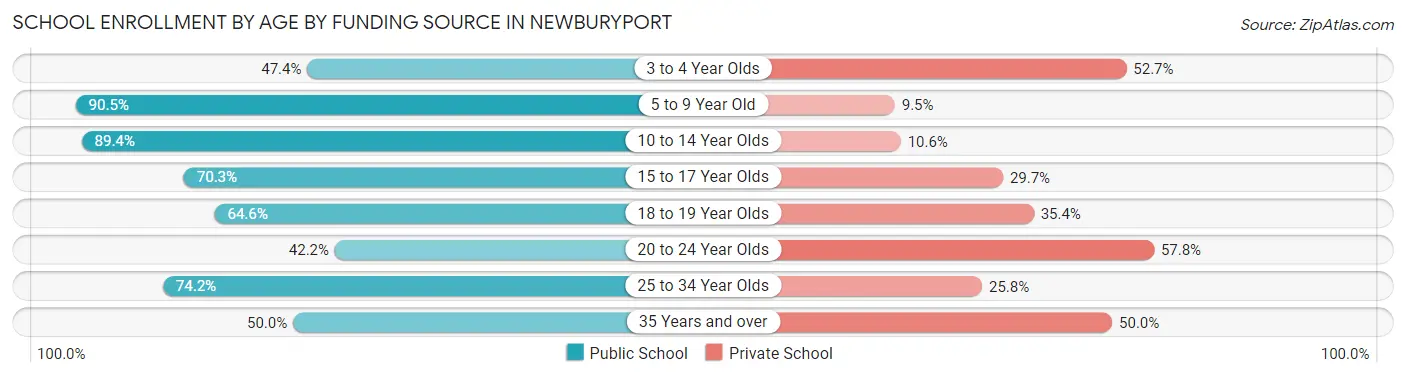
| Age Bracket | Public School | Private School |
| 3 to 4 Year Olds | 107 (47.3%) | 119 (52.6%) |
| 5 to 9 Year Old | 1,083 (90.5%) | 114 (9.5%) |
| 10 to 14 Year Olds | 1,489 (89.4%) | 177 (10.6%) |
| 15 to 17 Year Olds | 294 (70.3%) | 124 (29.7%) |
| 18 to 19 Year Olds | 199 (64.6%) | 109 (35.4%) |
| 20 to 24 Year Olds | 103 (42.2%) | 141 (57.8%) |
| 25 to 34 Year Olds | 72 (74.2%) | 25 (25.8%) |
| 35 Years and over | 76 (50.0%) | 76 (50.0%) |
| Total | 3,425 (79.5%) | 883 (20.5%) |
Educational Attainment by Field of Study in Newburyport
Business (1,690 | 18.3%), education (1,153 | 12.5%), social sciences (984 | 10.7%), psychology (733 | 8.0%), and science & technology (666 | 7.2%) are the most common fields of study among 9,223 individuals in Newburyport who have obtained a bachelor's degree or higher.
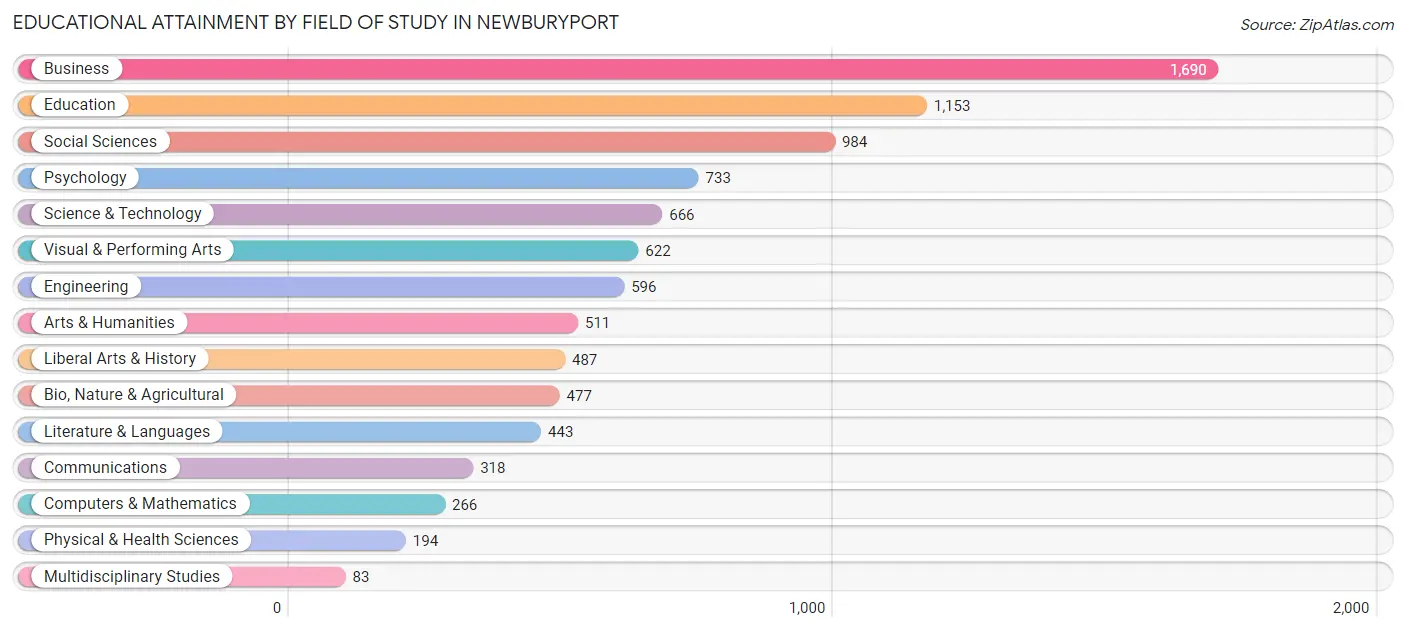
| Field of Study | # Graduates | % Graduates |
| Computers & Mathematics | 266 | 2.9% |
| Bio, Nature & Agricultural | 477 | 5.2% |
| Physical & Health Sciences | 194 | 2.1% |
| Psychology | 733 | 8.0% |
| Social Sciences | 984 | 10.7% |
| Engineering | 596 | 6.5% |
| Multidisciplinary Studies | 83 | 0.9% |
| Science & Technology | 666 | 7.2% |
| Business | 1,690 | 18.3% |
| Education | 1,153 | 12.5% |
| Literature & Languages | 443 | 4.8% |
| Liberal Arts & History | 487 | 5.3% |
| Visual & Performing Arts | 622 | 6.7% |
| Communications | 318 | 3.5% |
| Arts & Humanities | 511 | 5.5% |
| Total | 9,223 | 100.0% |
Transportation & Commute in Newburyport
Vehicle Availability by Sex in Newburyport
The most prevalent vehicle ownership categories in Newburyport are males with 2 vehicles (2,554, accounting for 55.5%) and females with 2 vehicles (2,344, making up 54.3%).
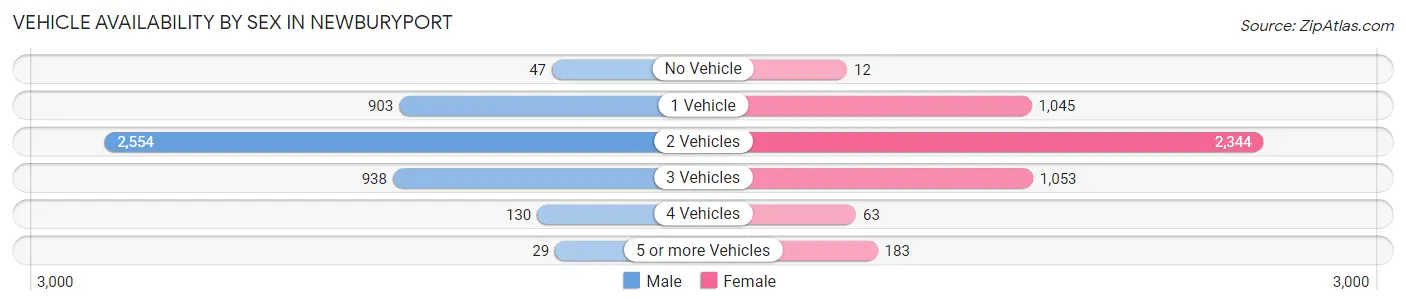
| Vehicles Available | Male | Female |
| No Vehicle | 47 (1.0%) | 12 (0.3%) |
| 1 Vehicle | 903 (19.6%) | 1,045 (22.2%) |
| 2 Vehicles | 2,554 (55.5%) | 2,344 (49.9%) |
| 3 Vehicles | 938 (20.4%) | 1,053 (22.4%) |
| 4 Vehicles | 130 (2.8%) | 63 (1.3%) |
| 5 or more Vehicles | 29 (0.6%) | 183 (3.9%) |
| Total | 4,601 (100.0%) | 4,700 (100.0%) |
Commute Time in Newburyport
The most frequently occuring commute durations in Newburyport are 45 to 59 minutes (1,216 commuters, 16.1%), 5 to 9 minutes (962 commuters, 12.7%), and 60 to 89 minutes (912 commuters, 12.1%).
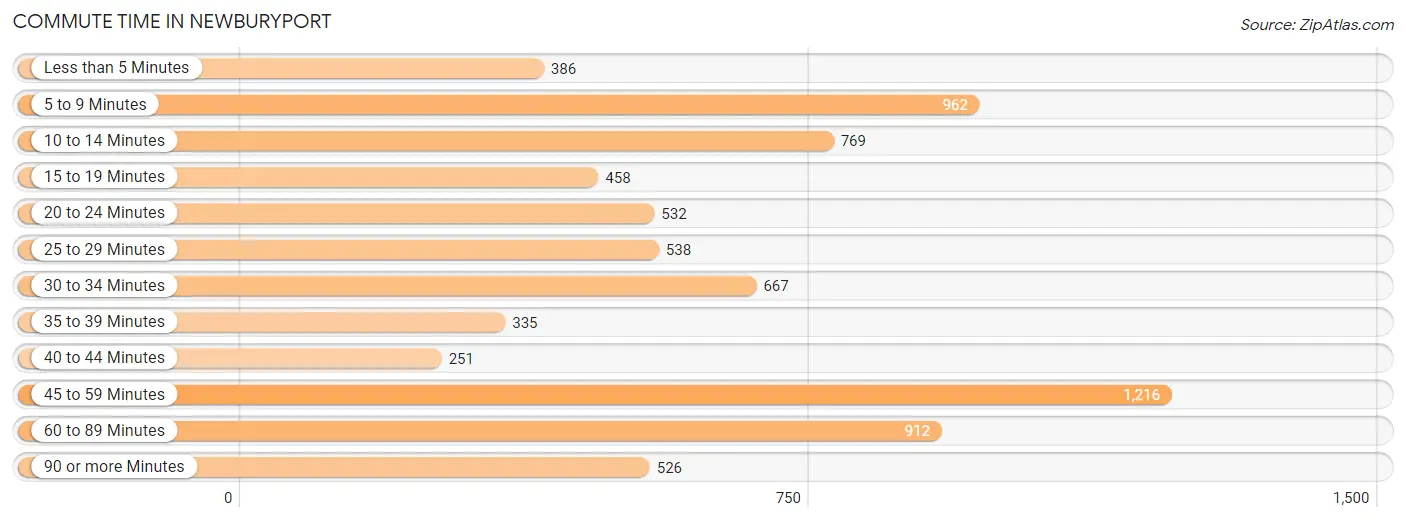
| Commute Time | # Commuters | % Commuters |
| Less than 5 Minutes | 386 | 5.1% |
| 5 to 9 Minutes | 962 | 12.7% |
| 10 to 14 Minutes | 769 | 10.2% |
| 15 to 19 Minutes | 458 | 6.1% |
| 20 to 24 Minutes | 532 | 7.0% |
| 25 to 29 Minutes | 538 | 7.1% |
| 30 to 34 Minutes | 667 | 8.8% |
| 35 to 39 Minutes | 335 | 4.4% |
| 40 to 44 Minutes | 251 | 3.3% |
| 45 to 59 Minutes | 1,216 | 16.1% |
| 60 to 89 Minutes | 912 | 12.1% |
| 90 or more Minutes | 526 | 7.0% |
Commute Time by Sex in Newburyport
The most common commute times in Newburyport are 60 to 89 minutes (669 commuters, 17.4%) for males and 5 to 9 minutes (625 commuters, 16.9%) for females.
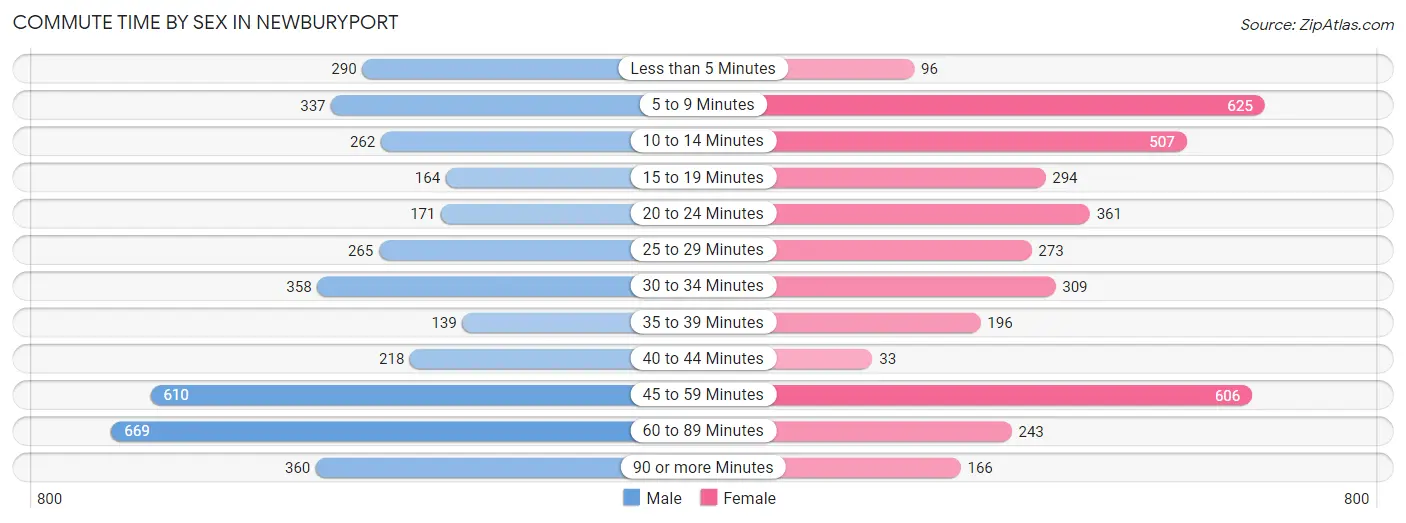
| Commute Time | Male | Female |
| Less than 5 Minutes | 290 (7.5%) | 96 (2.6%) |
| 5 to 9 Minutes | 337 (8.8%) | 625 (16.9%) |
| 10 to 14 Minutes | 262 (6.8%) | 507 (13.7%) |
| 15 to 19 Minutes | 164 (4.3%) | 294 (7.9%) |
| 20 to 24 Minutes | 171 (4.4%) | 361 (9.7%) |
| 25 to 29 Minutes | 265 (6.9%) | 273 (7.4%) |
| 30 to 34 Minutes | 358 (9.3%) | 309 (8.3%) |
| 35 to 39 Minutes | 139 (3.6%) | 196 (5.3%) |
| 40 to 44 Minutes | 218 (5.7%) | 33 (0.9%) |
| 45 to 59 Minutes | 610 (15.9%) | 606 (16.3%) |
| 60 to 89 Minutes | 669 (17.4%) | 243 (6.6%) |
| 90 or more Minutes | 360 (9.4%) | 166 (4.5%) |
Time of Departure to Work by Sex in Newburyport
The most frequent times of departure to work in Newburyport are 7:00 AM to 7:29 AM (594, 15.5%) for males and 7:30 AM to 7:59 AM (578, 15.6%) for females.
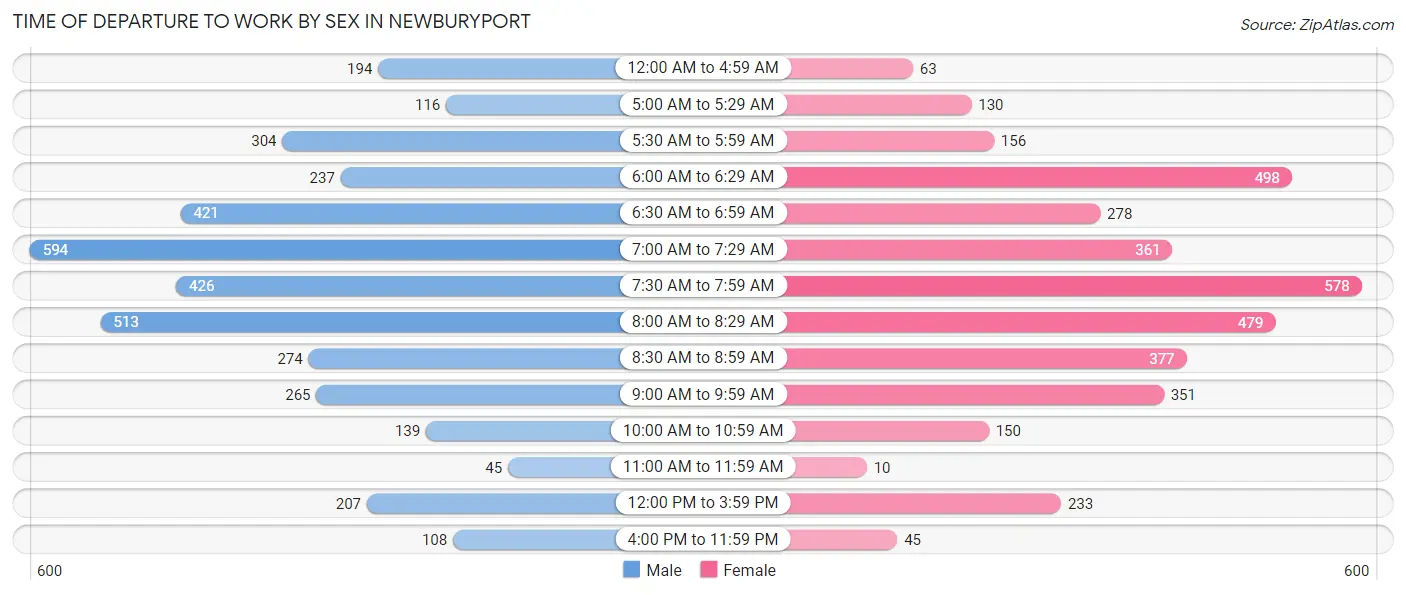
| Time of Departure | Male | Female |
| 12:00 AM to 4:59 AM | 194 (5.1%) | 63 (1.7%) |
| 5:00 AM to 5:29 AM | 116 (3.0%) | 130 (3.5%) |
| 5:30 AM to 5:59 AM | 304 (7.9%) | 156 (4.2%) |
| 6:00 AM to 6:29 AM | 237 (6.2%) | 498 (13.4%) |
| 6:30 AM to 6:59 AM | 421 (11.0%) | 278 (7.5%) |
| 7:00 AM to 7:29 AM | 594 (15.5%) | 361 (9.7%) |
| 7:30 AM to 7:59 AM | 426 (11.1%) | 578 (15.6%) |
| 8:00 AM to 8:29 AM | 513 (13.4%) | 479 (12.9%) |
| 8:30 AM to 8:59 AM | 274 (7.1%) | 377 (10.2%) |
| 9:00 AM to 9:59 AM | 265 (6.9%) | 351 (9.5%) |
| 10:00 AM to 10:59 AM | 139 (3.6%) | 150 (4.0%) |
| 11:00 AM to 11:59 AM | 45 (1.2%) | 10 (0.3%) |
| 12:00 PM to 3:59 PM | 207 (5.4%) | 233 (6.3%) |
| 4:00 PM to 11:59 PM | 108 (2.8%) | 45 (1.2%) |
| Total | 3,843 (100.0%) | 3,709 (100.0%) |
Housing Occupancy in Newburyport
Occupancy by Ownership in Newburyport
Of the total 7,591 dwellings in Newburyport, owner-occupied units account for 5,846 (77.0%), while renter-occupied units make up 1,745 (23.0%).
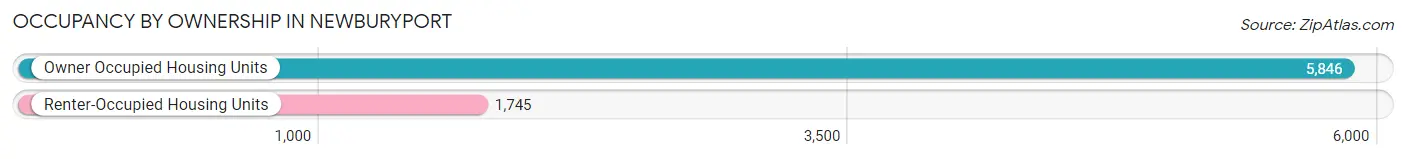
| Occupancy | # Housing Units | % Housing Units |
| Owner Occupied Housing Units | 5,846 | 77.0% |
| Renter-Occupied Housing Units | 1,745 | 23.0% |
| Total Occupied Housing Units | 7,591 | 100.0% |
Occupancy by Household Size in Newburyport
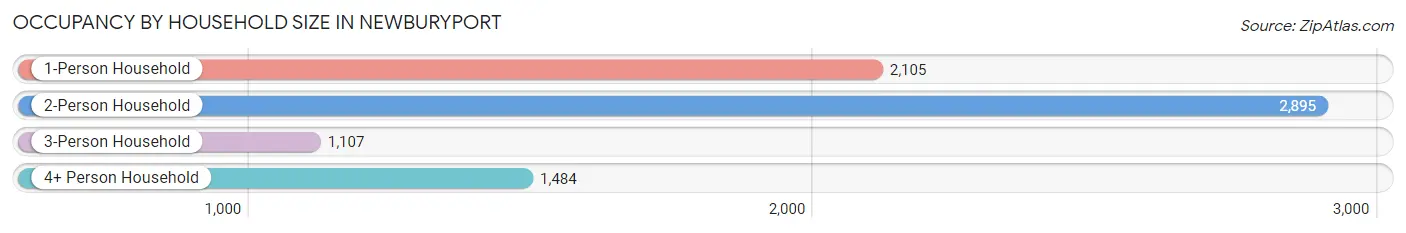
| Household Size | # Housing Units | % Housing Units |
| 1-Person Household | 2,105 | 27.7% |
| 2-Person Household | 2,895 | 38.1% |
| 3-Person Household | 1,107 | 14.6% |
| 4+ Person Household | 1,484 | 19.6% |
| Total Housing Units | 7,591 | 100.0% |
Occupancy by Ownership by Household Size in Newburyport
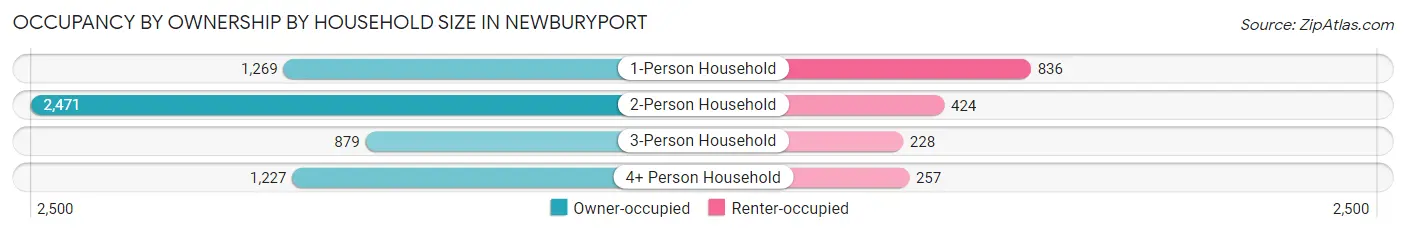
| Household Size | Owner-occupied | Renter-occupied |
| 1-Person Household | 1,269 (60.3%) | 836 (39.7%) |
| 2-Person Household | 2,471 (85.4%) | 424 (14.6%) |
| 3-Person Household | 879 (79.4%) | 228 (20.6%) |
| 4+ Person Household | 1,227 (82.7%) | 257 (17.3%) |
| Total Housing Units | 5,846 (77.0%) | 1,745 (23.0%) |
Occupancy by Educational Attainment in Newburyport
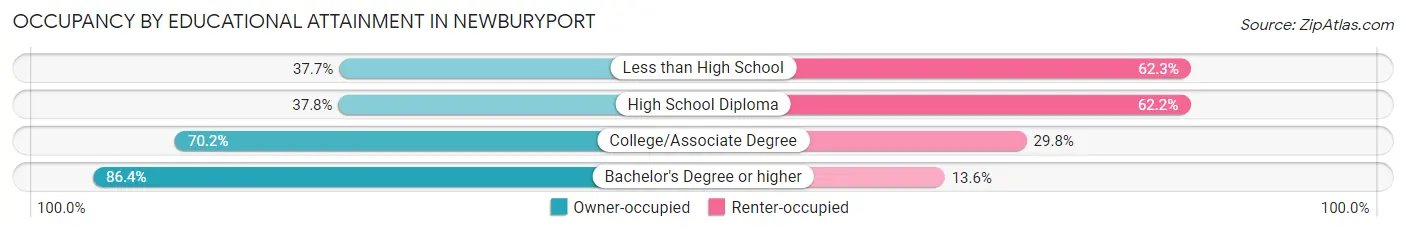
| Household Size | Owner-occupied | Renter-occupied |
| Less than High School | 29 (37.7%) | 48 (62.3%) |
| High School Diploma | 331 (37.8%) | 545 (62.2%) |
| College/Associate Degree | 1,079 (70.2%) | 459 (29.8%) |
| Bachelor's Degree or higher | 4,407 (86.4%) | 693 (13.6%) |
Occupancy by Age of Householder in Newburyport
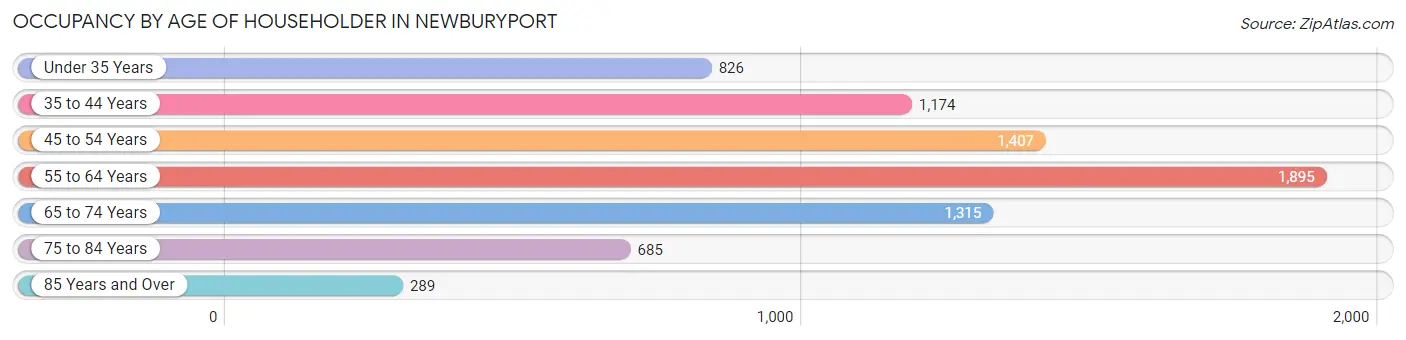
| Age Bracket | # Households | % Households |
| Under 35 Years | 826 | 10.9% |
| 35 to 44 Years | 1,174 | 15.5% |
| 45 to 54 Years | 1,407 | 18.5% |
| 55 to 64 Years | 1,895 | 25.0% |
| 65 to 74 Years | 1,315 | 17.3% |
| 75 to 84 Years | 685 | 9.0% |
| 85 Years and Over | 289 | 3.8% |
| Total | 7,591 | 100.0% |
Housing Finances in Newburyport
Median Income by Occupancy in Newburyport
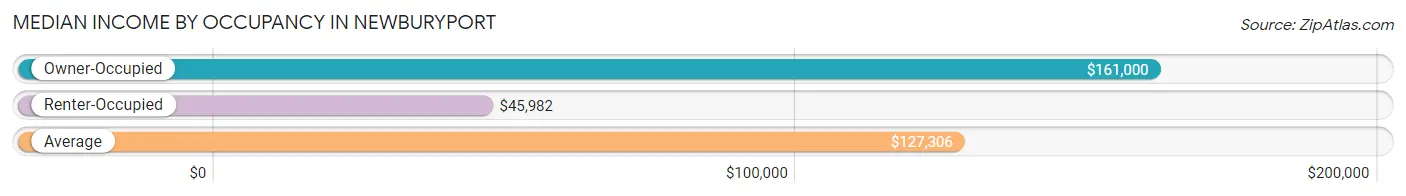
| Occupancy Type | # Households | Median Income |
| Owner-Occupied | 5,846 (77.0%) | $161,000 |
| Renter-Occupied | 1,745 (23.0%) | $45,982 |
| Average | 7,591 (100.0%) | $127,306 |
Occupancy by Householder Income Bracket in Newburyport
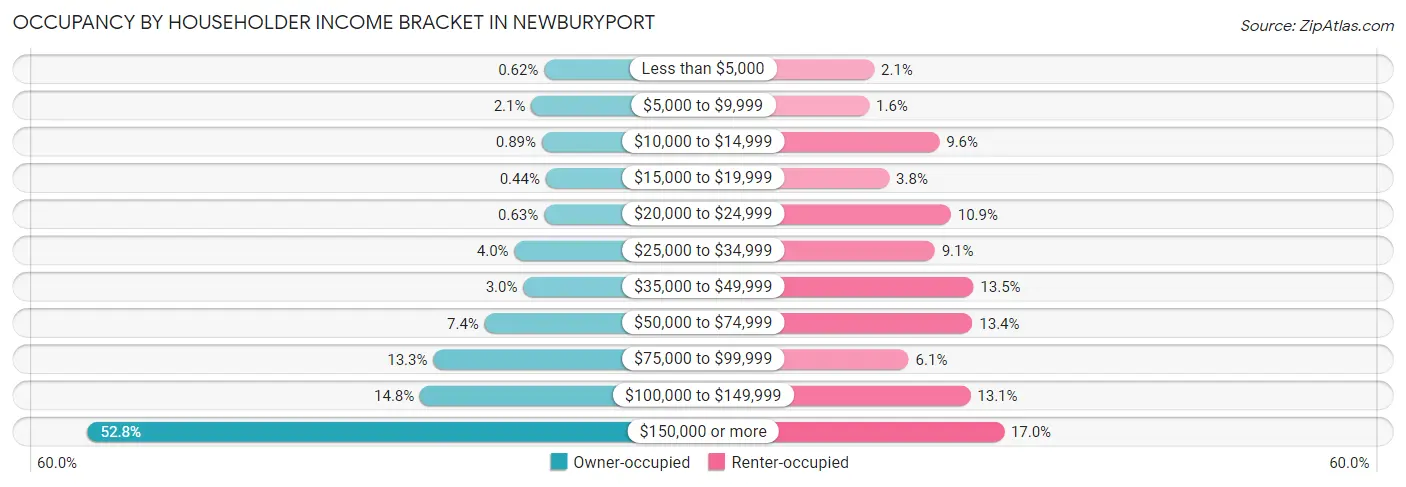
| Income Bracket | Owner-occupied | Renter-occupied |
| Less than $5,000 | 36 (0.6%) | 37 (2.1%) |
| $5,000 to $9,999 | 122 (2.1%) | 27 (1.5%) |
| $10,000 to $14,999 | 52 (0.9%) | 167 (9.6%) |
| $15,000 to $19,999 | 26 (0.4%) | 67 (3.8%) |
| $20,000 to $24,999 | 37 (0.6%) | 190 (10.9%) |
| $25,000 to $34,999 | 235 (4.0%) | 158 (9.0%) |
| $35,000 to $49,999 | 176 (3.0%) | 235 (13.5%) |
| $50,000 to $74,999 | 434 (7.4%) | 233 (13.4%) |
| $75,000 to $99,999 | 777 (13.3%) | 106 (6.1%) |
| $100,000 to $149,999 | 865 (14.8%) | 229 (13.1%) |
| $150,000 or more | 3,086 (52.8%) | 296 (17.0%) |
| Total | 5,846 (100.0%) | 1,745 (100.0%) |
Monthly Housing Cost Tiers in Newburyport
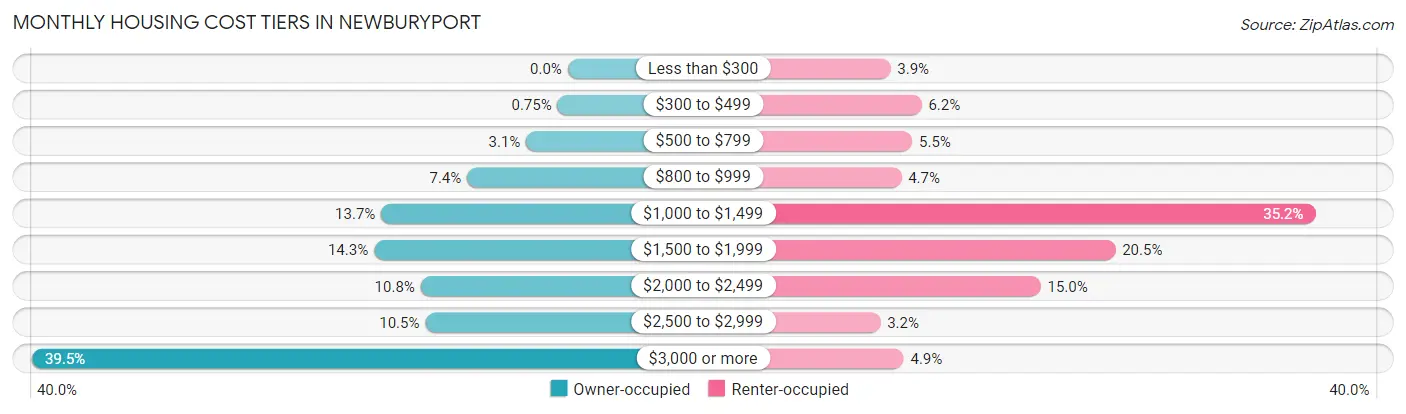
| Monthly Cost | Owner-occupied | Renter-occupied |
| Less than $300 | 0 (0.0%) | 68 (3.9%) |
| $300 to $499 | 44 (0.7%) | 108 (6.2%) |
| $500 to $799 | 179 (3.1%) | 96 (5.5%) |
| $800 to $999 | 433 (7.4%) | 82 (4.7%) |
| $1,000 to $1,499 | 803 (13.7%) | 614 (35.2%) |
| $1,500 to $1,999 | 834 (14.3%) | 357 (20.5%) |
| $2,000 to $2,499 | 633 (10.8%) | 261 (15.0%) |
| $2,500 to $2,999 | 613 (10.5%) | 55 (3.2%) |
| $3,000 or more | 2,307 (39.5%) | 85 (4.9%) |
| Total | 5,846 (100.0%) | 1,745 (100.0%) |
Physical Housing Characteristics in Newburyport
Housing Structures in Newburyport
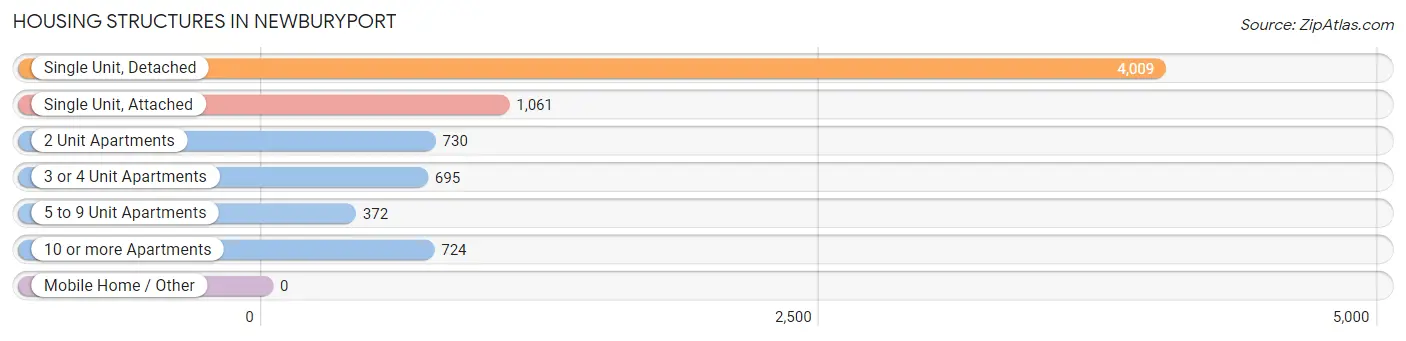
| Structure Type | # Housing Units | % Housing Units |
| Single Unit, Detached | 4,009 | 52.8% |
| Single Unit, Attached | 1,061 | 14.0% |
| 2 Unit Apartments | 730 | 9.6% |
| 3 or 4 Unit Apartments | 695 | 9.2% |
| 5 to 9 Unit Apartments | 372 | 4.9% |
| 10 or more Apartments | 724 | 9.5% |
| Mobile Home / Other | 0 | 0.0% |
| Total | 7,591 | 100.0% |
Housing Structures by Occupancy in Newburyport
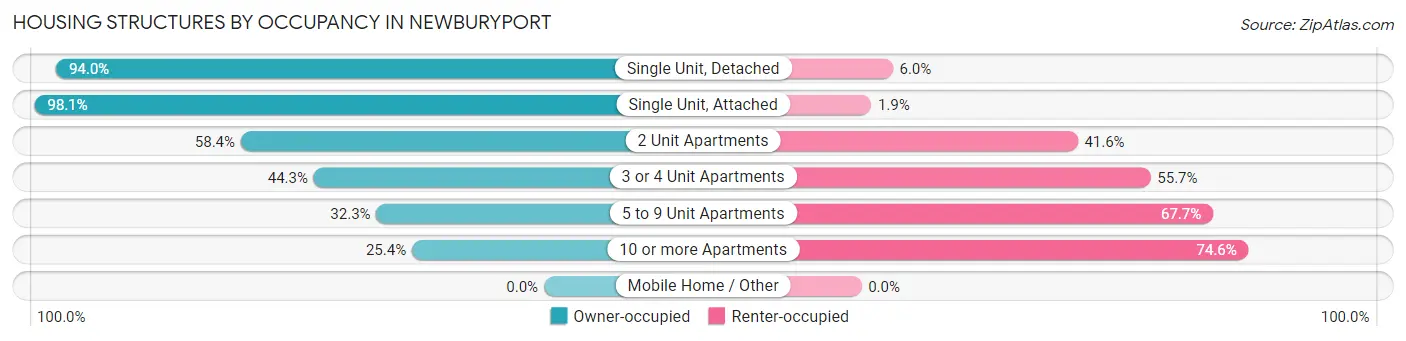
| Structure Type | Owner-occupied | Renter-occupied |
| Single Unit, Detached | 3,767 (94.0%) | 242 (6.0%) |
| Single Unit, Attached | 1,041 (98.1%) | 20 (1.9%) |
| 2 Unit Apartments | 426 (58.4%) | 304 (41.6%) |
| 3 or 4 Unit Apartments | 308 (44.3%) | 387 (55.7%) |
| 5 to 9 Unit Apartments | 120 (32.3%) | 252 (67.7%) |
| 10 or more Apartments | 184 (25.4%) | 540 (74.6%) |
| Mobile Home / Other | 0 (0.0%) | 0 (0.0%) |
| Total | 5,846 (77.0%) | 1,745 (23.0%) |
Housing Structures by Number of Rooms in Newburyport
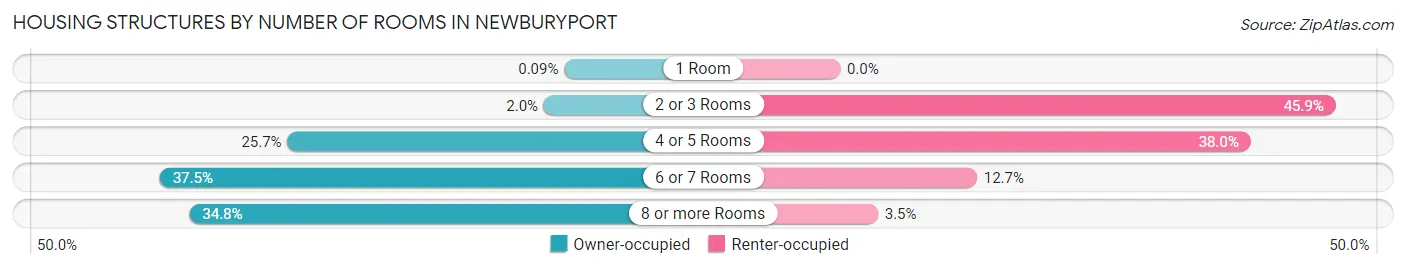
| Number of Rooms | Owner-occupied | Renter-occupied |
| 1 Room | 5 (0.1%) | 0 (0.0%) |
| 2 or 3 Rooms | 115 (2.0%) | 800 (45.9%) |
| 4 or 5 Rooms | 1,502 (25.7%) | 663 (38.0%) |
| 6 or 7 Rooms | 2,192 (37.5%) | 221 (12.7%) |
| 8 or more Rooms | 2,032 (34.8%) | 61 (3.5%) |
| Total | 5,846 (100.0%) | 1,745 (100.0%) |
Housing Structure by Heating Type in Newburyport
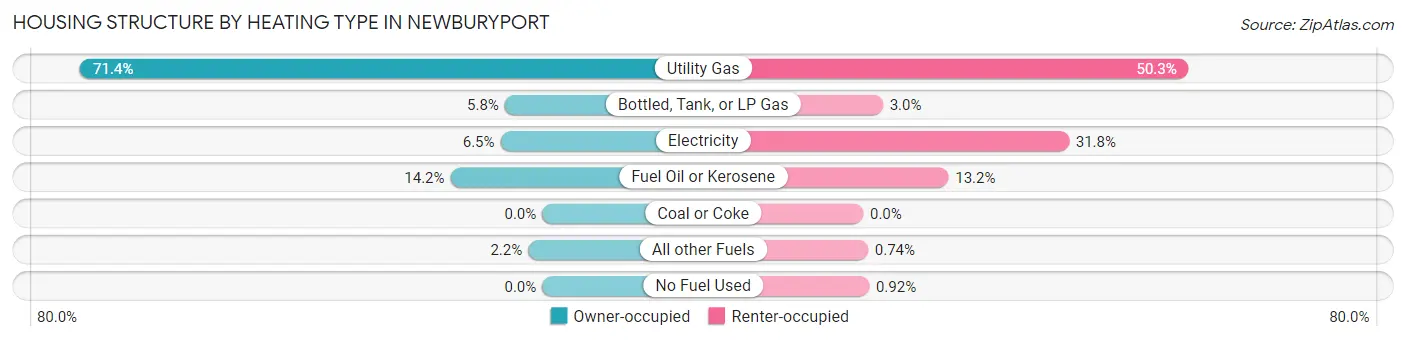
| Heating Type | Owner-occupied | Renter-occupied |
| Utility Gas | 4,175 (71.4%) | 878 (50.3%) |
| Bottled, Tank, or LP Gas | 338 (5.8%) | 53 (3.0%) |
| Electricity | 377 (6.5%) | 555 (31.8%) |
| Fuel Oil or Kerosene | 829 (14.2%) | 230 (13.2%) |
| Coal or Coke | 0 (0.0%) | 0 (0.0%) |
| All other Fuels | 127 (2.2%) | 13 (0.7%) |
| No Fuel Used | 0 (0.0%) | 16 (0.9%) |
| Total | 5,846 (100.0%) | 1,745 (100.0%) |
Household Vehicle Usage in Newburyport
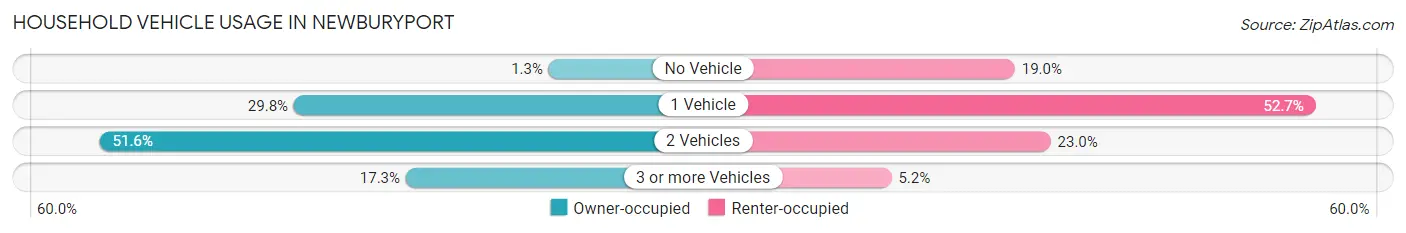
| Vehicles per Household | Owner-occupied | Renter-occupied |
| No Vehicle | 75 (1.3%) | 332 (19.0%) |
| 1 Vehicle | 1,744 (29.8%) | 920 (52.7%) |
| 2 Vehicles | 3,016 (51.6%) | 402 (23.0%) |
| 3 or more Vehicles | 1,011 (17.3%) | 91 (5.2%) |
| Total | 5,846 (100.0%) | 1,745 (100.0%) |
Real Estate & Mortgages in Newburyport
Real Estate and Mortgage Overview in Newburyport
| Characteristic | Without Mortgage | With Mortgage |
| Housing Units | 1,979 | 3,867 |
| Median Property Value | $734,100 | $739,300 |
| Median Household Income | $104,727 | $2,334 |
| Monthly Housing Costs | $1,246 | $2,226 |
| Real Estate Taxes | $7,597 | $50 |
Property Value by Mortgage Status in Newburyport
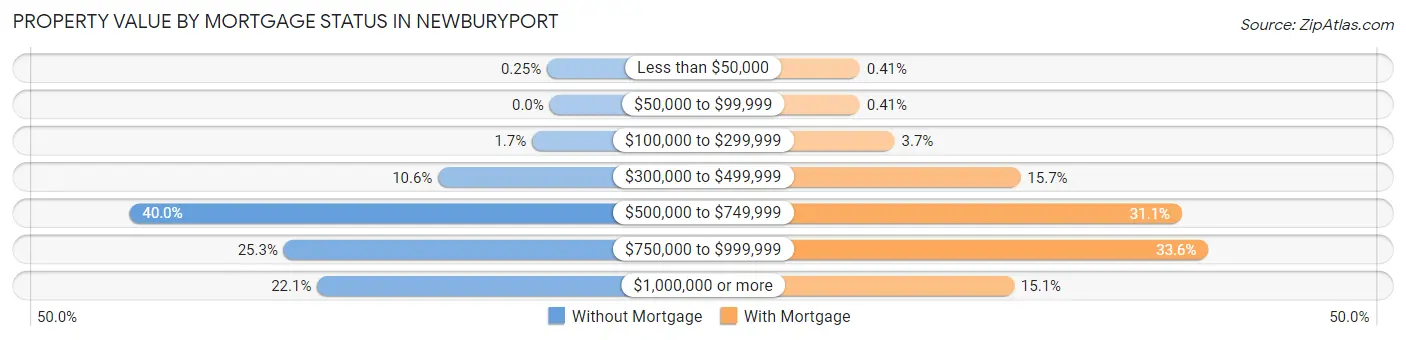
| Property Value | Without Mortgage | With Mortgage |
| Less than $50,000 | 5 (0.3%) | 16 (0.4%) |
| $50,000 to $99,999 | 0 (0.0%) | 16 (0.4%) |
| $100,000 to $299,999 | 33 (1.7%) | 144 (3.7%) |
| $300,000 to $499,999 | 210 (10.6%) | 607 (15.7%) |
| $500,000 to $749,999 | 792 (40.0%) | 1,202 (31.1%) |
| $750,000 to $999,999 | 501 (25.3%) | 1,299 (33.6%) |
| $1,000,000 or more | 438 (22.1%) | 583 (15.1%) |
| Total | 1,979 (100.0%) | 3,867 (100.0%) |
Household Income by Mortgage Status in Newburyport
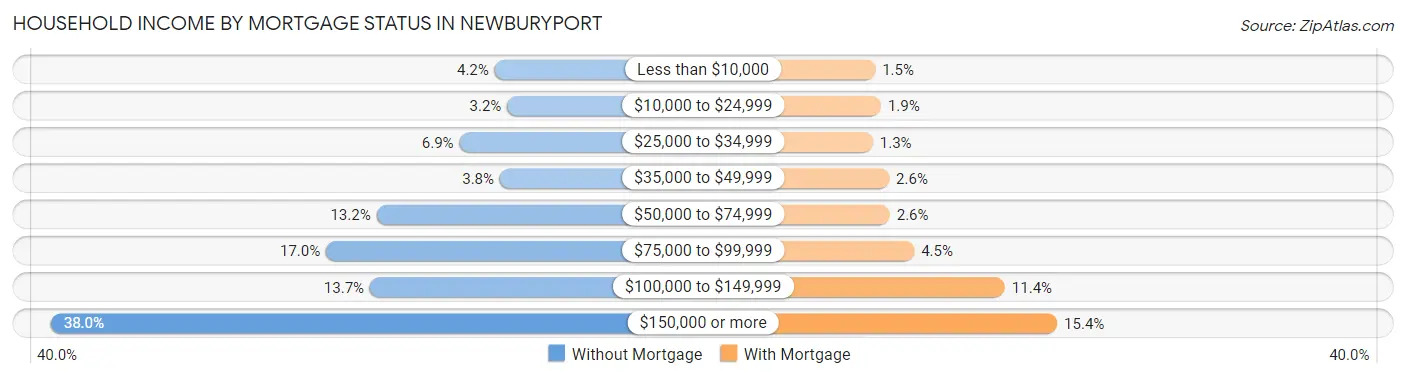
| Household Income | Without Mortgage | With Mortgage |
| Less than $10,000 | 83 (4.2%) | 58 (1.5%) |
| $10,000 to $24,999 | 64 (3.2%) | 75 (1.9%) |
| $25,000 to $34,999 | 136 (6.9%) | 51 (1.3%) |
| $35,000 to $49,999 | 75 (3.8%) | 99 (2.6%) |
| $50,000 to $74,999 | 261 (13.2%) | 101 (2.6%) |
| $75,000 to $99,999 | 337 (17.0%) | 173 (4.5%) |
| $100,000 to $149,999 | 271 (13.7%) | 440 (11.4%) |
| $150,000 or more | 752 (38.0%) | 594 (15.4%) |
| Total | 1,979 (100.0%) | 3,867 (100.0%) |
Property Value to Household Income Ratio in Newburyport
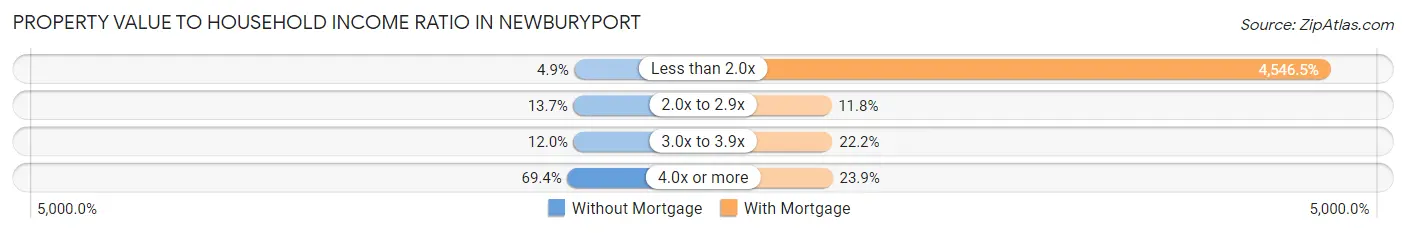
| Value-to-Income Ratio | Without Mortgage | With Mortgage |
| Less than 2.0x | 97 (4.9%) | 175,814 (4,546.5%) |
| 2.0x to 2.9x | 271 (13.7%) | 456 (11.8%) |
| 3.0x to 3.9x | 237 (12.0%) | 857 (22.2%) |
| 4.0x or more | 1,374 (69.4%) | 924 (23.9%) |
| Total | 1,979 (100.0%) | 3,867 (100.0%) |
Real Estate Taxes by Mortgage Status in Newburyport
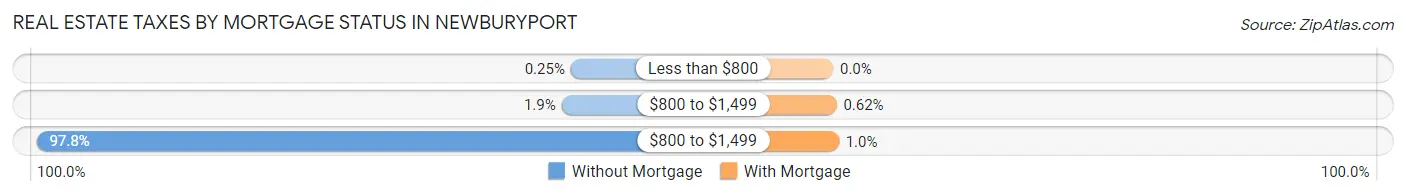
| Property Taxes | Without Mortgage | With Mortgage |
| Less than $800 | 5 (0.3%) | 0 (0.0%) |
| $800 to $1,499 | 38 (1.9%) | 24 (0.6%) |
| $800 to $1,499 | 1,936 (97.8%) | 40 (1.0%) |
| Total | 1,979 (100.0%) | 3,867 (100.0%) |
Health & Disability in Newburyport
Health Insurance Coverage by Age in Newburyport
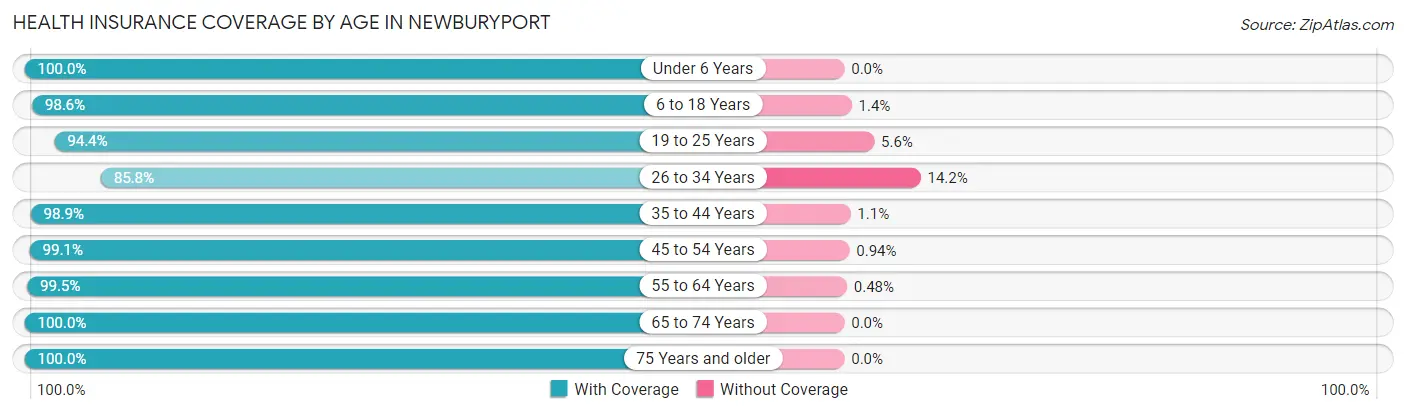
| Age Bracket | With Coverage | Without Coverage |
| Under 6 Years | 855 (100.0%) | 0 (0.0%) |
| 6 to 18 Years | 3,337 (98.6%) | 46 (1.4%) |
| 19 to 25 Years | 867 (94.4%) | 51 (5.6%) |
| 26 to 34 Years | 1,249 (85.8%) | 207 (14.2%) |
| 35 to 44 Years | 2,080 (98.9%) | 24 (1.1%) |
| 45 to 54 Years | 2,308 (99.1%) | 22 (0.9%) |
| 55 to 64 Years | 3,288 (99.5%) | 16 (0.5%) |
| 65 to 74 Years | 2,233 (100.0%) | 0 (0.0%) |
| 75 Years and older | 1,521 (100.0%) | 0 (0.0%) |
| Total | 17,738 (98.0%) | 366 (2.0%) |
Health Insurance Coverage by Citizenship Status in Newburyport
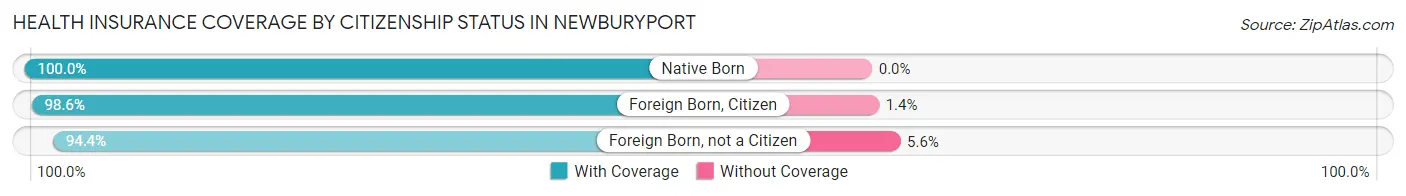
| Citizenship Status | With Coverage | Without Coverage |
| Native Born | 855 (100.0%) | 0 (0.0%) |
| Foreign Born, Citizen | 3,337 (98.6%) | 46 (1.4%) |
| Foreign Born, not a Citizen | 867 (94.4%) | 51 (5.6%) |
Health Insurance Coverage by Household Income in Newburyport
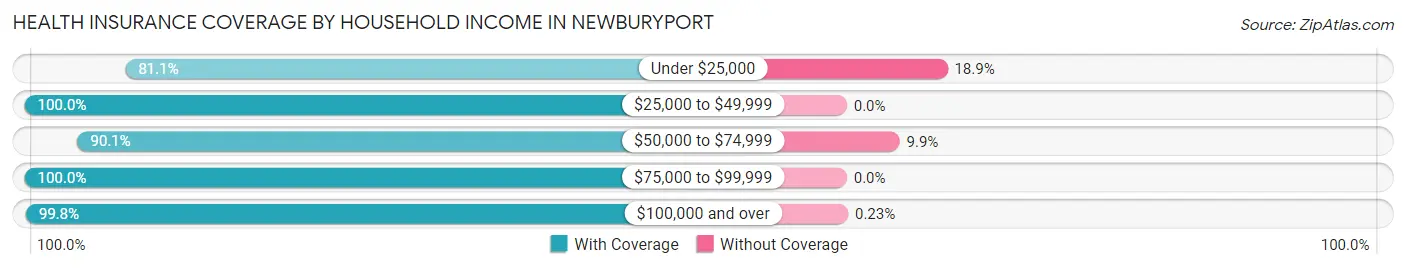
| Household Income | With Coverage | Without Coverage |
| Under $25,000 | 964 (81.1%) | 224 (18.9%) |
| $25,000 to $49,999 | 1,352 (100.0%) | 0 (0.0%) |
| $50,000 to $74,999 | 1,039 (90.1%) | 114 (9.9%) |
| $75,000 to $99,999 | 1,927 (100.0%) | 0 (0.0%) |
| $100,000 and over | 12,389 (99.8%) | 28 (0.2%) |
Public vs Private Health Insurance Coverage by Age in Newburyport
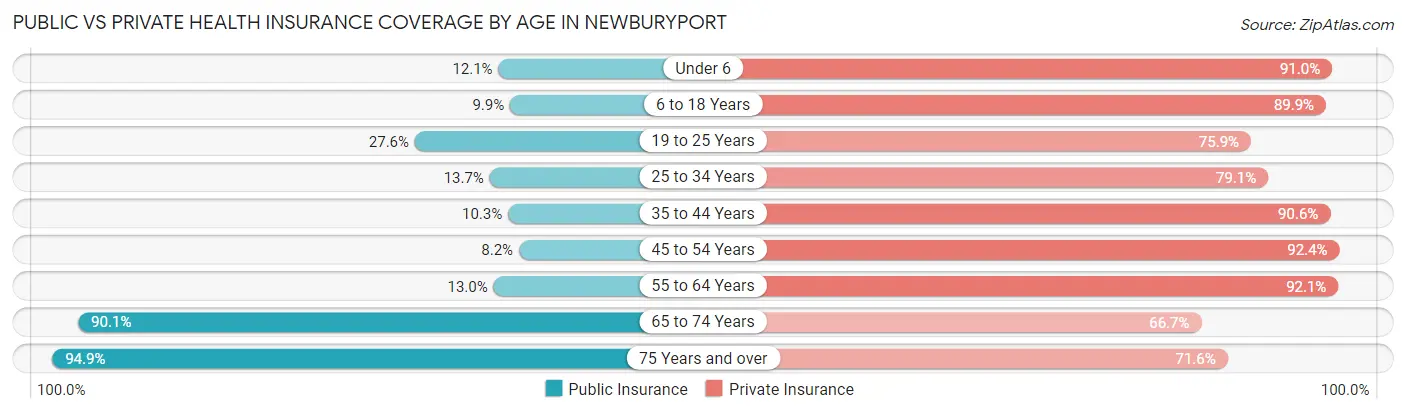
| Age Bracket | Public Insurance | Private Insurance |
| Under 6 | 103 (12.0%) | 778 (91.0%) |
| 6 to 18 Years | 335 (9.9%) | 3,040 (89.9%) |
| 19 to 25 Years | 253 (27.6%) | 697 (75.9%) |
| 25 to 34 Years | 199 (13.7%) | 1,152 (79.1%) |
| 35 to 44 Years | 216 (10.3%) | 1,907 (90.6%) |
| 45 to 54 Years | 192 (8.2%) | 2,152 (92.4%) |
| 55 to 64 Years | 428 (13.0%) | 3,044 (92.1%) |
| 65 to 74 Years | 2,011 (90.1%) | 1,490 (66.7%) |
| 75 Years and over | 1,443 (94.9%) | 1,089 (71.6%) |
| Total | 5,180 (28.6%) | 15,349 (84.8%) |
Disability Status by Sex by Age in Newburyport
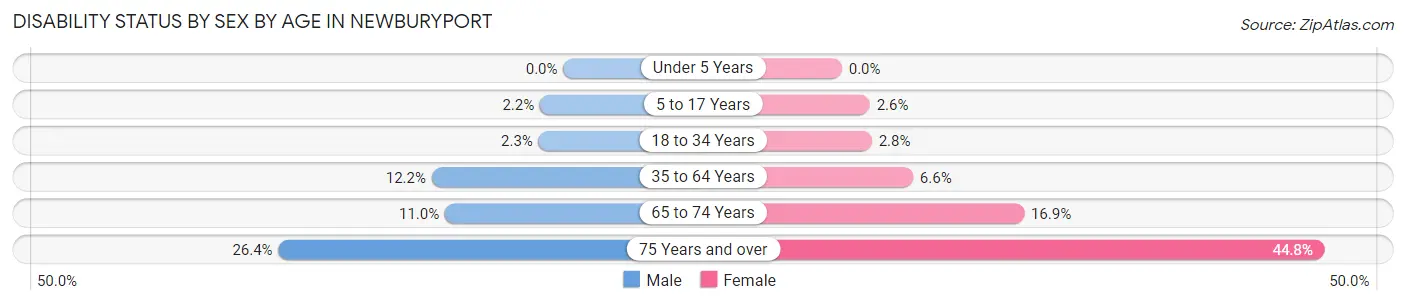
| Age Bracket | Male | Female |
| Under 5 Years | 0 (0.0%) | 0 (0.0%) |
| 5 to 17 Years | 34 (2.2%) | 47 (2.6%) |
| 18 to 34 Years | 24 (2.3%) | 42 (2.8%) |
| 35 to 64 Years | 445 (12.2%) | 270 (6.6%) |
| 65 to 74 Years | 101 (11.0%) | 222 (16.9%) |
| 75 Years and over | 165 (26.4%) | 402 (44.8%) |
Disability Class by Sex by Age in Newburyport
Disability Class: Hearing Difficulty
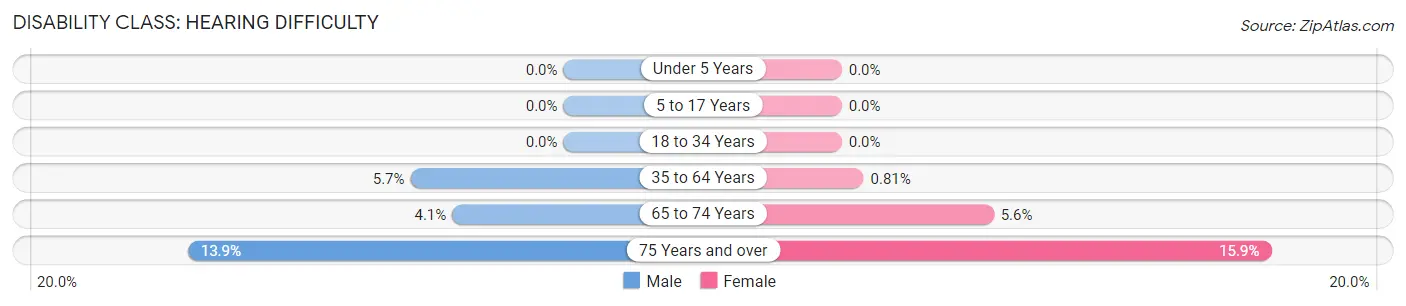
| Age Bracket | Male | Female |
| Under 5 Years | 0 (0.0%) | 0 (0.0%) |
| 5 to 17 Years | 0 (0.0%) | 0 (0.0%) |
| 18 to 34 Years | 0 (0.0%) | 0 (0.0%) |
| 35 to 64 Years | 207 (5.7%) | 33 (0.8%) |
| 65 to 74 Years | 38 (4.1%) | 74 (5.6%) |
| 75 Years and over | 87 (13.9%) | 143 (15.9%) |
Disability Class: Vision Difficulty
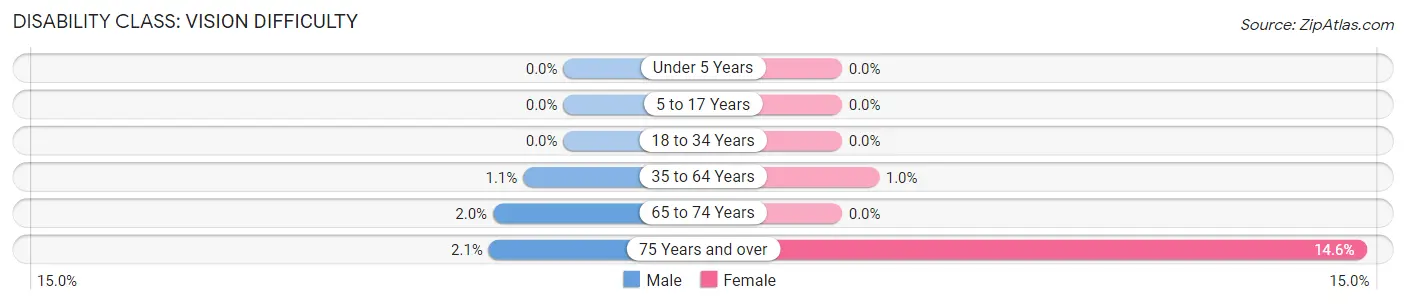
| Age Bracket | Male | Female |
| Under 5 Years | 0 (0.0%) | 0 (0.0%) |
| 5 to 17 Years | 0 (0.0%) | 0 (0.0%) |
| 18 to 34 Years | 0 (0.0%) | 0 (0.0%) |
| 35 to 64 Years | 41 (1.1%) | 42 (1.0%) |
| 65 to 74 Years | 18 (2.0%) | 0 (0.0%) |
| 75 Years and over | 13 (2.1%) | 131 (14.6%) |
Disability Class: Cognitive Difficulty
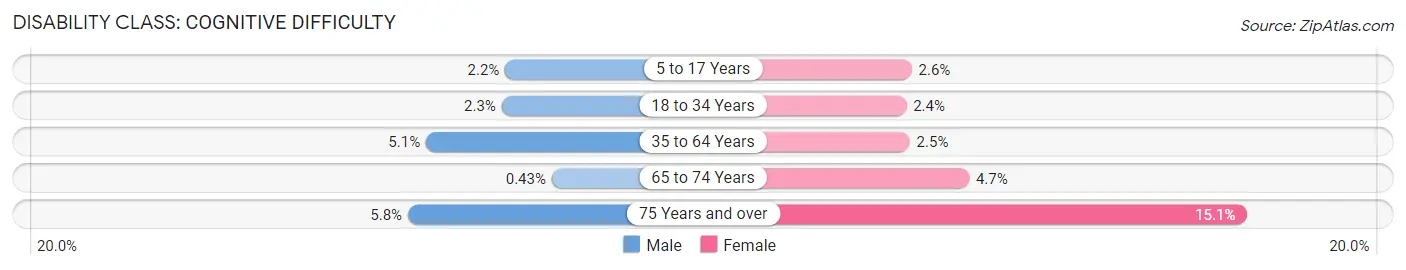
| Age Bracket | Male | Female |
| 5 to 17 Years | 34 (2.2%) | 47 (2.6%) |
| 18 to 34 Years | 24 (2.3%) | 36 (2.4%) |
| 35 to 64 Years | 186 (5.1%) | 103 (2.5%) |
| 65 to 74 Years | 4 (0.4%) | 62 (4.7%) |
| 75 Years and over | 36 (5.8%) | 135 (15.0%) |
Disability Class: Ambulatory Difficulty
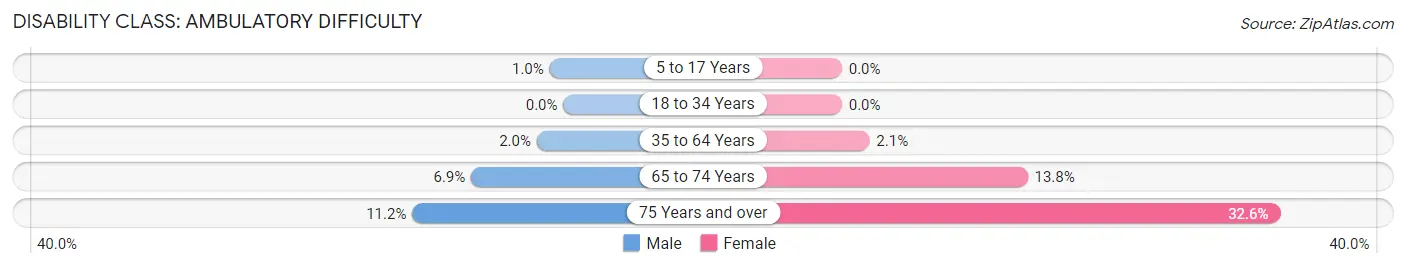
| Age Bracket | Male | Female |
| 5 to 17 Years | 16 (1.0%) | 0 (0.0%) |
| 18 to 34 Years | 0 (0.0%) | 0 (0.0%) |
| 35 to 64 Years | 72 (2.0%) | 84 (2.1%) |
| 65 to 74 Years | 63 (6.9%) | 181 (13.8%) |
| 75 Years and over | 70 (11.2%) | 292 (32.6%) |
Disability Class: Self-Care Difficulty
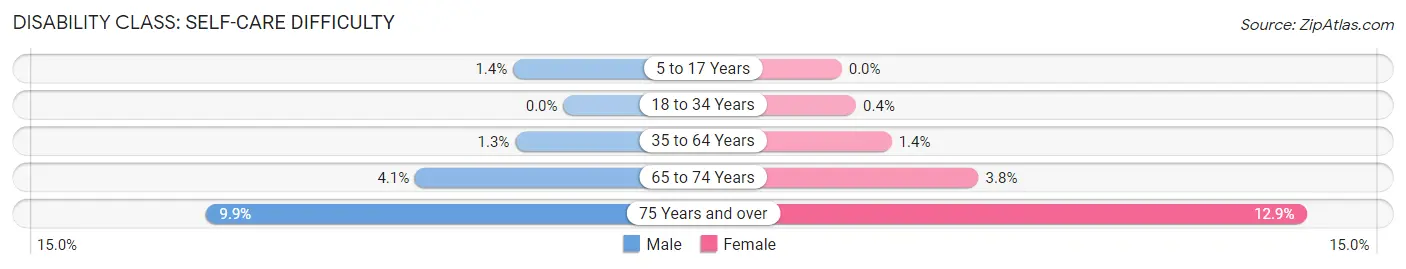
| Age Bracket | Male | Female |
| 5 to 17 Years | 22 (1.4%) | 0 (0.0%) |
| 18 to 34 Years | 0 (0.0%) | 6 (0.4%) |
| 35 to 64 Years | 49 (1.3%) | 57 (1.4%) |
| 65 to 74 Years | 38 (4.1%) | 50 (3.8%) |
| 75 Years and over | 62 (9.9%) | 116 (12.9%) |
Technology Access in Newburyport
Computing Device Access in Newburyport
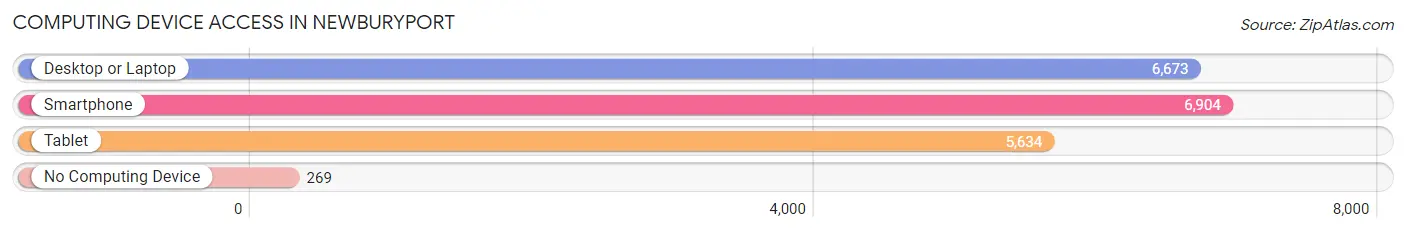
| Device Type | # Households | % Households |
| Desktop or Laptop | 6,673 | 87.9% |
| Smartphone | 6,904 | 90.9% |
| Tablet | 5,634 | 74.2% |
| No Computing Device | 269 | 3.5% |
| Total | 7,591 | 100.0% |
Internet Access in Newburyport
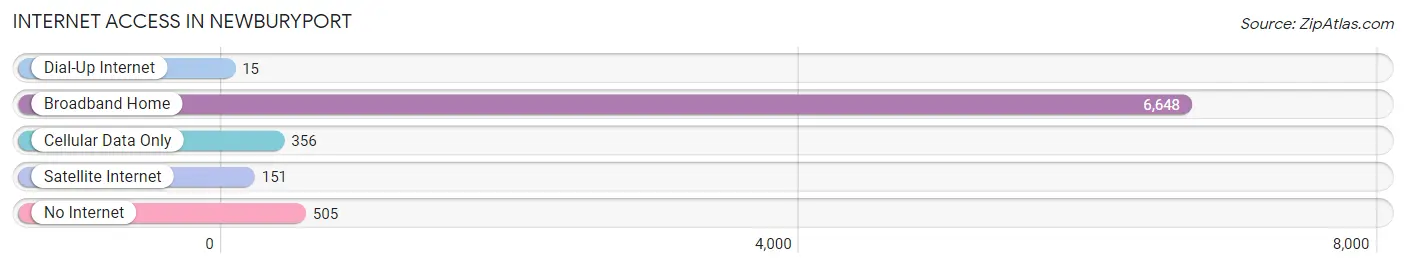
| Internet Type | # Households | % Households |
| Dial-Up Internet | 15 | 0.2% |
| Broadband Home | 6,648 | 87.6% |
| Cellular Data Only | 356 | 4.7% |
| Satellite Internet | 151 | 2.0% |
| No Internet | 505 | 6.7% |
| Total | 7,591 | 100.0% |
Newburyport Summary
Newburyport is a small coastal city located in Essex County, Massachusetts, United States. It is situated along the Merrimack River, approximately 35 miles north of Boston. The city has a population of 17,416 as of the 2010 census, and is part of the Greater Boston metropolitan area.
History
Newburyport was first settled in 1635 by English colonists, and was incorporated as a town in 1764. The town was named after the English town of Newbury, and was part of the Province of Massachusetts Bay. During the American Revolution, Newburyport was a major port for privateering and smuggling. It was also the site of the first naval battle of the Revolution, the Battle of Newburyport.
In the 19th century, Newburyport became a major shipbuilding center, and was home to several prominent shipyards. The city was also a major center for the textile industry, and was home to several large mills.
Geography
Newburyport is located at 42°48′N 70°53′W (42.8, -70.88). According to the United States Census Bureau, the city has a total area of 8.3 square miles (21.5 km2), of which 7.7 square miles (19.9 km2) is land and 0.6 square miles (1.6 km2) is water.
The city is located on the north shore of Massachusetts Bay, and is bordered by the towns of Salisbury to the north, West Newbury to the west, and Newbury to the south. The Merrimack River forms the eastern boundary of the city.
Economy
Newburyport’s economy is largely based on tourism and retail. The city is home to several popular tourist attractions, including the Custom House Maritime Museum, the Newburyport Harborwalk, and the Waterfront Historic District. The city is also home to several retail stores, restaurants, and art galleries.
The city is also home to several manufacturing companies, including a large paper mill and a shipbuilding company. The city is also home to several technology companies, including a software development firm and a medical device manufacturer.
Demographics
As of the 2010 census, the population of Newburyport was 17,416. The racial makeup of the city was 94.2% White, 1.3% African American, 0.3% Native American, 1.7% Asian, 0.1% Pacific Islander, 0.9% from other races, and 1.6% from two or more races. Hispanic or Latino of any race were 3.2% of the population.
The median income for a household in the city was $62,813, and the median income for a family was $77,890. The per capita income for the city was $35,945. About 5.2% of families and 8.2% of the population were below the poverty line, including 10.2% of those under age 18 and 6.2% of those age 65 or over.
Common Questions
What is Per Capita Income in Newburyport?
Per Capita income in Newburyport is $73,247.
What is the Median Family Income in Newburyport?
Median Family Income in Newburyport is $169,347.
What is the Median Household income in Newburyport?
Median Household Income in Newburyport is $127,306.
What is Income or Wage Gap in Newburyport?
Income or Wage Gap in Newburyport is 42.9%.
Women in Newburyport earn 57.1 cents for every dollar earned by a man.
What is Inequality or Gini Index in Newburyport?
Inequality or Gini Index in Newburyport is 0.48.
What is the Total Population of Newburyport?
Total Population of Newburyport is 18,356.
What is the Total Male Population of Newburyport?
Total Male Population of Newburyport is 8,211.
What is the Total Female Population of Newburyport?
Total Female Population of Newburyport is 10,145.
What is the Ratio of Males per 100 Females in Newburyport?
There are 80.94 Males per 100 Females in Newburyport.
What is the Ratio of Females per 100 Males in Newburyport?
There are 123.55 Females per 100 Males in Newburyport.
What is the Median Population Age in Newburyport?
Median Population Age in Newburyport is 46.5 Years.
What is the Average Family Size in Newburyport
Average Family Size in Newburyport is 2.9 People.
What is the Average Household Size in Newburyport
Average Household Size in Newburyport is 2.4 People.
How Large is the Labor Force in Newburyport?
There are 10,024 People in the Labor Forcein in Newburyport.
What is the Percentage of People in the Labor Force in Newburyport?
68.9% of People are in the Labor Force in Newburyport.
What is the Unemployment Rate in Newburyport?
Unemployment Rate in Newburyport is 5.7%.