Zip Codes with the Highest Percentage of Population with a Degree in Bio, Nature & Agricultural in Lynnwood, WA
RELATED REPORTS & OPTIONS
Bio, Nature & Agricultural
Lynnwood
Compare Zip Codes
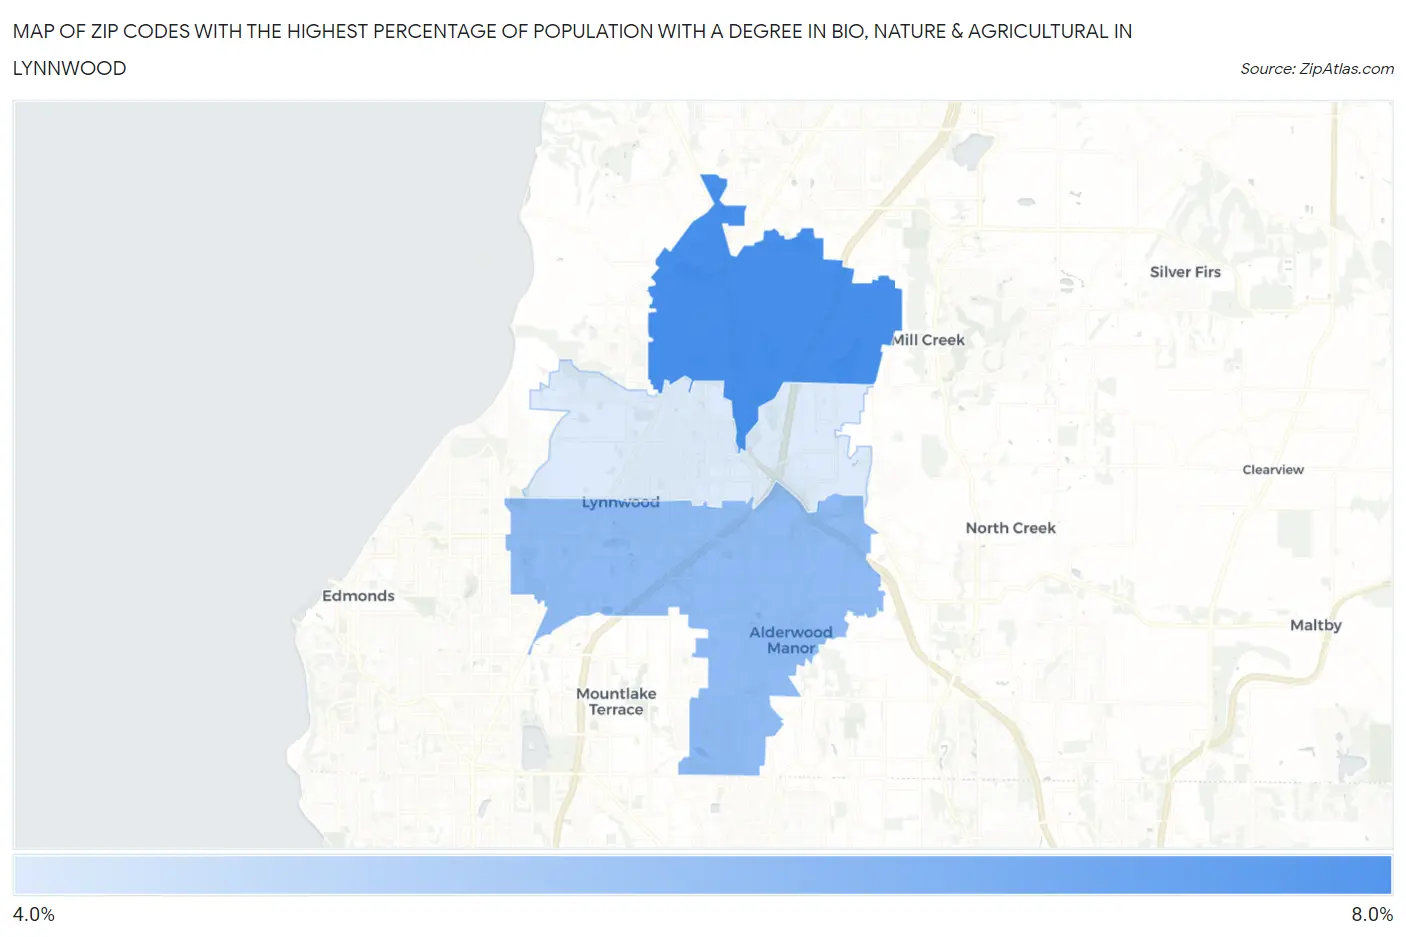
Map of Zip Codes with the Highest Percentage of Population with a Degree in Bio, Nature & Agricultural in Lynnwood
4.3%
6.7%
Zip Codes with the Highest Percentage of Population with a Degree in Bio, Nature & Agricultural in Lynnwood, WA
| Zip Code | % Graduates | vs State | vs National | |
| 1. | 98087 | 6.7% | 7.2%(-0.541)#312 | 6.4%(+0.313)#14,191 |
| 2. | 98036 | 5.5% | 7.2%(-1.68)#387 | 6.4%(-0.822)#17,245 |
| 3. | 98037 | 4.3% | 7.2%(-2.87)#441 | 6.4%(-2.02)#20,760 |
1
Common Questions
What are the Top Zip Codes with the Highest Percentage of Population with a Degree in Bio, Nature & Agricultural in Lynnwood, WA?
Top Zip Codes with the Highest Percentage of Population with a Degree in Bio, Nature & Agricultural in Lynnwood, WA are:
What zip code has the Highest Percentage of Population with a Degree in Bio, Nature & Agricultural in Lynnwood, WA?
98087 has the Highest Percentage of Population with a Degree in Bio, Nature & Agricultural in Lynnwood, WA with 6.7%.
What is the Percentage of Population with a Degree in Bio, Nature & Agricultural in Lynnwood, WA?
Percentage of Population with a Degree in Bio, Nature & Agricultural in Lynnwood is 4.3%.
What is the Percentage of Population with a Degree in Bio, Nature & Agricultural in Washington?
Percentage of Population with a Degree in Bio, Nature & Agricultural in Washington is 7.2%.
What is the Percentage of Population with a Degree in Bio, Nature & Agricultural in the United States?
Percentage of Population with a Degree in Bio, Nature & Agricultural in the United States is 6.4%.