Zip Codes with the Highest Percentage of Population with a Degree in Visual and Performing Arts in Everett, WA
RELATED REPORTS & OPTIONS
Visual and Performing Arts
Everett
Compare Zip Codes
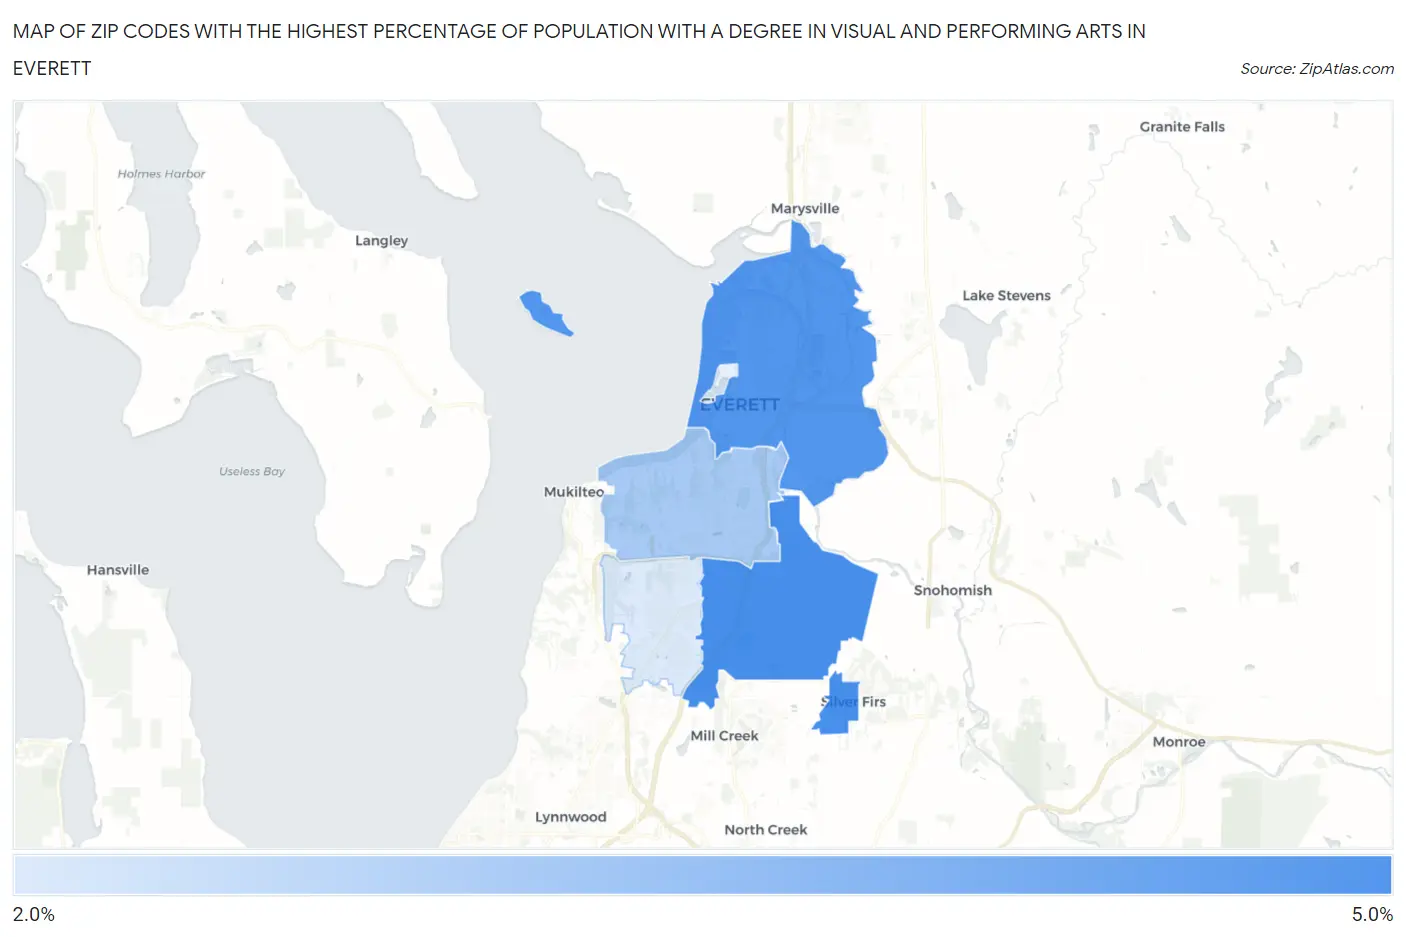
Map of Zip Codes with the Highest Percentage of Population with a Degree in Visual and Performing Arts in Everett
2.0%
5.0%
Zip Codes with the Highest Percentage of Population with a Degree in Visual and Performing Arts in Everett, WA
| Zip Code | % Graduates | vs State | vs National | |
| 1. | 98208 | 5.0% | 4.6%(+0.352)#178 | 4.3%(+0.719)#6,714 |
| 2. | 98201 | 4.8% | 4.6%(+0.139)#189 | 4.3%(+0.506)#7,177 |
| 3. | 98203 | 3.1% | 4.6%(-1.56)#314 | 4.3%(-1.20)#12,520 |
| 4. | 98204 | 2.0% | 4.6%(-2.58)#377 | 4.3%(-2.21)#16,288 |
1
Common Questions
What are the Top 3 Zip Codes with the Highest Percentage of Population with a Degree in Visual and Performing Arts in Everett, WA?
Top 3 Zip Codes with the Highest Percentage of Population with a Degree in Visual and Performing Arts in Everett, WA are:
What zip code has the Highest Percentage of Population with a Degree in Visual and Performing Arts in Everett, WA?
98208 has the Highest Percentage of Population with a Degree in Visual and Performing Arts in Everett, WA with 5.0%.
What is the Percentage of Population with a Degree in Visual and Performing Arts in Everett, WA?
Percentage of Population with a Degree in Visual and Performing Arts in Everett is 4.4%.
What is the Percentage of Population with a Degree in Visual and Performing Arts in Washington?
Percentage of Population with a Degree in Visual and Performing Arts in Washington is 4.6%.
What is the Percentage of Population with a Degree in Visual and Performing Arts in the United States?
Percentage of Population with a Degree in Visual and Performing Arts in the United States is 4.3%.