Zip Codes with the Highest Percentage of Self-Employed / Not Incorporated in Warrenton, VA
RELATED REPORTS & OPTIONS
Self-Employed / Not Incorporated
Warrenton
Compare Zip Codes
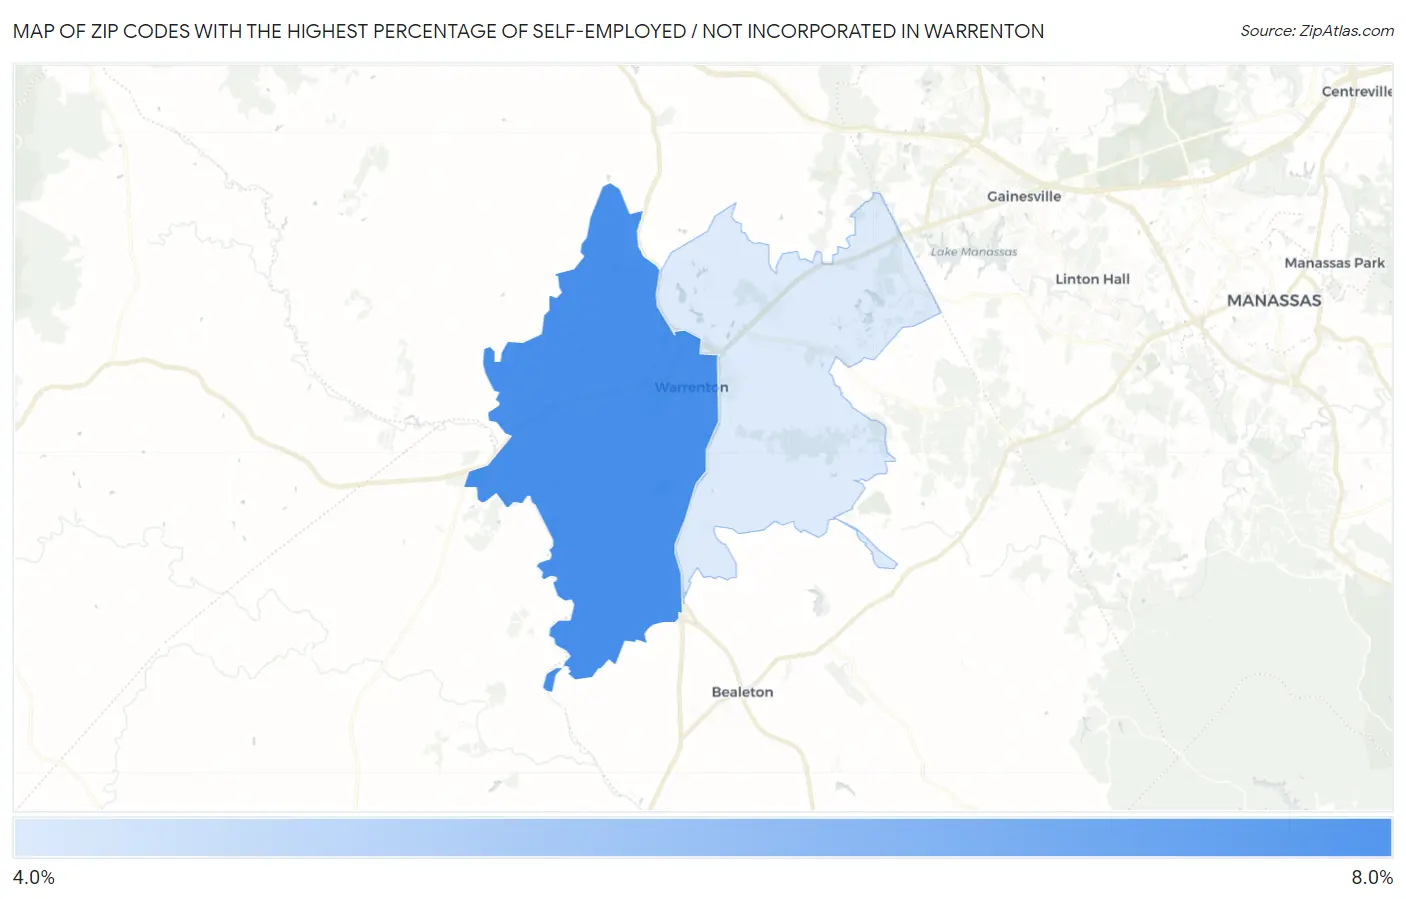
Map of Zip Codes with the Highest Percentage of Self-Employed / Not Incorporated in Warrenton
0.0%
8.0%
Zip Codes with the Highest Percentage of Self-Employed / Not Incorporated in Warrenton, VA
| Zip Code | % Self-Employed / Not Incorporated | vs State | vs National | |
| 1. | 20186 | 6.5% | 4.7%(+1.81)#272 | 5.8%(+0.683)#14,475 |
| 2. | 20187 | 4.0% | 4.7%(-0.676)#519 | 5.8%(-1.80)#23,339 |
1
Common Questions
What are the Top Zip Codes with the Highest Percentage of Self-Employed / Not Incorporated in Warrenton, VA?
Top Zip Codes with the Highest Percentage of Self-Employed / Not Incorporated in Warrenton, VA are:
What zip code has the Highest Percentage of Self-Employed / Not Incorporated in Warrenton, VA?
20186 has the Highest Percentage of Self-Employed / Not Incorporated in Warrenton, VA with 6.5%.
What is the Percentage of Self-Employed / Not Incorporated in Warrenton, VA?
Percentage of Self-Employed / Not Incorporated in Warrenton is 4.9%.
What is the Percentage of Self-Employed / Not Incorporated in Virginia?
Percentage of Self-Employed / Not Incorporated in Virginia is 4.7%.
What is the Percentage of Self-Employed / Not Incorporated in the United States?
Percentage of Self-Employed / Not Incorporated in the United States is 5.8%.