Zip Codes with the Highest Percentage of Self-Employed / Not Incorporated in Danville, VA
RELATED REPORTS & OPTIONS
Self-Employed / Not Incorporated
Danville
Compare Zip Codes
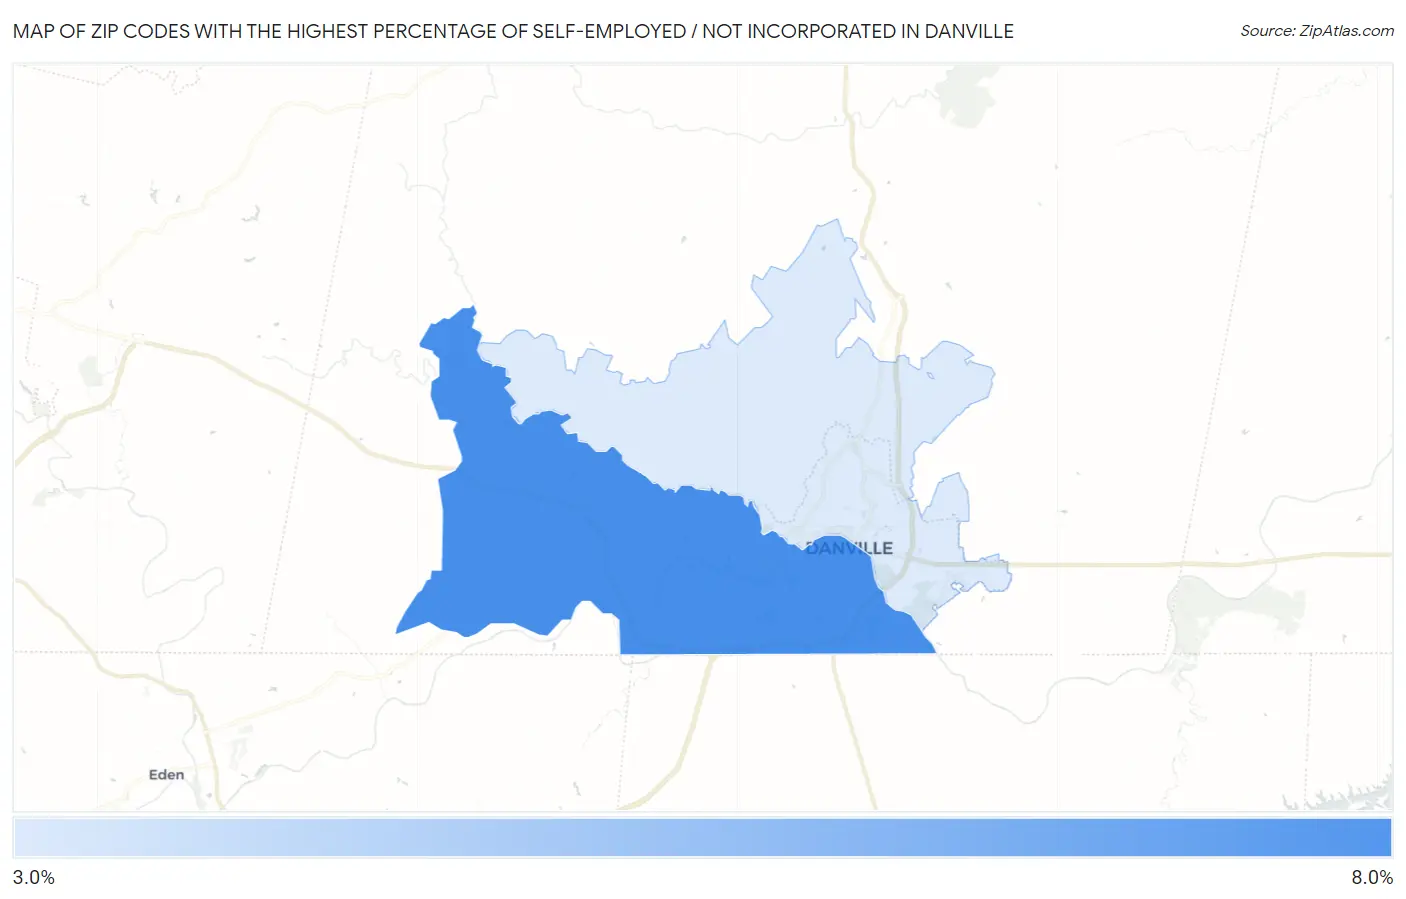
Map of Zip Codes with the Highest Percentage of Self-Employed / Not Incorporated in Danville
0.0%
8.0%
Zip Codes with the Highest Percentage of Self-Employed / Not Incorporated in Danville, VA
| Zip Code | % Self-Employed / Not Incorporated | vs State | vs National | |
| 1. | 24541 | 7.6% | 4.7%(+2.86)#213 | 5.8%(+1.74)#11,644 |
| 2. | 24540 | 3.8% | 4.7%(-0.879)#544 | 5.8%(-2.00)#24,027 |
1
Common Questions
What are the Top Zip Codes with the Highest Percentage of Self-Employed / Not Incorporated in Danville, VA?
Top Zip Codes with the Highest Percentage of Self-Employed / Not Incorporated in Danville, VA are:
What zip code has the Highest Percentage of Self-Employed / Not Incorporated in Danville, VA?
24541 has the Highest Percentage of Self-Employed / Not Incorporated in Danville, VA with 7.6%.
What is the Percentage of Self-Employed / Not Incorporated in Danville, VA?
Percentage of Self-Employed / Not Incorporated in Danville is 5.3%.
What is the Percentage of Self-Employed / Not Incorporated in Virginia?
Percentage of Self-Employed / Not Incorporated in Virginia is 4.7%.
What is the Percentage of Self-Employed / Not Incorporated in the United States?
Percentage of Self-Employed / Not Incorporated in the United States is 5.8%.