Zip Codes with the Highest Percentage of Population Employed in Arts, Entertainment & Recreation in Warrenton, VA
RELATED REPORTS & OPTIONS
Arts, Entertainment & Recreation
Warrenton
Compare Zip Codes
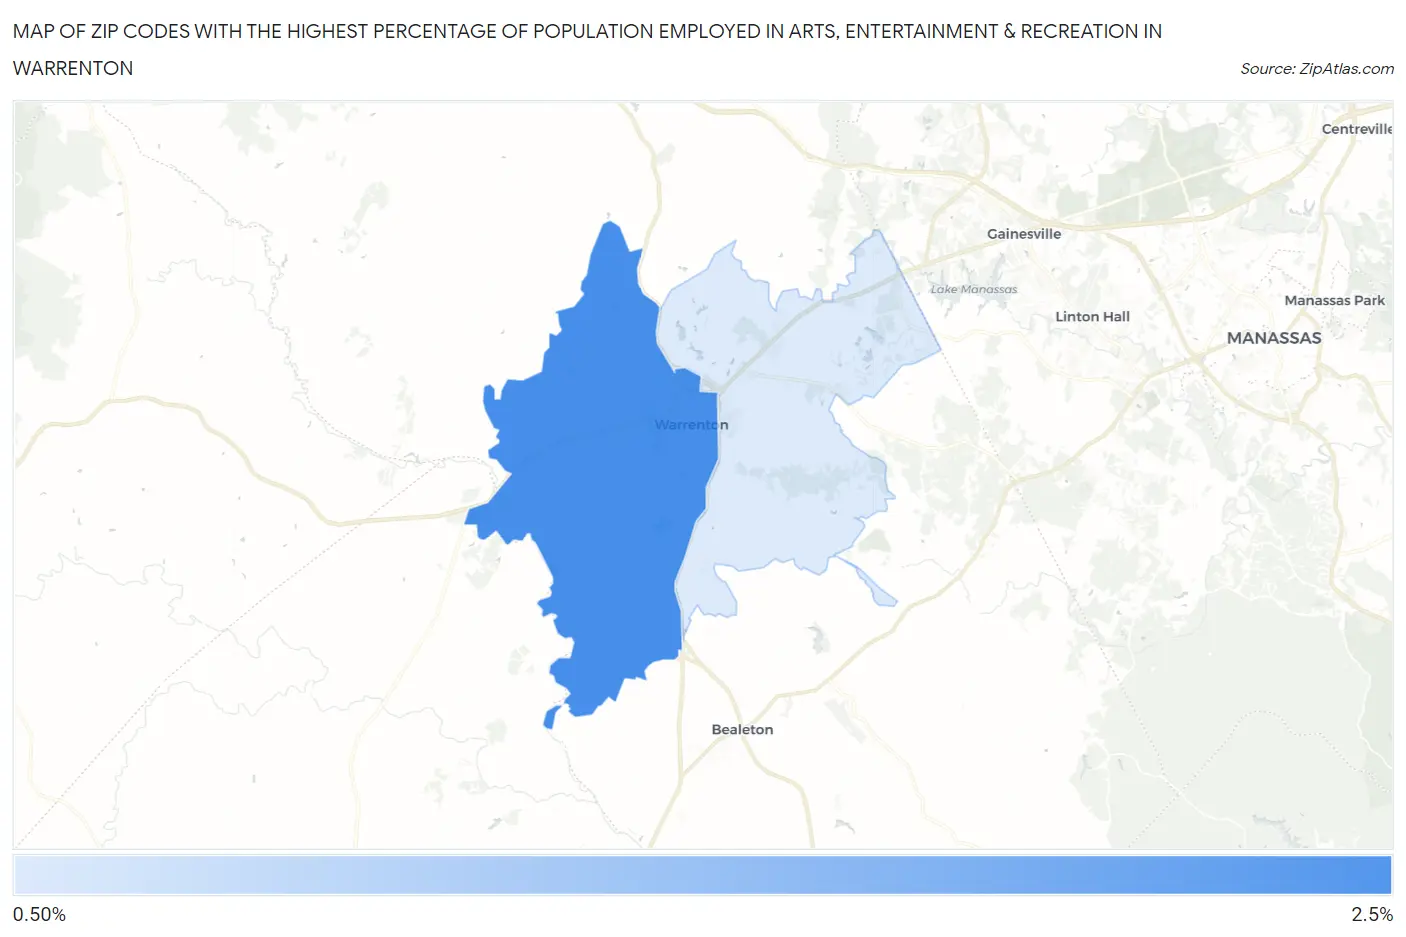
Map of Zip Codes with the Highest Percentage of Population Employed in Arts, Entertainment & Recreation in Warrenton
0.81%
2.5%
Zip Codes with the Highest Percentage of Population Employed in Arts, Entertainment & Recreation in Warrenton, VA
| Zip Code | % Employed | vs State | vs National | |
| 1. | 20186 | 2.5% | 1.9%(+0.613)#172 | 2.1%(+0.381)#7,339 |
| 2. | 20187 | 0.81% | 1.9%(-1.04)#469 | 2.1%(-1.28)#18,351 |
1
Common Questions
What are the Top Zip Codes with the Highest Percentage of Population Employed in Arts, Entertainment & Recreation in Warrenton, VA?
Top Zip Codes with the Highest Percentage of Population Employed in Arts, Entertainment & Recreation in Warrenton, VA are:
What zip code has the Highest Percentage of Population Employed in Arts, Entertainment & Recreation in Warrenton, VA?
20186 has the Highest Percentage of Population Employed in Arts, Entertainment & Recreation in Warrenton, VA with 2.5%.
What is the Percentage of Population Employed in Arts, Entertainment & Recreation in Warrenton, VA?
Percentage of Population Employed in Arts, Entertainment & Recreation in Warrenton is 2.9%.
What is the Percentage of Population Employed in Arts, Entertainment & Recreation in Virginia?
Percentage of Population Employed in Arts, Entertainment & Recreation in Virginia is 1.9%.
What is the Percentage of Population Employed in Arts, Entertainment & Recreation in the United States?
Percentage of Population Employed in Arts, Entertainment & Recreation in the United States is 2.1%.