Zip Codes with the Highest Percentage of Population with a Degree in Engineering in Warrenton, VA
RELATED REPORTS & OPTIONS
Engineering
Warrenton
Compare Zip Codes
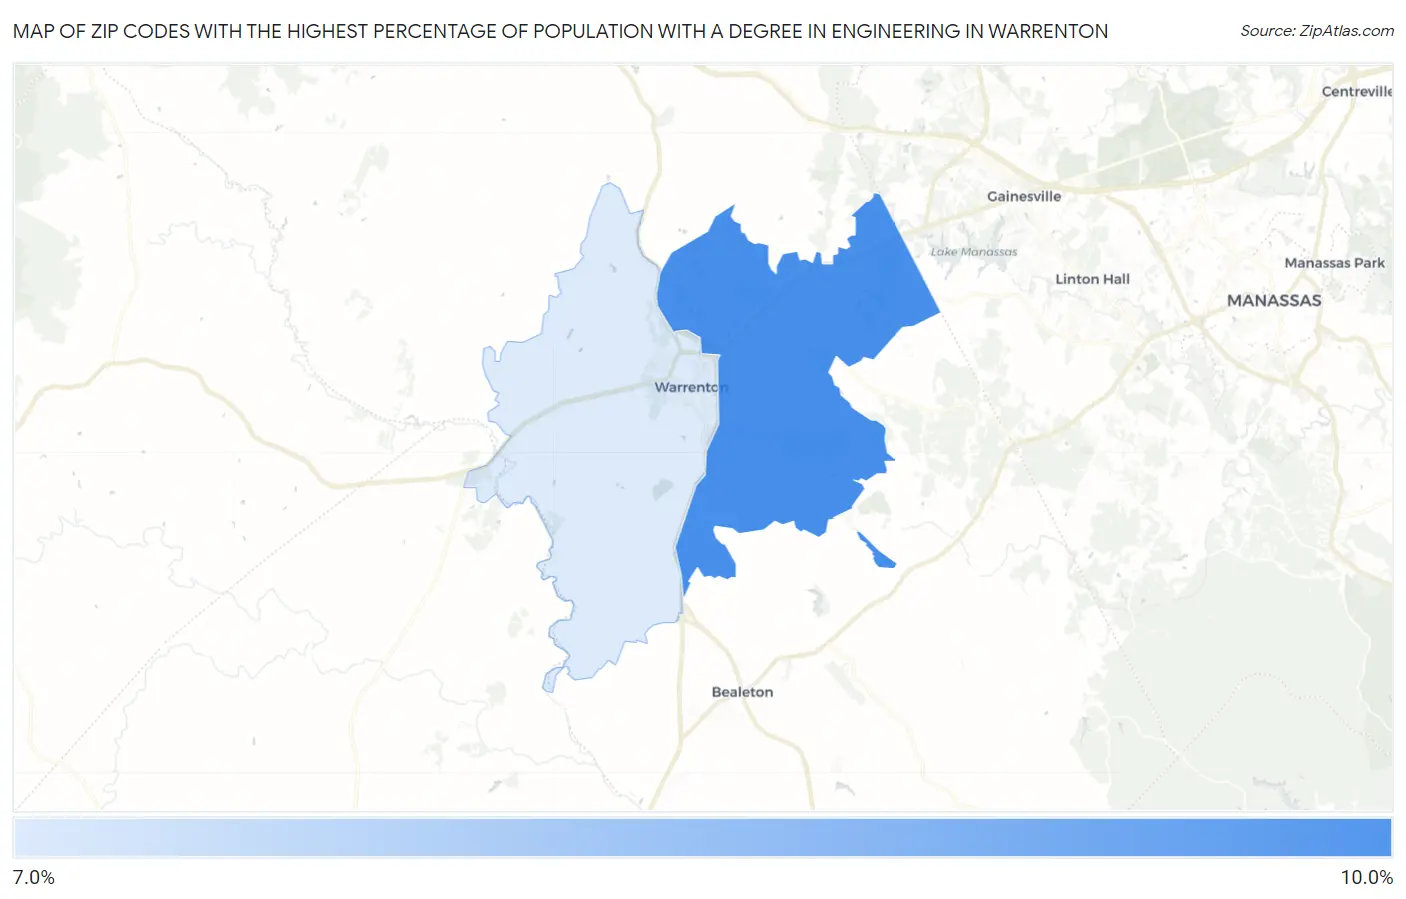
Map of Zip Codes with the Highest Percentage of Population with a Degree in Engineering in Warrenton
7.6%
9.1%
Zip Codes with the Highest Percentage of Population with a Degree in Engineering in Warrenton, VA
| Zip Code | % Graduates | vs State | vs National | |
| 1. | 20187 | 9.1% | 7.9%(+1.19)#163 | 7.6%(+1.48)#5,411 |
| 2. | 20186 | 7.6% | 7.9%(-0.375)#236 | 7.6%(-0.083)#7,886 |
1
Common Questions
What are the Top Zip Codes with the Highest Percentage of Population with a Degree in Engineering in Warrenton, VA?
Top Zip Codes with the Highest Percentage of Population with a Degree in Engineering in Warrenton, VA are:
What zip code has the Highest Percentage of Population with a Degree in Engineering in Warrenton, VA?
20187 has the Highest Percentage of Population with a Degree in Engineering in Warrenton, VA with 9.1%.
What is the Percentage of Population with a Degree in Engineering in Warrenton, VA?
Percentage of Population with a Degree in Engineering in Warrenton is 5.9%.
What is the Percentage of Population with a Degree in Engineering in Virginia?
Percentage of Population with a Degree in Engineering in Virginia is 7.9%.
What is the Percentage of Population with a Degree in Engineering in the United States?
Percentage of Population with a Degree in Engineering in the United States is 7.6%.