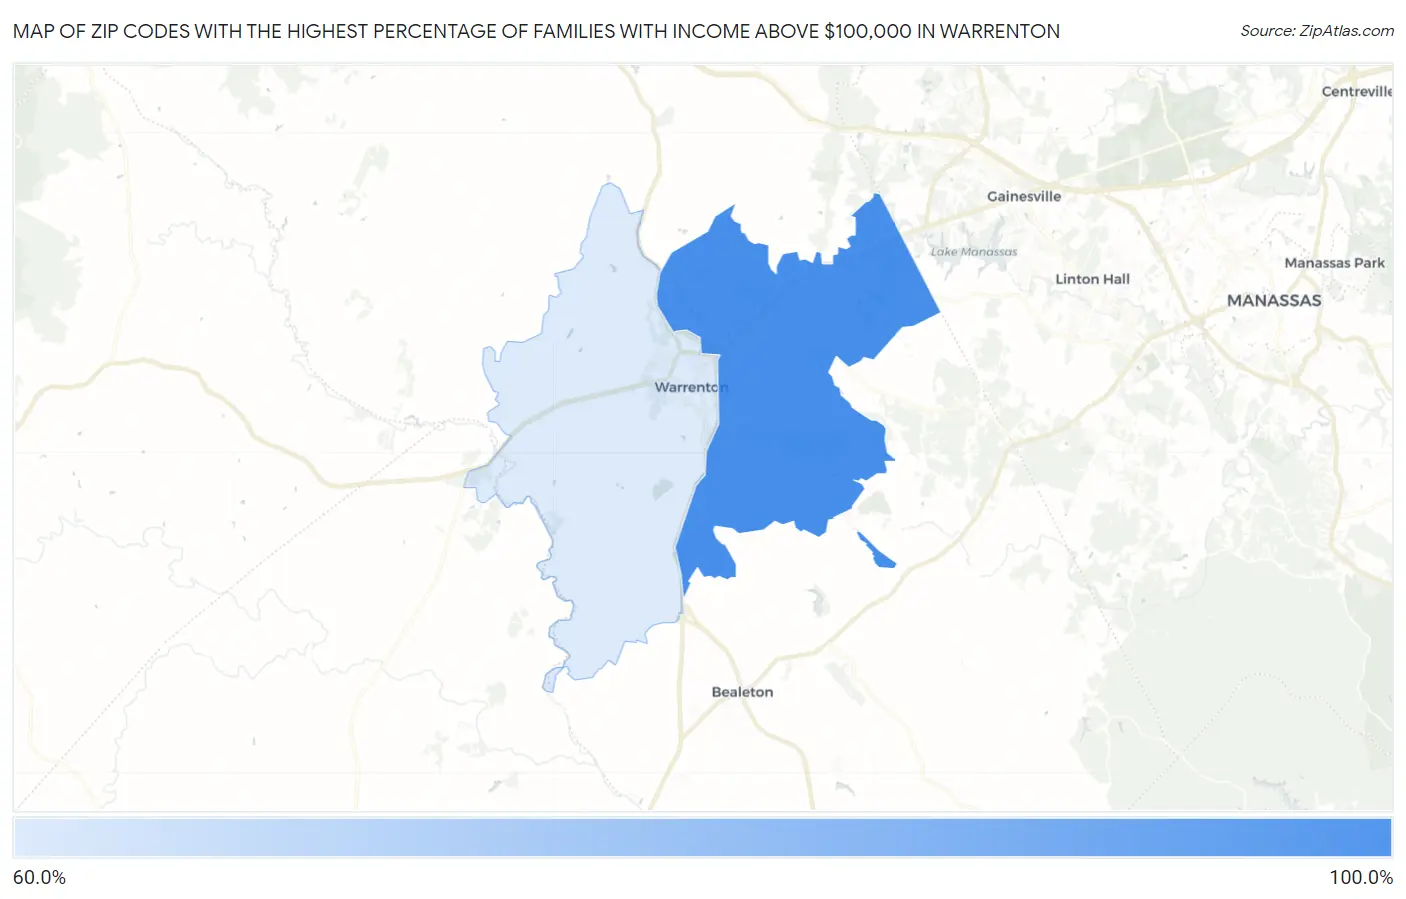
Zip Codes with the Highest Percentage of Families with Income Above $100,000 in Warrenton, VA
RELATED REPORTS & OPTIONS
Family Income | $100k+
Warrenton
Compare Zip Codes
Map of Zip Codes with the Highest Percentage of Families with Income Above $100,000 in Warrenton
63.1%
81.9%
Zip Codes with the Highest Percentage of Families with Income Above $100,000 in Warrenton, VA
| Zip Code | Families with Income > $100k | vs State | vs National | |
| 1. | 20187 | 81.9% | 53.6%(+28.3)#44 | 46.1%(+35.8)#814 |
| 2. | 20186 | 63.1% | 53.6%(+9.50)#159 | 46.1%(+17.0)#4,258 |
1
Common Questions
What are the Top Zip Codes with the Highest Percentage of Families with Income Above $100,000 in Warrenton, VA?
Top Zip Codes with the Highest Percentage of Families with Income Above $100,000 in Warrenton, VA are:
What zip code has the Highest Percentage of Families with Income Above $100,000 in Warrenton, VA?
20187 has the Highest Percentage of Families with Income Above $100,000 in Warrenton, VA with 81.9%.
What is the Percentage of Families with Income Above $100,000 in Warrenton, VA?
Percentage of Families with Income Above $100,000 in Warrenton is 59.9%.
What is the Percentage of Families with Income Above $100,000 in Virginia?
Percentage of Families with Income Above $100,000 in Virginia is 53.6%.
What is the Percentage of Families with Income Above $100,000 in the United States?
Percentage of Families with Income Above $100,000 in the United States is 46.1%.