Honduran vs French Canadian Unemployment Among Women with Children Ages 6 to 17 years
COMPARE
Honduran
French Canadian
Unemployment Among Women with Children Ages 6 to 17 years
Unemployment Among Women with Children Ages 6 to 17 years Comparison
Hondurans
French Canadians
10.0%
UNEMPLOYMENT AMONG WOMEN WITH CHILDREN AGES 6 TO 17 YEARS
0.0/ 100
METRIC RATING
289th/ 347
METRIC RANK
10.3%
UNEMPLOYMENT AMONG WOMEN WITH CHILDREN AGES 6 TO 17 YEARS
0.0/ 100
METRIC RATING
309th/ 347
METRIC RANK
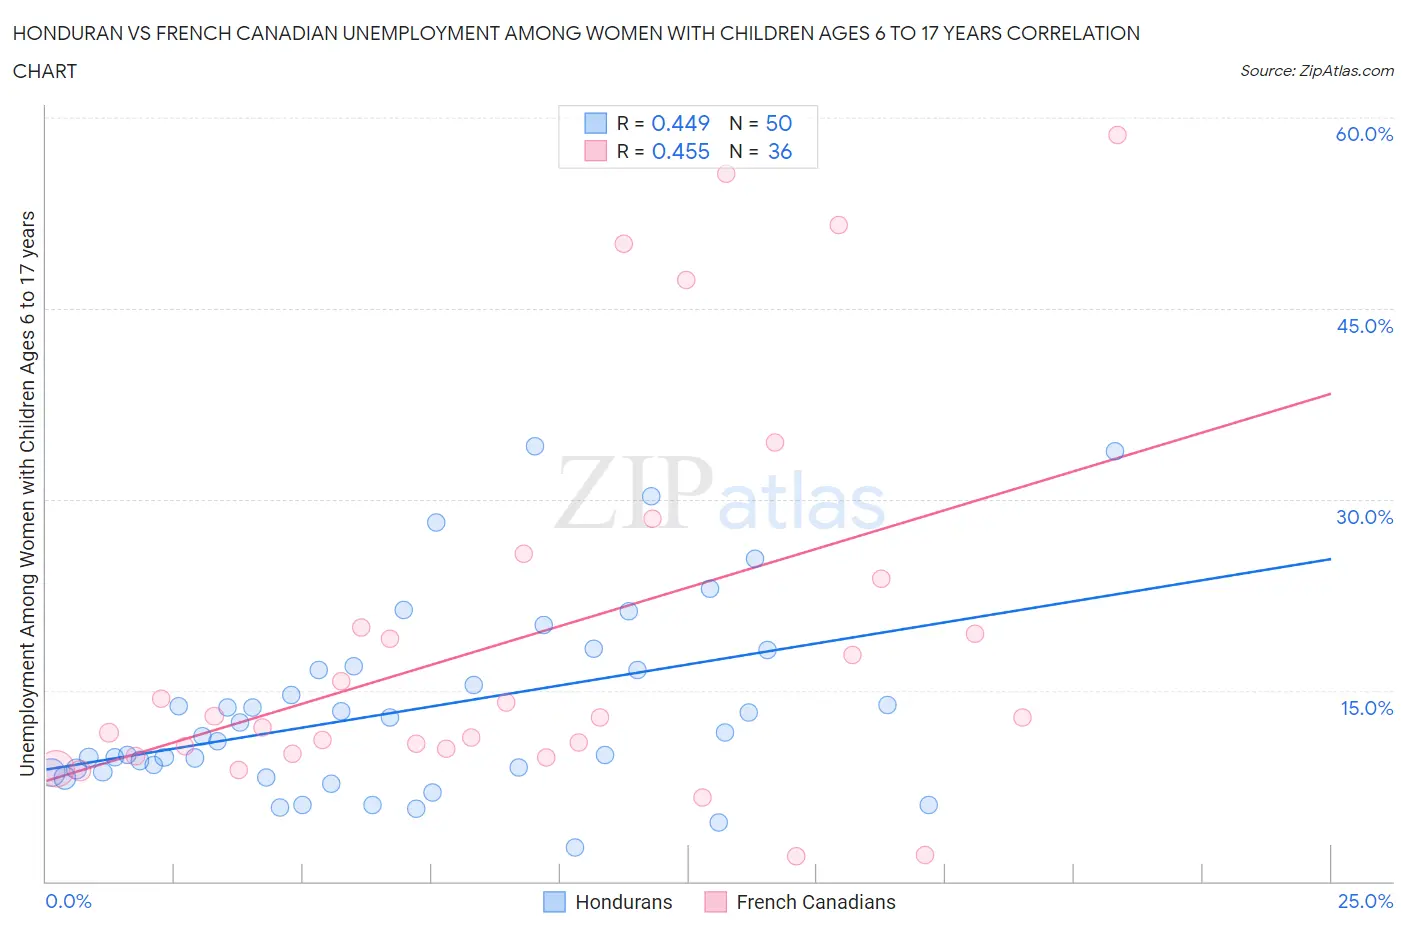
Honduran vs French Canadian Unemployment Among Women with Children Ages 6 to 17 years Correlation Chart
The statistical analysis conducted on geographies consisting of 273,347,918 people shows a moderate positive correlation between the proportion of Hondurans and unemployment rate among women with children between the ages 6 and 17 in the United States with a correlation coefficient (R) of 0.449 and weighted average of 10.0%. Similarly, the statistical analysis conducted on geographies consisting of 329,058,978 people shows a moderate positive correlation between the proportion of French Canadians and unemployment rate among women with children between the ages 6 and 17 in the United States with a correlation coefficient (R) of 0.455 and weighted average of 10.3%, a difference of 3.0%.
Unemployment Among Women with Children Ages 6 to 17 years Correlation Summary
| Measurement | Honduran | French Canadian |
| Minimum | 2.7% | 2.0% |
| Maximum | 34.2% | 58.6% |
| Range | 31.5% | 56.6% |
| Mean | 13.5% | 19.2% |
| Median | 11.6% | 12.9% |
| Interquartile 25% (IQ1) | 8.6% | 10.2% |
| Interquartile 75% (IQ3) | 16.6% | 21.8% |
| Interquartile Range (IQR) | 8.0% | 11.6% |
| Standard Deviation (Sample) | 7.4% | 15.2% |
| Standard Deviation (Population) | 7.3% | 15.0% |
Demographics Similar to Hondurans and French Canadians by Unemployment Among Women with Children Ages 6 to 17 years
In terms of unemployment among women with children ages 6 to 17 years, the demographic groups most similar to Hondurans are Subsaharan African (10.0%, a difference of 0.010%), Nonimmigrants (10.0%, a difference of 0.040%), Carpatho Rusyn (10.0%, a difference of 0.050%), Haitian (10.0%, a difference of 0.14%), and Ecuadorian (10.0%, a difference of 0.23%). Similarly, the demographic groups most similar to French Canadians are Dutch West Indian (10.2%, a difference of 0.54%), Immigrants from Senegal (10.2%, a difference of 0.55%), Paraguayan (10.2%, a difference of 0.78%), Immigrants from Nigeria (10.2%, a difference of 1.1%), and Immigrants from Venezuela (10.2%, a difference of 1.1%).
| Demographics | Rating | Rank | Unemployment Among Women with Children Ages 6 to 17 years |
| Hondurans | 0.0 /100 | #289 | Tragic 10.0% |
| Sub-Saharan Africans | 0.0 /100 | #290 | Tragic 10.0% |
| Immigrants | Nonimmigrants | 0.0 /100 | #291 | Tragic 10.0% |
| Carpatho Rusyns | 0.0 /100 | #292 | Tragic 10.0% |
| Haitians | 0.0 /100 | #293 | Tragic 10.0% |
| Ecuadorians | 0.0 /100 | #294 | Tragic 10.0% |
| Cherokee | 0.0 /100 | #295 | Tragic 10.0% |
| Immigrants | Western Africa | 0.0 /100 | #296 | Tragic 10.1% |
| Immigrants | Caribbean | 0.0 /100 | #297 | Tragic 10.1% |
| Immigrants | Haiti | 0.0 /100 | #298 | Tragic 10.1% |
| Immigrants | Honduras | 0.0 /100 | #299 | Tragic 10.1% |
| Nigerians | 0.0 /100 | #300 | Tragic 10.1% |
| Immigrants | Bahamas | 0.0 /100 | #301 | Tragic 10.1% |
| Venezuelans | 0.0 /100 | #302 | Tragic 10.2% |
| Immigrants | Ecuador | 0.0 /100 | #303 | Tragic 10.2% |
| Immigrants | Venezuela | 0.0 /100 | #304 | Tragic 10.2% |
| Immigrants | Nigeria | 0.0 /100 | #305 | Tragic 10.2% |
| Paraguayans | 0.0 /100 | #306 | Tragic 10.2% |
| Immigrants | Senegal | 0.0 /100 | #307 | Tragic 10.2% |
| Dutch West Indians | 0.0 /100 | #308 | Tragic 10.2% |
| French Canadians | 0.0 /100 | #309 | Tragic 10.3% |