Honduran vs Immigrants from Belgium Unemployment Among Women with Children Ages 6 to 17 years
COMPARE
Honduran
Immigrants from Belgium
Unemployment Among Women with Children Ages 6 to 17 years
Unemployment Among Women with Children Ages 6 to 17 years Comparison
Hondurans
Immigrants from Belgium
10.0%
UNEMPLOYMENT AMONG WOMEN WITH CHILDREN AGES 6 TO 17 YEARS
0.0/ 100
METRIC RATING
289th/ 347
METRIC RANK
8.9%
UNEMPLOYMENT AMONG WOMEN WITH CHILDREN AGES 6 TO 17 YEARS
65.6/ 100
METRIC RATING
157th/ 347
METRIC RANK
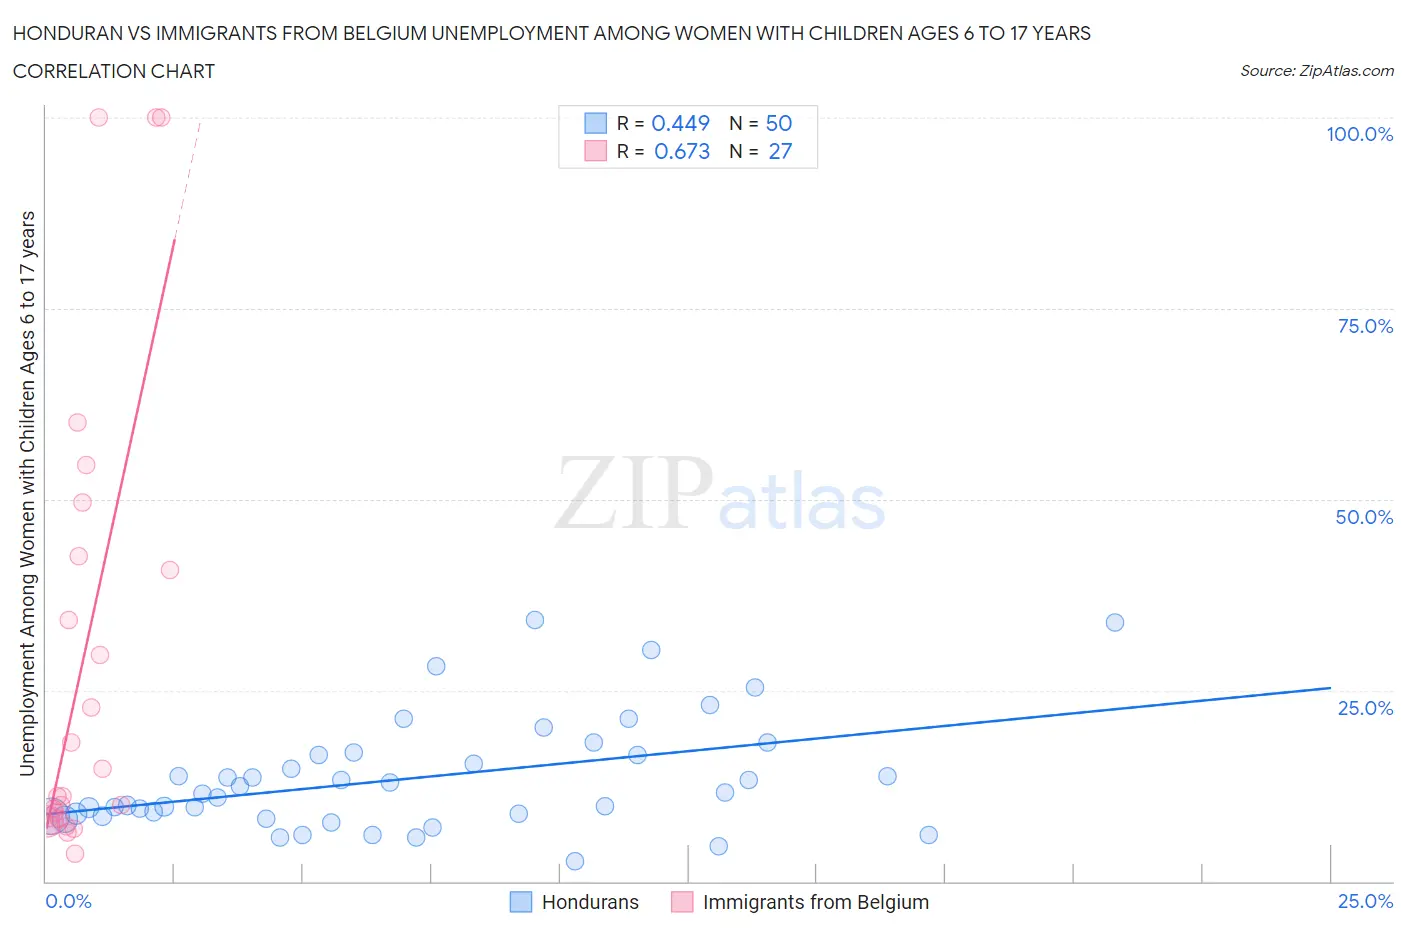
Honduran vs Immigrants from Belgium Unemployment Among Women with Children Ages 6 to 17 years Correlation Chart
The statistical analysis conducted on geographies consisting of 273,347,918 people shows a moderate positive correlation between the proportion of Hondurans and unemployment rate among women with children between the ages 6 and 17 in the United States with a correlation coefficient (R) of 0.449 and weighted average of 10.0%. Similarly, the statistical analysis conducted on geographies consisting of 120,848,213 people shows a significant positive correlation between the proportion of Immigrants from Belgium and unemployment rate among women with children between the ages 6 and 17 in the United States with a correlation coefficient (R) of 0.673 and weighted average of 8.9%, a difference of 12.4%.
Unemployment Among Women with Children Ages 6 to 17 years Correlation Summary
| Measurement | Honduran | Immigrants from Belgium |
| Minimum | 2.7% | 3.7% |
| Maximum | 34.2% | 100.0% |
| Range | 31.5% | 96.3% |
| Mean | 13.5% | 29.0% |
| Median | 11.6% | 11.1% |
| Interquartile 25% (IQ1) | 8.6% | 8.2% |
| Interquartile 75% (IQ3) | 16.6% | 42.5% |
| Interquartile Range (IQR) | 8.0% | 34.3% |
| Standard Deviation (Sample) | 7.4% | 30.3% |
| Standard Deviation (Population) | 7.3% | 29.8% |
Similar Demographics by Unemployment Among Women with Children Ages 6 to 17 years
Demographics Similar to Hondurans by Unemployment Among Women with Children Ages 6 to 17 years
In terms of unemployment among women with children ages 6 to 17 years, the demographic groups most similar to Hondurans are Subsaharan African (10.0%, a difference of 0.010%), Nonimmigrants (10.0%, a difference of 0.040%), Carpatho Rusyn (10.0%, a difference of 0.050%), Haitian (10.0%, a difference of 0.14%), and Ecuadorian (10.0%, a difference of 0.23%).
| Demographics | Rating | Rank | Unemployment Among Women with Children Ages 6 to 17 years |
| Slovaks | 0.0 /100 | #282 | Tragic 9.8% |
| Central American Indians | 0.0 /100 | #283 | Tragic 9.9% |
| Yakama | 0.0 /100 | #284 | Tragic 9.9% |
| Hispanics or Latinos | 0.0 /100 | #285 | Tragic 9.9% |
| Choctaw | 0.0 /100 | #286 | Tragic 9.9% |
| Sierra Leoneans | 0.0 /100 | #287 | Tragic 9.9% |
| Shoshone | 0.0 /100 | #288 | Tragic 10.0% |
| Hondurans | 0.0 /100 | #289 | Tragic 10.0% |
| Sub-Saharan Africans | 0.0 /100 | #290 | Tragic 10.0% |
| Immigrants | Nonimmigrants | 0.0 /100 | #291 | Tragic 10.0% |
| Carpatho Rusyns | 0.0 /100 | #292 | Tragic 10.0% |
| Haitians | 0.0 /100 | #293 | Tragic 10.0% |
| Ecuadorians | 0.0 /100 | #294 | Tragic 10.0% |
| Cherokee | 0.0 /100 | #295 | Tragic 10.0% |
| Immigrants | Western Africa | 0.0 /100 | #296 | Tragic 10.1% |
Demographics Similar to Immigrants from Belgium by Unemployment Among Women with Children Ages 6 to 17 years
In terms of unemployment among women with children ages 6 to 17 years, the demographic groups most similar to Immigrants from Belgium are Osage (8.9%, a difference of 0.010%), Immigrants from Chile (8.9%, a difference of 0.010%), Spanish (8.9%, a difference of 0.090%), Immigrants from Hungary (8.9%, a difference of 0.11%), and Immigrants from Guyana (8.9%, a difference of 0.13%).
| Demographics | Rating | Rank | Unemployment Among Women with Children Ages 6 to 17 years |
| Greeks | 75.2 /100 | #150 | Good 8.9% |
| Immigrants | Eastern Africa | 74.6 /100 | #151 | Good 8.9% |
| Immigrants | Northern Europe | 74.6 /100 | #152 | Good 8.9% |
| Immigrants | Europe | 73.4 /100 | #153 | Good 8.9% |
| Vietnamese | 72.1 /100 | #154 | Good 8.9% |
| Immigrants | Greece | 71.8 /100 | #155 | Good 8.9% |
| Osage | 65.9 /100 | #156 | Good 8.9% |
| Immigrants | Belgium | 65.6 /100 | #157 | Good 8.9% |
| Immigrants | Chile | 65.3 /100 | #158 | Good 8.9% |
| Spanish | 63.8 /100 | #159 | Good 8.9% |
| Immigrants | Hungary | 63.4 /100 | #160 | Good 8.9% |
| Immigrants | Guyana | 63.0 /100 | #161 | Good 8.9% |
| Immigrants | Netherlands | 60.8 /100 | #162 | Good 8.9% |
| Mexican American Indians | 60.6 /100 | #163 | Good 8.9% |
| Ukrainians | 59.7 /100 | #164 | Average 8.9% |