Zip Codes with the Highest Percentage of Population with a Degree in Visual and Performing Arts in Sevierville, TN
RELATED REPORTS & OPTIONS
Visual and Performing Arts
Sevierville
Compare Zip Codes
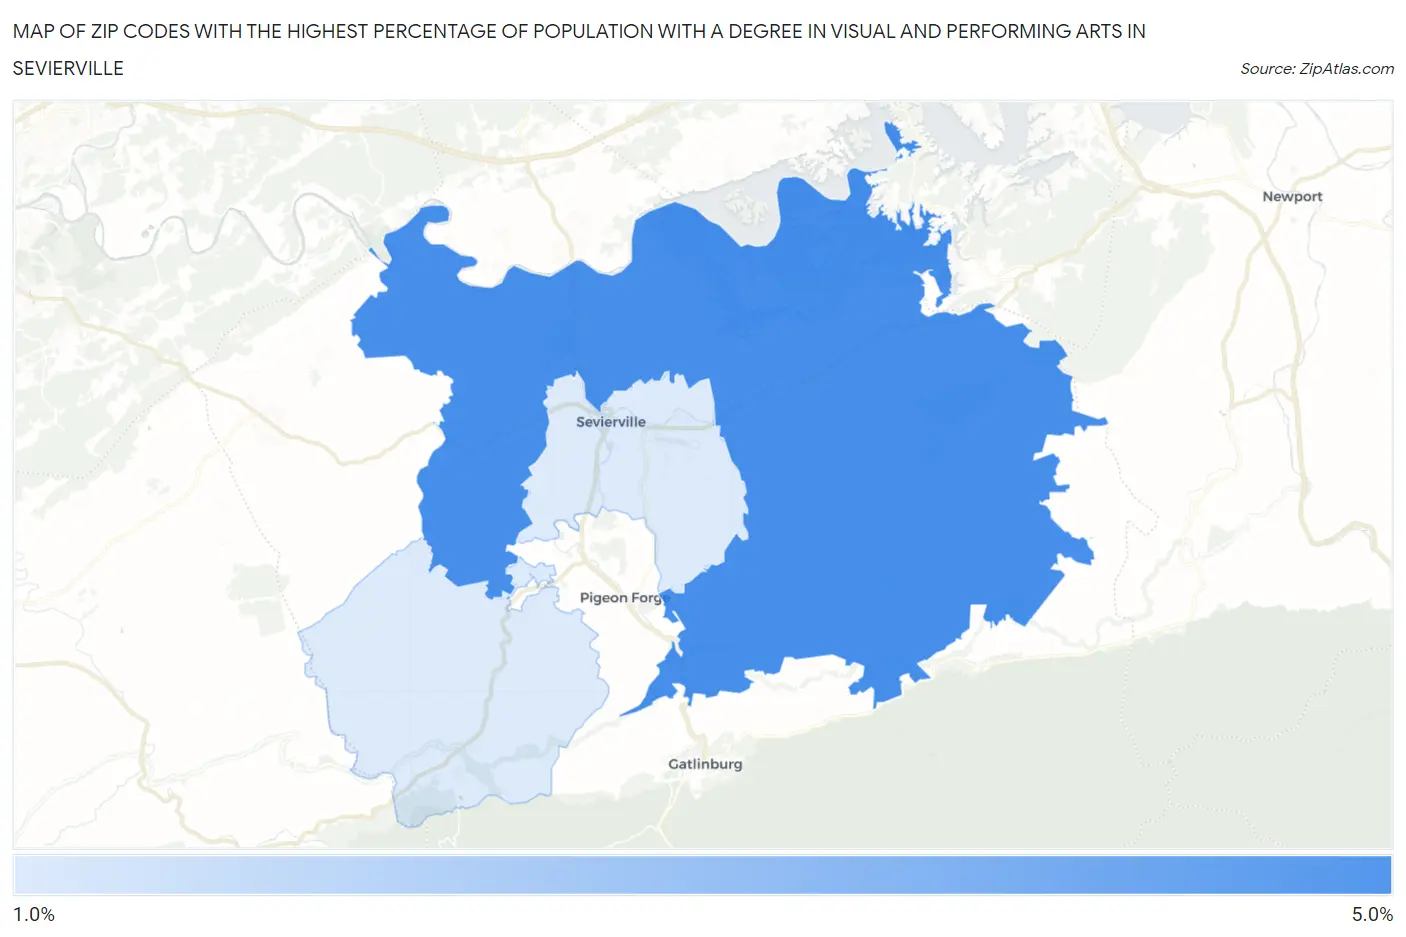
Map of Zip Codes with the Highest Percentage of Population with a Degree in Visual and Performing Arts in Sevierville
1.9%
4.9%
Zip Codes with the Highest Percentage of Population with a Degree in Visual and Performing Arts in Sevierville, TN
| Zip Code | % Graduates | vs State | vs National | |
| 1. | 37876 | 4.9% | 4.1%(+0.876)#142 | 4.3%(+0.689)#6,781 |
| 2. | 37862 | 1.9% | 4.1%(-2.21)#308 | 4.3%(-2.40)#16,944 |
1
Common Questions
What are the Top Zip Codes with the Highest Percentage of Population with a Degree in Visual and Performing Arts in Sevierville, TN?
Top Zip Codes with the Highest Percentage of Population with a Degree in Visual and Performing Arts in Sevierville, TN are:
What zip code has the Highest Percentage of Population with a Degree in Visual and Performing Arts in Sevierville, TN?
37876 has the Highest Percentage of Population with a Degree in Visual and Performing Arts in Sevierville, TN with 4.9%.
What is the Percentage of Population with a Degree in Visual and Performing Arts in Sevierville, TN?
Percentage of Population with a Degree in Visual and Performing Arts in Sevierville is 3.5%.
What is the Percentage of Population with a Degree in Visual and Performing Arts in Tennessee?
Percentage of Population with a Degree in Visual and Performing Arts in Tennessee is 4.1%.
What is the Percentage of Population with a Degree in Visual and Performing Arts in the United States?
Percentage of Population with a Degree in Visual and Performing Arts in the United States is 4.3%.