Zip Codes with the Highest Percentage of Population Employed in Arts, Entertainment & Recreation in Sevierville, TN
RELATED REPORTS & OPTIONS
Arts, Entertainment & Recreation
Sevierville
Compare Zip Codes
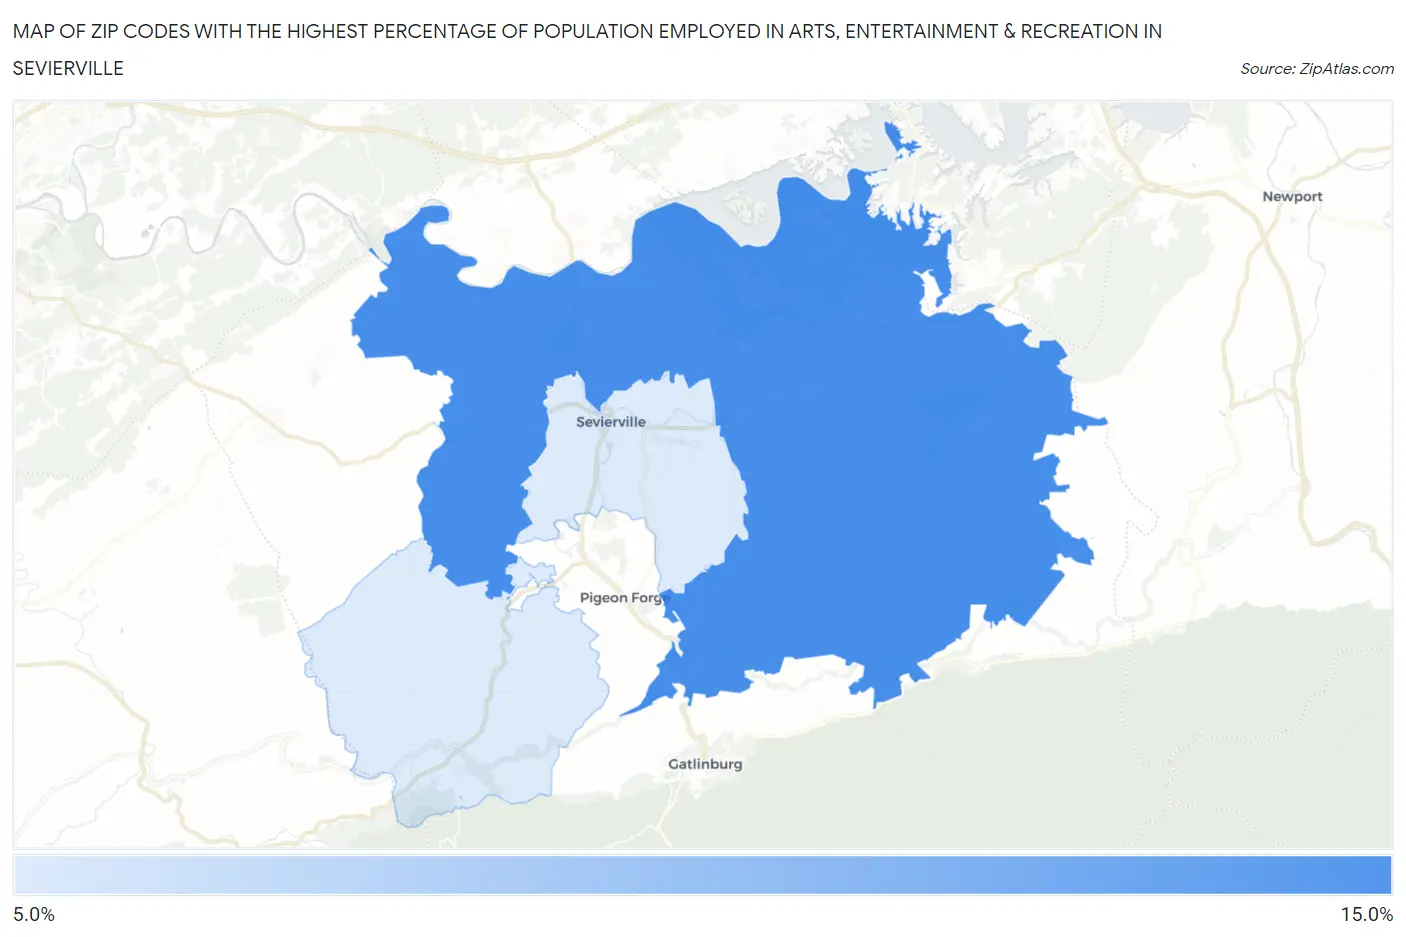
Map of Zip Codes with the Highest Percentage of Population Employed in Arts, Entertainment & Recreation in Sevierville
7.5%
10.3%
Zip Codes with the Highest Percentage of Population Employed in Arts, Entertainment & Recreation in Sevierville, TN
| Zip Code | % Employed | vs State | vs National | |
| 1. | 37876 | 10.3% | 1.8%(+8.50)#8 | 2.1%(+8.20)#668 |
| 2. | 37862 | 7.5% | 1.8%(+5.70)#16 | 2.1%(+5.40)#1,181 |
1
Common Questions
What are the Top Zip Codes with the Highest Percentage of Population Employed in Arts, Entertainment & Recreation in Sevierville, TN?
Top Zip Codes with the Highest Percentage of Population Employed in Arts, Entertainment & Recreation in Sevierville, TN are:
What zip code has the Highest Percentage of Population Employed in Arts, Entertainment & Recreation in Sevierville, TN?
37876 has the Highest Percentage of Population Employed in Arts, Entertainment & Recreation in Sevierville, TN with 10.3%.
What is the Percentage of Population Employed in Arts, Entertainment & Recreation in Sevierville, TN?
Percentage of Population Employed in Arts, Entertainment & Recreation in Sevierville is 5.2%.
What is the Percentage of Population Employed in Arts, Entertainment & Recreation in Tennessee?
Percentage of Population Employed in Arts, Entertainment & Recreation in Tennessee is 1.8%.
What is the Percentage of Population Employed in Arts, Entertainment & Recreation in the United States?
Percentage of Population Employed in Arts, Entertainment & Recreation in the United States is 2.1%.