Seminole vs Immigrants from Brazil Receiving Food Stamps
COMPARE
Seminole
Immigrants from Brazil
Receiving Food Stamps
Receiving Food Stamps Comparison
Seminole
Immigrants from Brazil
14.8%
RECEIVING FOOD STAMPS
0.1/ 100
METRIC RATING
277th/ 347
METRIC RANK
10.8%
RECEIVING FOOD STAMPS
90.3/ 100
METRIC RATING
134th/ 347
METRIC RANK
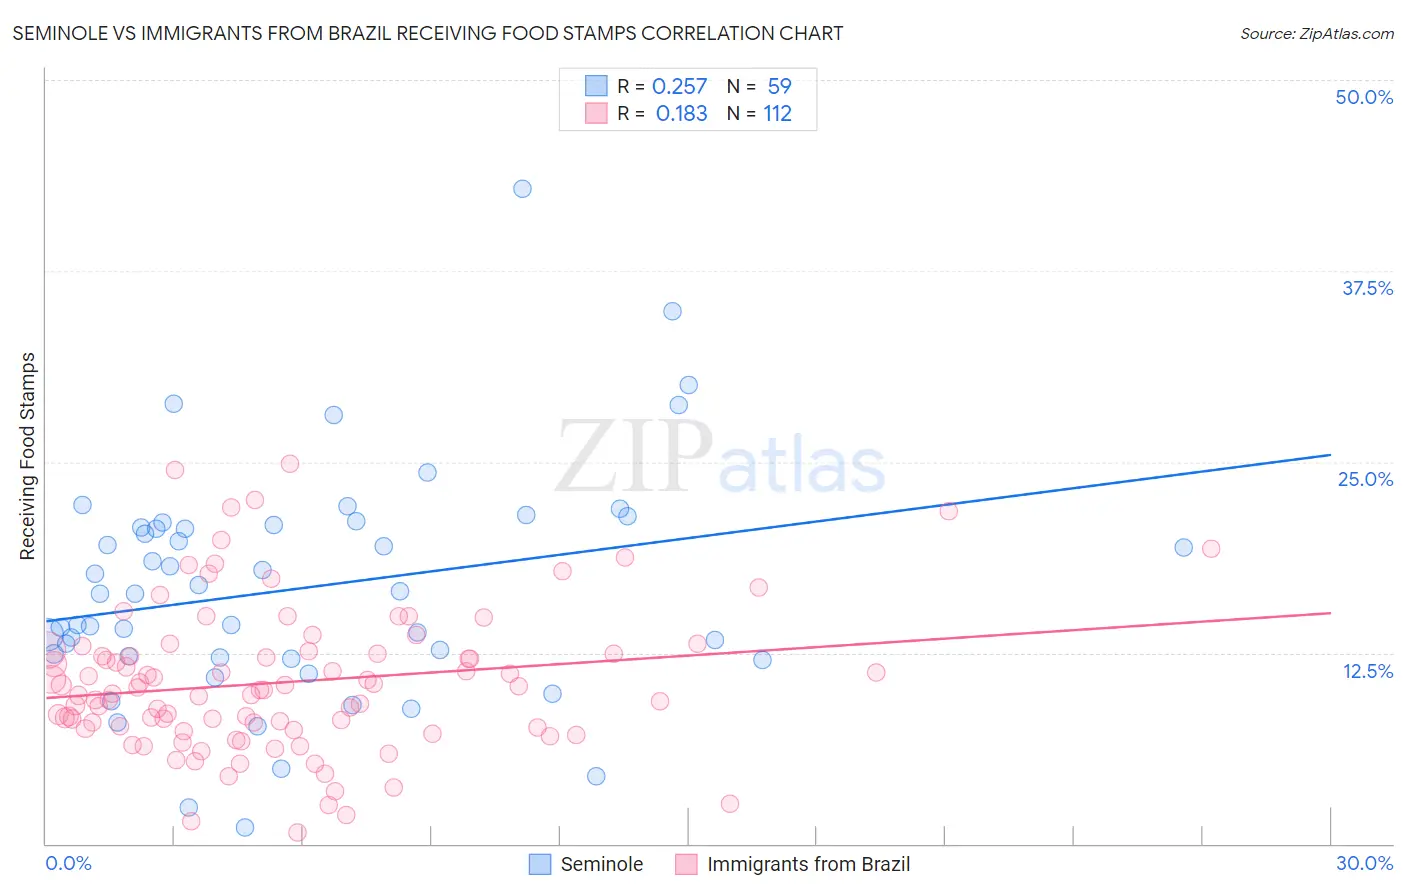
Seminole vs Immigrants from Brazil Receiving Food Stamps Correlation Chart
The statistical analysis conducted on geographies consisting of 118,279,359 people shows a weak positive correlation between the proportion of Seminole and percentage of population receiving government assistance and/or food stamps in the United States with a correlation coefficient (R) of 0.257 and weighted average of 14.8%. Similarly, the statistical analysis conducted on geographies consisting of 342,009,298 people shows a poor positive correlation between the proportion of Immigrants from Brazil and percentage of population receiving government assistance and/or food stamps in the United States with a correlation coefficient (R) of 0.183 and weighted average of 10.8%, a difference of 36.8%.
Receiving Food Stamps Correlation Summary
| Measurement | Seminole | Immigrants from Brazil |
| Minimum | 1.1% | 0.70% |
| Maximum | 42.9% | 24.9% |
| Range | 41.8% | 24.2% |
| Mean | 16.8% | 10.6% |
| Median | 16.4% | 10.1% |
| Interquartile 25% (IQ1) | 12.2% | 7.6% |
| Interquartile 75% (IQ3) | 20.9% | 12.5% |
| Interquartile Range (IQR) | 8.7% | 4.9% |
| Standard Deviation (Sample) | 7.6% | 4.8% |
| Standard Deviation (Population) | 7.5% | 4.8% |
Similar Demographics by Receiving Food Stamps
Demographics Similar to Seminole by Receiving Food Stamps
In terms of receiving food stamps, the demographic groups most similar to Seminole are Liberian (14.8%, a difference of 0.050%), Belizean (14.8%, a difference of 0.13%), Kiowa (14.9%, a difference of 0.40%), Ecuadorian (14.9%, a difference of 0.45%), and Ute (14.7%, a difference of 0.76%).
| Demographics | Rating | Rank | Receiving Food Stamps |
| Mexicans | 0.1 /100 | #270 | Tragic 14.6% |
| Immigrants | Guatemala | 0.1 /100 | #271 | Tragic 14.6% |
| Chippewa | 0.1 /100 | #272 | Tragic 14.7% |
| Alaskan Athabascans | 0.1 /100 | #273 | Tragic 14.7% |
| Immigrants | Western Africa | 0.1 /100 | #274 | Tragic 14.7% |
| Ute | 0.1 /100 | #275 | Tragic 14.7% |
| Liberians | 0.1 /100 | #276 | Tragic 14.8% |
| Seminole | 0.1 /100 | #277 | Tragic 14.8% |
| Belizeans | 0.1 /100 | #278 | Tragic 14.8% |
| Kiowa | 0.0 /100 | #279 | Tragic 14.9% |
| Ecuadorians | 0.0 /100 | #280 | Tragic 14.9% |
| Spanish American Indians | 0.0 /100 | #281 | Tragic 14.9% |
| Immigrants | Central America | 0.0 /100 | #282 | Tragic 15.0% |
| Bangladeshis | 0.0 /100 | #283 | Tragic 15.0% |
| Immigrants | Ecuador | 0.0 /100 | #284 | Tragic 15.0% |
Demographics Similar to Immigrants from Brazil by Receiving Food Stamps
In terms of receiving food stamps, the demographic groups most similar to Immigrants from Brazil are Argentinean (10.8%, a difference of 0.020%), Slovak (10.8%, a difference of 0.19%), Immigrants from Eastern Europe (10.8%, a difference of 0.21%), Immigrants from Russia (10.8%, a difference of 0.30%), and Immigrants from Moldova (10.9%, a difference of 0.72%).
| Demographics | Rating | Rank | Receiving Food Stamps |
| Immigrants | Ethiopia | 92.6 /100 | #127 | Exceptional 10.7% |
| Immigrants | Jordan | 92.5 /100 | #128 | Exceptional 10.7% |
| Yugoslavians | 92.5 /100 | #129 | Exceptional 10.7% |
| Israelis | 92.4 /100 | #130 | Exceptional 10.7% |
| French | 92.3 /100 | #131 | Exceptional 10.7% |
| Immigrants | Germany | 92.0 /100 | #132 | Exceptional 10.7% |
| Immigrants | Russia | 90.9 /100 | #133 | Exceptional 10.8% |
| Immigrants | Brazil | 90.3 /100 | #134 | Exceptional 10.8% |
| Argentineans | 90.2 /100 | #135 | Exceptional 10.8% |
| Slovaks | 89.8 /100 | #136 | Excellent 10.8% |
| Immigrants | Eastern Europe | 89.8 /100 | #137 | Excellent 10.8% |
| Immigrants | Moldova | 88.5 /100 | #138 | Excellent 10.9% |
| Hmong | 88.4 /100 | #139 | Excellent 10.9% |
| Celtics | 87.8 /100 | #140 | Excellent 10.9% |
| Immigrants | Vietnam | 86.7 /100 | #141 | Excellent 11.0% |