Guamanian/Chamorro vs Immigrants from Cabo Verde Child Poverty Under the Age of 5
COMPARE
Guamanian/Chamorro
Immigrants from Cabo Verde
Child Poverty Under the Age of 5
Child Poverty Under the Age of 5 Comparison
Guamanians/Chamorros
Immigrants from Cabo Verde
16.5%
CHILD POVERTY UNDER THE AGE OF 5
84.2/ 100
METRIC RATING
140th/ 347
METRIC RANK
19.5%
CHILD POVERTY UNDER THE AGE OF 5
0.6/ 100
METRIC RATING
237th/ 347
METRIC RANK
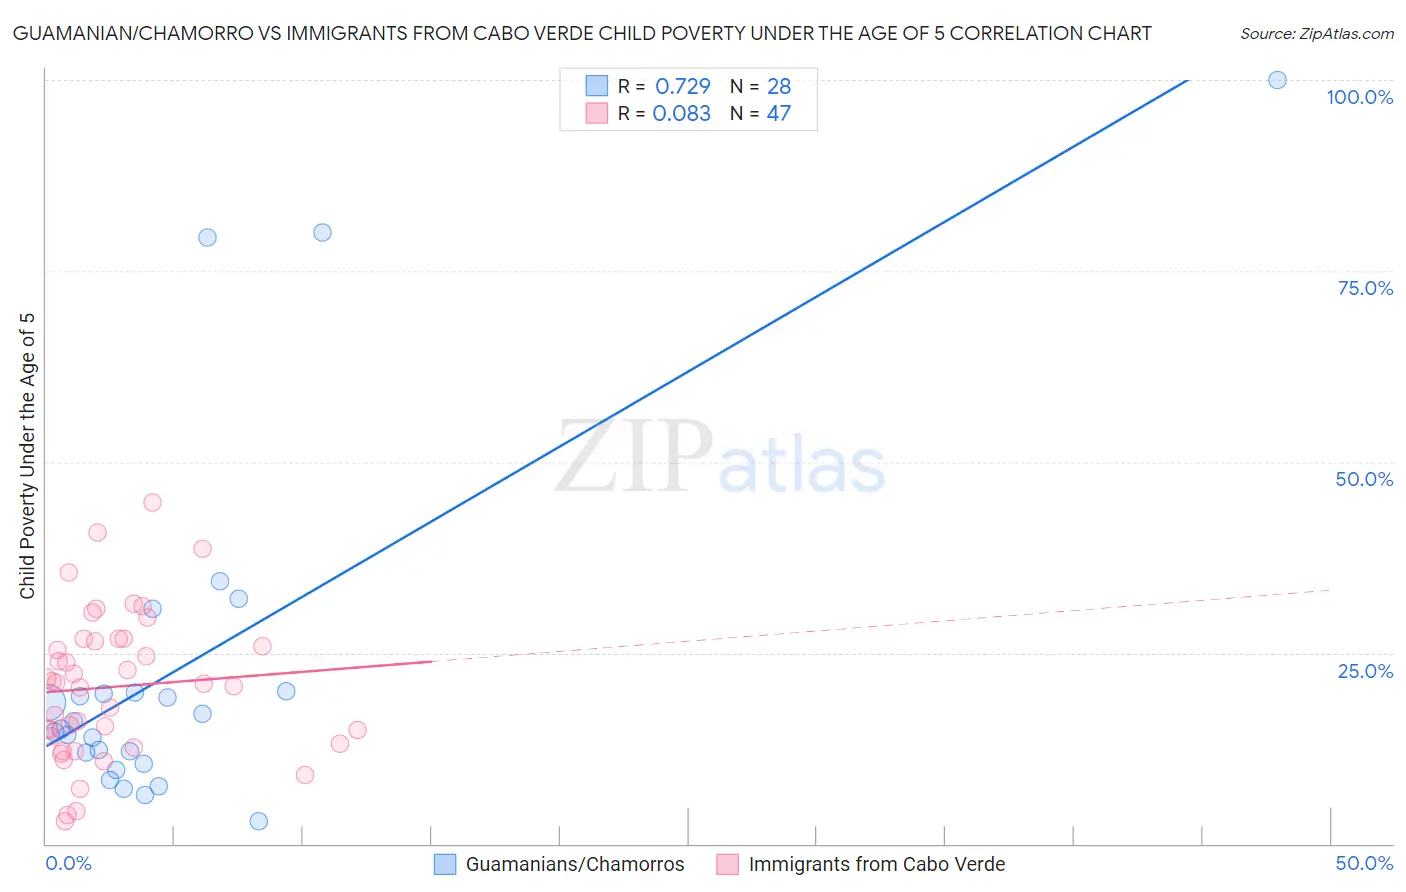
Guamanian/Chamorro vs Immigrants from Cabo Verde Child Poverty Under the Age of 5 Correlation Chart
The statistical analysis conducted on geographies consisting of 218,115,058 people shows a strong positive correlation between the proportion of Guamanians/Chamorros and poverty level among children under the age of 5 in the United States with a correlation coefficient (R) of 0.729 and weighted average of 16.5%. Similarly, the statistical analysis conducted on geographies consisting of 37,664,578 people shows a slight positive correlation between the proportion of Immigrants from Cabo Verde and poverty level among children under the age of 5 in the United States with a correlation coefficient (R) of 0.083 and weighted average of 19.5%, a difference of 18.3%.
Child Poverty Under the Age of 5 Correlation Summary
| Measurement | Guamanian/Chamorro | Immigrants from Cabo Verde |
| Minimum | 3.0% | 3.0% |
| Maximum | 100.0% | 44.7% |
| Range | 97.0% | 41.6% |
| Mean | 23.3% | 20.6% |
| Median | 15.5% | 21.0% |
| Interquartile 25% (IQ1) | 11.2% | 13.1% |
| Interquartile 75% (IQ3) | 19.9% | 26.8% |
| Interquartile Range (IQR) | 8.6% | 13.8% |
| Standard Deviation (Sample) | 23.7% | 9.6% |
| Standard Deviation (Population) | 23.3% | 9.5% |
Similar Demographics by Child Poverty Under the Age of 5
Demographics Similar to Guamanians/Chamorros by Child Poverty Under the Age of 5
In terms of child poverty under the age of 5, the demographic groups most similar to Guamanians/Chamorros are Immigrants from Hungary (16.5%, a difference of 0.070%), German (16.5%, a difference of 0.13%), Immigrants from Western Europe (16.5%, a difference of 0.19%), Immigrants from Chile (16.4%, a difference of 0.23%), and Portuguese (16.5%, a difference of 0.23%).
| Demographics | Rating | Rank | Child Poverty Under the Age of 5 |
| Icelanders | 87.9 /100 | #133 | Excellent 16.3% |
| Immigrants | North Macedonia | 87.8 /100 | #134 | Excellent 16.4% |
| Brazilians | 87.8 /100 | #135 | Excellent 16.4% |
| Immigrants | Northern Africa | 87.5 /100 | #136 | Excellent 16.4% |
| Immigrants | Chile | 85.3 /100 | #137 | Excellent 16.4% |
| Germans | 84.8 /100 | #138 | Excellent 16.5% |
| Immigrants | Hungary | 84.5 /100 | #139 | Excellent 16.5% |
| Guamanians/Chamorros | 84.2 /100 | #140 | Excellent 16.5% |
| Immigrants | Western Europe | 83.3 /100 | #141 | Excellent 16.5% |
| Portuguese | 83.0 /100 | #142 | Excellent 16.5% |
| Samoans | 83.0 /100 | #143 | Excellent 16.5% |
| Ethiopians | 82.7 /100 | #144 | Excellent 16.5% |
| Immigrants | Ethiopia | 82.1 /100 | #145 | Excellent 16.6% |
| Israelis | 82.0 /100 | #146 | Excellent 16.6% |
| Immigrants | Nepal | 80.3 /100 | #147 | Excellent 16.6% |
Demographics Similar to Immigrants from Cabo Verde by Child Poverty Under the Age of 5
In terms of child poverty under the age of 5, the demographic groups most similar to Immigrants from Cabo Verde are Salvadoran (19.5%, a difference of 0.010%), Vietnamese (19.5%, a difference of 0.040%), Immigrants from Ecuador (19.6%, a difference of 0.41%), Alaska Native (19.6%, a difference of 0.48%), and Immigrants from Trinidad and Tobago (19.4%, a difference of 0.55%).
| Demographics | Rating | Rank | Child Poverty Under the Age of 5 |
| Ecuadorians | 1.2 /100 | #230 | Tragic 19.2% |
| Bermudans | 1.2 /100 | #231 | Tragic 19.2% |
| Trinidadians and Tobagonians | 0.9 /100 | #232 | Tragic 19.3% |
| Sudanese | 0.9 /100 | #233 | Tragic 19.3% |
| Immigrants | Micronesia | 0.9 /100 | #234 | Tragic 19.4% |
| Immigrants | Laos | 0.8 /100 | #235 | Tragic 19.4% |
| Immigrants | Trinidad and Tobago | 0.8 /100 | #236 | Tragic 19.4% |
| Immigrants | Cabo Verde | 0.6 /100 | #237 | Tragic 19.5% |
| Salvadorans | 0.6 /100 | #238 | Tragic 19.5% |
| Vietnamese | 0.6 /100 | #239 | Tragic 19.5% |
| Immigrants | Ecuador | 0.5 /100 | #240 | Tragic 19.6% |
| Alaska Natives | 0.5 /100 | #241 | Tragic 19.6% |
| Immigrants | Guyana | 0.5 /100 | #242 | Tragic 19.6% |
| Osage | 0.5 /100 | #243 | Tragic 19.6% |
| Immigrants | Ghana | 0.5 /100 | #244 | Tragic 19.6% |