Guamanian/Chamorro vs Immigrants from Malaysia Child Poverty Under the Age of 5
COMPARE
Guamanian/Chamorro
Immigrants from Malaysia
Child Poverty Under the Age of 5
Child Poverty Under the Age of 5 Comparison
Guamanians/Chamorros
Immigrants from Malaysia
16.5%
CHILD POVERTY UNDER THE AGE OF 5
84.2/ 100
METRIC RATING
140th/ 347
METRIC RANK
15.6%
CHILD POVERTY UNDER THE AGE OF 5
97.4/ 100
METRIC RATING
86th/ 347
METRIC RANK
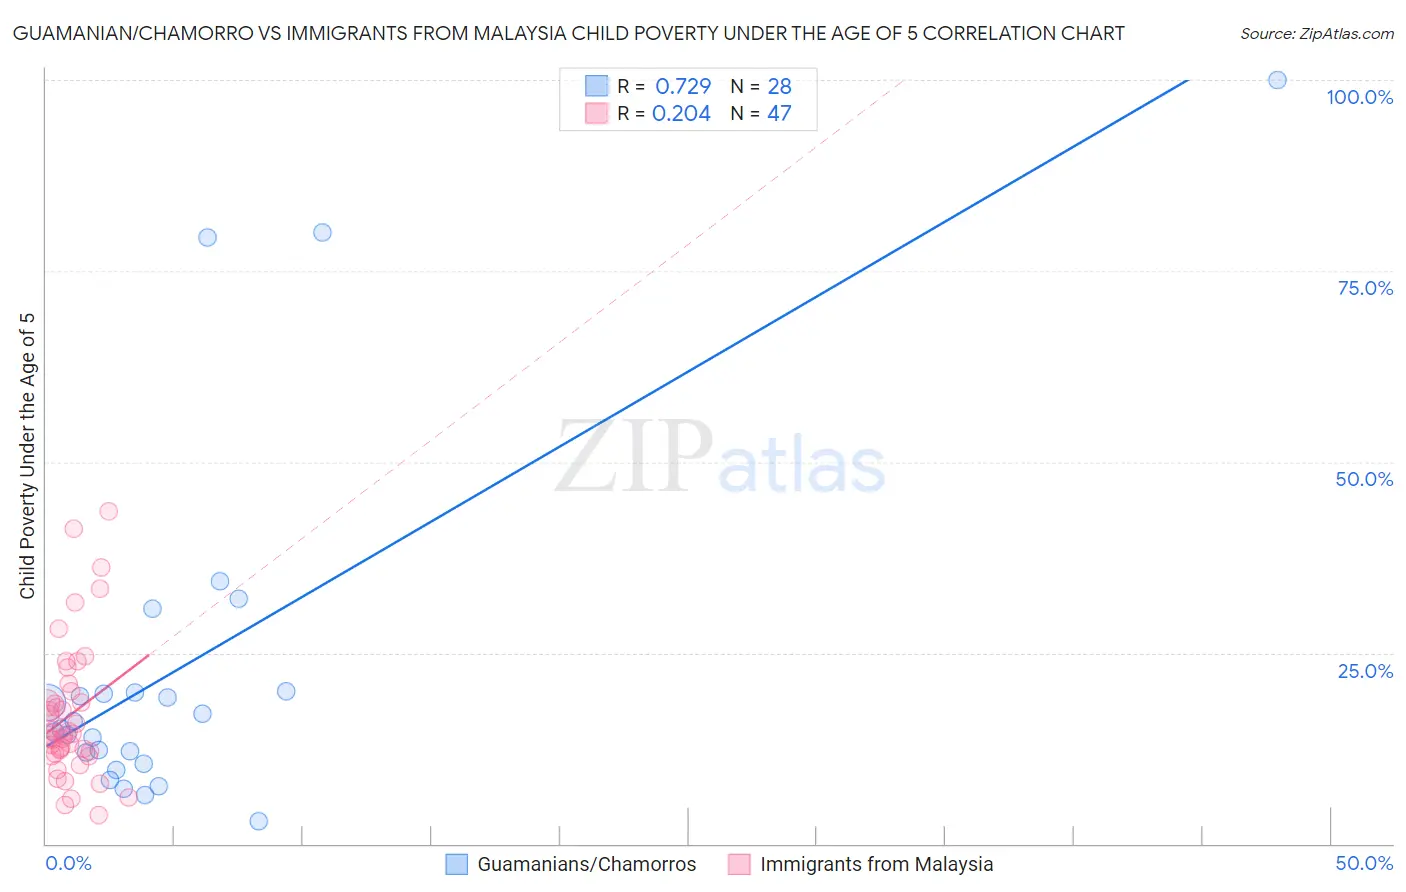
Guamanian/Chamorro vs Immigrants from Malaysia Child Poverty Under the Age of 5 Correlation Chart
The statistical analysis conducted on geographies consisting of 218,115,058 people shows a strong positive correlation between the proportion of Guamanians/Chamorros and poverty level among children under the age of 5 in the United States with a correlation coefficient (R) of 0.729 and weighted average of 16.5%. Similarly, the statistical analysis conducted on geographies consisting of 192,879,817 people shows a weak positive correlation between the proportion of Immigrants from Malaysia and poverty level among children under the age of 5 in the United States with a correlation coefficient (R) of 0.204 and weighted average of 15.6%, a difference of 5.6%.
Child Poverty Under the Age of 5 Correlation Summary
| Measurement | Guamanian/Chamorro | Immigrants from Malaysia |
| Minimum | 3.0% | 3.7% |
| Maximum | 100.0% | 43.6% |
| Range | 97.0% | 39.8% |
| Mean | 23.3% | 16.9% |
| Median | 15.5% | 14.3% |
| Interquartile 25% (IQ1) | 11.2% | 11.8% |
| Interquartile 75% (IQ3) | 19.9% | 20.0% |
| Interquartile Range (IQR) | 8.6% | 8.2% |
| Standard Deviation (Sample) | 23.7% | 8.9% |
| Standard Deviation (Population) | 23.3% | 8.8% |
Similar Demographics by Child Poverty Under the Age of 5
Demographics Similar to Guamanians/Chamorros by Child Poverty Under the Age of 5
In terms of child poverty under the age of 5, the demographic groups most similar to Guamanians/Chamorros are Immigrants from Hungary (16.5%, a difference of 0.070%), German (16.5%, a difference of 0.13%), Immigrants from Western Europe (16.5%, a difference of 0.19%), Immigrants from Chile (16.4%, a difference of 0.23%), and Portuguese (16.5%, a difference of 0.23%).
| Demographics | Rating | Rank | Child Poverty Under the Age of 5 |
| Icelanders | 87.9 /100 | #133 | Excellent 16.3% |
| Immigrants | North Macedonia | 87.8 /100 | #134 | Excellent 16.4% |
| Brazilians | 87.8 /100 | #135 | Excellent 16.4% |
| Immigrants | Northern Africa | 87.5 /100 | #136 | Excellent 16.4% |
| Immigrants | Chile | 85.3 /100 | #137 | Excellent 16.4% |
| Germans | 84.8 /100 | #138 | Excellent 16.5% |
| Immigrants | Hungary | 84.5 /100 | #139 | Excellent 16.5% |
| Guamanians/Chamorros | 84.2 /100 | #140 | Excellent 16.5% |
| Immigrants | Western Europe | 83.3 /100 | #141 | Excellent 16.5% |
| Portuguese | 83.0 /100 | #142 | Excellent 16.5% |
| Samoans | 83.0 /100 | #143 | Excellent 16.5% |
| Ethiopians | 82.7 /100 | #144 | Excellent 16.5% |
| Immigrants | Ethiopia | 82.1 /100 | #145 | Excellent 16.6% |
| Israelis | 82.0 /100 | #146 | Excellent 16.6% |
| Immigrants | Nepal | 80.3 /100 | #147 | Excellent 16.6% |
Demographics Similar to Immigrants from Malaysia by Child Poverty Under the Age of 5
In terms of child poverty under the age of 5, the demographic groups most similar to Immigrants from Malaysia are Immigrants from Latvia (15.6%, a difference of 0.0%), Immigrants from Vietnam (15.6%, a difference of 0.080%), Jordanian (15.6%, a difference of 0.13%), Immigrants from Netherlands (15.6%, a difference of 0.16%), and Chilean (15.6%, a difference of 0.18%).
| Demographics | Rating | Rank | Child Poverty Under the Age of 5 |
| Australians | 98.0 /100 | #79 | Exceptional 15.5% |
| Italians | 97.9 /100 | #80 | Exceptional 15.5% |
| Czechs | 97.8 /100 | #81 | Exceptional 15.5% |
| Immigrants | Italy | 97.7 /100 | #82 | Exceptional 15.6% |
| Chileans | 97.6 /100 | #83 | Exceptional 15.6% |
| Immigrants | Netherlands | 97.6 /100 | #84 | Exceptional 15.6% |
| Immigrants | Latvia | 97.4 /100 | #85 | Exceptional 15.6% |
| Immigrants | Malaysia | 97.4 /100 | #86 | Exceptional 15.6% |
| Immigrants | Vietnam | 97.4 /100 | #87 | Exceptional 15.6% |
| Jordanians | 97.3 /100 | #88 | Exceptional 15.6% |
| Immigrants | Croatia | 97.3 /100 | #89 | Exceptional 15.6% |
| Immigrants | France | 97.3 /100 | #90 | Exceptional 15.6% |
| Poles | 97.2 /100 | #91 | Exceptional 15.7% |
| Scandinavians | 97.1 /100 | #92 | Exceptional 15.7% |
| Ukrainians | 97.1 /100 | #93 | Exceptional 15.7% |