Chickasaw vs Hispanic or Latino Median Female Earnings
COMPARE
Chickasaw
Hispanic or Latino
Median Female Earnings
Median Female Earnings Comparison
Chickasaw
Hispanics or Latinos
$34,414
MEDIAN FEMALE EARNINGS
0.0/ 100
METRIC RATING
322nd/ 347
METRIC RANK
$34,421
MEDIAN FEMALE EARNINGS
0.0/ 100
METRIC RATING
321st/ 347
METRIC RANK
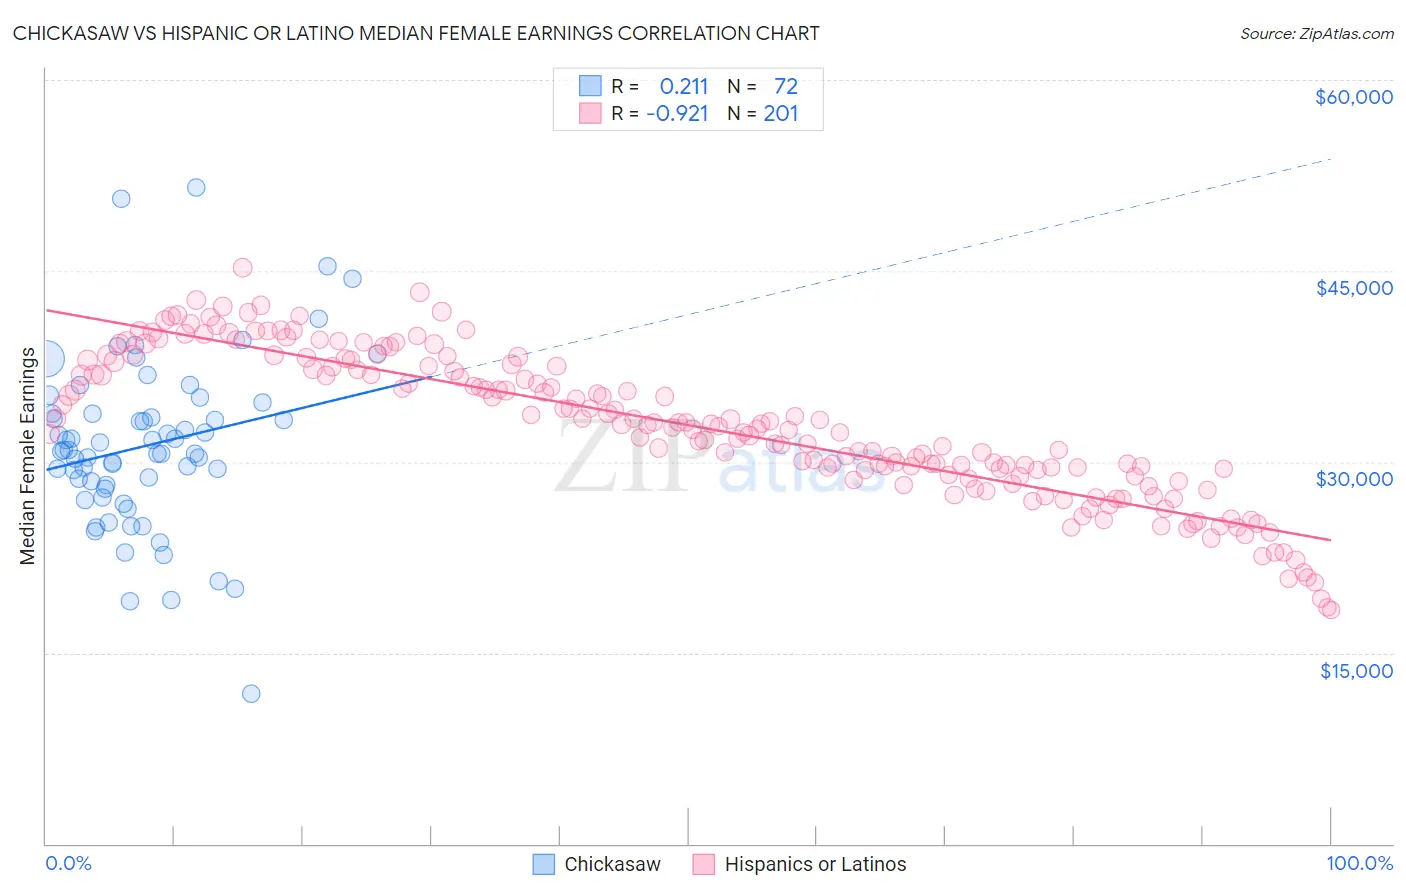
Chickasaw vs Hispanic or Latino Median Female Earnings Correlation Chart
The statistical analysis conducted on geographies consisting of 147,680,530 people shows a weak positive correlation between the proportion of Chickasaw and median female earnings in the United States with a correlation coefficient (R) of 0.211 and weighted average of $34,414. Similarly, the statistical analysis conducted on geographies consisting of 576,408,721 people shows a near-perfect negative correlation between the proportion of Hispanics or Latinos and median female earnings in the United States with a correlation coefficient (R) of -0.921 and weighted average of $34,421, a difference of 0.020%.
Median Female Earnings Correlation Summary
| Measurement | Chickasaw | Hispanic or Latino |
| Minimum | $11,797 | $18,390 |
| Maximum | $51,543 | $45,279 |
| Range | $39,746 | $26,890 |
| Mean | $31,266 | $32,838 |
| Median | $30,877 | $32,964 |
| Interquartile 25% (IQ1) | $28,026 | $29,181 |
| Interquartile 75% (IQ3) | $33,779 | $37,606 |
| Interquartile Range (IQR) | $5,753 | $8,426 |
| Standard Deviation (Sample) | $6,735 | $5,710 |
| Standard Deviation (Population) | $6,688 | $5,696 |
Demographics Similar to Chickasaw and Hispanics or Latinos by Median Female Earnings
In terms of median female earnings, the demographic groups most similar to Chickasaw are Seminole ($34,385, a difference of 0.080%), Immigrants from Congo ($34,317, a difference of 0.28%), Immigrants from Honduras ($34,647, a difference of 0.68%), Shoshone ($34,677, a difference of 0.76%), and Immigrants from Yemen ($34,693, a difference of 0.81%). Similarly, the demographic groups most similar to Hispanics or Latinos are Seminole ($34,385, a difference of 0.11%), Immigrants from Congo ($34,317, a difference of 0.31%), Immigrants from Honduras ($34,647, a difference of 0.66%), Shoshone ($34,677, a difference of 0.74%), and Immigrants from Yemen ($34,693, a difference of 0.79%).
| Demographics | Rating | Rank | Median Female Earnings |
| Ute | 0.0 /100 | #311 | Tragic $34,960 |
| Yaqui | 0.0 /100 | #312 | Tragic $34,943 |
| Cubans | 0.0 /100 | #313 | Tragic $34,942 |
| Apache | 0.0 /100 | #314 | Tragic $34,895 |
| Pennsylvania Germans | 0.0 /100 | #315 | Tragic $34,802 |
| Cherokee | 0.0 /100 | #316 | Tragic $34,742 |
| Potawatomi | 0.0 /100 | #317 | Tragic $34,739 |
| Immigrants | Yemen | 0.0 /100 | #318 | Tragic $34,693 |
| Shoshone | 0.0 /100 | #319 | Tragic $34,677 |
| Immigrants | Honduras | 0.0 /100 | #320 | Tragic $34,647 |
| Hispanics or Latinos | 0.0 /100 | #321 | Tragic $34,421 |
| Chickasaw | 0.0 /100 | #322 | Tragic $34,414 |
| Seminole | 0.0 /100 | #323 | Tragic $34,385 |
| Immigrants | Congo | 0.0 /100 | #324 | Tragic $34,317 |
| Dutch West Indians | 0.0 /100 | #325 | Tragic $34,106 |
| Kiowa | 0.0 /100 | #326 | Tragic $34,074 |
| Cajuns | 0.0 /100 | #327 | Tragic $34,034 |
| Immigrants | Central America | 0.0 /100 | #328 | Tragic $33,953 |
| Hopi | 0.0 /100 | #329 | Tragic $33,932 |
| Menominee | 0.0 /100 | #330 | Tragic $33,894 |
| Natives/Alaskans | 0.0 /100 | #331 | Tragic $33,806 |