Czechoslovakian vs Hispanic or Latino Single Female Poverty
COMPARE
Czechoslovakian
Hispanic or Latino
Single Female Poverty
Single Female Poverty Comparison
Czechoslovakians
Hispanics or Latinos
21.3%
SINGLE FEMALE POVERTY
27.7/ 100
METRIC RATING
194th/ 347
METRIC RANK
24.6%
SINGLE FEMALE POVERTY
0.0/ 100
METRIC RATING
295th/ 347
METRIC RANK
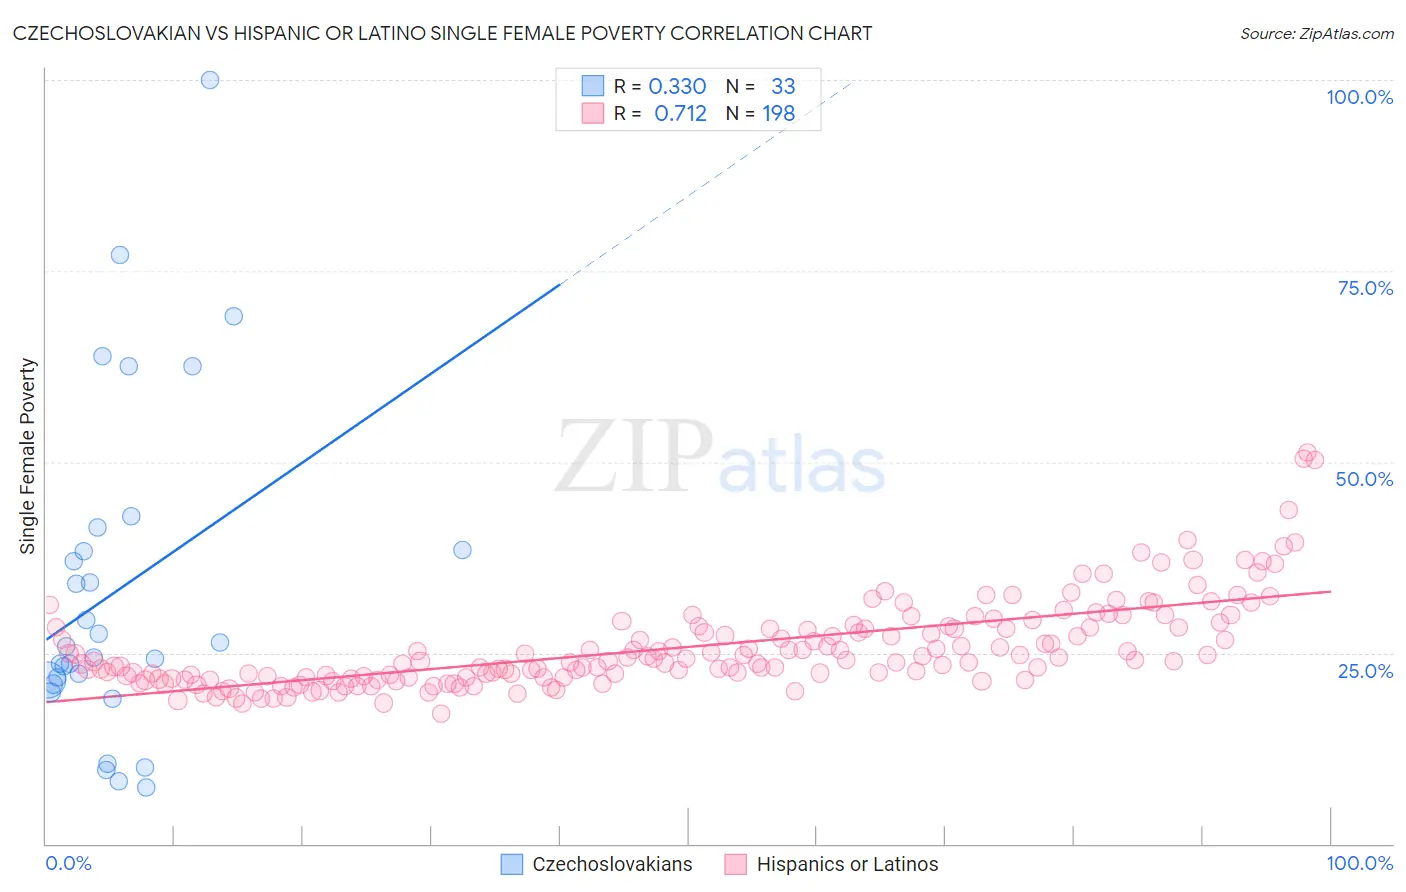
Czechoslovakian vs Hispanic or Latino Single Female Poverty Correlation Chart
The statistical analysis conducted on geographies consisting of 361,916,280 people shows a mild positive correlation between the proportion of Czechoslovakians and poverty level among single females in the United States with a correlation coefficient (R) of 0.330 and weighted average of 21.3%. Similarly, the statistical analysis conducted on geographies consisting of 554,629,261 people shows a strong positive correlation between the proportion of Hispanics or Latinos and poverty level among single females in the United States with a correlation coefficient (R) of 0.712 and weighted average of 24.6%, a difference of 15.5%.
Single Female Poverty Correlation Summary
| Measurement | Czechoslovakian | Hispanic or Latino |
| Minimum | 7.4% | 17.1% |
| Maximum | 100.0% | 51.2% |
| Range | 92.6% | 34.2% |
| Mean | 33.3% | 25.7% |
| Median | 25.9% | 23.9% |
| Interquartile 25% (IQ1) | 21.1% | 21.8% |
| Interquartile 75% (IQ3) | 39.9% | 28.3% |
| Interquartile Range (IQR) | 18.8% | 6.5% |
| Standard Deviation (Sample) | 21.6% | 5.8% |
| Standard Deviation (Population) | 21.3% | 5.8% |
Similar Demographics by Single Female Poverty
Demographics Similar to Czechoslovakians by Single Female Poverty
In terms of single female poverty, the demographic groups most similar to Czechoslovakians are Nicaraguan (21.3%, a difference of 0.010%), Basque (21.3%, a difference of 0.030%), Immigrants from Saudi Arabia (21.3%, a difference of 0.050%), Japanese (21.3%, a difference of 0.10%), and Immigrants from Jamaica (21.3%, a difference of 0.21%).
| Demographics | Rating | Rank | Single Female Poverty |
| Immigrants | Nigeria | 36.8 /100 | #187 | Fair 21.2% |
| Yugoslavians | 35.4 /100 | #188 | Fair 21.2% |
| Immigrants | Cuba | 35.3 /100 | #189 | Fair 21.2% |
| Trinidadians and Tobagonians | 35.2 /100 | #190 | Fair 21.2% |
| Immigrants | Germany | 31.1 /100 | #191 | Fair 21.3% |
| Immigrants | Jamaica | 30.5 /100 | #192 | Fair 21.3% |
| Basques | 28.1 /100 | #193 | Fair 21.3% |
| Czechoslovakians | 27.7 /100 | #194 | Fair 21.3% |
| Nicaraguans | 27.6 /100 | #195 | Fair 21.3% |
| Immigrants | Saudi Arabia | 27.1 /100 | #196 | Fair 21.3% |
| Japanese | 26.4 /100 | #197 | Fair 21.3% |
| Swiss | 24.2 /100 | #198 | Fair 21.4% |
| Immigrants | Immigrants | 22.0 /100 | #199 | Fair 21.4% |
| Irish | 21.4 /100 | #200 | Fair 21.4% |
| Nigerians | 20.9 /100 | #201 | Fair 21.4% |
Demographics Similar to Hispanics or Latinos by Single Female Poverty
In terms of single female poverty, the demographic groups most similar to Hispanics or Latinos are French American Indian (24.6%, a difference of 0.35%), African (24.8%, a difference of 0.48%), American (24.5%, a difference of 0.49%), Alsatian (24.5%, a difference of 0.57%), and Immigrants from Central America (24.8%, a difference of 0.76%).
| Demographics | Rating | Rank | Single Female Poverty |
| Spanish Americans | 0.0 /100 | #288 | Tragic 24.2% |
| U.S. Virgin Islanders | 0.0 /100 | #289 | Tragic 24.2% |
| Indonesians | 0.0 /100 | #290 | Tragic 24.3% |
| Osage | 0.0 /100 | #291 | Tragic 24.4% |
| Alsatians | 0.0 /100 | #292 | Tragic 24.5% |
| Americans | 0.0 /100 | #293 | Tragic 24.5% |
| French American Indians | 0.0 /100 | #294 | Tragic 24.6% |
| Hispanics or Latinos | 0.0 /100 | #295 | Tragic 24.6% |
| Africans | 0.0 /100 | #296 | Tragic 24.8% |
| Immigrants | Central America | 0.0 /100 | #297 | Tragic 24.8% |
| Yaqui | 0.0 /100 | #298 | Tragic 24.9% |
| Mexicans | 0.0 /100 | #299 | Tragic 25.0% |
| Blackfeet | 0.0 /100 | #300 | Tragic 25.1% |
| Hondurans | 0.0 /100 | #301 | Tragic 25.1% |
| Shoshone | 0.0 /100 | #302 | Tragic 25.1% |