Chickasaw vs Hispanic or Latino Cognitive Disability
COMPARE
Chickasaw
Hispanic or Latino
Cognitive Disability
Cognitive Disability Comparison
Chickasaw
Hispanics or Latinos
18.5%
COGNITIVE DISABILITY
0.0/ 100
METRIC RATING
312th/ 347
METRIC RANK
17.9%
COGNITIVE DISABILITY
0.6/ 100
METRIC RATING
254th/ 347
METRIC RANK
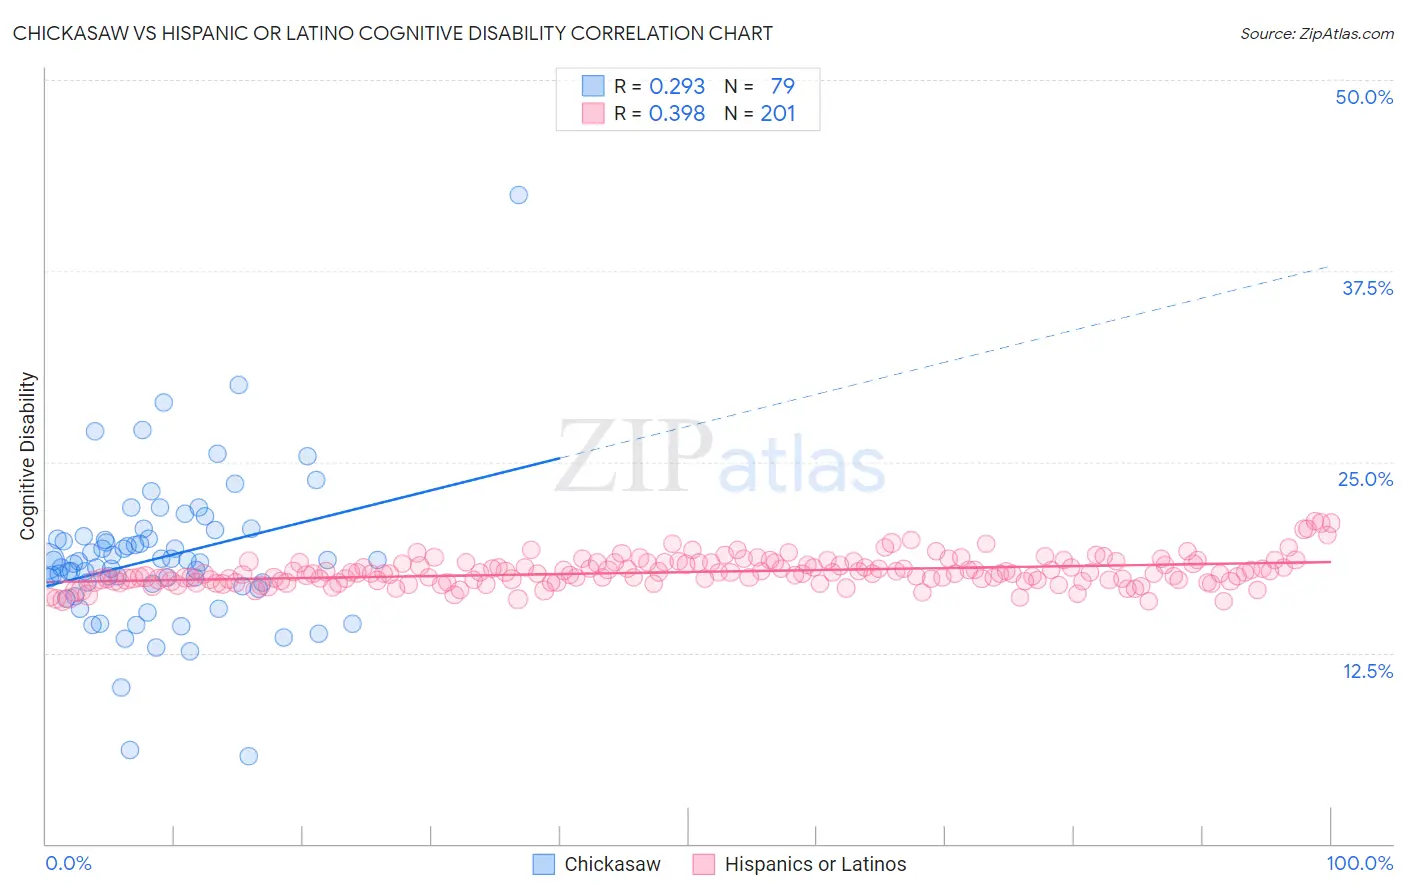
Chickasaw vs Hispanic or Latino Cognitive Disability Correlation Chart
The statistical analysis conducted on geographies consisting of 147,689,565 people shows a weak positive correlation between the proportion of Chickasaw and percentage of population with cognitive disability in the United States with a correlation coefficient (R) of 0.293 and weighted average of 18.5%. Similarly, the statistical analysis conducted on geographies consisting of 578,401,671 people shows a mild positive correlation between the proportion of Hispanics or Latinos and percentage of population with cognitive disability in the United States with a correlation coefficient (R) of 0.398 and weighted average of 17.9%, a difference of 3.3%.
Cognitive Disability Correlation Summary
| Measurement | Chickasaw | Hispanic or Latino |
| Minimum | 5.7% | 15.8% |
| Maximum | 42.5% | 21.1% |
| Range | 36.8% | 5.3% |
| Mean | 18.7% | 17.8% |
| Median | 18.5% | 17.7% |
| Interquartile 25% (IQ1) | 16.9% | 17.2% |
| Interquartile 75% (IQ3) | 20.0% | 18.4% |
| Interquartile Range (IQR) | 3.1% | 1.2% |
| Standard Deviation (Sample) | 4.9% | 0.96% |
| Standard Deviation (Population) | 4.9% | 0.96% |
Similar Demographics by Cognitive Disability
Demographics Similar to Chickasaw by Cognitive Disability
In terms of cognitive disability, the demographic groups most similar to Chickasaw are Yaqui (18.5%, a difference of 0.11%), Subsaharan African (18.5%, a difference of 0.17%), Hmong (18.4%, a difference of 0.29%), Choctaw (18.4%, a difference of 0.31%), and Immigrants from Dominica (18.6%, a difference of 0.35%).
| Demographics | Rating | Rank | Cognitive Disability |
| Colville | 0.0 /100 | #305 | Tragic 18.3% |
| Seminole | 0.0 /100 | #306 | Tragic 18.3% |
| Ugandans | 0.0 /100 | #307 | Tragic 18.3% |
| Immigrants | Western Africa | 0.0 /100 | #308 | Tragic 18.4% |
| Immigrants | Eastern Africa | 0.0 /100 | #309 | Tragic 18.4% |
| Choctaw | 0.0 /100 | #310 | Tragic 18.4% |
| Hmong | 0.0 /100 | #311 | Tragic 18.4% |
| Chickasaw | 0.0 /100 | #312 | Tragic 18.5% |
| Yaqui | 0.0 /100 | #313 | Tragic 18.5% |
| Sub-Saharan Africans | 0.0 /100 | #314 | Tragic 18.5% |
| Immigrants | Dominica | 0.0 /100 | #315 | Tragic 18.6% |
| Immigrants | Middle Africa | 0.0 /100 | #316 | Tragic 18.6% |
| Liberians | 0.0 /100 | #317 | Tragic 18.6% |
| Bangladeshis | 0.0 /100 | #318 | Tragic 18.6% |
| Comanche | 0.0 /100 | #319 | Tragic 18.6% |
Demographics Similar to Hispanics or Latinos by Cognitive Disability
In terms of cognitive disability, the demographic groups most similar to Hispanics or Latinos are Hopi (17.9%, a difference of 0.0%), Immigrants from the Azores (17.9%, a difference of 0.0%), Bahamian (17.9%, a difference of 0.010%), Immigrants from Grenada (17.9%, a difference of 0.020%), and Cree (17.9%, a difference of 0.030%).
| Demographics | Rating | Rank | Cognitive Disability |
| Samoans | 0.7 /100 | #247 | Tragic 17.9% |
| French American Indians | 0.7 /100 | #248 | Tragic 17.9% |
| Cree | 0.7 /100 | #249 | Tragic 17.9% |
| Immigrants | Ethiopia | 0.7 /100 | #250 | Tragic 17.9% |
| Malaysians | 0.6 /100 | #251 | Tragic 17.9% |
| Immigrants | Grenada | 0.6 /100 | #252 | Tragic 17.9% |
| Hopi | 0.6 /100 | #253 | Tragic 17.9% |
| Hispanics or Latinos | 0.6 /100 | #254 | Tragic 17.9% |
| Immigrants | Azores | 0.6 /100 | #255 | Tragic 17.9% |
| Bahamians | 0.6 /100 | #256 | Tragic 17.9% |
| Mexican American Indians | 0.6 /100 | #257 | Tragic 17.9% |
| Immigrants | Armenia | 0.6 /100 | #258 | Tragic 17.9% |
| Ethiopians | 0.5 /100 | #259 | Tragic 17.9% |
| Immigrants | Belize | 0.5 /100 | #260 | Tragic 17.9% |
| Guamanians/Chamorros | 0.5 /100 | #261 | Tragic 17.9% |