Scandinavian vs Hispanic or Latino Single Female Poverty
COMPARE
Scandinavian
Hispanic or Latino
Single Female Poverty
Single Female Poverty Comparison
Scandinavians
Hispanics or Latinos
21.1%
SINGLE FEMALE POVERTY
45.2/ 100
METRIC RATING
177th/ 347
METRIC RANK
24.6%
SINGLE FEMALE POVERTY
0.0/ 100
METRIC RATING
295th/ 347
METRIC RANK
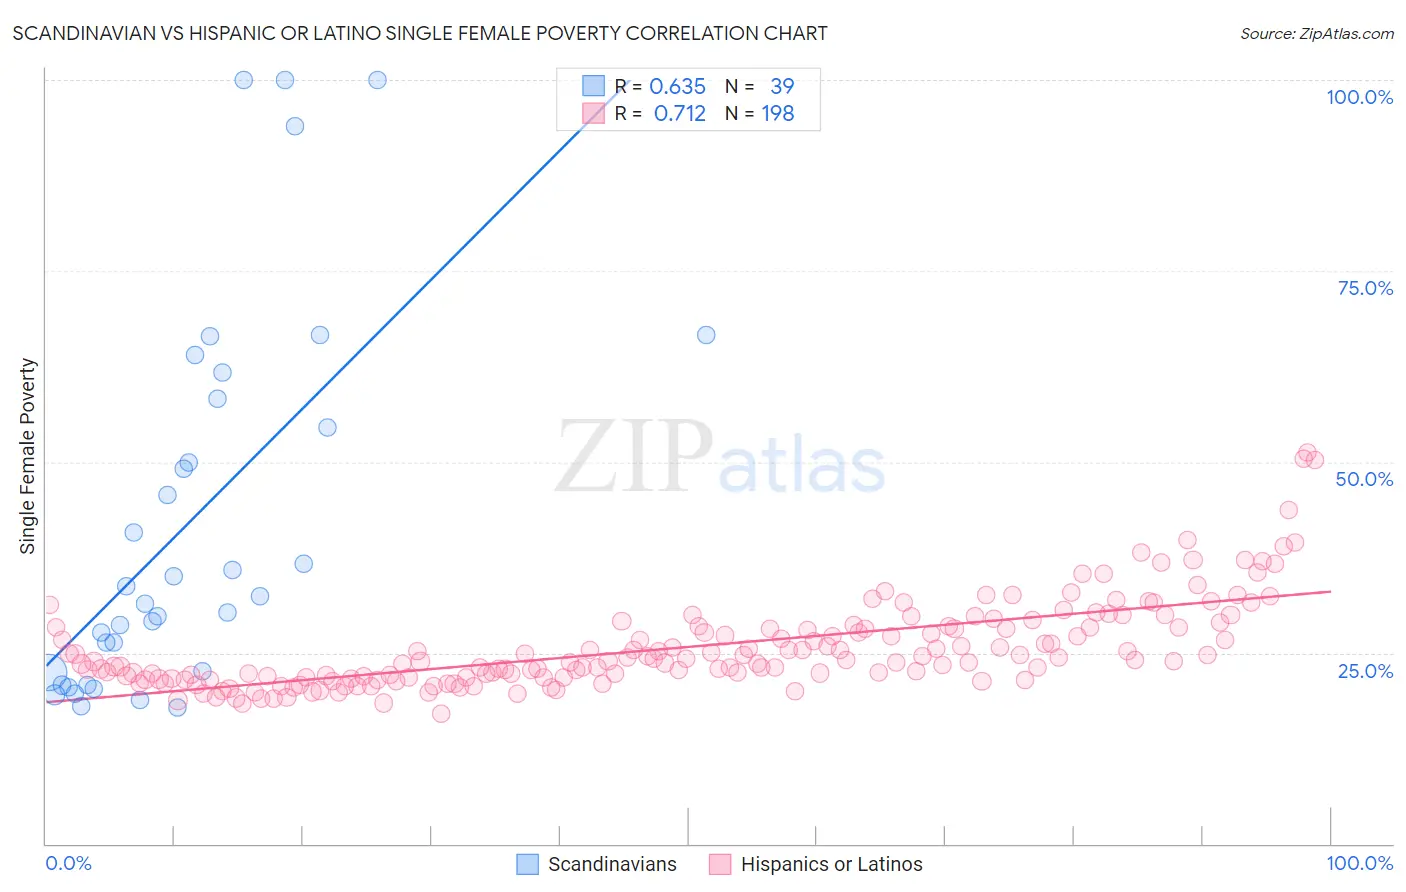
Scandinavian vs Hispanic or Latino Single Female Poverty Correlation Chart
The statistical analysis conducted on geographies consisting of 461,288,786 people shows a significant positive correlation between the proportion of Scandinavians and poverty level among single females in the United States with a correlation coefficient (R) of 0.635 and weighted average of 21.1%. Similarly, the statistical analysis conducted on geographies consisting of 554,629,261 people shows a strong positive correlation between the proportion of Hispanics or Latinos and poverty level among single females in the United States with a correlation coefficient (R) of 0.712 and weighted average of 24.6%, a difference of 16.9%.
Single Female Poverty Correlation Summary
| Measurement | Scandinavian | Hispanic or Latino |
| Minimum | 17.8% | 17.1% |
| Maximum | 100.0% | 51.2% |
| Range | 82.2% | 34.2% |
| Mean | 42.1% | 25.7% |
| Median | 32.4% | 23.9% |
| Interquartile 25% (IQ1) | 22.3% | 21.8% |
| Interquartile 75% (IQ3) | 58.3% | 28.3% |
| Interquartile Range (IQR) | 36.0% | 6.5% |
| Standard Deviation (Sample) | 24.6% | 5.8% |
| Standard Deviation (Population) | 24.3% | 5.8% |
Similar Demographics by Single Female Poverty
Demographics Similar to Scandinavians by Single Female Poverty
In terms of single female poverty, the demographic groups most similar to Scandinavians are Canadian (21.1%, a difference of 0.010%), Immigrants from Bosnia and Herzegovina (21.1%, a difference of 0.020%), Czech (21.0%, a difference of 0.10%), British (21.1%, a difference of 0.14%), and Spanish American Indian (21.1%, a difference of 0.17%).
| Demographics | Rating | Rank | Single Female Poverty |
| New Zealanders | 53.2 /100 | #170 | Average 21.0% |
| Moroccans | 52.8 /100 | #171 | Average 21.0% |
| Guyanese | 52.0 /100 | #172 | Average 21.0% |
| Immigrants | Guyana | 50.6 /100 | #173 | Average 21.0% |
| Cubans | 50.0 /100 | #174 | Average 21.0% |
| Czechs | 46.8 /100 | #175 | Average 21.0% |
| Canadians | 45.4 /100 | #176 | Average 21.1% |
| Scandinavians | 45.2 /100 | #177 | Average 21.1% |
| Immigrants | Bosnia and Herzegovina | 44.9 /100 | #178 | Average 21.1% |
| British | 42.9 /100 | #179 | Average 21.1% |
| Spanish American Indians | 42.5 /100 | #180 | Average 21.1% |
| Europeans | 42.3 /100 | #181 | Average 21.1% |
| Slavs | 40.5 /100 | #182 | Average 21.1% |
| Slovaks | 39.7 /100 | #183 | Fair 21.1% |
| Hungarians | 39.6 /100 | #184 | Fair 21.1% |
Demographics Similar to Hispanics or Latinos by Single Female Poverty
In terms of single female poverty, the demographic groups most similar to Hispanics or Latinos are French American Indian (24.6%, a difference of 0.35%), African (24.8%, a difference of 0.48%), American (24.5%, a difference of 0.49%), Alsatian (24.5%, a difference of 0.57%), and Immigrants from Central America (24.8%, a difference of 0.76%).
| Demographics | Rating | Rank | Single Female Poverty |
| Spanish Americans | 0.0 /100 | #288 | Tragic 24.2% |
| U.S. Virgin Islanders | 0.0 /100 | #289 | Tragic 24.2% |
| Indonesians | 0.0 /100 | #290 | Tragic 24.3% |
| Osage | 0.0 /100 | #291 | Tragic 24.4% |
| Alsatians | 0.0 /100 | #292 | Tragic 24.5% |
| Americans | 0.0 /100 | #293 | Tragic 24.5% |
| French American Indians | 0.0 /100 | #294 | Tragic 24.6% |
| Hispanics or Latinos | 0.0 /100 | #295 | Tragic 24.6% |
| Africans | 0.0 /100 | #296 | Tragic 24.8% |
| Immigrants | Central America | 0.0 /100 | #297 | Tragic 24.8% |
| Yaqui | 0.0 /100 | #298 | Tragic 24.9% |
| Mexicans | 0.0 /100 | #299 | Tragic 25.0% |
| Blackfeet | 0.0 /100 | #300 | Tragic 25.1% |
| Hondurans | 0.0 /100 | #301 | Tragic 25.1% |
| Shoshone | 0.0 /100 | #302 | Tragic 25.1% |