Yuman vs Hispanic or Latino Single Female Poverty
COMPARE
Yuman
Hispanic or Latino
Single Female Poverty
Single Female Poverty Comparison
Yuman
Hispanics or Latinos
29.4%
SINGLE FEMALE POVERTY
0.0/ 100
METRIC RATING
337th/ 347
METRIC RANK
24.6%
SINGLE FEMALE POVERTY
0.0/ 100
METRIC RATING
295th/ 347
METRIC RANK
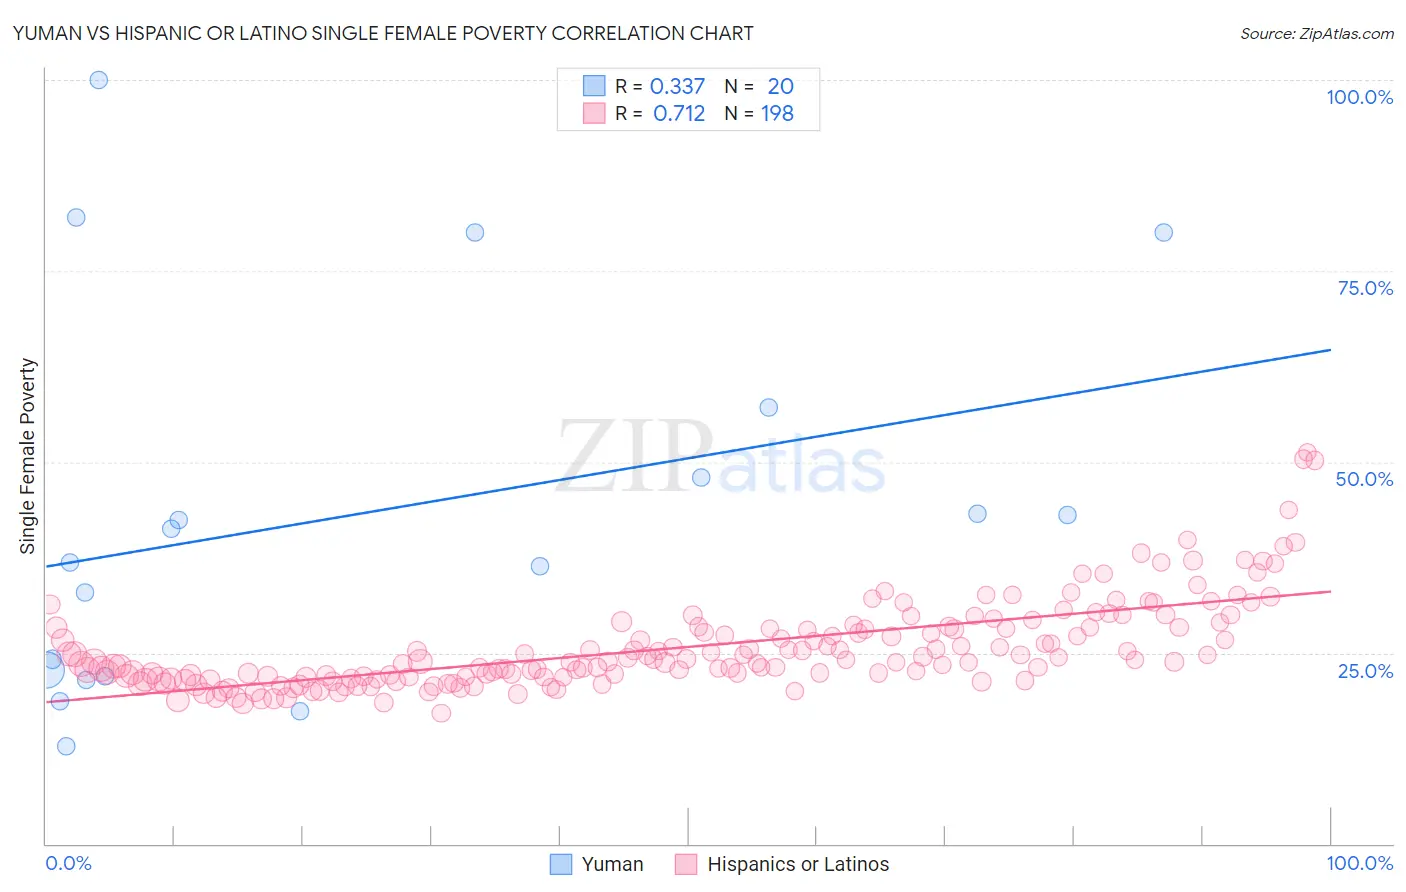
Yuman vs Hispanic or Latino Single Female Poverty Correlation Chart
The statistical analysis conducted on geographies consisting of 40,574,686 people shows a mild positive correlation between the proportion of Yuman and poverty level among single females in the United States with a correlation coefficient (R) of 0.337 and weighted average of 29.4%. Similarly, the statistical analysis conducted on geographies consisting of 554,629,261 people shows a strong positive correlation between the proportion of Hispanics or Latinos and poverty level among single females in the United States with a correlation coefficient (R) of 0.712 and weighted average of 24.6%, a difference of 19.5%.
Single Female Poverty Correlation Summary
| Measurement | Yuman | Hispanic or Latino |
| Minimum | 12.7% | 17.1% |
| Maximum | 100.0% | 51.2% |
| Range | 87.3% | 34.2% |
| Mean | 43.1% | 25.7% |
| Median | 39.0% | 23.9% |
| Interquartile 25% (IQ1) | 22.3% | 21.8% |
| Interquartile 75% (IQ3) | 52.6% | 28.3% |
| Interquartile Range (IQR) | 30.3% | 6.5% |
| Standard Deviation (Sample) | 24.9% | 5.8% |
| Standard Deviation (Population) | 24.2% | 5.8% |
Similar Demographics by Single Female Poverty
Demographics Similar to Yuman by Single Female Poverty
In terms of single female poverty, the demographic groups most similar to Yuman are Colville (29.1%, a difference of 1.3%), Immigrants from Yemen (28.9%, a difference of 1.8%), Pueblo (28.6%, a difference of 2.9%), Pima (30.3%, a difference of 3.0%), and Cheyenne (30.4%, a difference of 3.2%).
| Demographics | Rating | Rank | Single Female Poverty |
| Hopi | 0.0 /100 | #330 | Tragic 28.0% |
| Natives/Alaskans | 0.0 /100 | #331 | Tragic 28.2% |
| Yakama | 0.0 /100 | #332 | Tragic 28.3% |
| Ute | 0.0 /100 | #333 | Tragic 28.4% |
| Pueblo | 0.0 /100 | #334 | Tragic 28.6% |
| Immigrants | Yemen | 0.0 /100 | #335 | Tragic 28.9% |
| Colville | 0.0 /100 | #336 | Tragic 29.1% |
| Yuman | 0.0 /100 | #337 | Tragic 29.4% |
| Pima | 0.0 /100 | #338 | Tragic 30.3% |
| Cheyenne | 0.0 /100 | #339 | Tragic 30.4% |
| Cajuns | 0.0 /100 | #340 | Tragic 30.6% |
| Sioux | 0.0 /100 | #341 | Tragic 31.3% |
| Navajo | 0.0 /100 | #342 | Tragic 31.7% |
| Crow | 0.0 /100 | #343 | Tragic 32.4% |
| Lumbee | 0.0 /100 | #344 | Tragic 33.0% |
Demographics Similar to Hispanics or Latinos by Single Female Poverty
In terms of single female poverty, the demographic groups most similar to Hispanics or Latinos are French American Indian (24.6%, a difference of 0.35%), African (24.8%, a difference of 0.48%), American (24.5%, a difference of 0.49%), Alsatian (24.5%, a difference of 0.57%), and Immigrants from Central America (24.8%, a difference of 0.76%).
| Demographics | Rating | Rank | Single Female Poverty |
| Spanish Americans | 0.0 /100 | #288 | Tragic 24.2% |
| U.S. Virgin Islanders | 0.0 /100 | #289 | Tragic 24.2% |
| Indonesians | 0.0 /100 | #290 | Tragic 24.3% |
| Osage | 0.0 /100 | #291 | Tragic 24.4% |
| Alsatians | 0.0 /100 | #292 | Tragic 24.5% |
| Americans | 0.0 /100 | #293 | Tragic 24.5% |
| French American Indians | 0.0 /100 | #294 | Tragic 24.6% |
| Hispanics or Latinos | 0.0 /100 | #295 | Tragic 24.6% |
| Africans | 0.0 /100 | #296 | Tragic 24.8% |
| Immigrants | Central America | 0.0 /100 | #297 | Tragic 24.8% |
| Yaqui | 0.0 /100 | #298 | Tragic 24.9% |
| Mexicans | 0.0 /100 | #299 | Tragic 25.0% |
| Blackfeet | 0.0 /100 | #300 | Tragic 25.1% |
| Hondurans | 0.0 /100 | #301 | Tragic 25.1% |
| Shoshone | 0.0 /100 | #302 | Tragic 25.1% |