Colombian vs Hispanic or Latino Single Female Poverty
COMPARE
Colombian
Hispanic or Latino
Single Female Poverty
Single Female Poverty Comparison
Colombians
Hispanics or Latinos
19.9%
SINGLE FEMALE POVERTY
96.6/ 100
METRIC RATING
109th/ 347
METRIC RANK
24.6%
SINGLE FEMALE POVERTY
0.0/ 100
METRIC RATING
295th/ 347
METRIC RANK
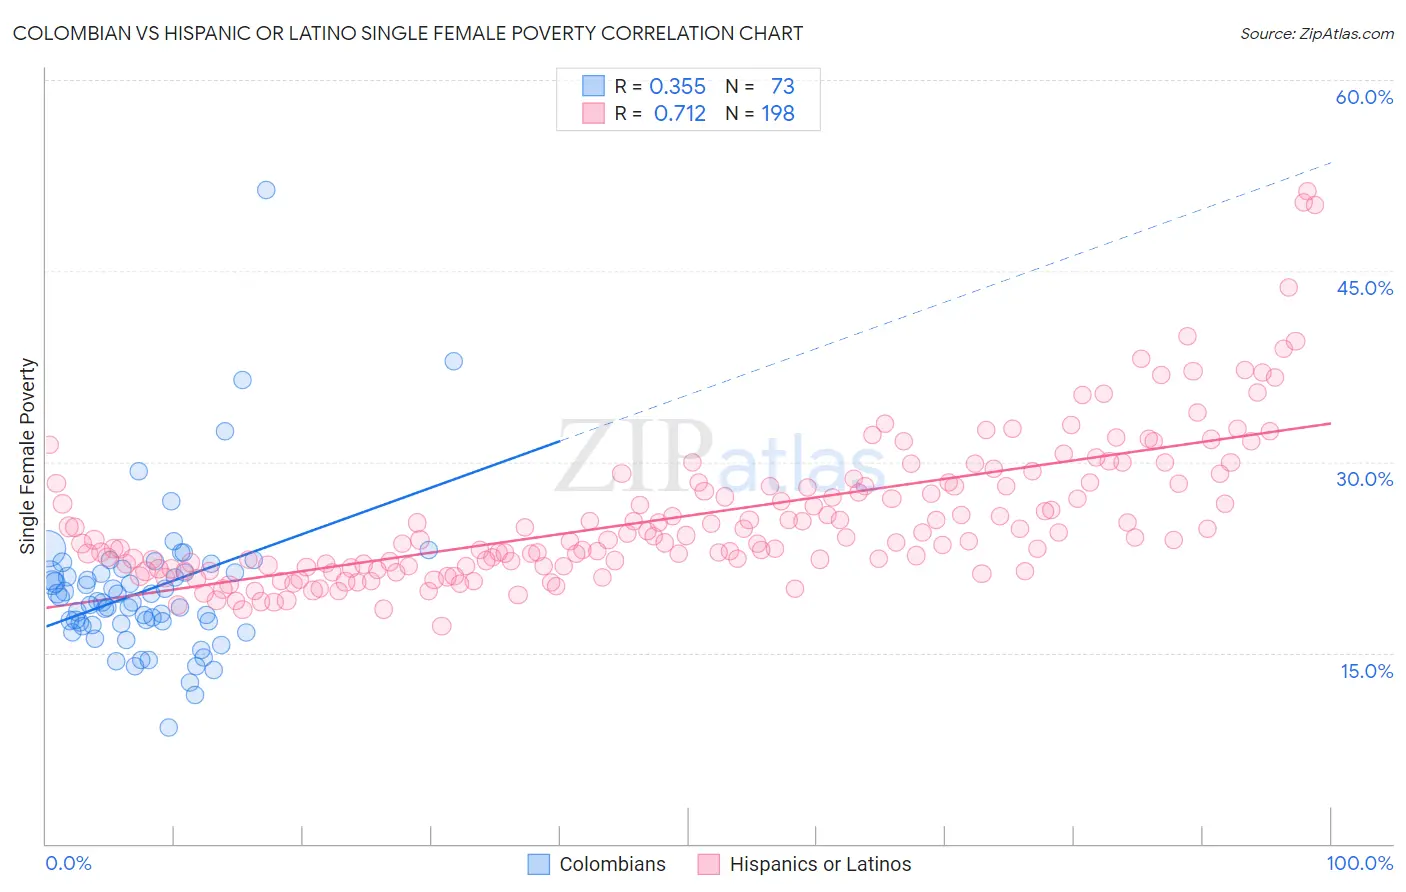
Colombian vs Hispanic or Latino Single Female Poverty Correlation Chart
The statistical analysis conducted on geographies consisting of 412,800,850 people shows a mild positive correlation between the proportion of Colombians and poverty level among single females in the United States with a correlation coefficient (R) of 0.355 and weighted average of 19.9%. Similarly, the statistical analysis conducted on geographies consisting of 554,629,261 people shows a strong positive correlation between the proportion of Hispanics or Latinos and poverty level among single females in the United States with a correlation coefficient (R) of 0.712 and weighted average of 24.6%, a difference of 23.7%.
Single Female Poverty Correlation Summary
| Measurement | Colombian | Hispanic or Latino |
| Minimum | 9.2% | 17.1% |
| Maximum | 51.3% | 51.2% |
| Range | 42.2% | 34.2% |
| Mean | 19.9% | 25.7% |
| Median | 19.0% | 23.9% |
| Interquartile 25% (IQ1) | 17.2% | 21.8% |
| Interquartile 75% (IQ3) | 21.3% | 28.3% |
| Interquartile Range (IQR) | 4.1% | 6.5% |
| Standard Deviation (Sample) | 6.0% | 5.8% |
| Standard Deviation (Population) | 6.0% | 5.8% |
Similar Demographics by Single Female Poverty
Demographics Similar to Colombians by Single Female Poverty
In terms of single female poverty, the demographic groups most similar to Colombians are Native Hawaiian (19.9%, a difference of 0.0%), Immigrants from Western Asia (19.9%, a difference of 0.010%), Immigrants from Syria (19.9%, a difference of 0.060%), Ethiopian (19.9%, a difference of 0.070%), and Israeli (19.9%, a difference of 0.17%).
| Demographics | Rating | Rank | Single Female Poverty |
| Immigrants | Cameroon | 97.3 /100 | #102 | Exceptional 19.8% |
| Immigrants | Southern Europe | 97.1 /100 | #103 | Exceptional 19.9% |
| Chileans | 96.9 /100 | #104 | Exceptional 19.9% |
| Israelis | 96.9 /100 | #105 | Exceptional 19.9% |
| Ethiopians | 96.7 /100 | #106 | Exceptional 19.9% |
| Immigrants | Syria | 96.7 /100 | #107 | Exceptional 19.9% |
| Native Hawaiians | 96.6 /100 | #108 | Exceptional 19.9% |
| Colombians | 96.6 /100 | #109 | Exceptional 19.9% |
| Immigrants | Western Asia | 96.5 /100 | #110 | Exceptional 19.9% |
| Carpatho Rusyns | 96.1 /100 | #111 | Exceptional 20.0% |
| Immigrants | Netherlands | 96.0 /100 | #112 | Exceptional 20.0% |
| Immigrants | Zimbabwe | 95.9 /100 | #113 | Exceptional 20.0% |
| Immigrants | Colombia | 95.9 /100 | #114 | Exceptional 20.0% |
| Immigrants | Northern Africa | 95.8 /100 | #115 | Exceptional 20.0% |
| Immigrants | Kazakhstan | 95.7 /100 | #116 | Exceptional 20.0% |
Demographics Similar to Hispanics or Latinos by Single Female Poverty
In terms of single female poverty, the demographic groups most similar to Hispanics or Latinos are French American Indian (24.6%, a difference of 0.35%), African (24.8%, a difference of 0.48%), American (24.5%, a difference of 0.49%), Alsatian (24.5%, a difference of 0.57%), and Immigrants from Central America (24.8%, a difference of 0.76%).
| Demographics | Rating | Rank | Single Female Poverty |
| Spanish Americans | 0.0 /100 | #288 | Tragic 24.2% |
| U.S. Virgin Islanders | 0.0 /100 | #289 | Tragic 24.2% |
| Indonesians | 0.0 /100 | #290 | Tragic 24.3% |
| Osage | 0.0 /100 | #291 | Tragic 24.4% |
| Alsatians | 0.0 /100 | #292 | Tragic 24.5% |
| Americans | 0.0 /100 | #293 | Tragic 24.5% |
| French American Indians | 0.0 /100 | #294 | Tragic 24.6% |
| Hispanics or Latinos | 0.0 /100 | #295 | Tragic 24.6% |
| Africans | 0.0 /100 | #296 | Tragic 24.8% |
| Immigrants | Central America | 0.0 /100 | #297 | Tragic 24.8% |
| Yaqui | 0.0 /100 | #298 | Tragic 24.9% |
| Mexicans | 0.0 /100 | #299 | Tragic 25.0% |
| Blackfeet | 0.0 /100 | #300 | Tragic 25.1% |
| Hondurans | 0.0 /100 | #301 | Tragic 25.1% |
| Shoshone | 0.0 /100 | #302 | Tragic 25.1% |