Zip Codes with the Highest Percentage of Population Employed in Food Preparation & Serving in Alamogordo, NM
RELATED REPORTS & OPTIONS
Select to Compare
Select to Compare
Compare Zip Codes
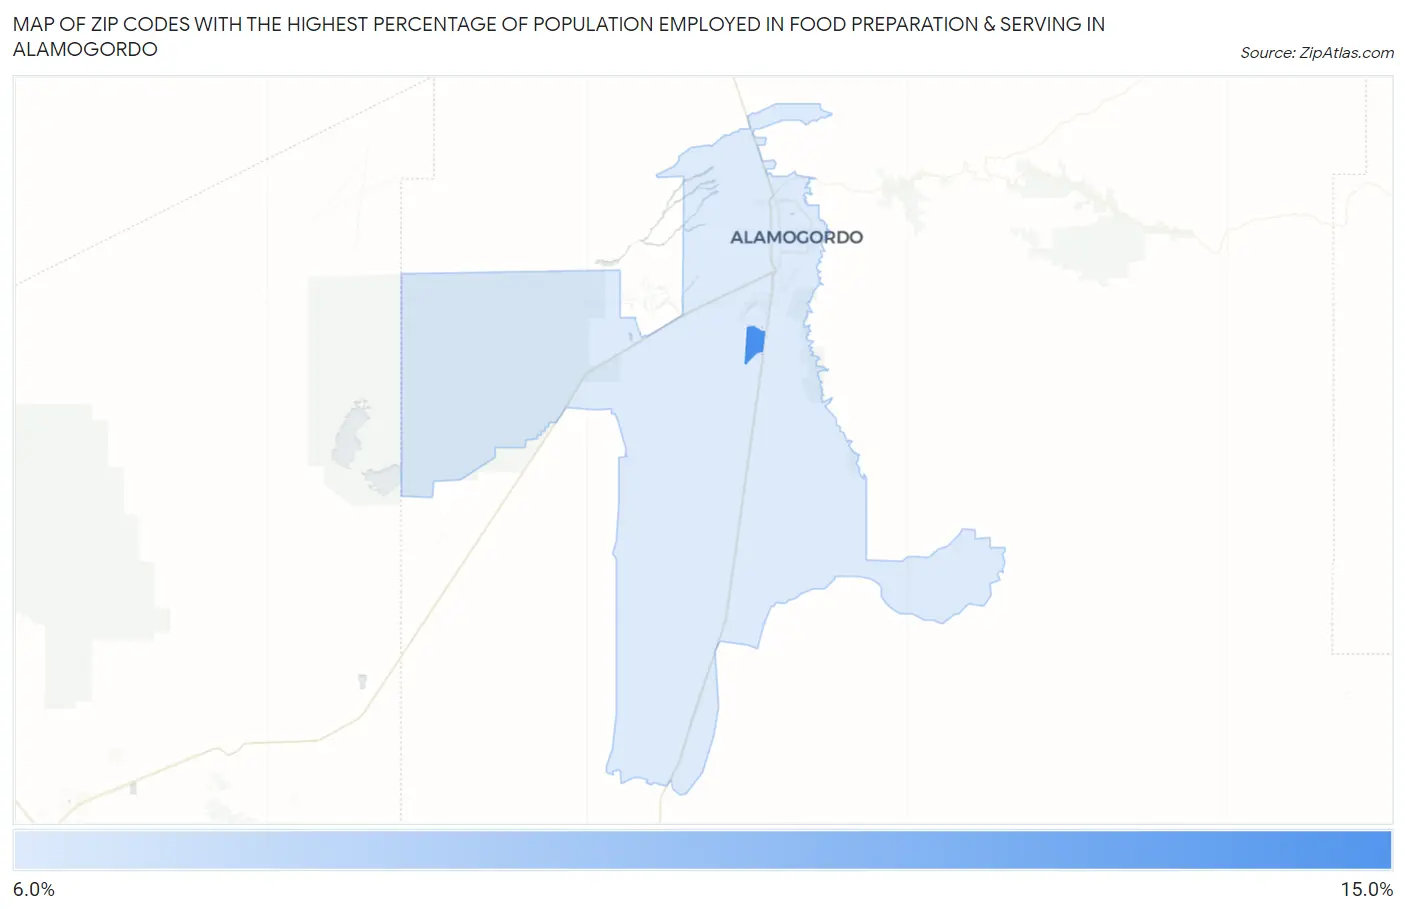
Map of Zip Codes with the Highest Percentage of Population Employed in Food Preparation & Serving in Alamogordo
6.0%
6.0%
Zip Codes with the Highest Percentage of Population Employed in Food Preparation & Serving in Alamogordo, NM
| Zip Code | % Employed | vs State | vs National | |
| 1. | 88310 | 6.0% | 5.8%(+0.249)#111 | 5.3%(+0.719)#9,330 |
1
Common Questions
What are the Top Zip Codes with the Highest Percentage of Population Employed in Food Preparation & Serving in Alamogordo, NM?
Top Zip Codes with the Highest Percentage of Population Employed in Food Preparation & Serving in Alamogordo, NM are:
What zip code has the Highest Percentage of Population Employed in Food Preparation & Serving in Alamogordo, NM?
88310 has the Highest Percentage of Population Employed in Food Preparation & Serving in Alamogordo, NM with 6.0%.
What is the Percentage of Population Employed in Food Preparation & Serving in Alamogordo, NM?
Percentage of Population Employed in Food Preparation & Serving in Alamogordo is 6.3%.
What is the Percentage of Population Employed in Food Preparation & Serving in New Mexico?
Percentage of Population Employed in Food Preparation & Serving in New Mexico is 5.8%.
What is the Percentage of Population Employed in Food Preparation & Serving in the United States?
Percentage of Population Employed in Food Preparation & Serving in the United States is 5.3%.