Zip Codes with the Most Immigrants from Asia in Alamogordo, NM
RELATED REPORTS & OPTIONS
Asia
Alamogordo
Compare Zip Codes
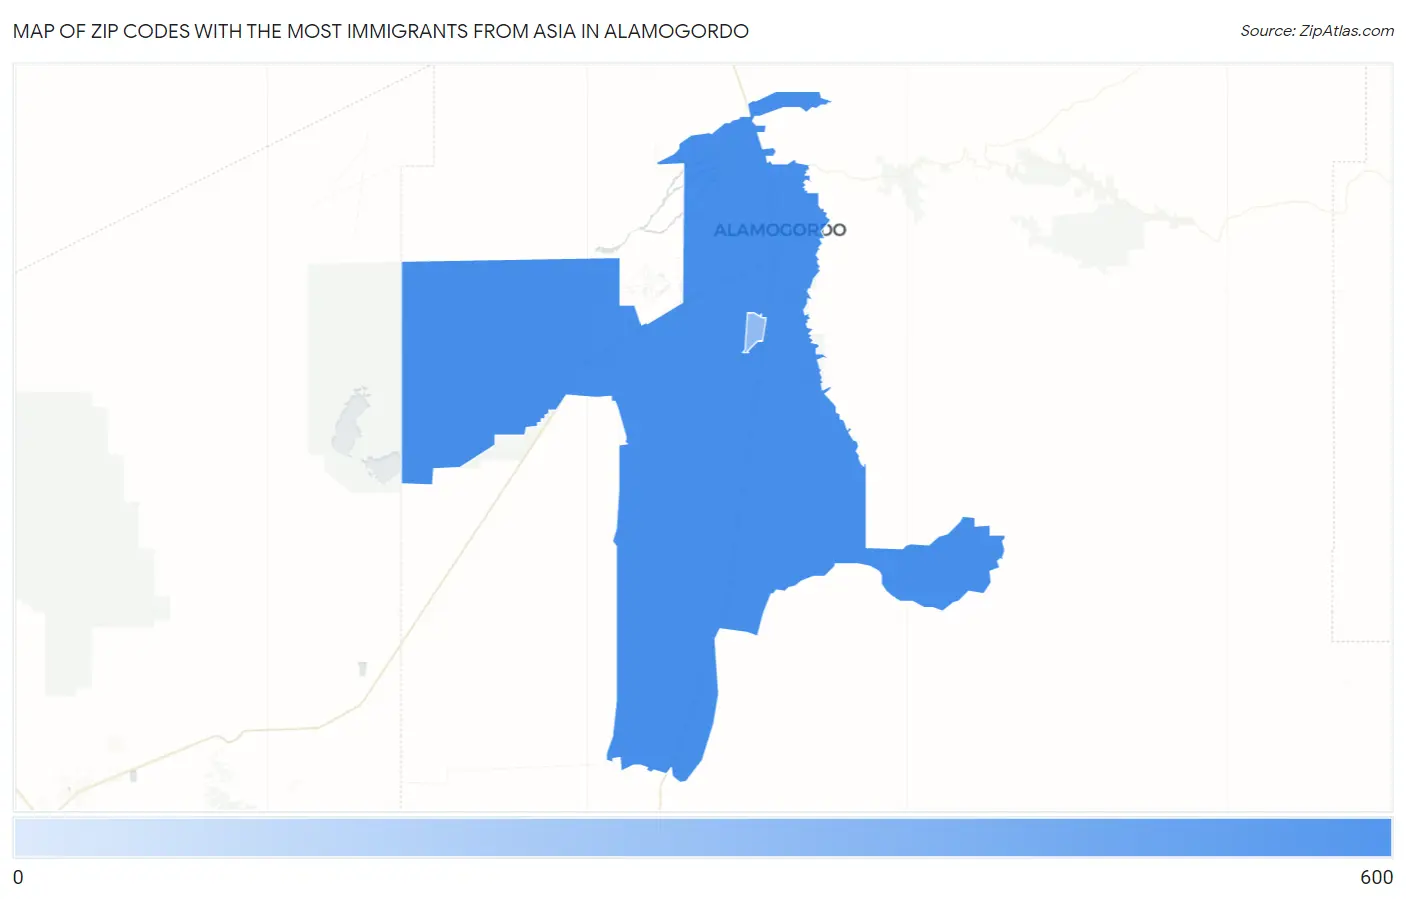
Map of Zip Codes with the Most Immigrants from Asia in Alamogordo
21
566
Zip Codes with the Most Immigrants from Asia in Alamogordo, NM
| Zip Code | Asia | vs State | vs National | |
| 1. | 88310 | 566 | 27,577(2.05%)#20 | 14,105,933(0.00%)#4,680 |
| 2. | 88311 | 21 | 27,577(0.08%)#76 | 14,105,933(0.00%)#13,605 |
1
Common Questions
What are the Top Zip Codes with the Most Immigrants from Asia in Alamogordo, NM?
Top Zip Codes with the Most Immigrants from Asia in Alamogordo, NM are:
What zip code has the Most Immigrants from Asia in Alamogordo, NM?
88310 has the Most Immigrants from Asia in Alamogordo, NM with 566.
What is the Total Immigrants from Asia in Alamogordo, NM?
Total Immigrants from Asia in Alamogordo is 546.
What is the Total Immigrants from Asia in New Mexico?
Total Immigrants from Asia in New Mexico is 27,577.
What is the Total Immigrants from Asia in the United States?
Total Immigrants from Asia in the United States is 14,105,933.