Sheridan County, ND Map & Demographics
Sheridan County Map
Sheridan County Overview
$40,365
PER CAPITA INCOME
$90,104
AVG FAMILY INCOME
$68,684
AVG HOUSEHOLD INCOME
37.4%
WAGE / INCOME GAP [ % ]
62.6¢/ $1
WAGE / INCOME GAP [ $ ]
0.41
INEQUALITY / GINI INDEX
1,338
TOTAL POPULATION
682
MALE POPULATION
656
FEMALE POPULATION
103.96
MALES / 100 FEMALES
96.19
FEMALES / 100 MALES
52.3
MEDIAN AGE
2.6
AVG FAMILY SIZE
2.1
AVG HOUSEHOLD SIZE
633
LABOR FORCE [ PEOPLE ]
54.0%
PERCENT IN LABOR FORCE
0.8%
UNEMPLOYMENT RATE
Sheridan County Area Codes
Income in Sheridan County
Income Overview in Sheridan County
Per Capita Income in Sheridan County is $40,365, while median incomes of families and households are $90,104 and $68,684 respectively.
| Characteristic | Number | Measure |
| Per Capita Income | 1,338 | $40,365 |
| Median Family Income | 384 | $90,104 |
| Mean Family Income | 384 | $98,210 |
| Median Household Income | 644 | $68,684 |
| Mean Household Income | 644 | $83,864 |
| Income Deficit | 384 | $0 |
| Wage / Income Gap (%) | 1,338 | 37.43% |
| Wage / Income Gap ($) | 1,338 | 62.57¢ per $1 |
| Gini / Inequality Index | 1,338 | 0.41 |
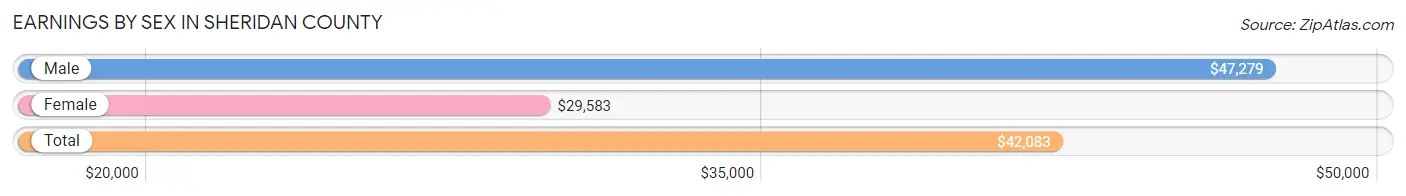
Earnings by Sex in Sheridan County
Average Earnings in Sheridan County are $42,083, $47,279 for men and $29,583 for women, a difference of 37.4%.
| Sex | Number | Average Earnings |
| Male | 401 (56.4%) | $47,279 |
| Female | 310 (43.6%) | $29,583 |
| Total | 711 (100.0%) | $42,083 |
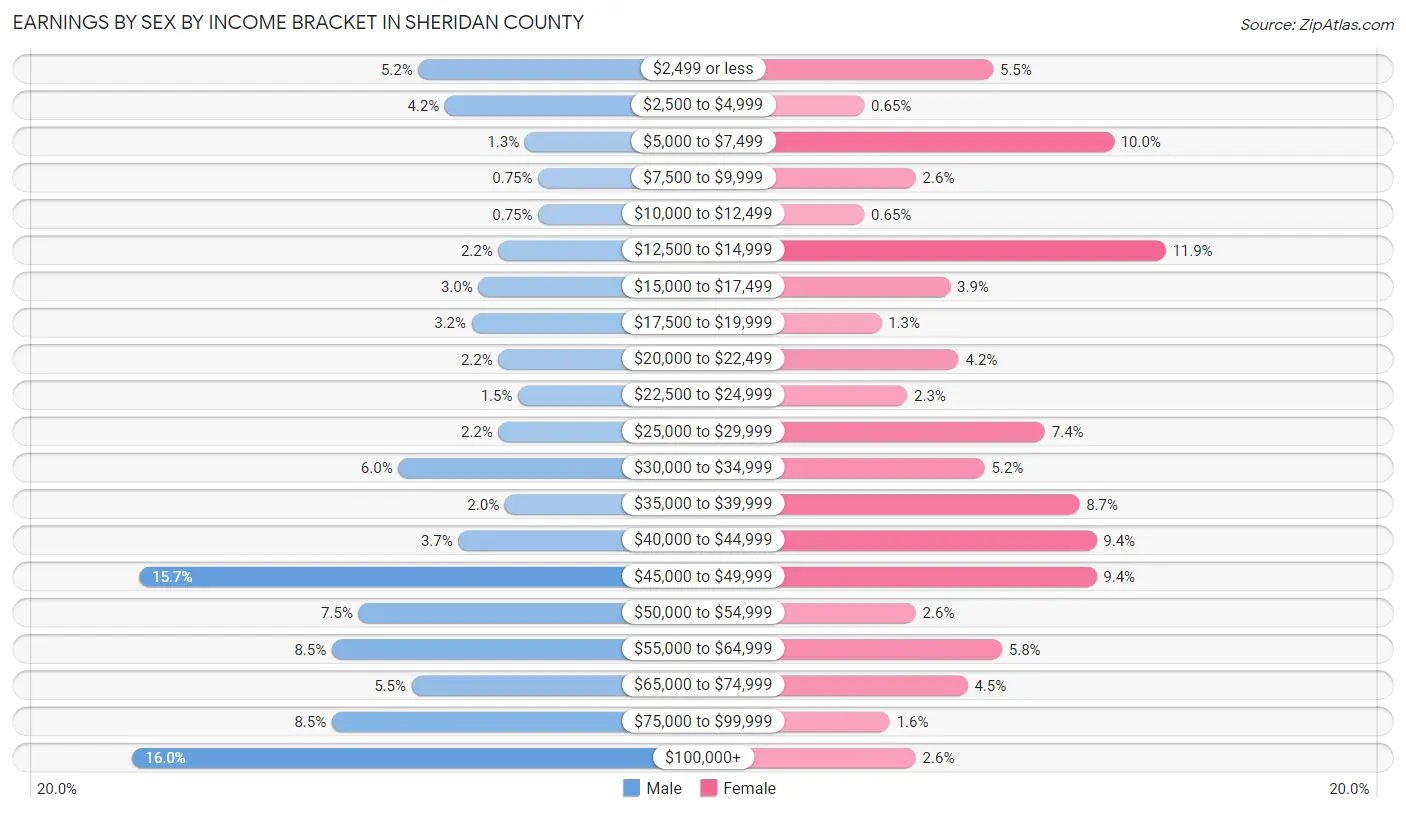
Earnings by Sex by Income Bracket in Sheridan County
The most common earnings brackets in Sheridan County are $100,000+ for men (64 | 16.0%) and $12,500 to $14,999 for women (37 | 11.9%).
| Income | Male | Female |
| $2,499 or less | 21 (5.2%) | 17 (5.5%) |
| $2,500 to $4,999 | 17 (4.2%) | 2 (0.6%) |
| $5,000 to $7,499 | 5 (1.3%) | 31 (10.0%) |
| $7,500 to $9,999 | 3 (0.7%) | 8 (2.6%) |
| $10,000 to $12,499 | 3 (0.7%) | 2 (0.6%) |
| $12,500 to $14,999 | 9 (2.2%) | 37 (11.9%) |
| $15,000 to $17,499 | 12 (3.0%) | 12 (3.9%) |
| $17,500 to $19,999 | 13 (3.2%) | 4 (1.3%) |
| $20,000 to $22,499 | 9 (2.2%) | 13 (4.2%) |
| $22,500 to $24,999 | 6 (1.5%) | 7 (2.3%) |
| $25,000 to $29,999 | 9 (2.2%) | 23 (7.4%) |
| $30,000 to $34,999 | 24 (6.0%) | 16 (5.2%) |
| $35,000 to $39,999 | 8 (2.0%) | 27 (8.7%) |
| $40,000 to $44,999 | 15 (3.7%) | 29 (9.3%) |
| $45,000 to $49,999 | 63 (15.7%) | 29 (9.3%) |
| $50,000 to $54,999 | 30 (7.5%) | 8 (2.6%) |
| $55,000 to $64,999 | 34 (8.5%) | 18 (5.8%) |
| $65,000 to $74,999 | 22 (5.5%) | 14 (4.5%) |
| $75,000 to $99,999 | 34 (8.5%) | 5 (1.6%) |
| $100,000+ | 64 (16.0%) | 8 (2.6%) |
| Total | 401 (100.0%) | 310 (100.0%) |
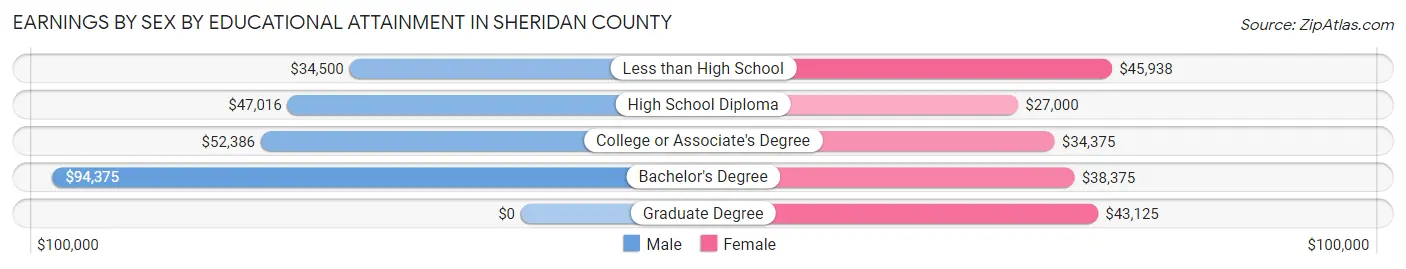
Earnings by Sex by Educational Attainment in Sheridan County
Average earnings in Sheridan County are $48,646 for men and $33,958 for women, a difference of 30.2%. Men with an educational attainment of bachelor's degree enjoy the highest average annual earnings of $94,375, while those with less than high school education earn the least with $34,500. Women with an educational attainment of less than high school earn the most with the average annual earnings of $45,938, while those with high school diploma education have the smallest earnings of $27,000.
| Educational Attainment | Male Income | Female Income |
| Less than High School | $34,500 | $45,938 |
| High School Diploma | $47,016 | $27,000 |
| College or Associate's Degree | $52,386 | $34,375 |
| Bachelor's Degree | $94,375 | $38,375 |
| Graduate Degree | - | - |
| Total | $48,646 | $33,958 |
Family Income in Sheridan County
Family Income Brackets in Sheridan County
According to the Sheridan County family income data, there are 99 families falling into the $100,000 to $149,999 income range, which is the most common income bracket and makes up 25.8% of all families.
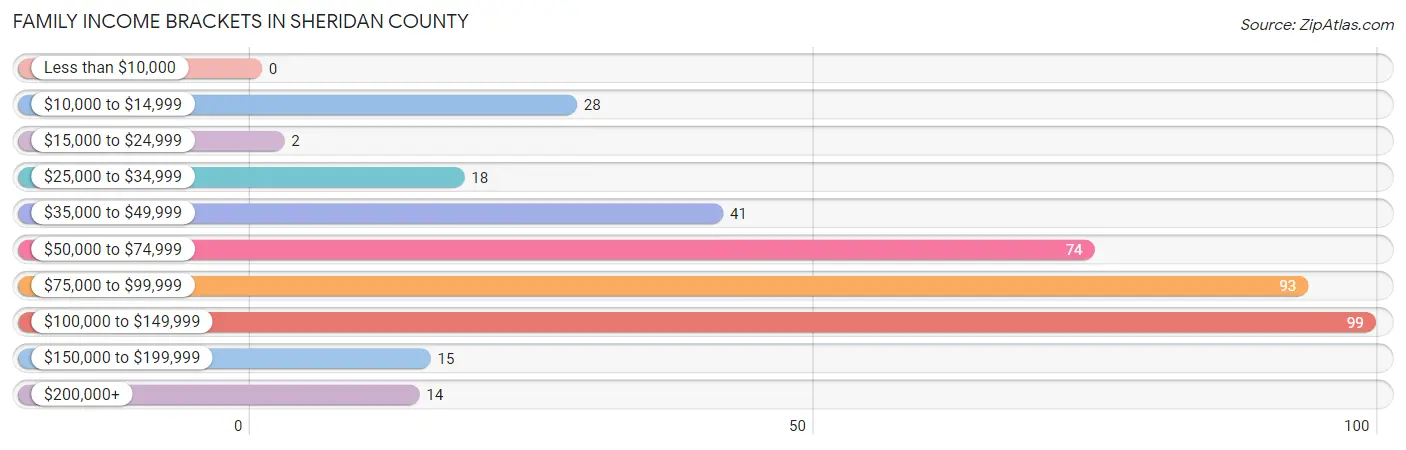
| Income Bracket | # Families | % Families |
| Less than $10,000 | 0 | 0.0% |
| $10,000 to $14,999 | 28 | 7.3% |
| $15,000 to $24,999 | 2 | 0.5% |
| $25,000 to $34,999 | 18 | 4.7% |
| $35,000 to $49,999 | 41 | 10.7% |
| $50,000 to $74,999 | 74 | 19.3% |
| $75,000 to $99,999 | 93 | 24.2% |
| $100,000 to $149,999 | 99 | 25.8% |
| $150,000 to $199,999 | 15 | 3.9% |
| $200,000+ | 14 | 3.6% |
Family Income by Famaliy Size in Sheridan County
6-person families (11 | 2.9%) account for the highest median family income in Sheridan County with $125,208 per family, while 3-person families (39 | 10.2%) have the highest median income of $41,042 per family member.
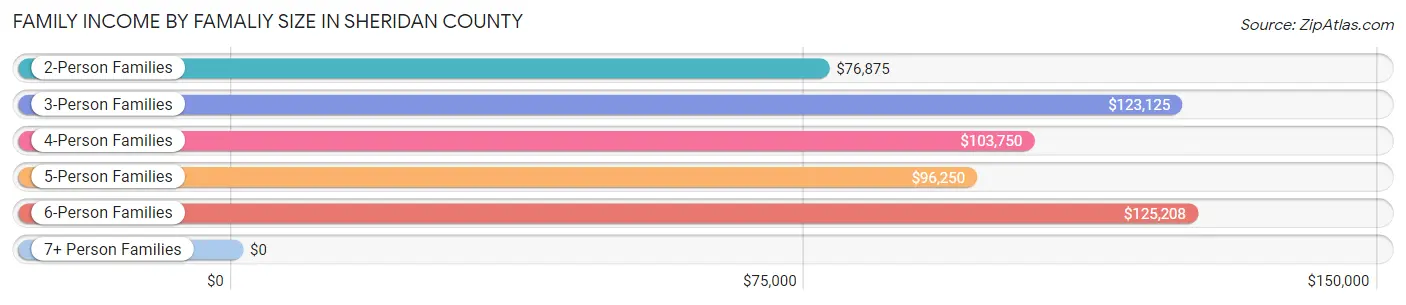
| Income Bracket | # Families | Median Income |
| 2-Person Families | 279 (72.7%) | $76,875 |
| 3-Person Families | 39 (10.2%) | $123,125 |
| 4-Person Families | 22 (5.7%) | $103,750 |
| 5-Person Families | 33 (8.6%) | $96,250 |
| 6-Person Families | 11 (2.9%) | $125,208 |
| 7+ Person Families | 0 (0.0%) | $0 |
| Total | 384 (100.0%) | $90,104 |
Family Income by Number of Earners in Sheridan County
The median family income in Sheridan County is $90,104, with families comprising 3+ earners (23) having the highest median family income of $123,125, while families with no earners (77) have the lowest median family income of $55,625, accounting for 6.0% and 20.1% of families, respectively.
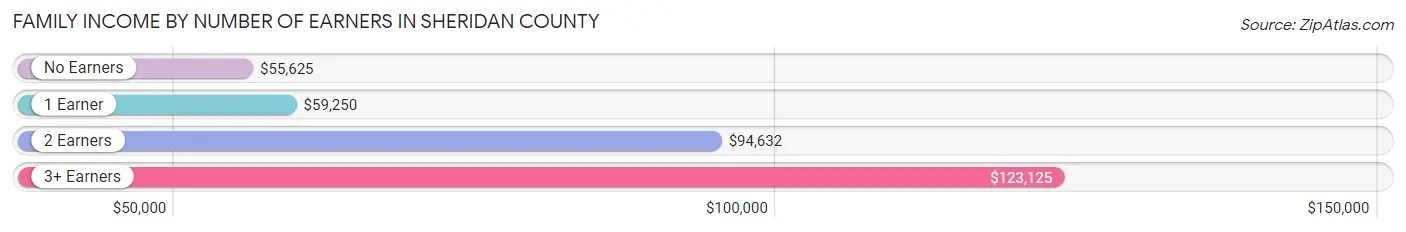
| Number of Earners | # Families | Median Income |
| No Earners | 77 (20.1%) | $55,625 |
| 1 Earner | 119 (31.0%) | $59,250 |
| 2 Earners | 165 (43.0%) | $94,632 |
| 3+ Earners | 23 (6.0%) | $123,125 |
| Total | 384 (100.0%) | $90,104 |
Household Income in Sheridan County
Household Income Brackets in Sheridan County
With 138 households falling in the category, the $50,000 to $74,999 income range is the most frequent in Sheridan County, accounting for 21.4% of all households. In contrast, only 17 households (2.6%) fall into the less than $10,000 income bracket, making it the least populous group.
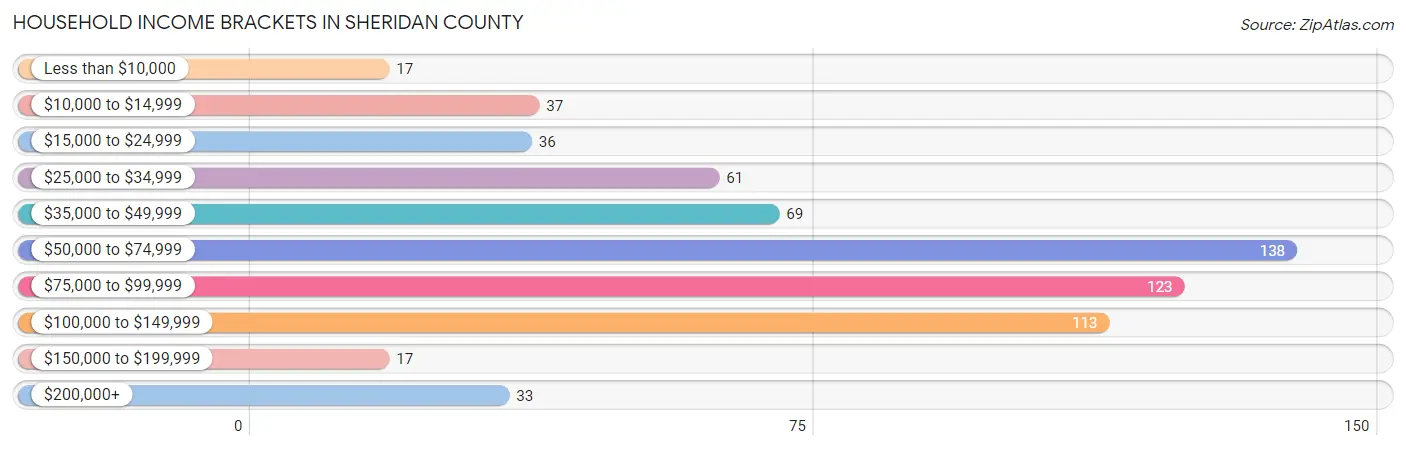
| Income Bracket | # Households | % Households |
| Less than $10,000 | 17 | 2.6% |
| $10,000 to $14,999 | 37 | 5.7% |
| $15,000 to $24,999 | 36 | 5.6% |
| $25,000 to $34,999 | 61 | 9.5% |
| $35,000 to $49,999 | 69 | 10.7% |
| $50,000 to $74,999 | 138 | 21.4% |
| $75,000 to $99,999 | 123 | 19.1% |
| $100,000 to $149,999 | 113 | 17.5% |
| $150,000 to $199,999 | 17 | 2.6% |
| $200,000+ | 33 | 5.1% |
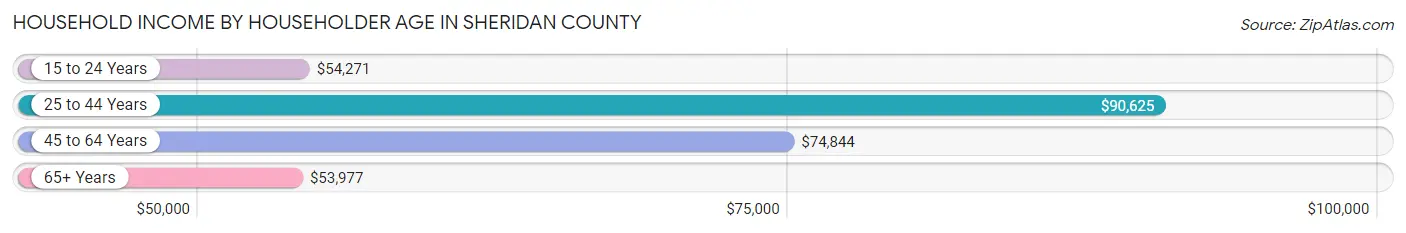
Household Income by Householder Age in Sheridan County
The median household income in Sheridan County is $68,684, with the highest median household income of $90,625 found in the 25 to 44 years age bracket for the primary householder. A total of 109 households (16.9%) fall into this category. Meanwhile, the 65+ years age bracket for the primary householder has the lowest median household income of $53,977, with 309 households (48.0%) in this group.
| Income Bracket | # Households | Median Income |
| 15 to 24 Years | 27 (4.2%) | $54,271 |
| 25 to 44 Years | 109 (16.9%) | $90,625 |
| 45 to 64 Years | 199 (30.9%) | $74,844 |
| 65+ Years | 309 (48.0%) | $53,977 |
| Total | 644 (100.0%) | $68,684 |
Poverty in Sheridan County
Income Below Poverty by Sex and Age in Sheridan County
With 5.0% poverty level for males and 8.9% for females among the residents of Sheridan County, under 5 year old males and 18 to 24 year old females are the most vulnerable to poverty, with 9 males (30.0%) and 12 females (40.0%) in their respective age groups living below the poverty level.
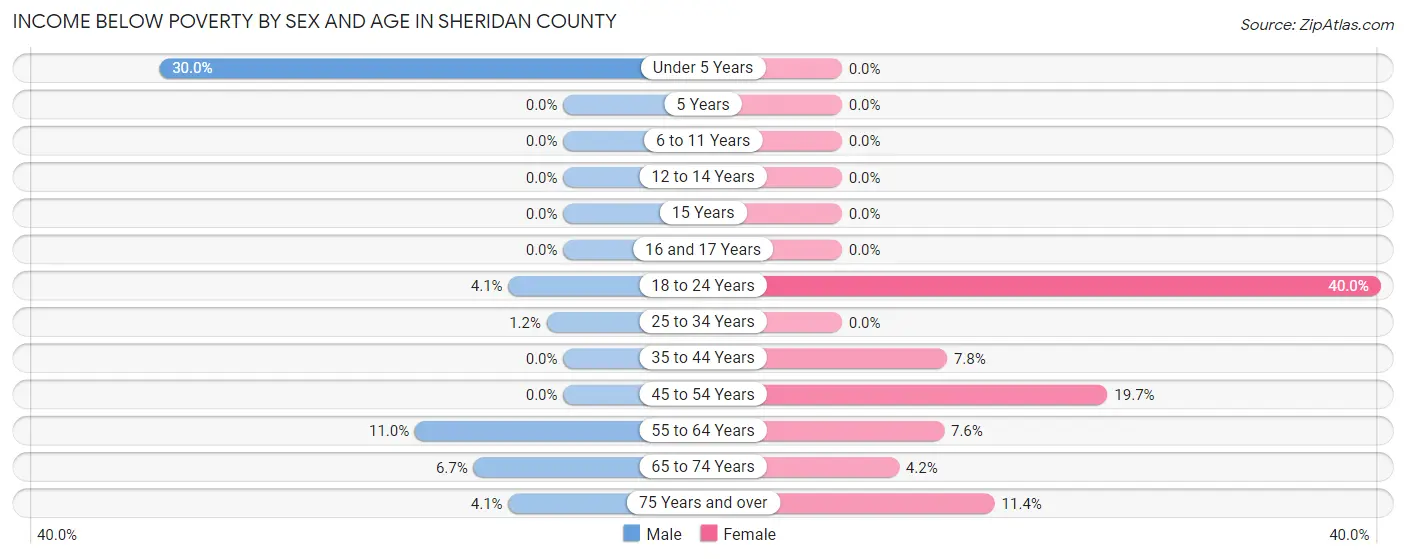
| Age Bracket | Male | Female |
| Under 5 Years | 9 (30.0%) | 0 (0.0%) |
| 5 Years | 0 (0.0%) | 0 (0.0%) |
| 6 to 11 Years | 0 (0.0%) | 0 (0.0%) |
| 12 to 14 Years | 0 (0.0%) | 0 (0.0%) |
| 15 Years | 0 (0.0%) | 0 (0.0%) |
| 16 and 17 Years | 0 (0.0%) | 0 (0.0%) |
| 18 to 24 Years | 2 (4.1%) | 12 (40.0%) |
| 25 to 34 Years | 1 (1.2%) | 0 (0.0%) |
| 35 to 44 Years | 0 (0.0%) | 5 (7.8%) |
| 45 to 54 Years | 0 (0.0%) | 14 (19.7%) |
| 55 to 64 Years | 12 (11.0%) | 6 (7.6%) |
| 65 to 74 Years | 6 (6.7%) | 5 (4.2%) |
| 75 Years and over | 4 (4.1%) | 16 (11.4%) |
| Total | 34 (5.0%) | 58 (8.9%) |
Income Above Poverty by Sex and Age in Sheridan County
According to the poverty statistics in Sheridan County, males aged 5 years and females aged under 5 years are the age groups that are most secure financially, with 100.0% of males and 100.0% of females in these age groups living above the poverty line.
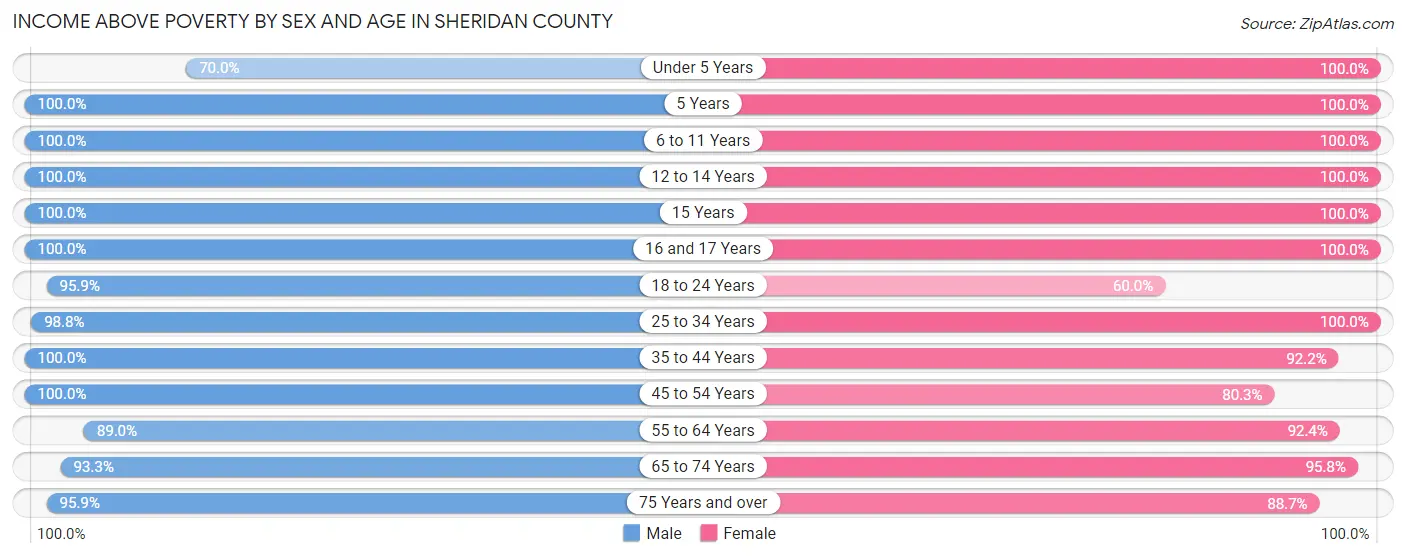
| Age Bracket | Male | Female |
| Under 5 Years | 21 (70.0%) | 21 (100.0%) |
| 5 Years | 7 (100.0%) | 5 (100.0%) |
| 6 to 11 Years | 16 (100.0%) | 38 (100.0%) |
| 12 to 14 Years | 13 (100.0%) | 14 (100.0%) |
| 15 Years | 1 (100.0%) | 11 (100.0%) |
| 16 and 17 Years | 23 (100.0%) | 16 (100.0%) |
| 18 to 24 Years | 47 (95.9%) | 18 (60.0%) |
| 25 to 34 Years | 80 (98.8%) | 43 (100.0%) |
| 35 to 44 Years | 74 (100.0%) | 59 (92.2%) |
| 45 to 54 Years | 85 (100.0%) | 57 (80.3%) |
| 55 to 64 Years | 97 (89.0%) | 73 (92.4%) |
| 65 to 74 Years | 84 (93.3%) | 113 (95.8%) |
| 75 Years and over | 94 (95.9%) | 125 (88.6%) |
| Total | 642 (95.0%) | 593 (91.1%) |
Income Below Poverty Among Married-Couple Families in Sheridan County
The poverty statistics for married-couple families in Sheridan County show that 2.9% or 9 of the total 310 families live below the poverty line. Families with no children have the highest poverty rate of 4.0%, comprising of 9 families. On the other hand, families with 1 or 2 children have the lowest poverty rate of 0.0%, which includes 0 families.
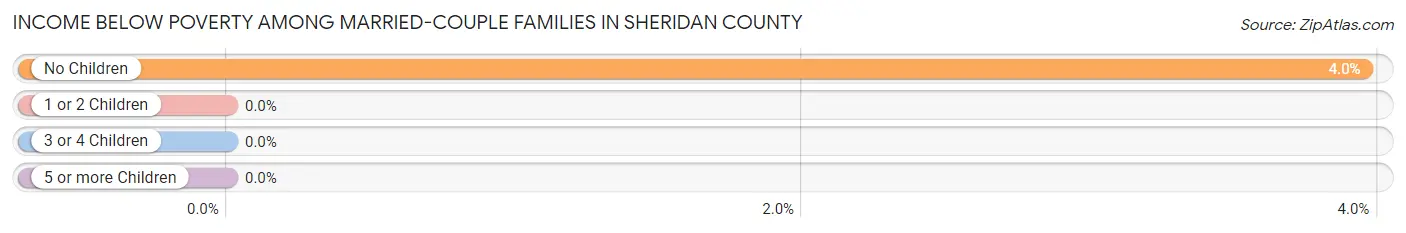
| Children | Above Poverty | Below Poverty |
| No Children | 219 (96.1%) | 9 (4.0%) |
| 1 or 2 Children | 51 (100.0%) | 0 (0.0%) |
| 3 or 4 Children | 31 (100.0%) | 0 (0.0%) |
| 5 or more Children | 0 (0.0%) | 0 (0.0%) |
| Total | 301 (97.1%) | 9 (2.9%) |
Income Below Poverty Among Single-Parent Households in Sheridan County
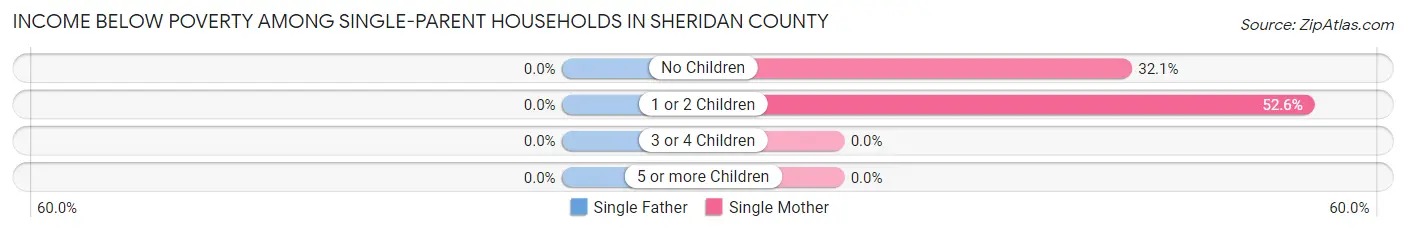
| Children | Single Father | Single Mother |
| No Children | 0 (0.0%) | 9 (32.1%) |
| 1 or 2 Children | 0 (0.0%) | 10 (52.6%) |
| 3 or 4 Children | 0 (0.0%) | 0 (0.0%) |
| 5 or more Children | 0 (0.0%) | 0 (0.0%) |
| Total | 0 (0.0%) | 19 (40.4%) |
Income Below Poverty Among Married-Couple vs Single-Parent Households in Sheridan County
The poverty data for Sheridan County shows that 9 of the married-couple family households (2.9%) and 19 of the single-parent households (25.7%) are living below the poverty level. Within the married-couple family households, those with no children have the highest poverty rate, with 9 households (4.0%) falling below the poverty line. Among the single-parent households, those with 1 or 2 children have the highest poverty rate, with 10 household (43.5%) living below poverty.
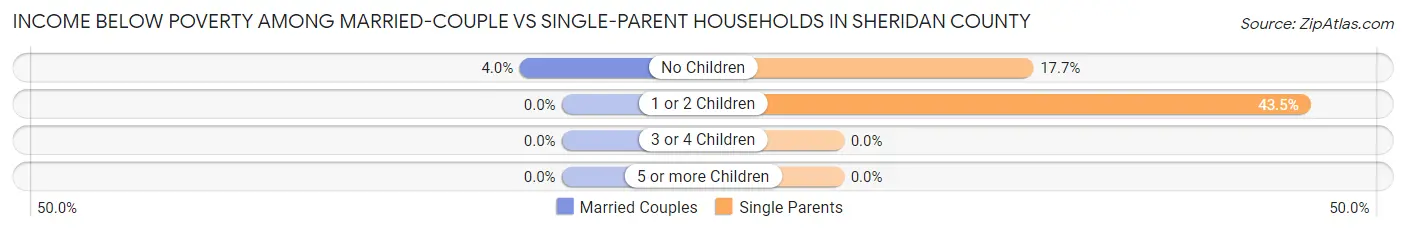
| Children | Married-Couple Families | Single-Parent Households |
| No Children | 9 (4.0%) | 9 (17.6%) |
| 1 or 2 Children | 0 (0.0%) | 10 (43.5%) |
| 3 or 4 Children | 0 (0.0%) | 0 (0.0%) |
| 5 or more Children | 0 (0.0%) | 0 (0.0%) |
| Total | 9 (2.9%) | 19 (25.7%) |
Race in Sheridan County
The most populous races in Sheridan County are White / Caucasian (1,282 | 95.8%), Two or more Races (38 | 2.8%), and Native / Alaskan (18 | 1.3%).
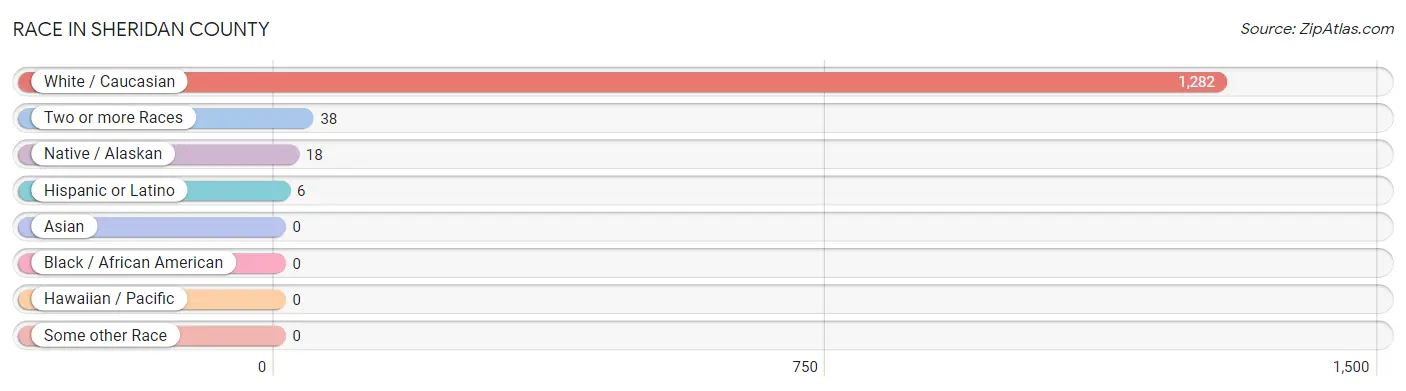
| Race | # Population | % Population |
| Asian | 0 | 0.0% |
| Black / African American | 0 | 0.0% |
| Hawaiian / Pacific | 0 | 0.0% |
| Hispanic or Latino | 6 | 0.4% |
| Native / Alaskan | 18 | 1.3% |
| White / Caucasian | 1,282 | 95.8% |
| Two or more Races | 38 | 2.8% |
| Some other Race | 0 | 0.0% |
| Total | 1,338 | 100.0% |
Ancestry in Sheridan County
The most populous ancestries reported in Sheridan County are German (717 | 53.6%), Norwegian (97 | 7.2%), Irish (82 | 6.1%), English (54 | 4.0%), and Czech (44 | 3.3%), together accounting for 74.3% of all Sheridan County residents.
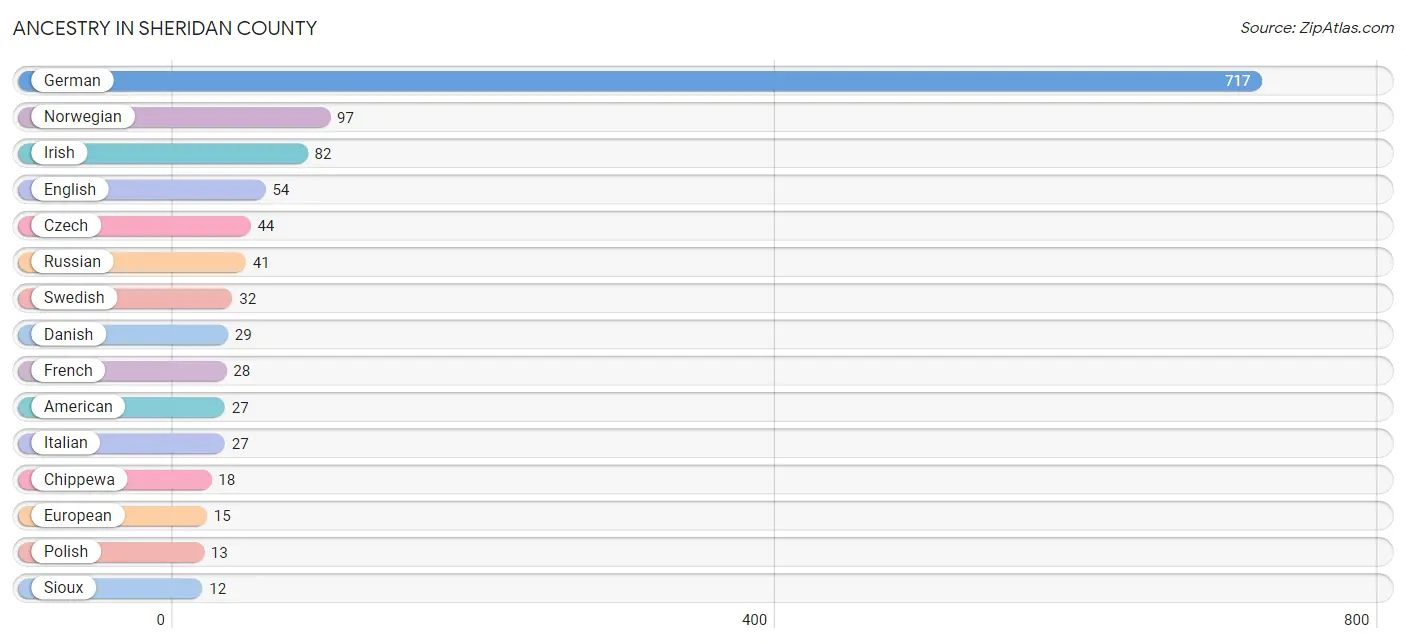
| Ancestry | # Population | % Population |
| American | 27 | 2.0% |
| Cherokee | 9 | 0.7% |
| Chippewa | 18 | 1.3% |
| Croatian | 6 | 0.4% |
| Czech | 44 | 3.3% |
| Danish | 29 | 2.2% |
| Dutch | 2 | 0.2% |
| English | 54 | 4.0% |
| European | 15 | 1.1% |
| French | 28 | 2.1% |
| French Canadian | 7 | 0.5% |
| German | 717 | 53.6% |
| German Russian | 10 | 0.7% |
| Icelander | 9 | 0.7% |
| Irish | 82 | 6.1% |
| Italian | 27 | 2.0% |
| Mexican | 2 | 0.2% |
| Norwegian | 97 | 7.2% |
| Polish | 13 | 1.0% |
| Portuguese | 6 | 0.4% |
| Romanian | 5 | 0.4% |
| Russian | 41 | 3.1% |
| Scandinavian | 11 | 0.8% |
| Scottish | 6 | 0.4% |
| Sioux | 12 | 0.9% |
| Spanish | 4 | 0.3% |
| Swedish | 32 | 2.4% |
| Swiss | 5 | 0.4% |
| Ukrainian | 2 | 0.2% |
| Welsh | 1 | 0.1% | View All 30 Rows |
Immigrants in Sheridan County
The most numerous immigrant groups reported in Sheridan County came from , and Canada (2 | 0.2%), together accounting for 0.2% of all Sheridan County residents.

| Immigration Origin | # Population | % Population |
| Canada | 2 | 0.2% | View All 1 Rows |
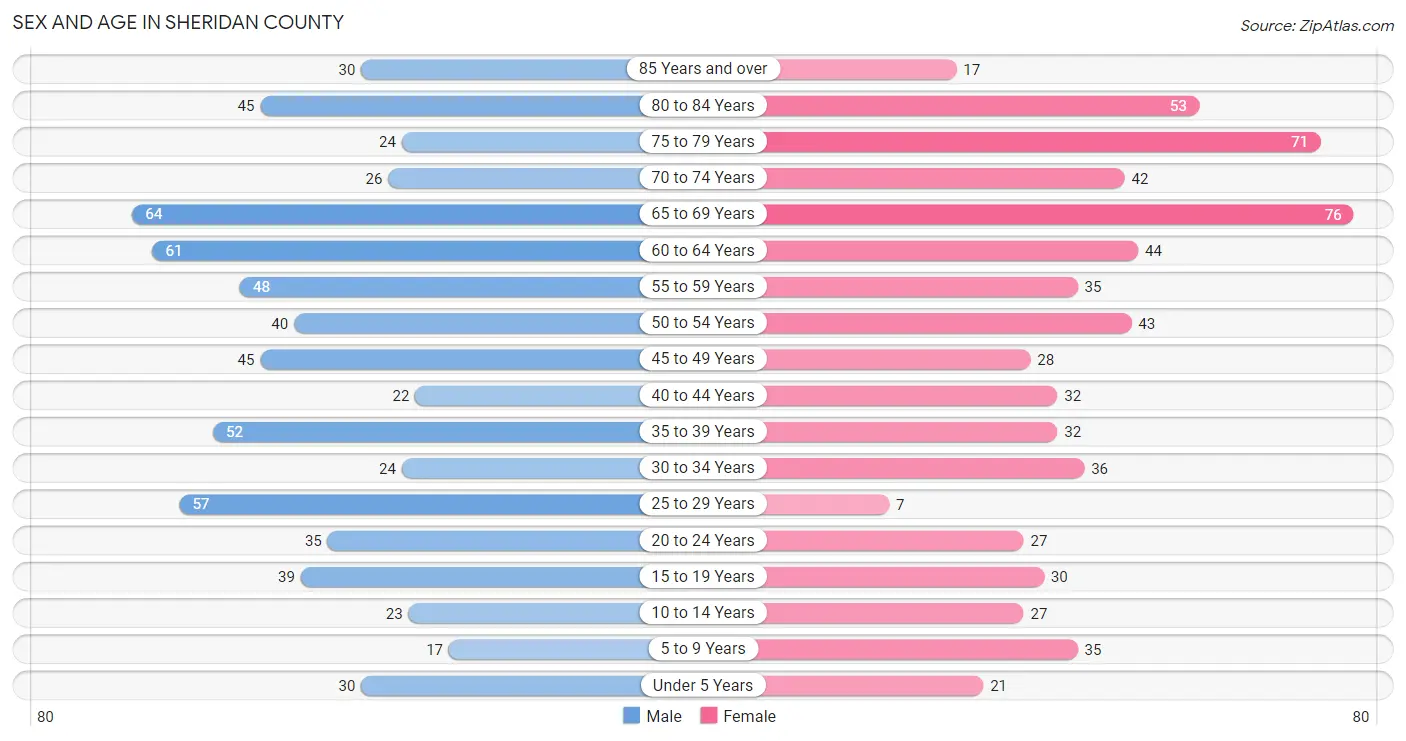
Sex and Age in Sheridan County
Sex and Age in Sheridan County
The most populous age groups in Sheridan County are 65 to 69 Years (64 | 9.4%) for men and 65 to 69 Years (76 | 11.6%) for women.
| Age Bracket | Male | Female |
| Under 5 Years | 30 (4.4%) | 21 (3.2%) |
| 5 to 9 Years | 17 (2.5%) | 35 (5.3%) |
| 10 to 14 Years | 23 (3.4%) | 27 (4.1%) |
| 15 to 19 Years | 39 (5.7%) | 30 (4.6%) |
| 20 to 24 Years | 35 (5.1%) | 27 (4.1%) |
| 25 to 29 Years | 57 (8.4%) | 7 (1.1%) |
| 30 to 34 Years | 24 (3.5%) | 36 (5.5%) |
| 35 to 39 Years | 52 (7.6%) | 32 (4.9%) |
| 40 to 44 Years | 22 (3.2%) | 32 (4.9%) |
| 45 to 49 Years | 45 (6.6%) | 28 (4.3%) |
| 50 to 54 Years | 40 (5.9%) | 43 (6.6%) |
| 55 to 59 Years | 48 (7.0%) | 35 (5.3%) |
| 60 to 64 Years | 61 (8.9%) | 44 (6.7%) |
| 65 to 69 Years | 64 (9.4%) | 76 (11.6%) |
| 70 to 74 Years | 26 (3.8%) | 42 (6.4%) |
| 75 to 79 Years | 24 (3.5%) | 71 (10.8%) |
| 80 to 84 Years | 45 (6.6%) | 53 (8.1%) |
| 85 Years and over | 30 (4.4%) | 17 (2.6%) |
| Total | 682 (100.0%) | 656 (100.0%) |
Families and Households in Sheridan County
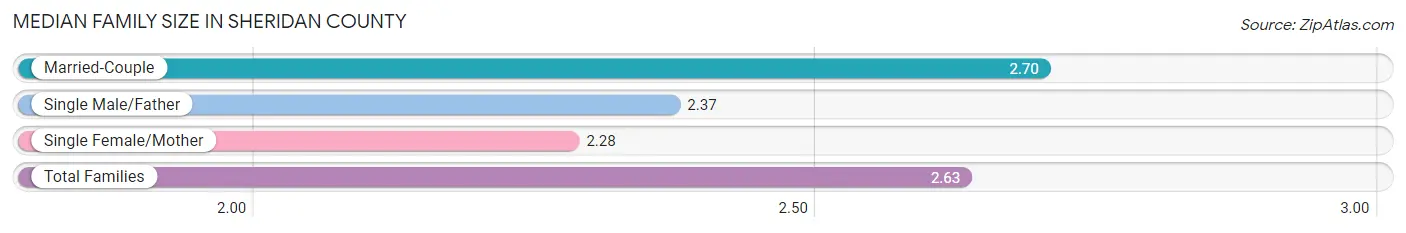
Median Family Size in Sheridan County
The median family size in Sheridan County is 2.63 persons per family, with married-couple families (310 | 80.7%) accounting for the largest median family size of 2.7 persons per family. On the other hand, single female/mother families (47 | 12.2%) represent the smallest median family size with 2.28 persons per family.
| Family Type | # Families | Family Size |
| Married-Couple | 310 (80.7%) | 2.70 |
| Single Male/Father | 27 (7.0%) | 2.37 |
| Single Female/Mother | 47 (12.2%) | 2.28 |
| Total Families | 384 (100.0%) | 2.63 |
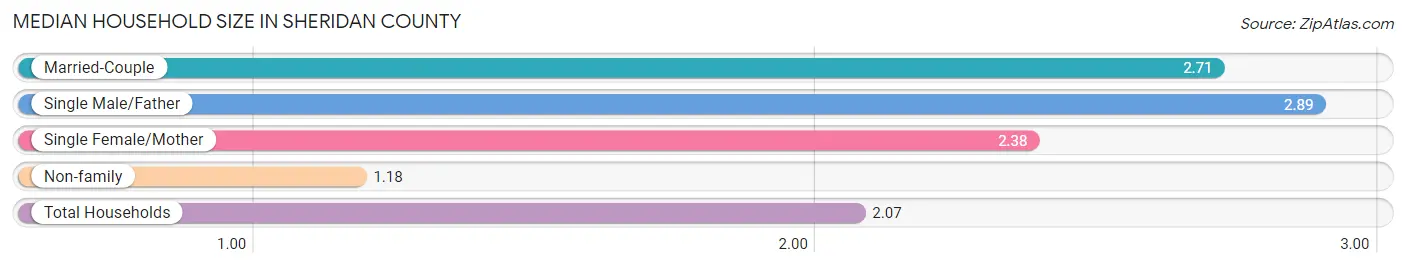
Median Household Size in Sheridan County
The median household size in Sheridan County is 2.07 persons per household, with single male/father households (27 | 4.2%) accounting for the largest median household size of 2.89 persons per household. non-family households (260 | 40.4%) represent the smallest median household size with 1.18 persons per household.
| Household Type | # Households | Household Size |
| Married-Couple | 310 (48.1%) | 2.71 |
| Single Male/Father | 27 (4.2%) | 2.89 |
| Single Female/Mother | 47 (7.3%) | 2.38 |
| Non-family | 260 (40.4%) | 1.18 |
| Total Households | 644 (100.0%) | 2.07 |
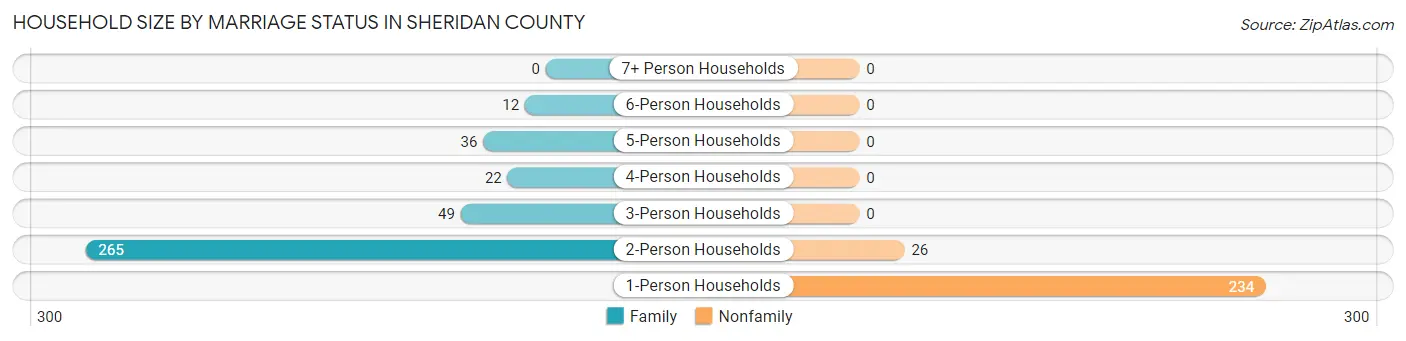
Household Size by Marriage Status in Sheridan County
Out of a total of 644 households in Sheridan County, 384 (59.6%) are family households, while 260 (40.4%) are nonfamily households. The most numerous type of family households are 2-person households, comprising 265, and the most common type of nonfamily households are 1-person households, comprising 234.
| Household Size | Family Households | Nonfamily Households |
| 1-Person Households | - | 234 (36.3%) |
| 2-Person Households | 265 (41.1%) | 26 (4.0%) |
| 3-Person Households | 49 (7.6%) | 0 (0.0%) |
| 4-Person Households | 22 (3.4%) | 0 (0.0%) |
| 5-Person Households | 36 (5.6%) | 0 (0.0%) |
| 6-Person Households | 12 (1.9%) | 0 (0.0%) |
| 7+ Person Households | 0 (0.0%) | 0 (0.0%) |
| Total | 384 (59.6%) | 260 (40.4%) |
Female Fertility in Sheridan County
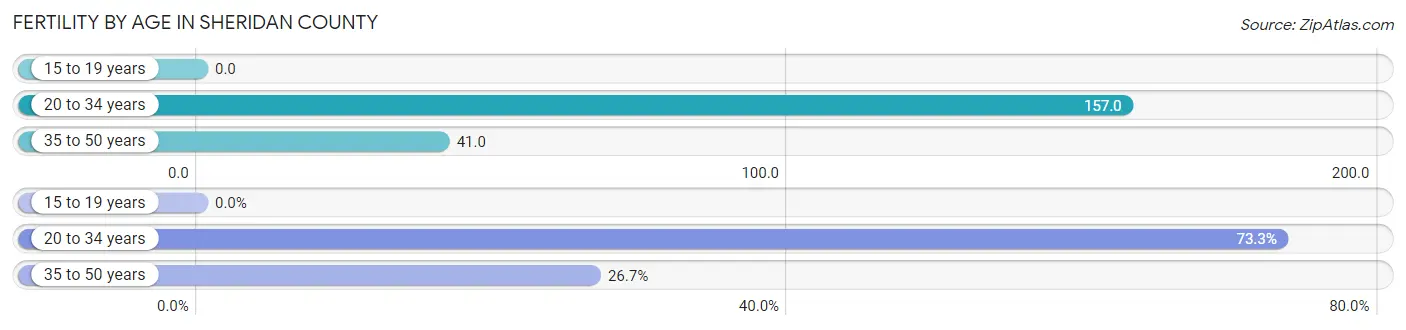
Fertility by Age in Sheridan County
Average fertility rate in Sheridan County is 76.0 births per 1,000 women. Women in the age bracket of 20 to 34 years have the highest fertility rate with 157.0 births per 1,000 women. Women in the age bracket of 20 to 34 years acount for 73.3% of all women with births.
| Age Bracket | Women with Births | Births / 1,000 Women |
| 15 to 19 years | 0 (0.0%) | 0.0 |
| 20 to 34 years | 11 (73.3%) | 157.0 |
| 35 to 50 years | 4 (26.7%) | 41.0 |
| Total | 15 (100.0%) | 76.0 |
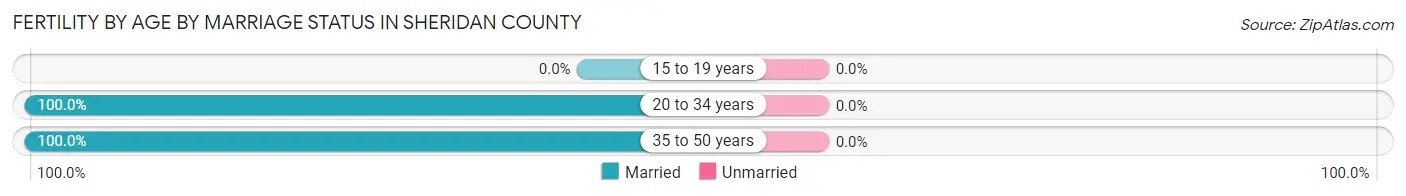
Fertility by Age by Marriage Status in Sheridan County
| Age Bracket | Married | Unmarried |
| 15 to 19 years | 0 (0.0%) | 0 (0.0%) |
| 20 to 34 years | 11 (100.0%) | 0 (0.0%) |
| 35 to 50 years | 4 (100.0%) | 0 (0.0%) |
| Total | 15 (100.0%) | 0 (0.0%) |
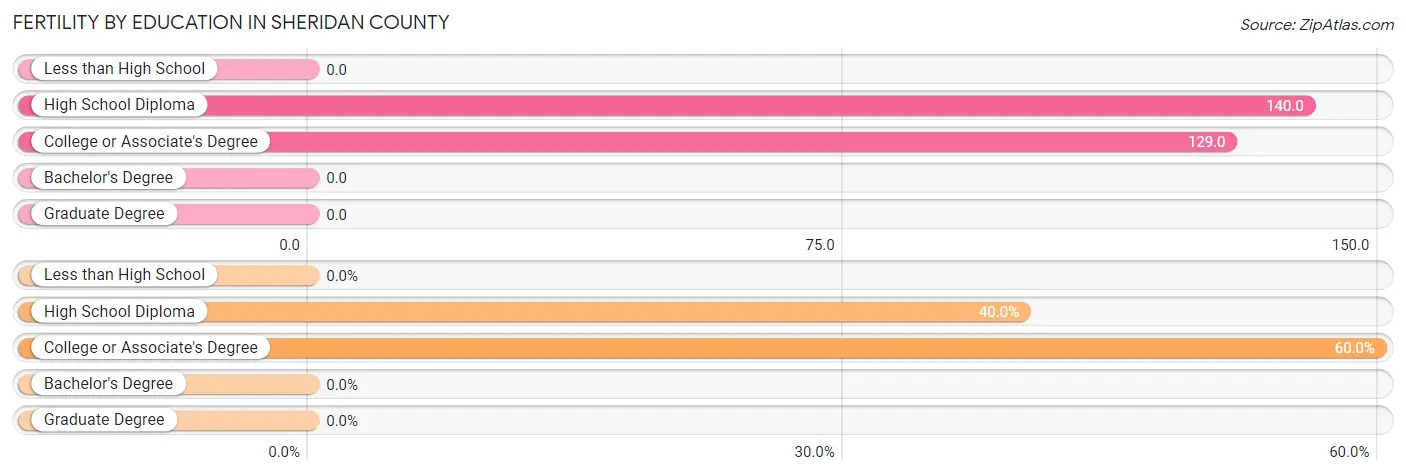
Fertility by Education in Sheridan County
| Educational Attainment | Women with Births | Births / 1,000 Women |
| Less than High School | 0 (0.0%) | 0.0 |
| High School Diploma | 6 (40.0%) | 140.0 |
| College or Associate's Degree | 9 (60.0%) | 129.0 |
| Bachelor's Degree | 0 (0.0%) | 0.0 |
| Graduate Degree | 0 (0.0%) | 0.0 |
| Total | 15 (100.0%) | 76.0 |
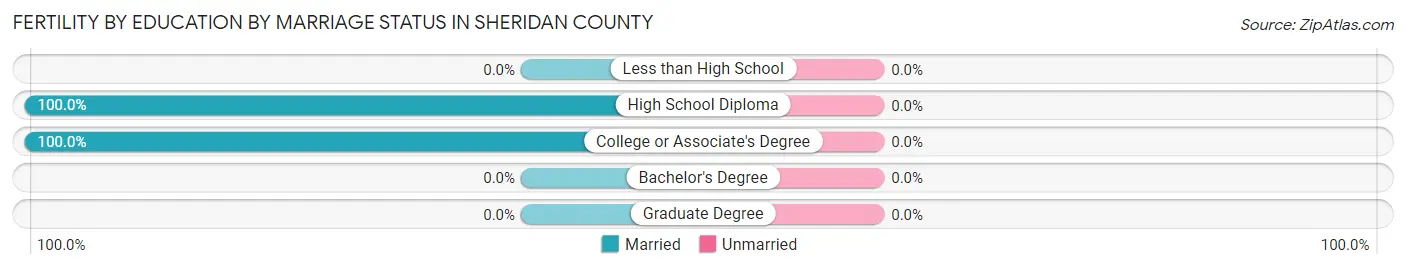
Fertility by Education by Marriage Status in Sheridan County
| Educational Attainment | Married | Unmarried |
| Less than High School | 0 (0.0%) | 0 (0.0%) |
| High School Diploma | 6 (100.0%) | 0 (0.0%) |
| College or Associate's Degree | 9 (100.0%) | 0 (0.0%) |
| Bachelor's Degree | 0 (0.0%) | 0 (0.0%) |
| Graduate Degree | 0 (0.0%) | 0 (0.0%) |
| Total | 15 (100.0%) | 0 (0.0%) |
Employment Characteristics in Sheridan County
Employment by Class of Employer in Sheridan County
Among the 624 employed individuals in Sheridan County, private company employees (329 | 52.7%), self-employed (not incorporated) (140 | 22.4%), and local government employees (55 | 8.8%) make up the most common classes of employment.
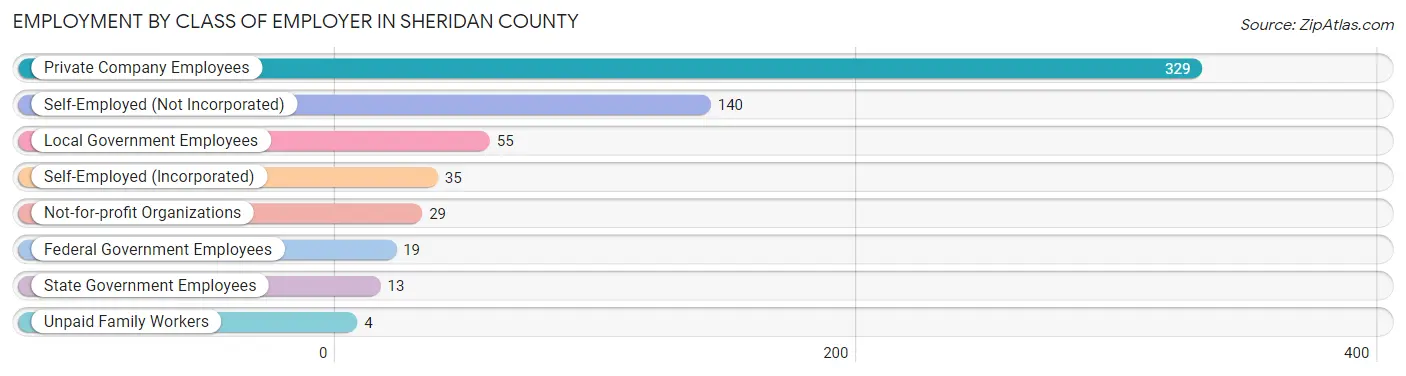
| Employer Class | # Employees | % Employees |
| Private Company Employees | 329 | 52.7% |
| Self-Employed (Incorporated) | 35 | 5.6% |
| Self-Employed (Not Incorporated) | 140 | 22.4% |
| Not-for-profit Organizations | 29 | 4.6% |
| Local Government Employees | 55 | 8.8% |
| State Government Employees | 13 | 2.1% |
| Federal Government Employees | 19 | 3.0% |
| Unpaid Family Workers | 4 | 0.6% |
| Total | 624 | 100.0% |
Employment Status by Age in Sheridan County
According to the labor force statistics for Sheridan County, out of the total population over 16 years of age (1,173), 54.0% or 633 individuals are in the labor force, with 0.8% or 5 of them unemployed. The age group with the highest labor force participation rate is 25 to 29 years, with 95.3% or 61 individuals in the labor force. Within the labor force, the 20 to 24 years age range has the highest percentage of unemployed individuals, with 3.4% or 2 of them being unemployed.
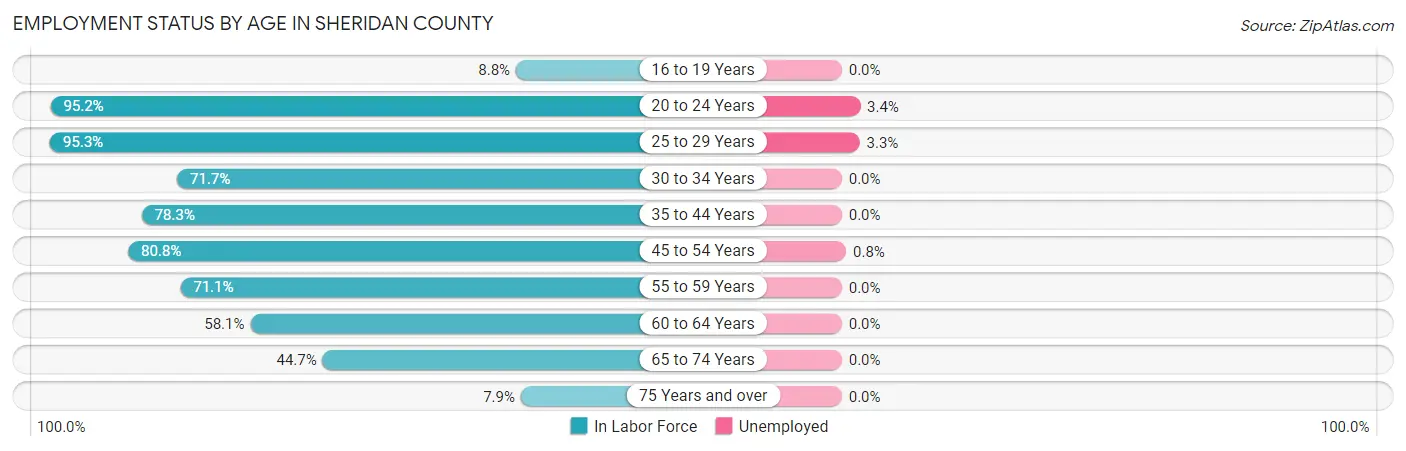
| Age Bracket | In Labor Force | Unemployed |
| 16 to 19 Years | 5 (8.8%) | 0 (0.0%) |
| 20 to 24 Years | 59 (95.2%) | 2 (3.4%) |
| 25 to 29 Years | 61 (95.3%) | 2 (3.3%) |
| 30 to 34 Years | 43 (71.7%) | 0 (0.0%) |
| 35 to 44 Years | 108 (78.3%) | 0 (0.0%) |
| 45 to 54 Years | 126 (80.8%) | 1 (0.8%) |
| 55 to 59 Years | 59 (71.1%) | 0 (0.0%) |
| 60 to 64 Years | 61 (58.1%) | 0 (0.0%) |
| 65 to 74 Years | 93 (44.7%) | 0 (0.0%) |
| 75 Years and over | 19 (7.9%) | 0 (0.0%) |
| Total | 633 (54.0%) | 5 (0.8%) |
Employment Status by Educational Attainment in Sheridan County
According to labor force statistics for Sheridan County, 75.6% of individuals (458) out of the total population between 25 and 64 years of age (606) are in the labor force, with 0.7% or 3 of them being unemployed. The group with the highest labor force participation rate are those with the educational attainment of less than high school, with 90.9% or 40 individuals in the labor force. Within the labor force, individuals with less than high school education have the highest percentage of unemployment, with 5.0% or 2 of them being unemployed.
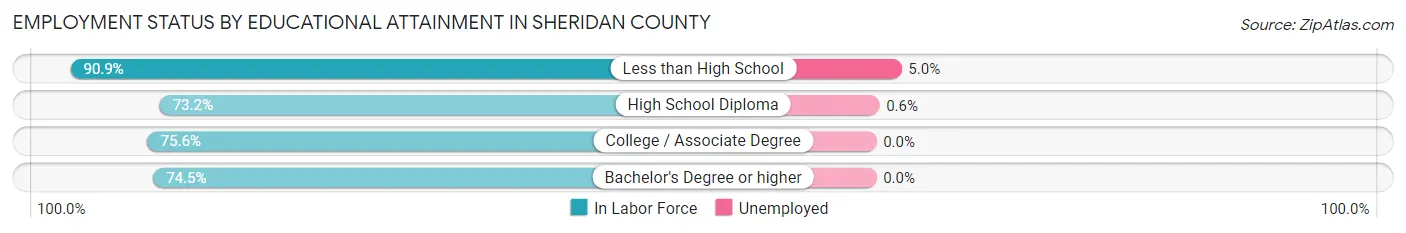
| Educational Attainment | In Labor Force | Unemployed |
| Less than High School | 40 (90.9%) | 2 (5.0%) |
| High School Diploma | 172 (73.2%) | 1 (0.6%) |
| College / Associate Degree | 167 (75.6%) | 0 (0.0%) |
| Bachelor's Degree or higher | 79 (74.5%) | 0 (0.0%) |
| Total | 458 (75.6%) | 4 (0.7%) |
Employment Occupations by Sex in Sheridan County
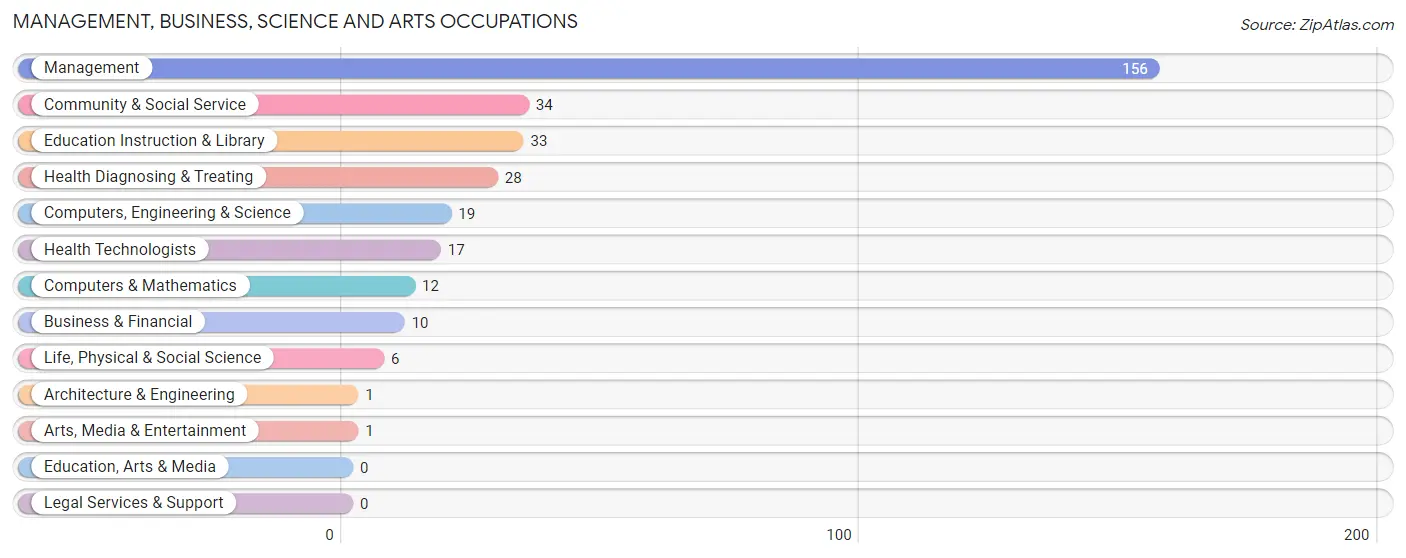
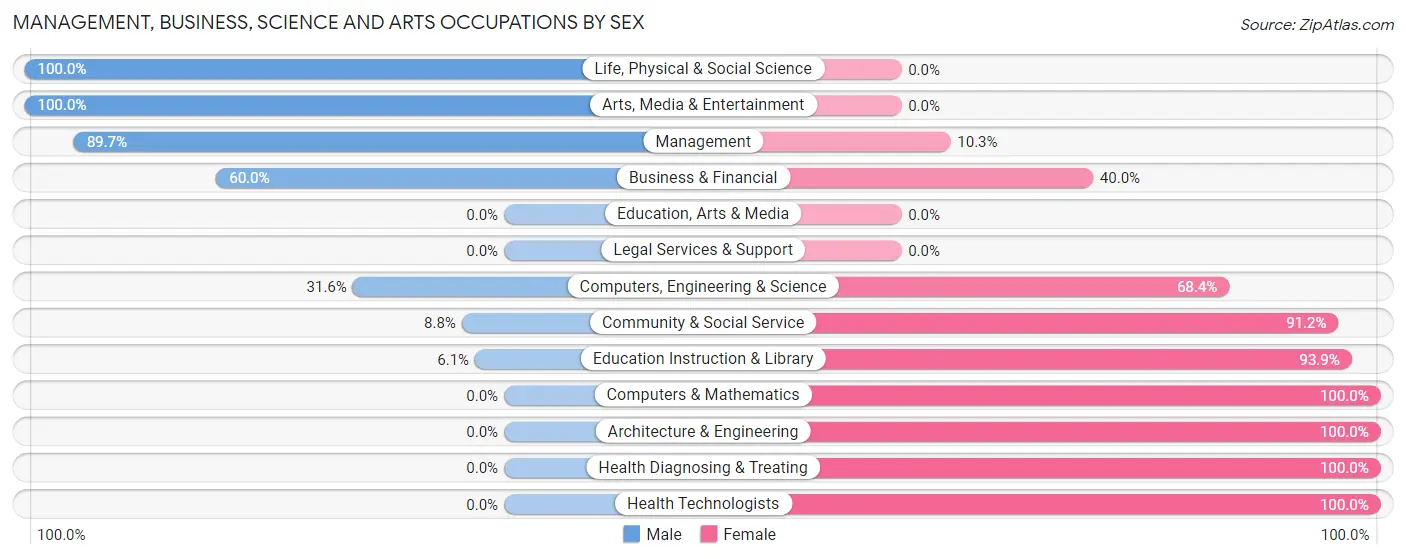
Management, Business, Science and Arts Occupations
The most common Management, Business, Science and Arts occupations in Sheridan County are Management (156 | 24.8%), Community & Social Service (34 | 5.4%), Education Instruction & Library (33 | 5.2%), Health Diagnosing & Treating (28 | 4.4%), and Computers, Engineering & Science (19 | 3.0%).
Management, Business, Science and Arts Occupations by Sex
Within the Management, Business, Science and Arts occupations in Sheridan County, the most male-oriented occupations are Life, Physical & Social Science (100.0%), Arts, Media & Entertainment (100.0%), and Management (89.7%), while the most female-oriented occupations are Computers & Mathematics (100.0%), Architecture & Engineering (100.0%), and Health Diagnosing & Treating (100.0%).
| Occupation | Male | Female |
| Management | 140 (89.7%) | 16 (10.3%) |
| Business & Financial | 6 (60.0%) | 4 (40.0%) |
| Computers, Engineering & Science | 6 (31.6%) | 13 (68.4%) |
| Computers & Mathematics | 0 (0.0%) | 12 (100.0%) |
| Architecture & Engineering | 0 (0.0%) | 1 (100.0%) |
| Life, Physical & Social Science | 6 (100.0%) | 0 (0.0%) |
| Community & Social Service | 3 (8.8%) | 31 (91.2%) |
| Education, Arts & Media | 0 (0.0%) | 0 (0.0%) |
| Legal Services & Support | 0 (0.0%) | 0 (0.0%) |
| Education Instruction & Library | 2 (6.1%) | 31 (93.9%) |
| Arts, Media & Entertainment | 1 (100.0%) | 0 (0.0%) |
| Health Diagnosing & Treating | 0 (0.0%) | 28 (100.0%) |
| Health Technologists | 0 (0.0%) | 17 (100.0%) |
| Total (Category) | 155 (62.7%) | 92 (37.2%) |
| Total (Overall) | 371 (59.0%) | 258 (41.0%) |
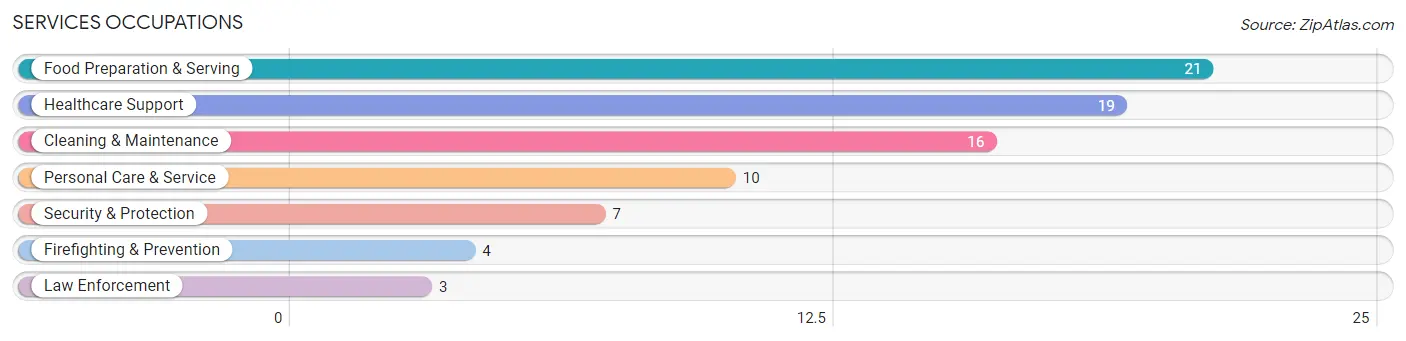
Services Occupations
The most common Services occupations in Sheridan County are Food Preparation & Serving (21 | 3.3%), Healthcare Support (19 | 3.0%), Cleaning & Maintenance (16 | 2.5%), Personal Care & Service (10 | 1.6%), and Security & Protection (7 | 1.1%).
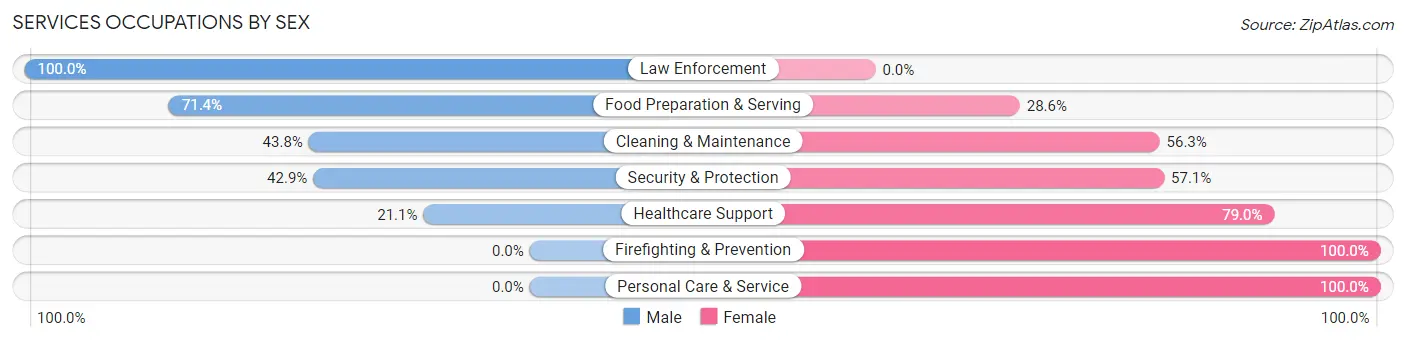
Services Occupations by Sex
Within the Services occupations in Sheridan County, the most male-oriented occupations are Law Enforcement (100.0%), Food Preparation & Serving (71.4%), and Cleaning & Maintenance (43.8%), while the most female-oriented occupations are Firefighting & Prevention (100.0%), Personal Care & Service (100.0%), and Healthcare Support (78.9%).
| Occupation | Male | Female |
| Healthcare Support | 4 (21.0%) | 15 (78.9%) |
| Security & Protection | 3 (42.9%) | 4 (57.1%) |
| Firefighting & Prevention | 0 (0.0%) | 4 (100.0%) |
| Law Enforcement | 3 (100.0%) | 0 (0.0%) |
| Food Preparation & Serving | 15 (71.4%) | 6 (28.6%) |
| Cleaning & Maintenance | 7 (43.8%) | 9 (56.2%) |
| Personal Care & Service | 0 (0.0%) | 10 (100.0%) |
| Total (Category) | 29 (39.7%) | 44 (60.3%) |
| Total (Overall) | 371 (59.0%) | 258 (41.0%) |
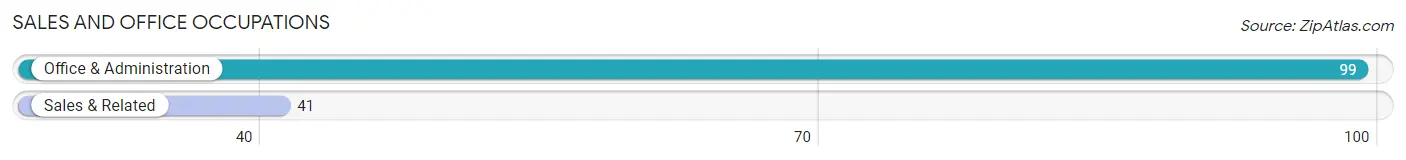
Sales and Office Occupations
The most common Sales and Office occupations in Sheridan County are Office & Administration (99 | 15.7%), and Sales & Related (41 | 6.5%).
Sales and Office Occupations by Sex

| Occupation | Male | Female |
| Sales & Related | 26 (63.4%) | 15 (36.6%) |
| Office & Administration | 13 (13.1%) | 86 (86.9%) |
| Total (Category) | 39 (27.9%) | 101 (72.1%) |
| Total (Overall) | 371 (59.0%) | 258 (41.0%) |
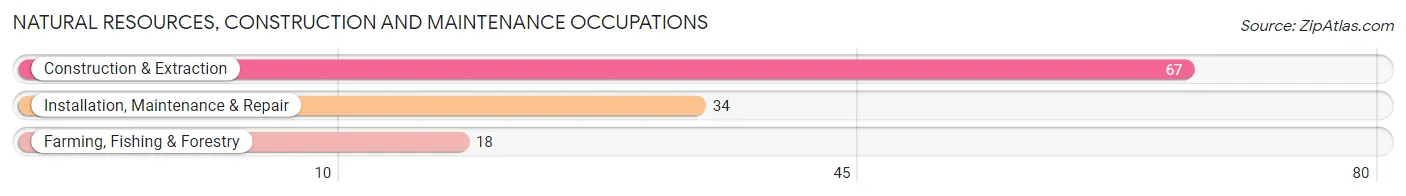
Natural Resources, Construction and Maintenance Occupations
The most common Natural Resources, Construction and Maintenance occupations in Sheridan County are Construction & Extraction (67 | 10.6%), Installation, Maintenance & Repair (34 | 5.4%), and Farming, Fishing & Forestry (18 | 2.9%).
Natural Resources, Construction and Maintenance Occupations by Sex
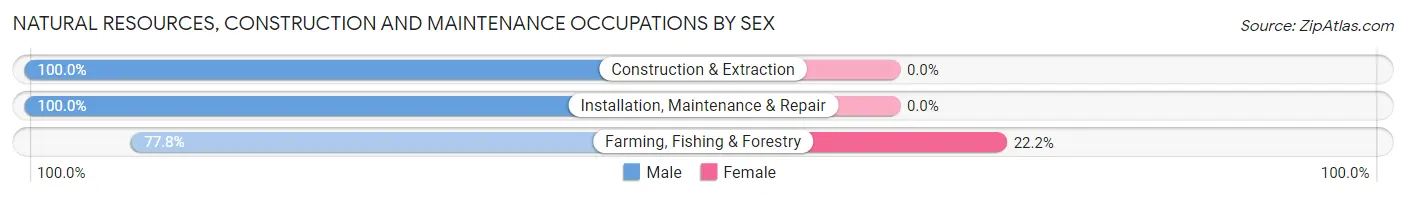
| Occupation | Male | Female |
| Farming, Fishing & Forestry | 14 (77.8%) | 4 (22.2%) |
| Construction & Extraction | 67 (100.0%) | 0 (0.0%) |
| Installation, Maintenance & Repair | 34 (100.0%) | 0 (0.0%) |
| Total (Category) | 115 (96.6%) | 4 (3.4%) |
| Total (Overall) | 371 (59.0%) | 258 (41.0%) |
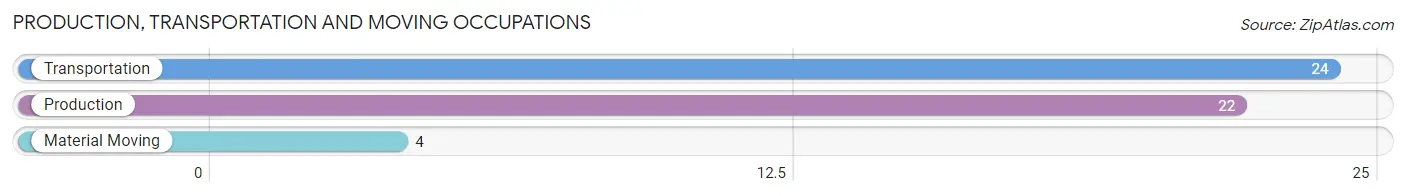
Production, Transportation and Moving Occupations
The most common Production, Transportation and Moving occupations in Sheridan County are Transportation (24 | 3.8%), Production (22 | 3.5%), and Material Moving (4 | 0.6%).
Production, Transportation and Moving Occupations by Sex
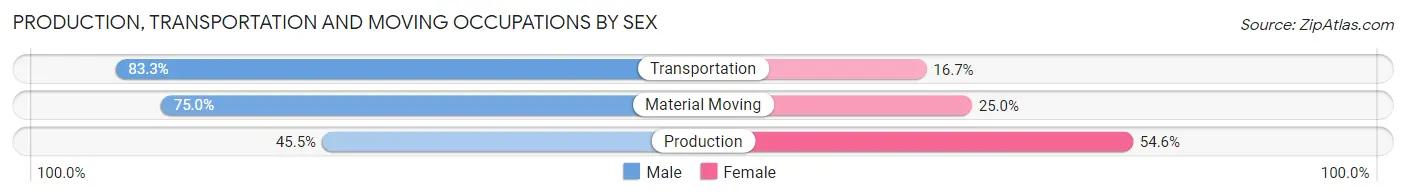
| Occupation | Male | Female |
| Production | 10 (45.5%) | 12 (54.5%) |
| Transportation | 20 (83.3%) | 4 (16.7%) |
| Material Moving | 3 (75.0%) | 1 (25.0%) |
| Total (Category) | 33 (66.0%) | 17 (34.0%) |
| Total (Overall) | 371 (59.0%) | 258 (41.0%) |
Employment Industries by Sex in Sheridan County
Employment Industries in Sheridan County
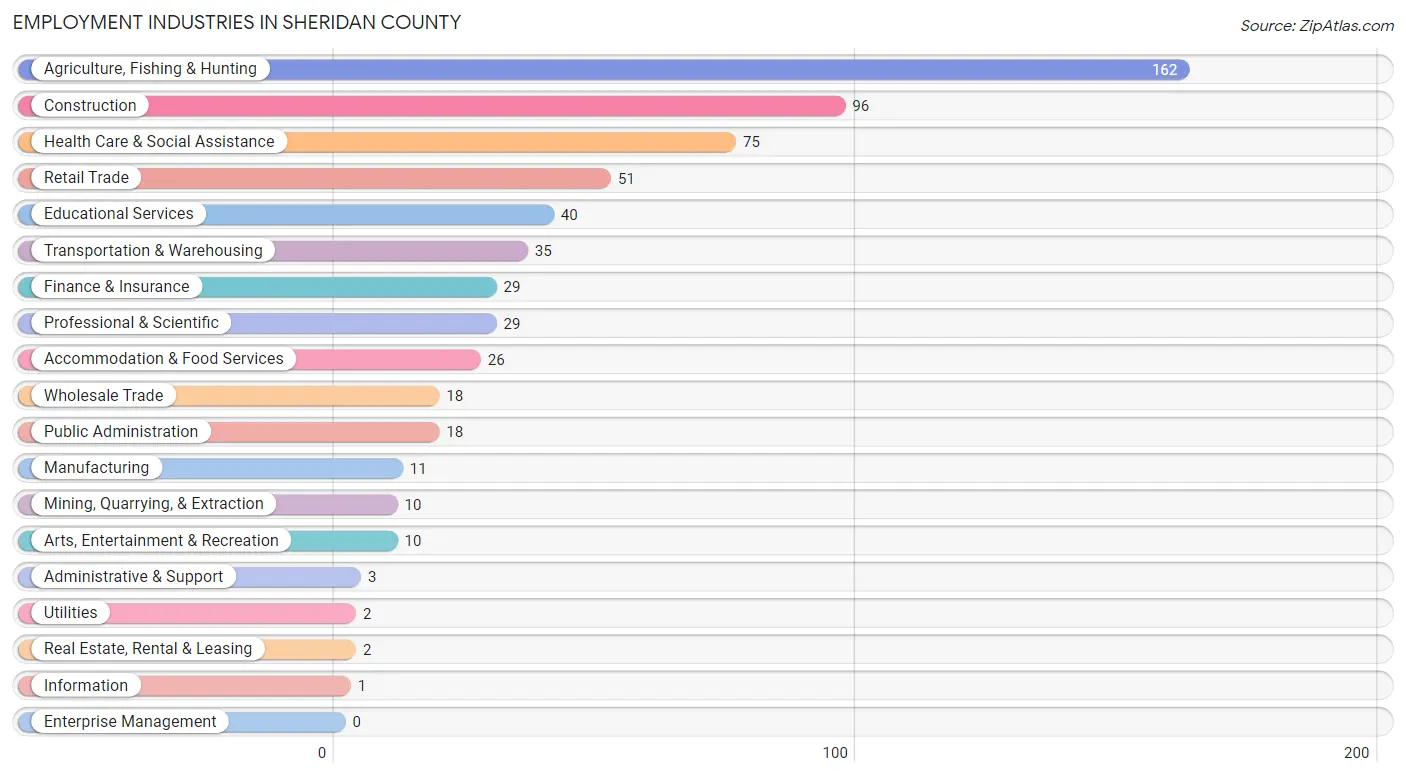
The major employment industries in Sheridan County include Agriculture, Fishing & Hunting (162 | 25.8%), Construction (96 | 15.3%), Health Care & Social Assistance (75 | 11.9%), Retail Trade (51 | 8.1%), and Educational Services (40 | 6.4%).
Employment Industries by Sex in Sheridan County
The Sheridan County industries that see more men than women are Mining, Quarrying, & Extraction (100.0%), Utilities (100.0%), and Administrative & Support (100.0%), whereas the industries that tend to have a higher number of women are Information (100.0%), Health Care & Social Assistance (94.7%), and Educational Services (90.0%).
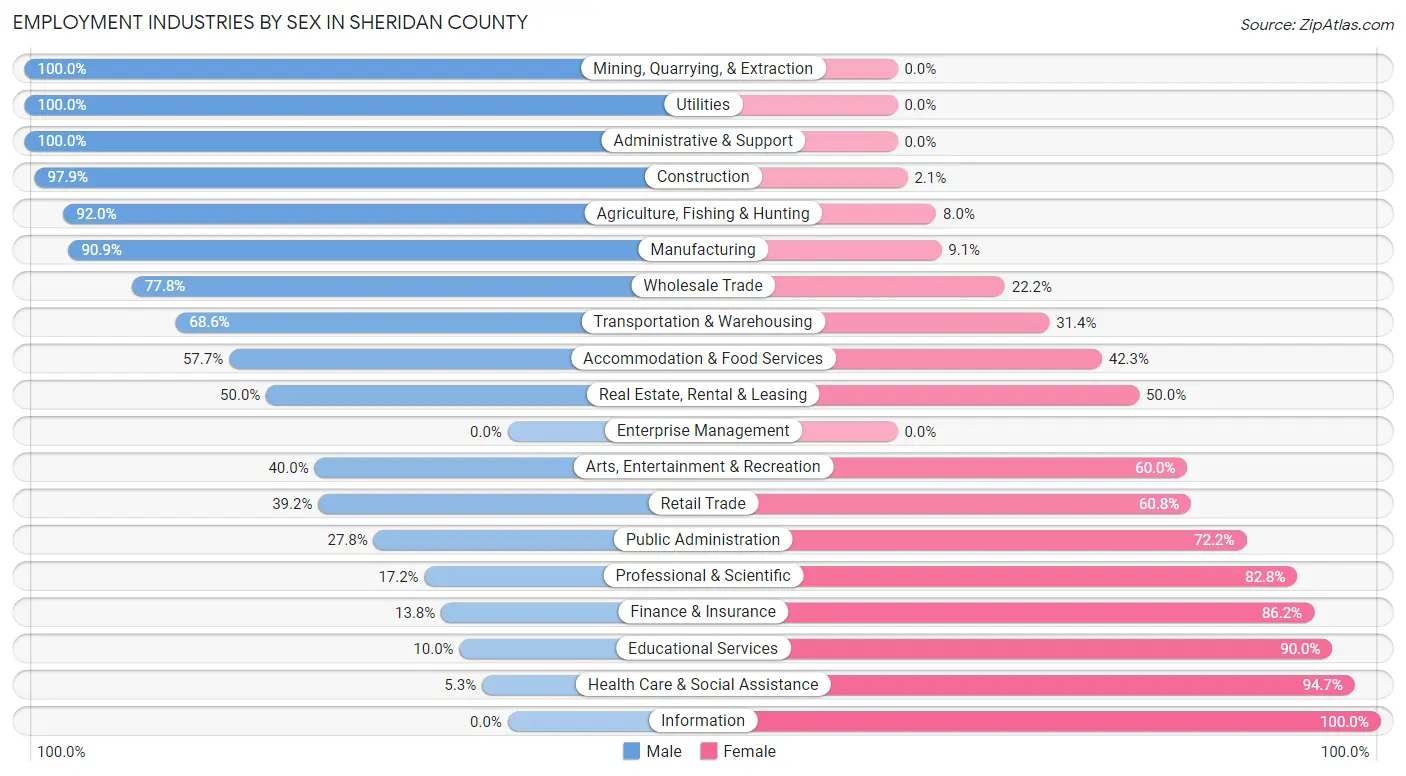
| Industry | Male | Female |
| Agriculture, Fishing & Hunting | 149 (92.0%) | 13 (8.0%) |
| Mining, Quarrying, & Extraction | 10 (100.0%) | 0 (0.0%) |
| Construction | 94 (97.9%) | 2 (2.1%) |
| Manufacturing | 10 (90.9%) | 1 (9.1%) |
| Wholesale Trade | 14 (77.8%) | 4 (22.2%) |
| Retail Trade | 20 (39.2%) | 31 (60.8%) |
| Transportation & Warehousing | 24 (68.6%) | 11 (31.4%) |
| Utilities | 2 (100.0%) | 0 (0.0%) |
| Information | 0 (0.0%) | 1 (100.0%) |
| Finance & Insurance | 4 (13.8%) | 25 (86.2%) |
| Real Estate, Rental & Leasing | 1 (50.0%) | 1 (50.0%) |
| Professional & Scientific | 5 (17.2%) | 24 (82.8%) |
| Enterprise Management | 0 (0.0%) | 0 (0.0%) |
| Administrative & Support | 3 (100.0%) | 0 (0.0%) |
| Educational Services | 4 (10.0%) | 36 (90.0%) |
| Health Care & Social Assistance | 4 (5.3%) | 71 (94.7%) |
| Arts, Entertainment & Recreation | 4 (40.0%) | 6 (60.0%) |
| Accommodation & Food Services | 15 (57.7%) | 11 (42.3%) |
| Public Administration | 5 (27.8%) | 13 (72.2%) |
| Total | 371 (59.0%) | 258 (41.0%) |
Education in Sheridan County
School Enrollment in Sheridan County
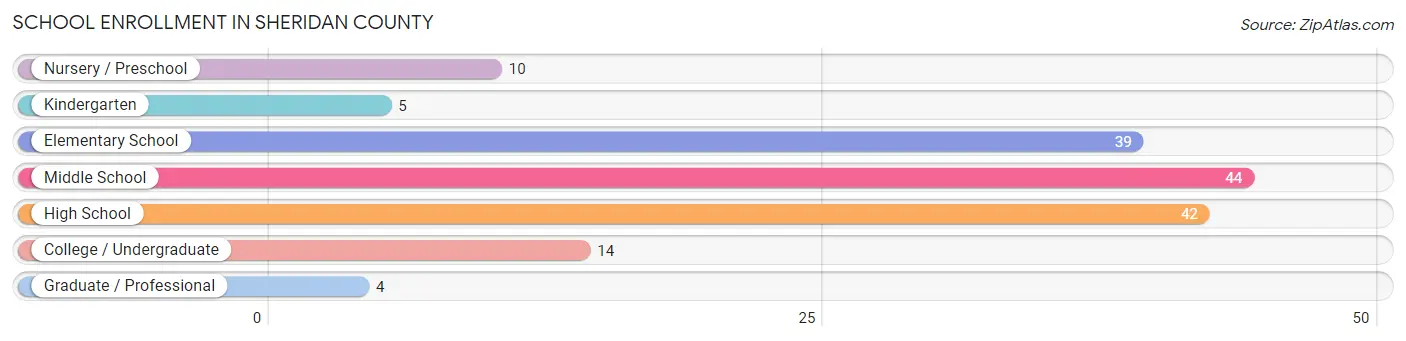
The most common levels of schooling among the 158 students in Sheridan County are middle school (44 | 27.9%), high school (42 | 26.6%), and elementary school (39 | 24.7%).
| School Level | # Students | % Students |
| Nursery / Preschool | 10 | 6.3% |
| Kindergarten | 5 | 3.2% |
| Elementary School | 39 | 24.7% |
| Middle School | 44 | 27.9% |
| High School | 42 | 26.6% |
| College / Undergraduate | 14 | 8.9% |
| Graduate / Professional | 4 | 2.5% |
| Total | 158 | 100.0% |
School Enrollment by Age by Funding Source in Sheridan County
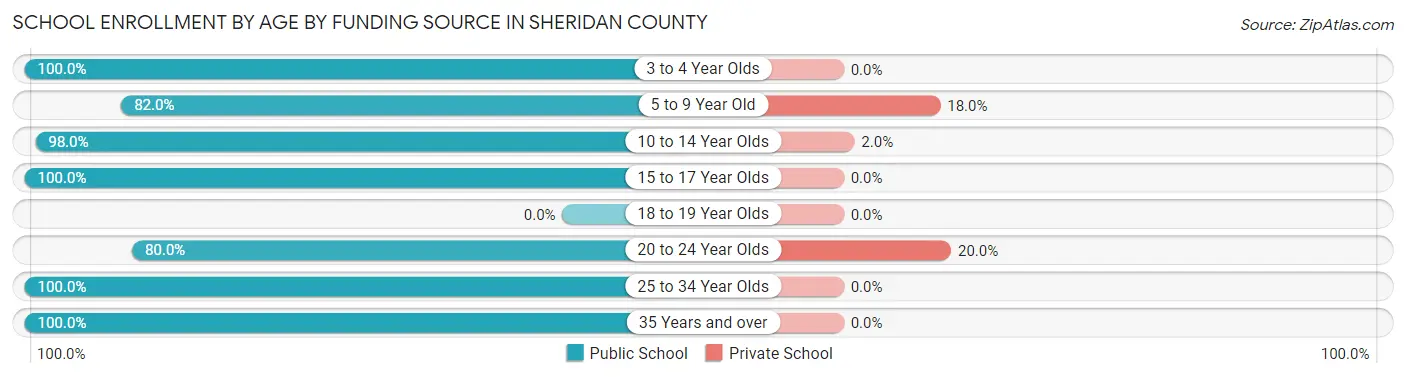
Out of a total of 158 students who are enrolled in schools in Sheridan County, 13 (8.2%) attend a private institution, while the remaining 145 (91.8%) are enrolled in public schools. The age group of 20 to 24 year olds has the highest likelihood of being enrolled in private schools, with 3 (20.0% in the age bracket) enrolled. Conversely, the age group of 3 to 4 year olds has the lowest likelihood of being enrolled in a private school, with 2 (100.0% in the age bracket) attending a public institution.
| Age Bracket | Public School | Private School |
| 3 to 4 Year Olds | 2 (100.0%) | 0 (0.0%) |
| 5 to 9 Year Old | 41 (82.0%) | 9 (18.0%) |
| 10 to 14 Year Olds | 49 (98.0%) | 1 (2.0%) |
| 15 to 17 Year Olds | 37 (100.0%) | 0 (0.0%) |
| 18 to 19 Year Olds | 0 (0.0%) | 0 (0.0%) |
| 20 to 24 Year Olds | 12 (80.0%) | 3 (20.0%) |
| 25 to 34 Year Olds | 1 (100.0%) | 0 (0.0%) |
| 35 Years and over | 3 (100.0%) | 0 (0.0%) |
| Total | 145 (91.8%) | 13 (8.2%) |
Educational Attainment by Field of Study in Sheridan County
Education (36 | 22.6%), bio, nature & agricultural (31 | 19.5%), liberal arts & history (25 | 15.7%), science & technology (20 | 12.6%), and psychology (13 | 8.2%) are the most common fields of study among 159 individuals in Sheridan County who have obtained a bachelor's degree or higher.
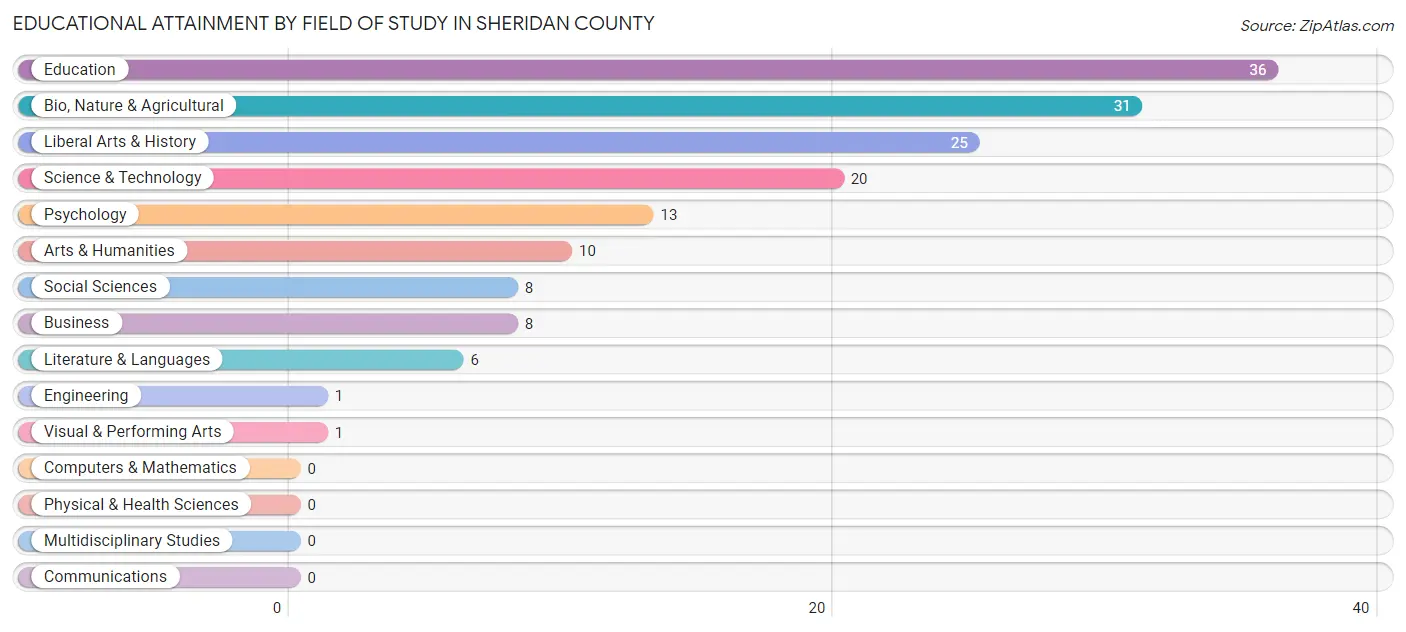
| Field of Study | # Graduates | % Graduates |
| Computers & Mathematics | 0 | 0.0% |
| Bio, Nature & Agricultural | 31 | 19.5% |
| Physical & Health Sciences | 0 | 0.0% |
| Psychology | 13 | 8.2% |
| Social Sciences | 8 | 5.0% |
| Engineering | 1 | 0.6% |
| Multidisciplinary Studies | 0 | 0.0% |
| Science & Technology | 20 | 12.6% |
| Business | 8 | 5.0% |
| Education | 36 | 22.6% |
| Literature & Languages | 6 | 3.8% |
| Liberal Arts & History | 25 | 15.7% |
| Visual & Performing Arts | 1 | 0.6% |
| Communications | 0 | 0.0% |
| Arts & Humanities | 10 | 6.3% |
| Total | 159 | 100.0% |
Transportation & Commute in Sheridan County
Vehicle Availability by Sex in Sheridan County
The most prevalent vehicle ownership categories in Sheridan County are males with 3 vehicles (100, accounting for 27.0%) and females with 3 vehicles (91, making up 39.4%).
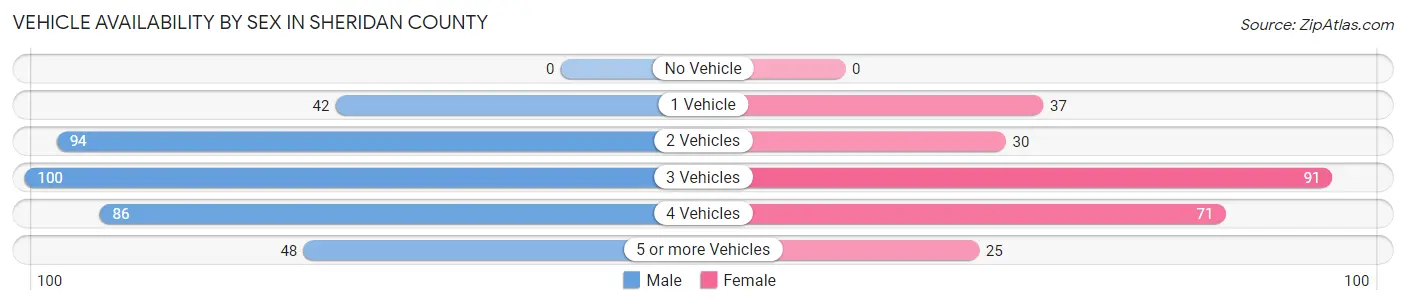
| Vehicles Available | Male | Female |
| No Vehicle | 0 (0.0%) | 0 (0.0%) |
| 1 Vehicle | 42 (11.4%) | 37 (14.6%) |
| 2 Vehicles | 94 (25.4%) | 30 (11.8%) |
| 3 Vehicles | 100 (27.0%) | 91 (35.8%) |
| 4 Vehicles | 86 (23.2%) | 71 (28.0%) |
| 5 or more Vehicles | 48 (13.0%) | 25 (9.8%) |
| Total | 370 (100.0%) | 254 (100.0%) |
Commute Time in Sheridan County
The most frequently occuring commute durations in Sheridan County are 15 to 19 minutes (132 commuters, 22.8%), less than 5 minutes (118 commuters, 20.4%), and 5 to 9 minutes (59 commuters, 10.2%).
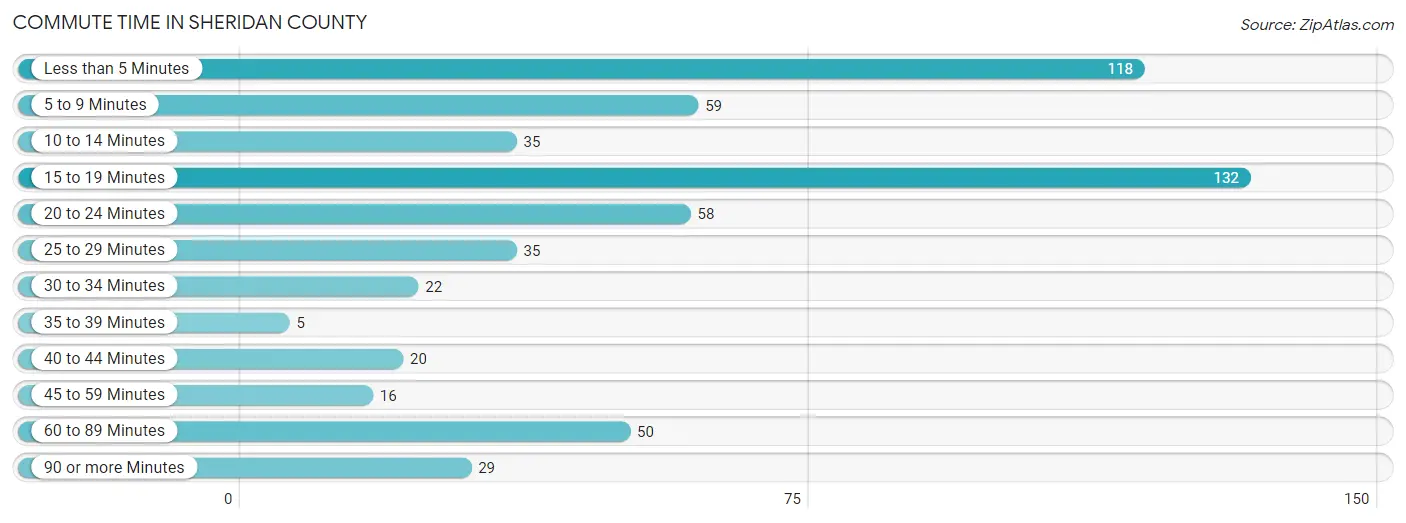
| Commute Time | # Commuters | % Commuters |
| Less than 5 Minutes | 118 | 20.4% |
| 5 to 9 Minutes | 59 | 10.2% |
| 10 to 14 Minutes | 35 | 6.0% |
| 15 to 19 Minutes | 132 | 22.8% |
| 20 to 24 Minutes | 58 | 10.0% |
| 25 to 29 Minutes | 35 | 6.0% |
| 30 to 34 Minutes | 22 | 3.8% |
| 35 to 39 Minutes | 5 | 0.9% |
| 40 to 44 Minutes | 20 | 3.5% |
| 45 to 59 Minutes | 16 | 2.8% |
| 60 to 89 Minutes | 50 | 8.6% |
| 90 or more Minutes | 29 | 5.0% |
Commute Time by Sex in Sheridan County
The most common commute times in Sheridan County are 15 to 19 minutes (71 commuters, 20.9%) for males and 15 to 19 minutes (61 commuters, 25.4%) for females.
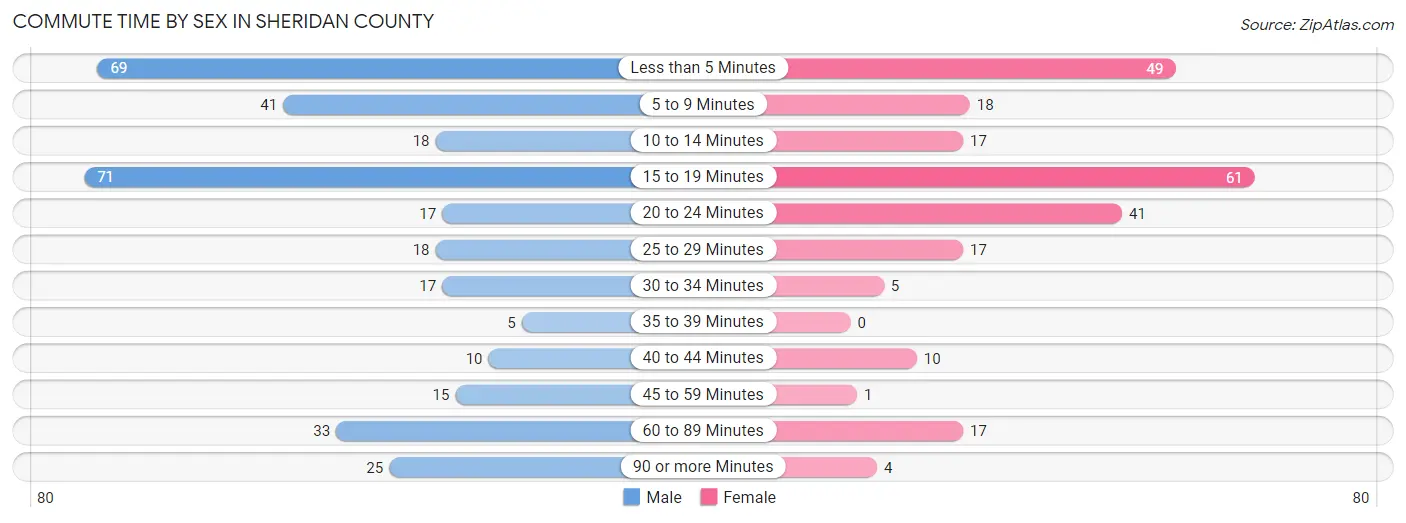
| Commute Time | Male | Female |
| Less than 5 Minutes | 69 (20.3%) | 49 (20.4%) |
| 5 to 9 Minutes | 41 (12.1%) | 18 (7.5%) |
| 10 to 14 Minutes | 18 (5.3%) | 17 (7.1%) |
| 15 to 19 Minutes | 71 (20.9%) | 61 (25.4%) |
| 20 to 24 Minutes | 17 (5.0%) | 41 (17.1%) |
| 25 to 29 Minutes | 18 (5.3%) | 17 (7.1%) |
| 30 to 34 Minutes | 17 (5.0%) | 5 (2.1%) |
| 35 to 39 Minutes | 5 (1.5%) | 0 (0.0%) |
| 40 to 44 Minutes | 10 (2.9%) | 10 (4.2%) |
| 45 to 59 Minutes | 15 (4.4%) | 1 (0.4%) |
| 60 to 89 Minutes | 33 (9.7%) | 17 (7.1%) |
| 90 or more Minutes | 25 (7.4%) | 4 (1.7%) |
Time of Departure to Work by Sex in Sheridan County
The most frequent times of departure to work in Sheridan County are 8:00 AM to 8:29 AM (66, 19.5%) for males and 7:00 AM to 7:29 AM (60, 25.0%) for females.
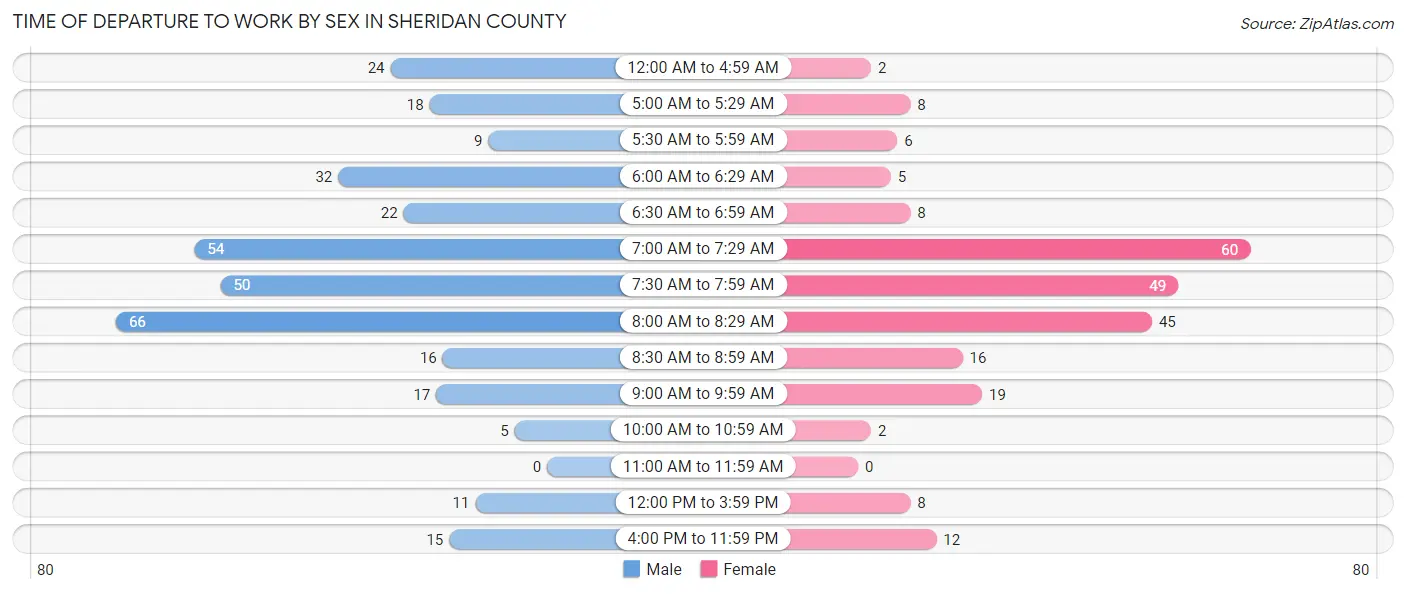
| Time of Departure | Male | Female |
| 12:00 AM to 4:59 AM | 24 (7.1%) | 2 (0.8%) |
| 5:00 AM to 5:29 AM | 18 (5.3%) | 8 (3.3%) |
| 5:30 AM to 5:59 AM | 9 (2.6%) | 6 (2.5%) |
| 6:00 AM to 6:29 AM | 32 (9.4%) | 5 (2.1%) |
| 6:30 AM to 6:59 AM | 22 (6.5%) | 8 (3.3%) |
| 7:00 AM to 7:29 AM | 54 (15.9%) | 60 (25.0%) |
| 7:30 AM to 7:59 AM | 50 (14.7%) | 49 (20.4%) |
| 8:00 AM to 8:29 AM | 66 (19.5%) | 45 (18.8%) |
| 8:30 AM to 8:59 AM | 16 (4.7%) | 16 (6.7%) |
| 9:00 AM to 9:59 AM | 17 (5.0%) | 19 (7.9%) |
| 10:00 AM to 10:59 AM | 5 (1.5%) | 2 (0.8%) |
| 11:00 AM to 11:59 AM | 0 (0.0%) | 0 (0.0%) |
| 12:00 PM to 3:59 PM | 11 (3.2%) | 8 (3.3%) |
| 4:00 PM to 11:59 PM | 15 (4.4%) | 12 (5.0%) |
| Total | 339 (100.0%) | 240 (100.0%) |
Housing Occupancy in Sheridan County
Occupancy by Ownership in Sheridan County
Of the total 644 dwellings in Sheridan County, owner-occupied units account for 534 (82.9%), while renter-occupied units make up 110 (17.1%).
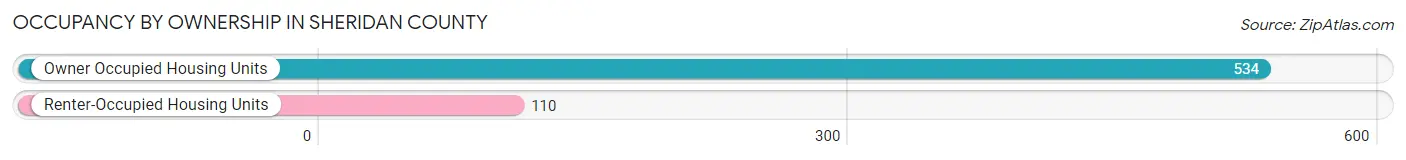
| Occupancy | # Housing Units | % Housing Units |
| Owner Occupied Housing Units | 534 | 82.9% |
| Renter-Occupied Housing Units | 110 | 17.1% |
| Total Occupied Housing Units | 644 | 100.0% |
Occupancy by Household Size in Sheridan County
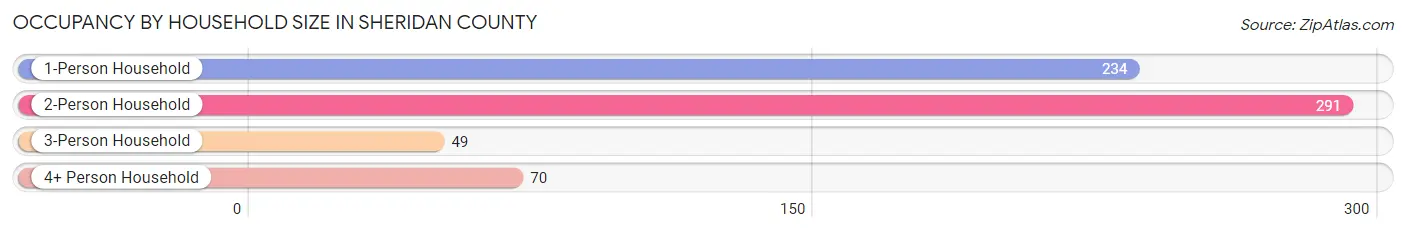
| Household Size | # Housing Units | % Housing Units |
| 1-Person Household | 234 | 36.3% |
| 2-Person Household | 291 | 45.2% |
| 3-Person Household | 49 | 7.6% |
| 4+ Person Household | 70 | 10.9% |
| Total Housing Units | 644 | 100.0% |
Occupancy by Ownership by Household Size in Sheridan County
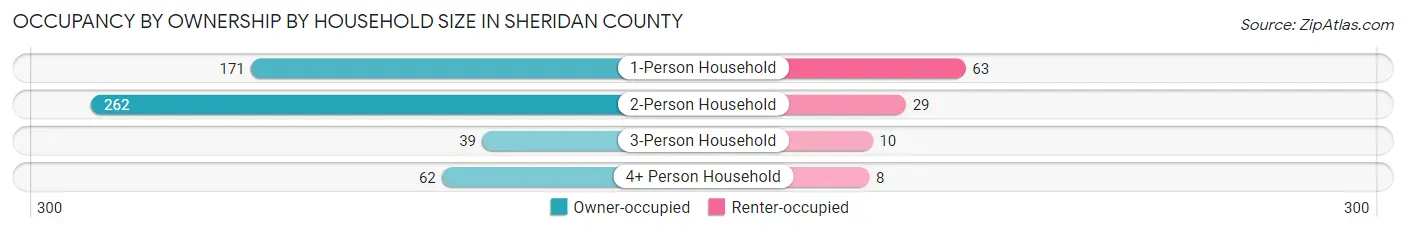
| Household Size | Owner-occupied | Renter-occupied |
| 1-Person Household | 171 (73.1%) | 63 (26.9%) |
| 2-Person Household | 262 (90.0%) | 29 (10.0%) |
| 3-Person Household | 39 (79.6%) | 10 (20.4%) |
| 4+ Person Household | 62 (88.6%) | 8 (11.4%) |
| Total Housing Units | 534 (82.9%) | 110 (17.1%) |
Occupancy by Educational Attainment in Sheridan County
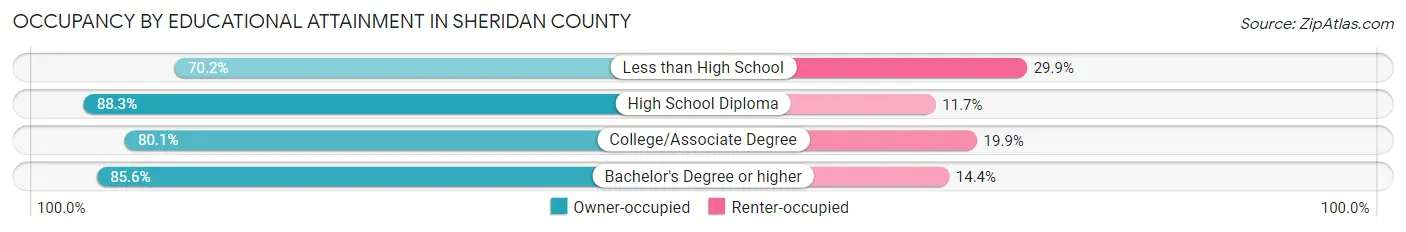
| Household Size | Owner-occupied | Renter-occupied |
| Less than High School | 47 (70.2%) | 20 (29.8%) |
| High School Diploma | 203 (88.3%) | 27 (11.7%) |
| College/Associate Degree | 189 (80.1%) | 47 (19.9%) |
| Bachelor's Degree or higher | 95 (85.6%) | 16 (14.4%) |
Occupancy by Age of Householder in Sheridan County
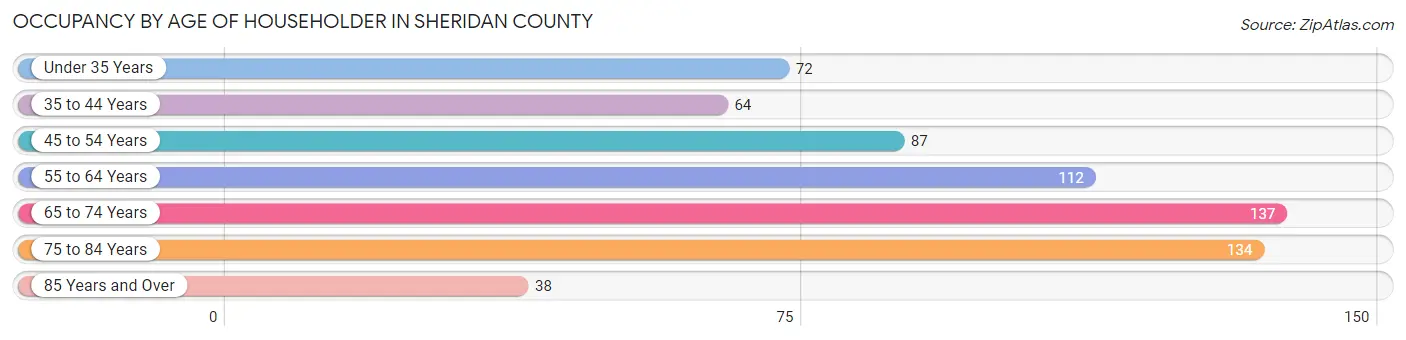
| Age Bracket | # Households | % Households |
| Under 35 Years | 72 | 11.2% |
| 35 to 44 Years | 64 | 9.9% |
| 45 to 54 Years | 87 | 13.5% |
| 55 to 64 Years | 112 | 17.4% |
| 65 to 74 Years | 137 | 21.3% |
| 75 to 84 Years | 134 | 20.8% |
| 85 Years and Over | 38 | 5.9% |
| Total | 644 | 100.0% |
Housing Finances in Sheridan County
Median Income by Occupancy in Sheridan County
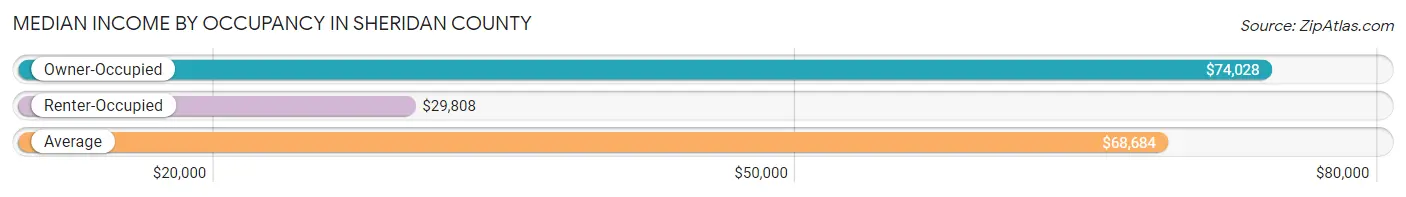
| Occupancy Type | # Households | Median Income |
| Owner-Occupied | 534 (82.9%) | $74,028 |
| Renter-Occupied | 110 (17.1%) | $29,808 |
| Average | 644 (100.0%) | $68,684 |
Occupancy by Householder Income Bracket in Sheridan County
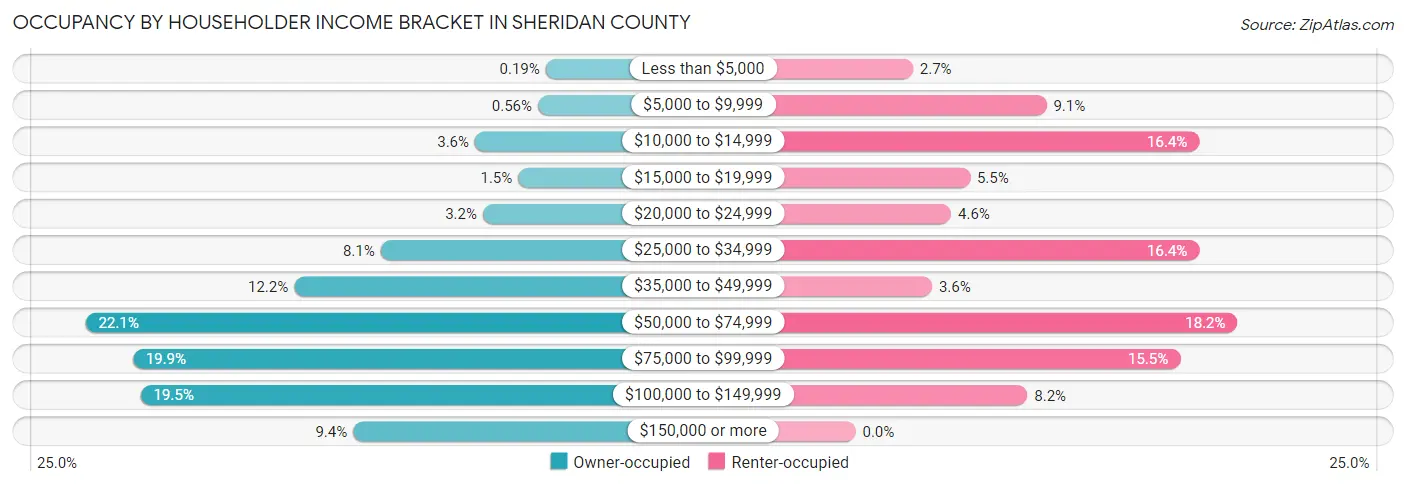
| Income Bracket | Owner-occupied | Renter-occupied |
| Less than $5,000 | 1 (0.2%) | 3 (2.7%) |
| $5,000 to $9,999 | 3 (0.6%) | 10 (9.1%) |
| $10,000 to $14,999 | 19 (3.6%) | 18 (16.4%) |
| $15,000 to $19,999 | 8 (1.5%) | 6 (5.4%) |
| $20,000 to $24,999 | 17 (3.2%) | 5 (4.5%) |
| $25,000 to $34,999 | 43 (8.1%) | 18 (16.4%) |
| $35,000 to $49,999 | 65 (12.2%) | 4 (3.6%) |
| $50,000 to $74,999 | 118 (22.1%) | 20 (18.2%) |
| $75,000 to $99,999 | 106 (19.9%) | 17 (15.4%) |
| $100,000 to $149,999 | 104 (19.5%) | 9 (8.2%) |
| $150,000 or more | 50 (9.4%) | 0 (0.0%) |
| Total | 534 (100.0%) | 110 (100.0%) |
Monthly Housing Cost Tiers in Sheridan County
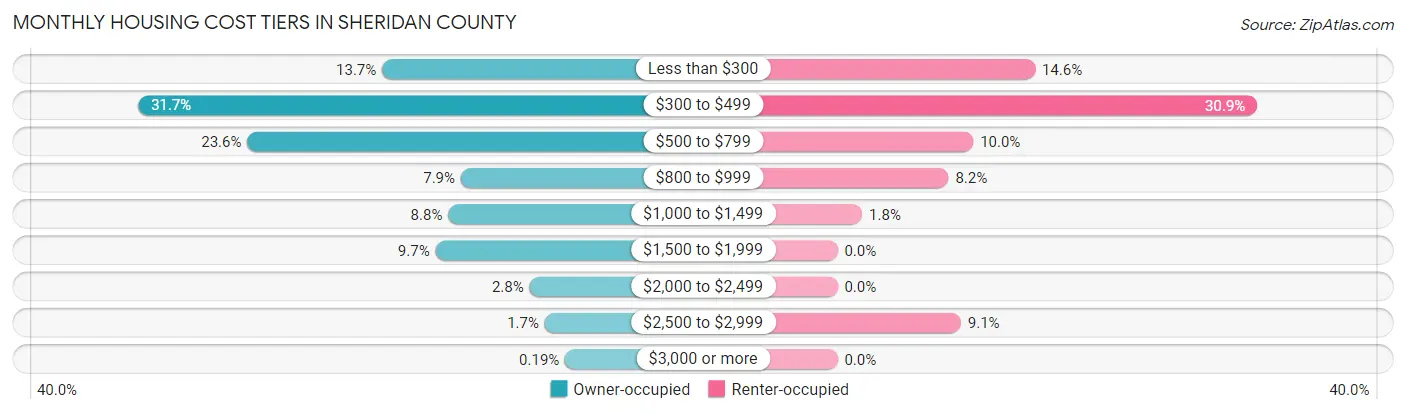
| Monthly Cost | Owner-occupied | Renter-occupied |
| Less than $300 | 73 (13.7%) | 16 (14.5%) |
| $300 to $499 | 169 (31.7%) | 34 (30.9%) |
| $500 to $799 | 126 (23.6%) | 11 (10.0%) |
| $800 to $999 | 42 (7.9%) | 9 (8.2%) |
| $1,000 to $1,499 | 47 (8.8%) | 2 (1.8%) |
| $1,500 to $1,999 | 52 (9.7%) | 0 (0.0%) |
| $2,000 to $2,499 | 15 (2.8%) | 0 (0.0%) |
| $2,500 to $2,999 | 9 (1.7%) | 10 (9.1%) |
| $3,000 or more | 1 (0.2%) | 0 (0.0%) |
| Total | 534 (100.0%) | 110 (100.0%) |
Physical Housing Characteristics in Sheridan County
Housing Structures in Sheridan County
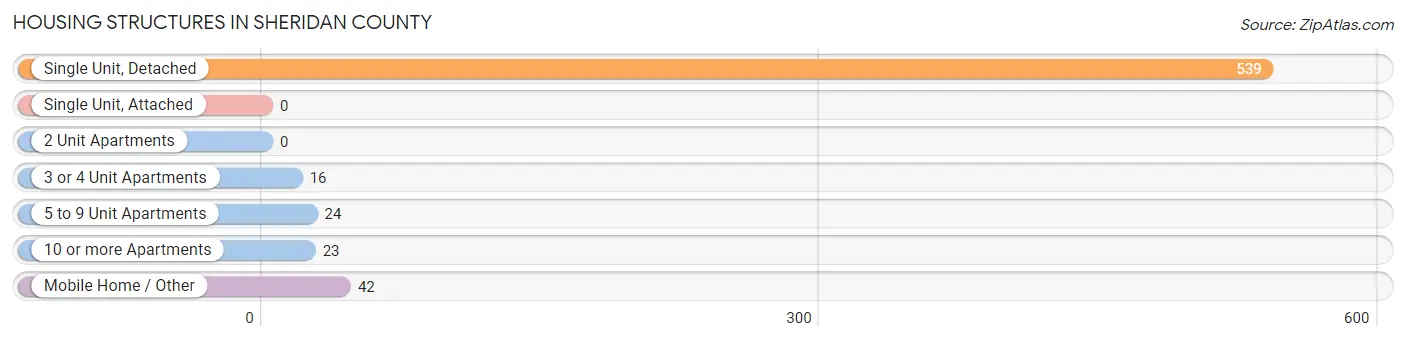
| Structure Type | # Housing Units | % Housing Units |
| Single Unit, Detached | 539 | 83.7% |
| Single Unit, Attached | 0 | 0.0% |
| 2 Unit Apartments | 0 | 0.0% |
| 3 or 4 Unit Apartments | 16 | 2.5% |
| 5 to 9 Unit Apartments | 24 | 3.7% |
| 10 or more Apartments | 23 | 3.6% |
| Mobile Home / Other | 42 | 6.5% |
| Total | 644 | 100.0% |
Housing Structures by Occupancy in Sheridan County
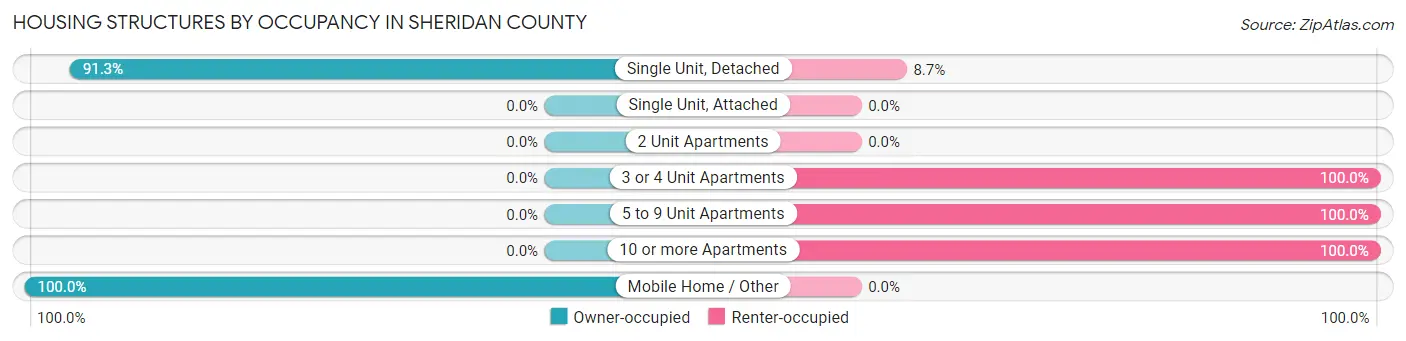
| Structure Type | Owner-occupied | Renter-occupied |
| Single Unit, Detached | 492 (91.3%) | 47 (8.7%) |
| Single Unit, Attached | 0 (0.0%) | 0 (0.0%) |
| 2 Unit Apartments | 0 (0.0%) | 0 (0.0%) |
| 3 or 4 Unit Apartments | 0 (0.0%) | 16 (100.0%) |
| 5 to 9 Unit Apartments | 0 (0.0%) | 24 (100.0%) |
| 10 or more Apartments | 0 (0.0%) | 23 (100.0%) |
| Mobile Home / Other | 42 (100.0%) | 0 (0.0%) |
| Total | 534 (82.9%) | 110 (17.1%) |
Housing Structures by Number of Rooms in Sheridan County
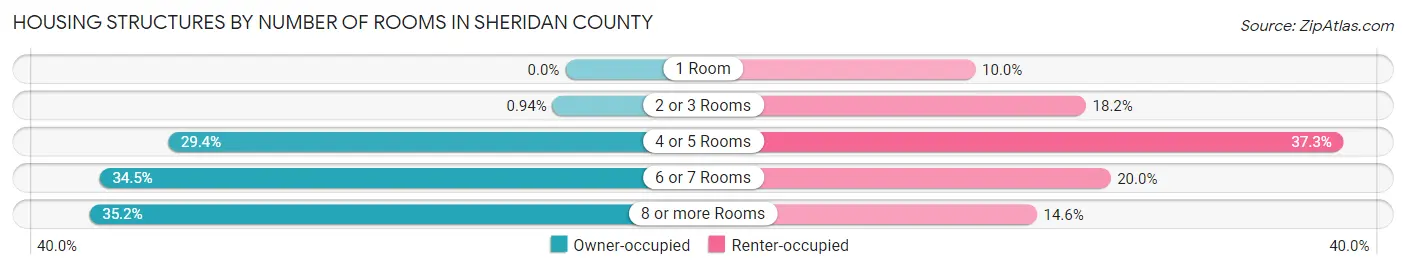
| Number of Rooms | Owner-occupied | Renter-occupied |
| 1 Room | 0 (0.0%) | 11 (10.0%) |
| 2 or 3 Rooms | 5 (0.9%) | 20 (18.2%) |
| 4 or 5 Rooms | 157 (29.4%) | 41 (37.3%) |
| 6 or 7 Rooms | 184 (34.5%) | 22 (20.0%) |
| 8 or more Rooms | 188 (35.2%) | 16 (14.5%) |
| Total | 534 (100.0%) | 110 (100.0%) |
Housing Structure by Heating Type in Sheridan County
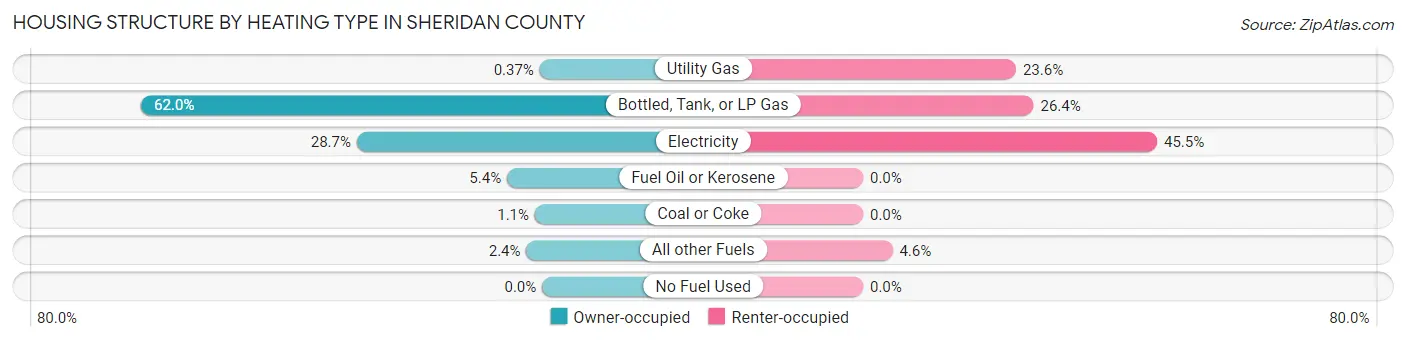
| Heating Type | Owner-occupied | Renter-occupied |
| Utility Gas | 2 (0.4%) | 26 (23.6%) |
| Bottled, Tank, or LP Gas | 331 (62.0%) | 29 (26.4%) |
| Electricity | 153 (28.6%) | 50 (45.5%) |
| Fuel Oil or Kerosene | 29 (5.4%) | 0 (0.0%) |
| Coal or Coke | 6 (1.1%) | 0 (0.0%) |
| All other Fuels | 13 (2.4%) | 5 (4.5%) |
| No Fuel Used | 0 (0.0%) | 0 (0.0%) |
| Total | 534 (100.0%) | 110 (100.0%) |
Household Vehicle Usage in Sheridan County
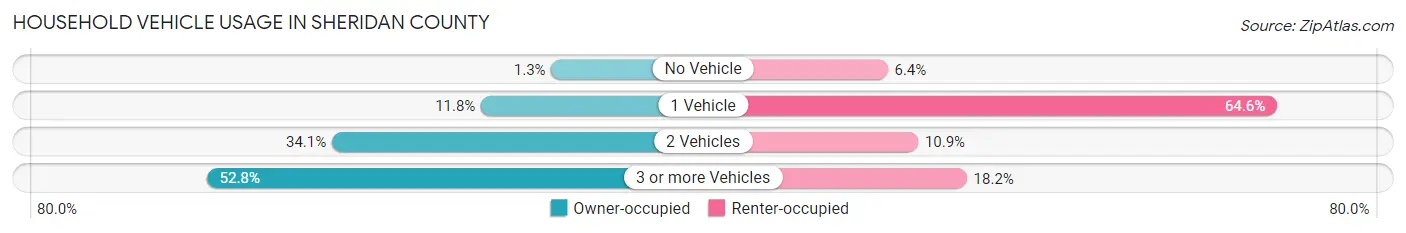
| Vehicles per Household | Owner-occupied | Renter-occupied |
| No Vehicle | 7 (1.3%) | 7 (6.4%) |
| 1 Vehicle | 63 (11.8%) | 71 (64.5%) |
| 2 Vehicles | 182 (34.1%) | 12 (10.9%) |
| 3 or more Vehicles | 282 (52.8%) | 20 (18.2%) |
| Total | 534 (100.0%) | 110 (100.0%) |
Real Estate & Mortgages in Sheridan County
Real Estate and Mortgage Overview in Sheridan County
| Characteristic | Without Mortgage | With Mortgage |
| Housing Units | 396 | 138 |
| Median Property Value | $89,500 | $153,800 |
| Median Household Income | $67,708 | $23 |
| Monthly Housing Costs | $455 | $1 |
| Real Estate Taxes | $839 | $15 |
Property Value by Mortgage Status in Sheridan County
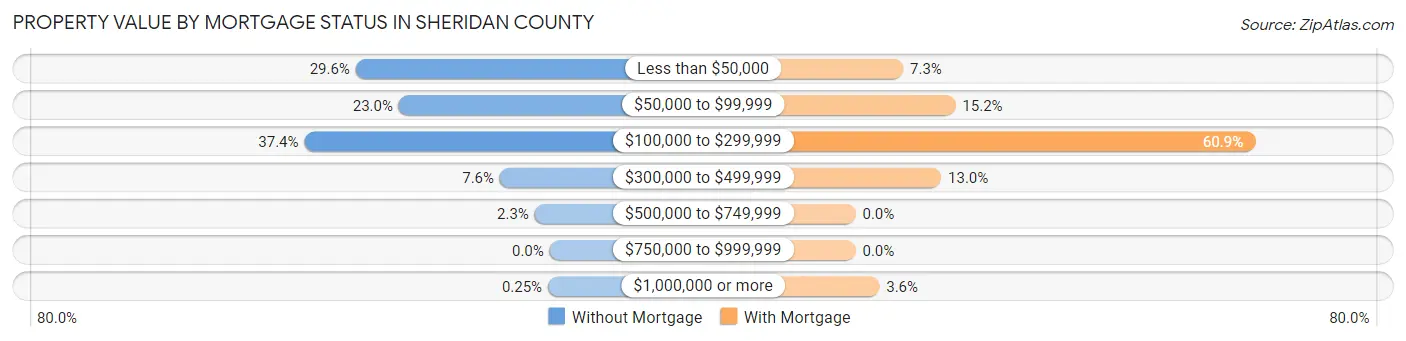
| Property Value | Without Mortgage | With Mortgage |
| Less than $50,000 | 117 (29.5%) | 10 (7.2%) |
| $50,000 to $99,999 | 91 (23.0%) | 21 (15.2%) |
| $100,000 to $299,999 | 148 (37.4%) | 84 (60.9%) |
| $300,000 to $499,999 | 30 (7.6%) | 18 (13.0%) |
| $500,000 to $749,999 | 9 (2.3%) | 0 (0.0%) |
| $750,000 to $999,999 | 0 (0.0%) | 0 (0.0%) |
| $1,000,000 or more | 1 (0.3%) | 5 (3.6%) |
| Total | 396 (100.0%) | 138 (100.0%) |
Household Income by Mortgage Status in Sheridan County
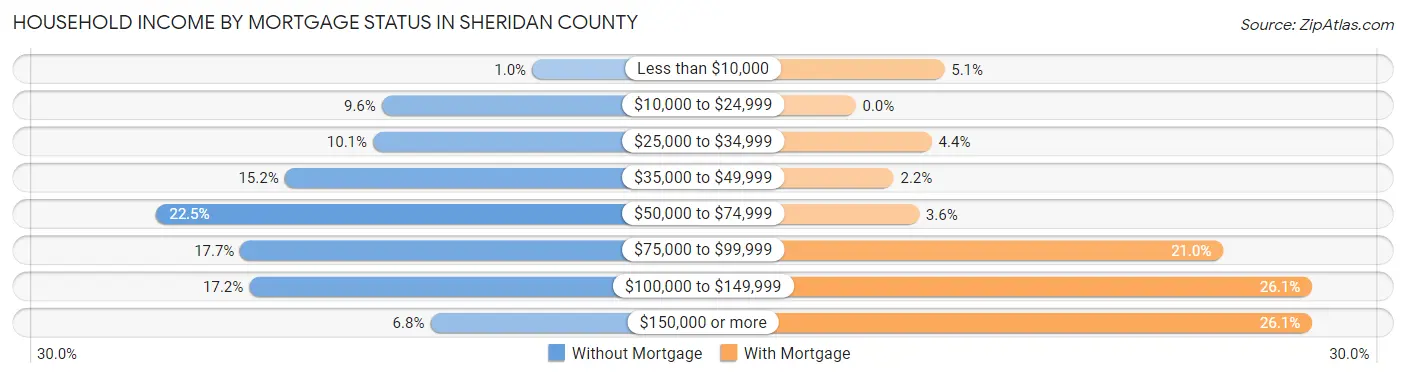
| Household Income | Without Mortgage | With Mortgage |
| Less than $10,000 | 4 (1.0%) | 7 (5.1%) |
| $10,000 to $24,999 | 38 (9.6%) | 0 (0.0%) |
| $25,000 to $34,999 | 40 (10.1%) | 6 (4.3%) |
| $35,000 to $49,999 | 60 (15.1%) | 3 (2.2%) |
| $50,000 to $74,999 | 89 (22.5%) | 5 (3.6%) |
| $75,000 to $99,999 | 70 (17.7%) | 29 (21.0%) |
| $100,000 to $149,999 | 68 (17.2%) | 36 (26.1%) |
| $150,000 or more | 27 (6.8%) | 36 (26.1%) |
| Total | 396 (100.0%) | 138 (100.0%) |
Property Value to Household Income Ratio in Sheridan County
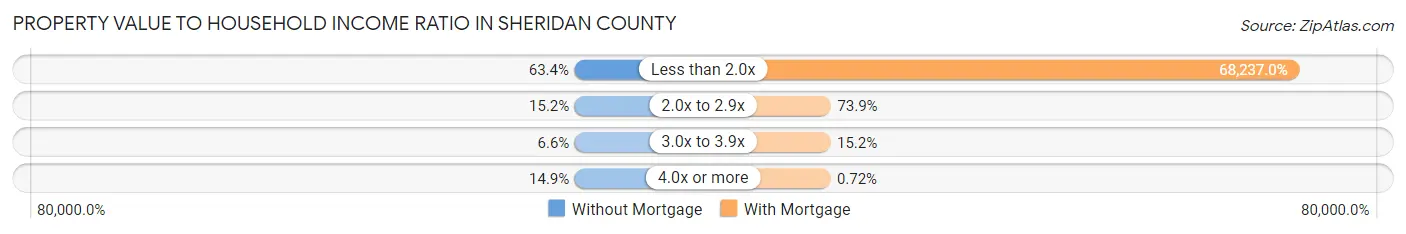
| Value-to-Income Ratio | Without Mortgage | With Mortgage |
| Less than 2.0x | 251 (63.4%) | 94,167 (68,237.0%) |
| 2.0x to 2.9x | 60 (15.1%) | 102 (73.9%) |
| 3.0x to 3.9x | 26 (6.6%) | 21 (15.2%) |
| 4.0x or more | 59 (14.9%) | 1 (0.7%) |
| Total | 396 (100.0%) | 138 (100.0%) |
Real Estate Taxes by Mortgage Status in Sheridan County
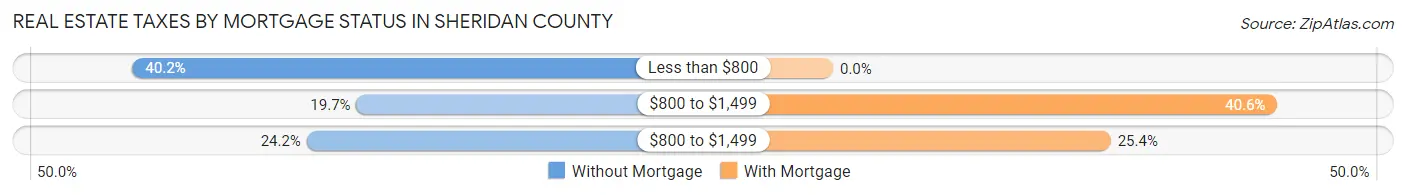
| Property Taxes | Without Mortgage | With Mortgage |
| Less than $800 | 159 (40.2%) | 0 (0.0%) |
| $800 to $1,499 | 78 (19.7%) | 56 (40.6%) |
| $800 to $1,499 | 96 (24.2%) | 35 (25.4%) |
| Total | 396 (100.0%) | 138 (100.0%) |
Health & Disability in Sheridan County
Health Insurance Coverage by Age in Sheridan County
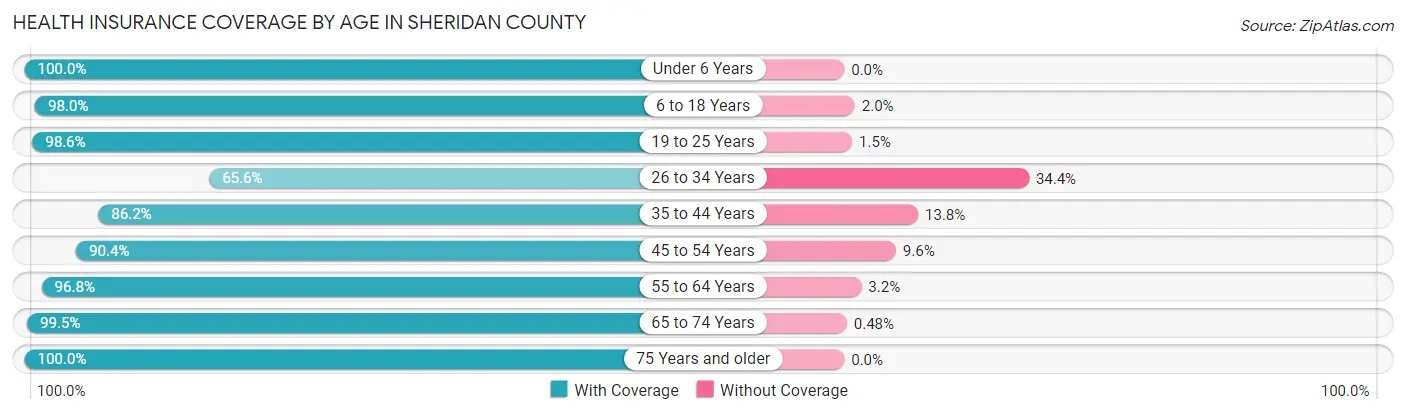
| Age Bracket | With Coverage | Without Coverage |
| Under 6 Years | 63 (100.0%) | 0 (0.0%) |
| 6 to 18 Years | 150 (98.0%) | 3 (2.0%) |
| 19 to 25 Years | 68 (98.6%) | 1 (1.5%) |
| 26 to 34 Years | 80 (65.6%) | 42 (34.4%) |
| 35 to 44 Years | 119 (86.2%) | 19 (13.8%) |
| 45 to 54 Years | 141 (90.4%) | 15 (9.6%) |
| 55 to 64 Years | 182 (96.8%) | 6 (3.2%) |
| 65 to 74 Years | 207 (99.5%) | 1 (0.5%) |
| 75 Years and older | 239 (100.0%) | 0 (0.0%) |
| Total | 1,249 (93.5%) | 87 (6.5%) |
Health Insurance Coverage by Citizenship Status in Sheridan County
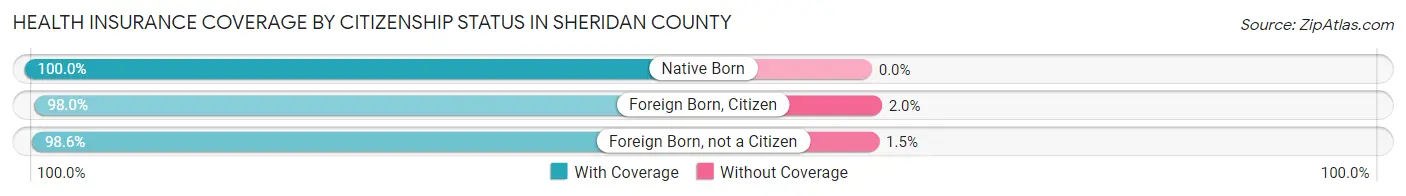
| Citizenship Status | With Coverage | Without Coverage |
| Native Born | 63 (100.0%) | 0 (0.0%) |
| Foreign Born, Citizen | 150 (98.0%) | 3 (2.0%) |
| Foreign Born, not a Citizen | 68 (98.6%) | 1 (1.5%) |
Health Insurance Coverage by Household Income in Sheridan County
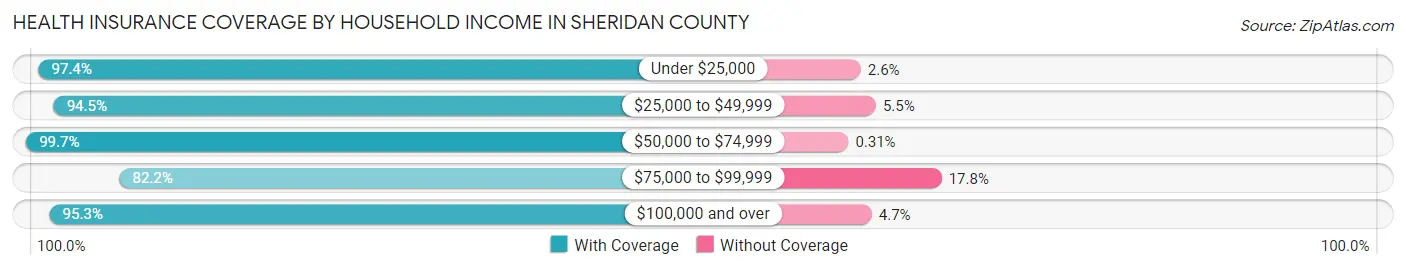
| Household Income | With Coverage | Without Coverage |
| Under $25,000 | 111 (97.4%) | 3 (2.6%) |
| $25,000 to $49,999 | 190 (94.5%) | 11 (5.5%) |
| $50,000 to $74,999 | 317 (99.7%) | 1 (0.3%) |
| $75,000 to $99,999 | 245 (82.2%) | 53 (17.8%) |
| $100,000 and over | 386 (95.3%) | 19 (4.7%) |
Public vs Private Health Insurance Coverage by Age in Sheridan County
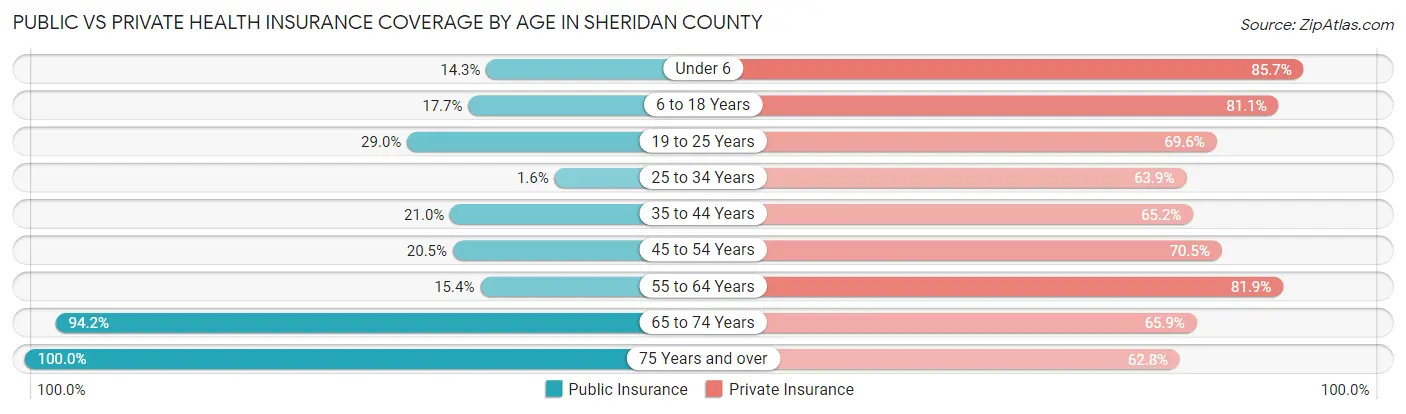
| Age Bracket | Public Insurance | Private Insurance |
| Under 6 | 9 (14.3%) | 54 (85.7%) |
| 6 to 18 Years | 27 (17.6%) | 124 (81.0%) |
| 19 to 25 Years | 20 (29.0%) | 48 (69.6%) |
| 25 to 34 Years | 2 (1.6%) | 78 (63.9%) |
| 35 to 44 Years | 29 (21.0%) | 90 (65.2%) |
| 45 to 54 Years | 32 (20.5%) | 110 (70.5%) |
| 55 to 64 Years | 29 (15.4%) | 154 (81.9%) |
| 65 to 74 Years | 196 (94.2%) | 137 (65.9%) |
| 75 Years and over | 239 (100.0%) | 150 (62.8%) |
| Total | 583 (43.6%) | 945 (70.7%) |
Disability Status by Sex by Age in Sheridan County
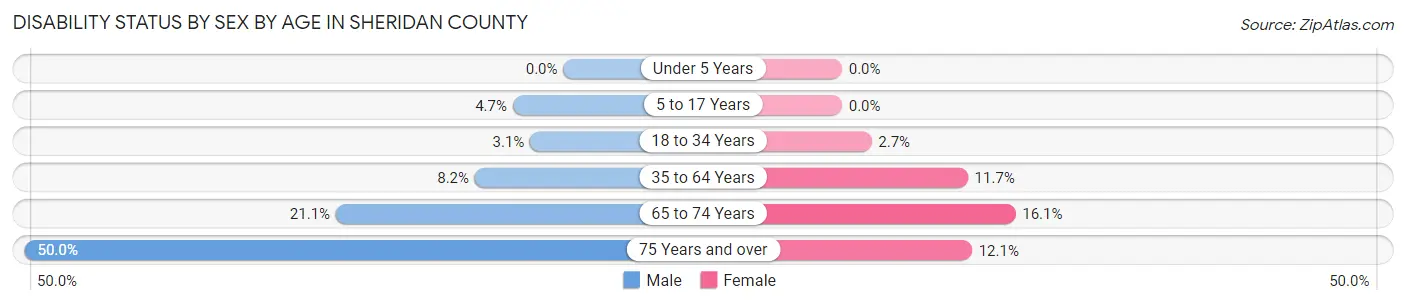
| Age Bracket | Male | Female |
| Under 5 Years | 0 (0.0%) | 0 (0.0%) |
| 5 to 17 Years | 3 (4.7%) | 0 (0.0%) |
| 18 to 34 Years | 4 (3.1%) | 2 (2.7%) |
| 35 to 64 Years | 22 (8.2%) | 25 (11.7%) |
| 65 to 74 Years | 19 (21.1%) | 19 (16.1%) |
| 75 Years and over | 49 (50.0%) | 17 (12.1%) |
Disability Class by Sex by Age in Sheridan County
Disability Class: Hearing Difficulty
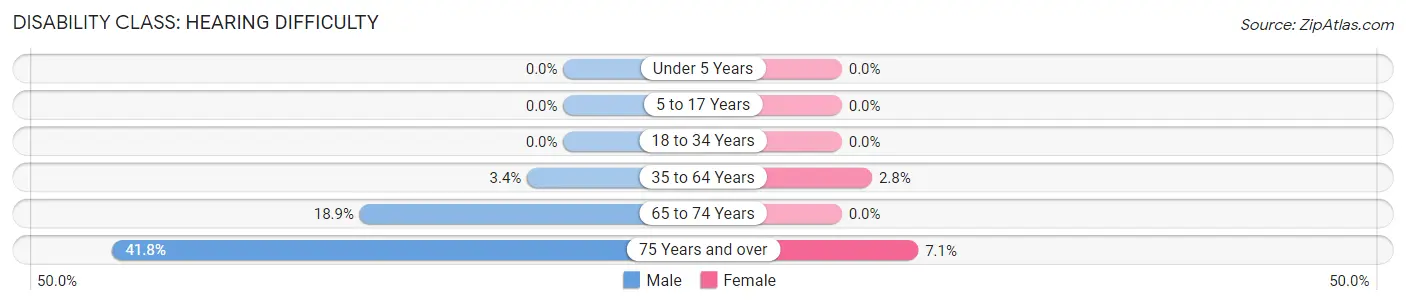
| Age Bracket | Male | Female |
| Under 5 Years | 0 (0.0%) | 0 (0.0%) |
| 5 to 17 Years | 0 (0.0%) | 0 (0.0%) |
| 18 to 34 Years | 0 (0.0%) | 0 (0.0%) |
| 35 to 64 Years | 9 (3.4%) | 6 (2.8%) |
| 65 to 74 Years | 17 (18.9%) | 0 (0.0%) |
| 75 Years and over | 41 (41.8%) | 10 (7.1%) |
Disability Class: Vision Difficulty
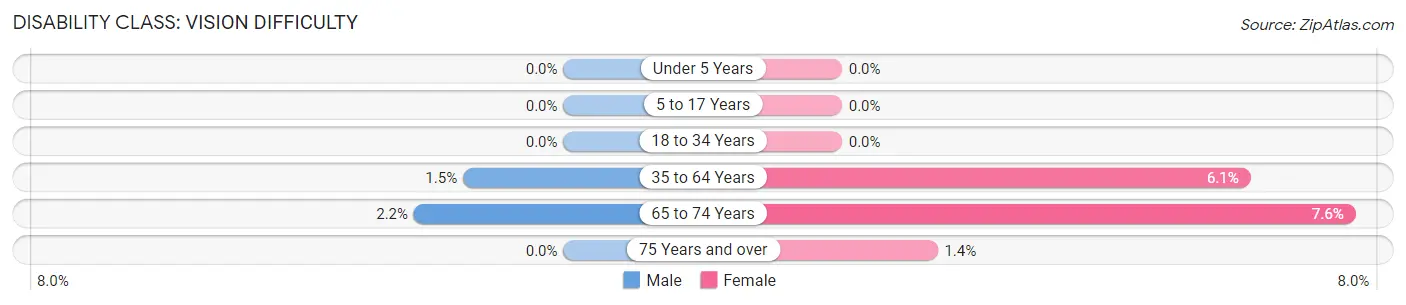
| Age Bracket | Male | Female |
| Under 5 Years | 0 (0.0%) | 0 (0.0%) |
| 5 to 17 Years | 0 (0.0%) | 0 (0.0%) |
| 18 to 34 Years | 0 (0.0%) | 0 (0.0%) |
| 35 to 64 Years | 4 (1.5%) | 13 (6.1%) |
| 65 to 74 Years | 2 (2.2%) | 9 (7.6%) |
| 75 Years and over | 0 (0.0%) | 2 (1.4%) |
Disability Class: Cognitive Difficulty
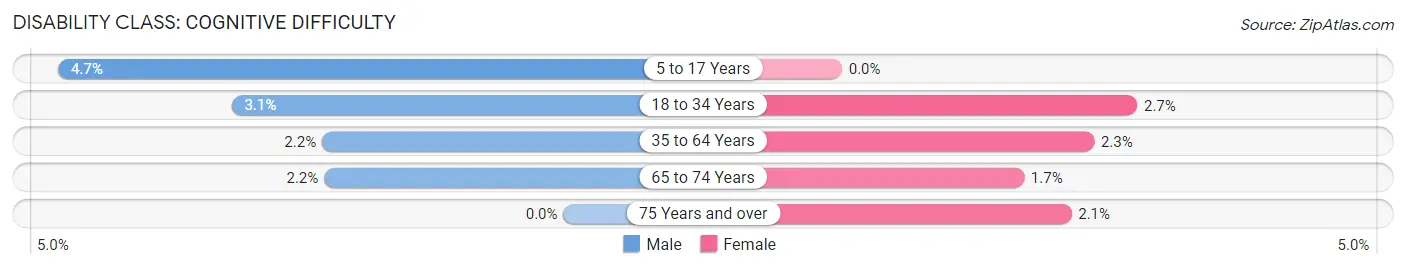
| Age Bracket | Male | Female |
| 5 to 17 Years | 3 (4.7%) | 0 (0.0%) |
| 18 to 34 Years | 4 (3.1%) | 2 (2.7%) |
| 35 to 64 Years | 6 (2.2%) | 5 (2.3%) |
| 65 to 74 Years | 2 (2.2%) | 2 (1.7%) |
| 75 Years and over | 0 (0.0%) | 3 (2.1%) |
Disability Class: Ambulatory Difficulty
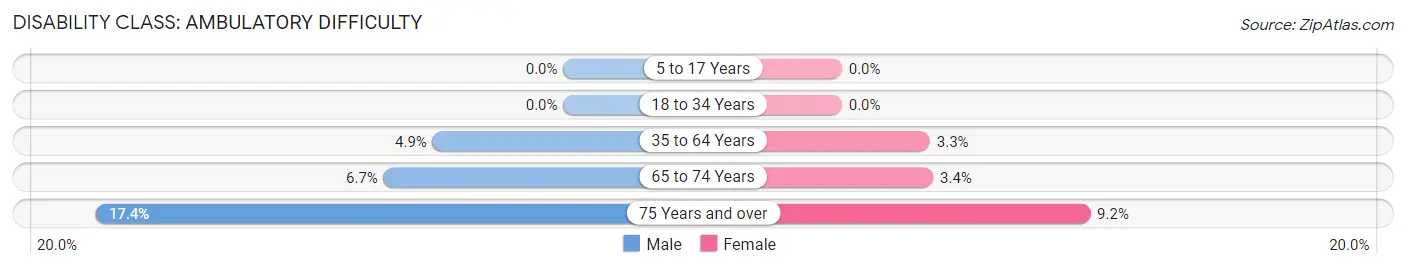
| Age Bracket | Male | Female |
| 5 to 17 Years | 0 (0.0%) | 0 (0.0%) |
| 18 to 34 Years | 0 (0.0%) | 0 (0.0%) |
| 35 to 64 Years | 13 (4.9%) | 7 (3.3%) |
| 65 to 74 Years | 6 (6.7%) | 4 (3.4%) |
| 75 Years and over | 17 (17.3%) | 13 (9.2%) |
Disability Class: Self-Care Difficulty
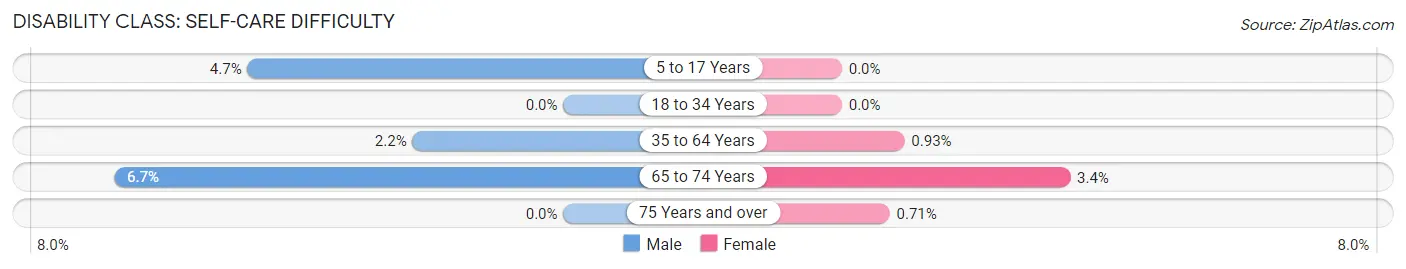
| Age Bracket | Male | Female |
| 5 to 17 Years | 3 (4.7%) | 0 (0.0%) |
| 18 to 34 Years | 0 (0.0%) | 0 (0.0%) |
| 35 to 64 Years | 6 (2.2%) | 2 (0.9%) |
| 65 to 74 Years | 6 (6.7%) | 4 (3.4%) |
| 75 Years and over | 0 (0.0%) | 1 (0.7%) |
Technology Access in Sheridan County
Computing Device Access in Sheridan County
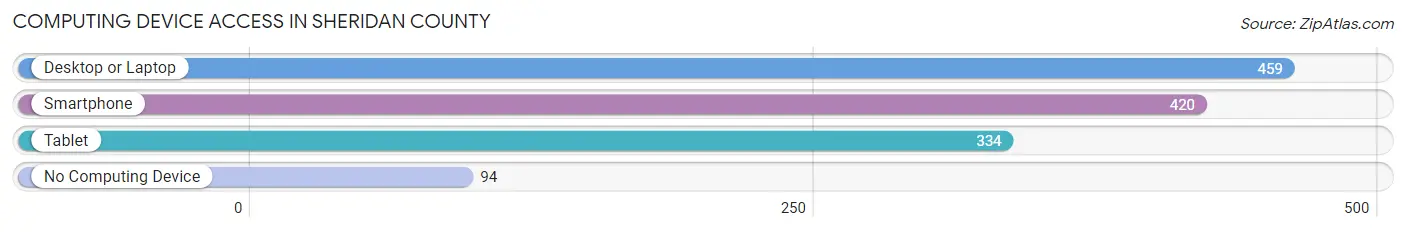
| Device Type | # Households | % Households |
| Desktop or Laptop | 459 | 71.3% |
| Smartphone | 420 | 65.2% |
| Tablet | 334 | 51.9% |
| No Computing Device | 94 | 14.6% |
| Total | 644 | 100.0% |
Internet Access in Sheridan County
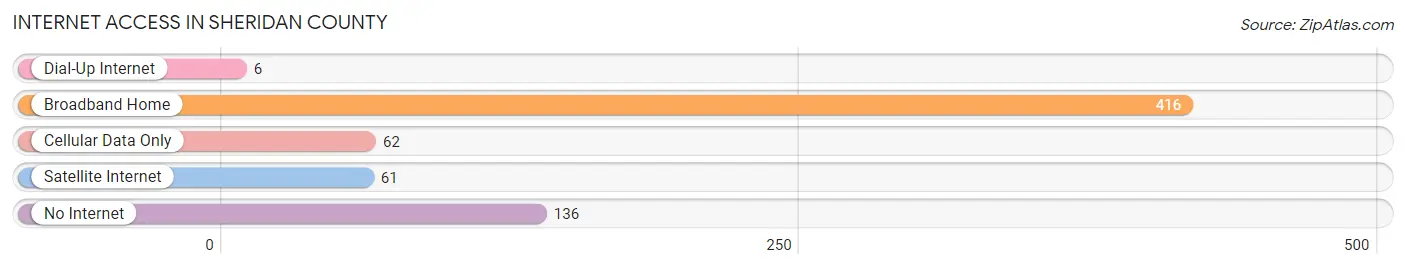
| Internet Type | # Households | % Households |
| Dial-Up Internet | 6 | 0.9% |
| Broadband Home | 416 | 64.6% |
| Cellular Data Only | 62 | 9.6% |
| Satellite Internet | 61 | 9.5% |
| No Internet | 136 | 21.1% |
| Total | 644 | 100.0% |
Sheridan County Summary
Sheridan County, North Dakota is located in the northwestern corner of the state, and is bordered by Montana to the west and South Dakota to the south. The county seat is McClusky, and the county is named after General Philip Sheridan, a Civil War hero. The county has a total area of 1,845 square miles, and a population of 1,945 as of the 2010 census.
Geography
Sheridan County is located in the Missouri Plateau region of North Dakota, and is characterized by rolling hills and flat plains. The county is drained by the Little Missouri River, which flows through the county from east to west. The county is also home to several small lakes, including Lake Sakakawea, which is the largest lake in the state. The county is mostly rural, with the majority of the population living in small towns and rural areas.
The climate of Sheridan County is semi-arid, with hot summers and cold winters. The average annual temperature is around 45 degrees Fahrenheit, and the average annual precipitation is around 16 inches.
Economy
The economy of Sheridan County is largely based on agriculture, with the majority of the population employed in farming and ranching. The county is also home to several oil and gas fields, which provide jobs for many of the county's residents. The county is also home to several small businesses, including a few restaurants, stores, and other services.
Demographics
As of the 2010 census, the population of Sheridan County was 1,945, with a population density of 1.1 people per square mile. The racial makeup of the county was 97.3% White, 0.2% African American, 0.2% Native American, 0.2% Asian, 0.1% Pacific Islander, 0.7% from other races, and 1.3% from two or more races. Hispanic or Latino of any race were 1.3% of the population.
The median income for a household in the county was $37,917, and the median income for a family was $45,000. The per capita income for the county was $18,945. About 11.2% of families and 14.2% of the population were below the poverty line, including 17.2% of those under age 18 and 8.2% of those age 65 or over.
Conclusion
Sheridan County, North Dakota is a rural county located in the northwestern corner of the state. The county is characterized by rolling hills and flat plains, and is home to several small lakes. The economy of the county is largely based on agriculture, with the majority of the population employed in farming and ranching. The population of the county is 1,945, with a median income of $37,917. The county is mostly white, with a small percentage of other races.
Common Questions
What is Per Capita Income in Sheridan County?
Per Capita income in Sheridan County is $40,365.
What is the Median Family Income in Sheridan County?
Median Family Income in Sheridan County is $90,104.
What is the Median Household income in Sheridan County?
Median Household Income in Sheridan County is $68,684.
What is Income or Wage Gap in Sheridan County?
Income or Wage Gap in Sheridan County is 37.4%.
Women in Sheridan County earn 62.6 cents for every dollar earned by a man.
What is Inequality or Gini Index in Sheridan County?
Inequality or Gini Index in Sheridan County is 0.41.
What is the Total Population of Sheridan County?
Total Population of Sheridan County is 1,338.
What is the Total Male Population of Sheridan County?
Total Male Population of Sheridan County is 682.
What is the Total Female Population of Sheridan County?
Total Female Population of Sheridan County is 656.
What is the Ratio of Males per 100 Females in Sheridan County?
There are 103.96 Males per 100 Females in Sheridan County.
What is the Ratio of Females per 100 Males in Sheridan County?
There are 96.19 Females per 100 Males in Sheridan County.
What is the Median Population Age in Sheridan County?
Median Population Age in Sheridan County is 52.3 Years.
What is the Average Family Size in Sheridan County
Average Family Size in Sheridan County is 2.6 People.
What is the Average Household Size in Sheridan County
Average Household Size in Sheridan County is 2.1 People.
How Large is the Labor Force in Sheridan County?
There are 633 People in the Labor Forcein in Sheridan County.
What is the Percentage of People in the Labor Force in Sheridan County?
54.0% of People are in the Labor Force in Sheridan County.
What is the Unemployment Rate in Sheridan County?
Unemployment Rate in Sheridan County is 0.8%.