Logan County, ND Map & Demographics
Logan County Map
Logan County Overview
$33,240
PER CAPITA INCOME
$73,667
AVG FAMILY INCOME
$59,750
AVG HOUSEHOLD INCOME
52.3%
WAGE / INCOME GAP [ % ]
47.7¢/ $1
WAGE / INCOME GAP [ $ ]
0.44
INEQUALITY / GINI INDEX
1,849
TOTAL POPULATION
924
MALE POPULATION
925
FEMALE POPULATION
99.89
MALES / 100 FEMALES
100.11
FEMALES / 100 MALES
49.2
MEDIAN AGE
3.0
AVG FAMILY SIZE
2.3
AVG HOUSEHOLD SIZE
868
LABOR FORCE [ PEOPLE ]
57.7%
PERCENT IN LABOR FORCE
1.3%
UNEMPLOYMENT RATE
Logan County Area Codes
Income in Logan County
Income Overview in Logan County
Per Capita Income in Logan County is $33,240, while median incomes of families and households are $73,667 and $59,750 respectively.
| Characteristic | Number | Measure |
| Per Capita Income | 1,849 | $33,240 |
| Median Family Income | 494 | $73,667 |
| Mean Family Income | 494 | $87,926 |
| Median Household Income | 770 | $59,750 |
| Mean Household Income | 770 | $75,824 |
| Income Deficit | 494 | $0 |
| Wage / Income Gap (%) | 1,849 | 52.26% |
| Wage / Income Gap ($) | 1,849 | 47.74¢ per $1 |
| Gini / Inequality Index | 1,849 | 0.44 |
Earnings by Sex in Logan County
Average Earnings in Logan County are $37,548, $50,938 for men and $24,318 for women, a difference of 52.3%.
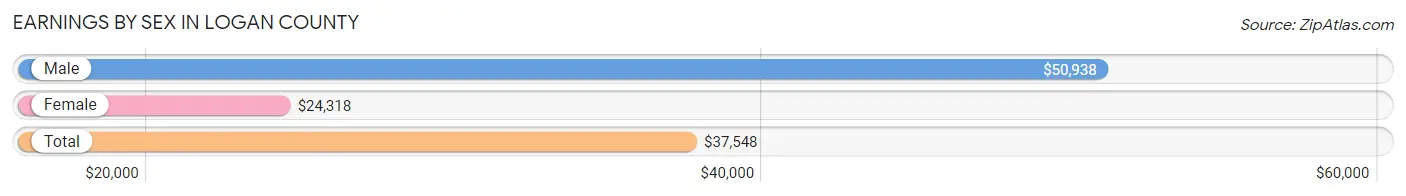
| Sex | Number | Average Earnings |
| Male | 517 (56.5%) | $50,938 |
| Female | 398 (43.5%) | $24,318 |
| Total | 915 (100.0%) | $37,548 |
Earnings by Sex by Income Bracket in Logan County
The most common earnings brackets in Logan County are $55,000 to $64,999 for men (78 | 15.1%) and $30,000 to $34,999 for women (40 | 10.1%).
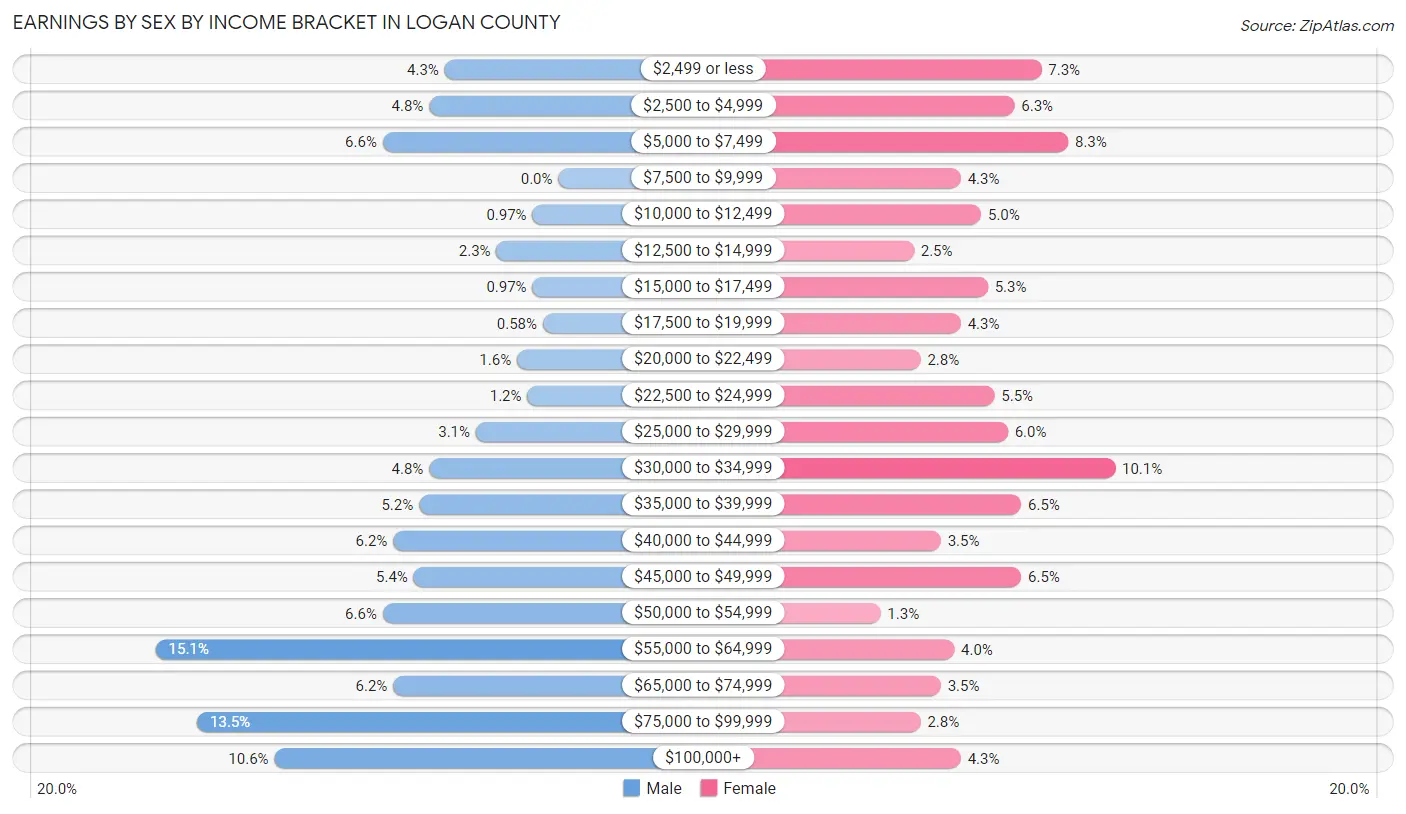
| Income | Male | Female |
| $2,499 or less | 22 (4.3%) | 29 (7.3%) |
| $2,500 to $4,999 | 25 (4.8%) | 25 (6.3%) |
| $5,000 to $7,499 | 34 (6.6%) | 33 (8.3%) |
| $7,500 to $9,999 | 0 (0.0%) | 17 (4.3%) |
| $10,000 to $12,499 | 5 (1.0%) | 20 (5.0%) |
| $12,500 to $14,999 | 12 (2.3%) | 10 (2.5%) |
| $15,000 to $17,499 | 5 (1.0%) | 21 (5.3%) |
| $17,500 to $19,999 | 3 (0.6%) | 17 (4.3%) |
| $20,000 to $22,499 | 8 (1.5%) | 11 (2.8%) |
| $22,500 to $24,999 | 6 (1.2%) | 22 (5.5%) |
| $25,000 to $29,999 | 16 (3.1%) | 24 (6.0%) |
| $30,000 to $34,999 | 25 (4.8%) | 40 (10.1%) |
| $35,000 to $39,999 | 27 (5.2%) | 26 (6.5%) |
| $40,000 to $44,999 | 32 (6.2%) | 14 (3.5%) |
| $45,000 to $49,999 | 28 (5.4%) | 26 (6.5%) |
| $50,000 to $54,999 | 34 (6.6%) | 5 (1.3%) |
| $55,000 to $64,999 | 78 (15.1%) | 16 (4.0%) |
| $65,000 to $74,999 | 32 (6.2%) | 14 (3.5%) |
| $75,000 to $99,999 | 70 (13.5%) | 11 (2.8%) |
| $100,000+ | 55 (10.6%) | 17 (4.3%) |
| Total | 517 (100.0%) | 398 (100.0%) |
Earnings by Sex by Educational Attainment in Logan County
Average earnings in Logan County are $52,083 for men and $27,794 for women, a difference of 46.6%. Men with an educational attainment of less than high school enjoy the highest average annual earnings of $73,125, while those with bachelor's degree education earn the least with $43,438. Women with an educational attainment of bachelor's degree earn the most with the average annual earnings of $32,206, while those with high school diploma education have the smallest earnings of $19,886.
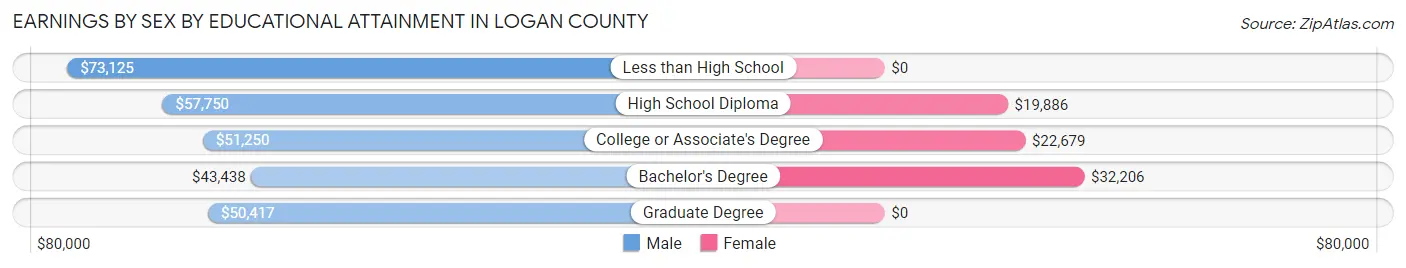
| Educational Attainment | Male Income | Female Income |
| Less than High School | $73,125 | $0 |
| High School Diploma | $57,750 | $19,886 |
| College or Associate's Degree | $51,250 | $22,679 |
| Bachelor's Degree | $43,438 | $32,206 |
| Graduate Degree | $50,417 | $0 |
| Total | $52,083 | $27,794 |
Family Income in Logan County
Family Income Brackets in Logan County
According to the Logan County family income data, there are 112 families falling into the $75,000 to $99,999 income range, which is the most common income bracket and makes up 22.7% of all families. Conversely, the $10,000 to $14,999 income bracket is the least frequent group with only 3 families (0.6%) belonging to this category.
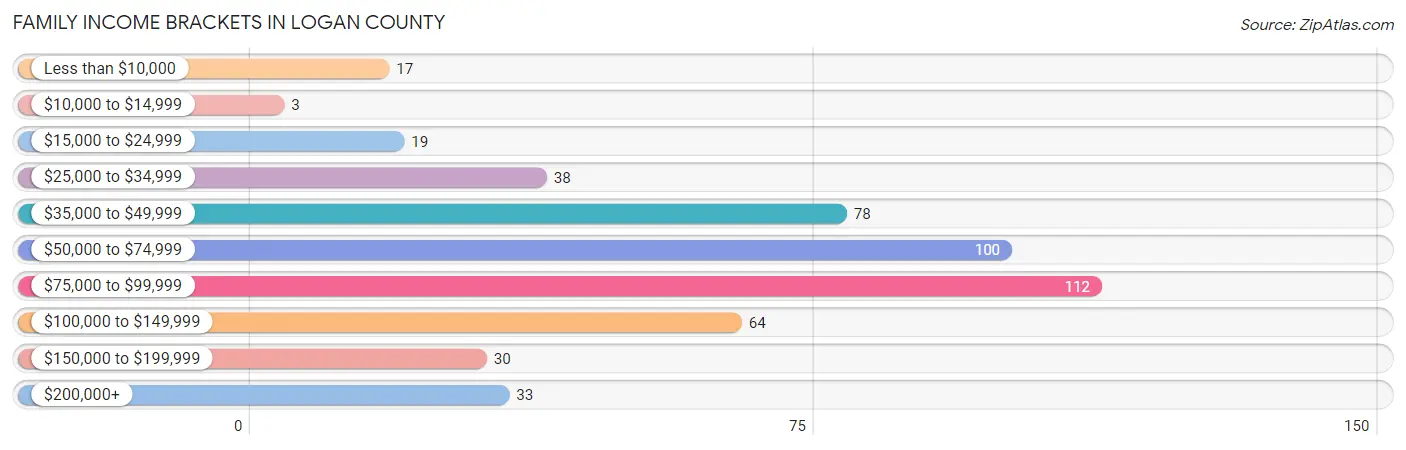
| Income Bracket | # Families | % Families |
| Less than $10,000 | 17 | 3.4% |
| $10,000 to $14,999 | 3 | 0.6% |
| $15,000 to $24,999 | 19 | 3.8% |
| $25,000 to $34,999 | 38 | 7.7% |
| $35,000 to $49,999 | 78 | 15.8% |
| $50,000 to $74,999 | 100 | 20.2% |
| $75,000 to $99,999 | 112 | 22.7% |
| $100,000 to $149,999 | 64 | 13.0% |
| $150,000 to $199,999 | 30 | 6.1% |
| $200,000+ | 33 | 6.7% |
Family Income by Famaliy Size in Logan County
3-person families (57 | 11.5%) account for the highest median family income in Logan County with $82,375 per family, while 2-person families (302 | 61.1%) have the highest median income of $35,556 per family member.
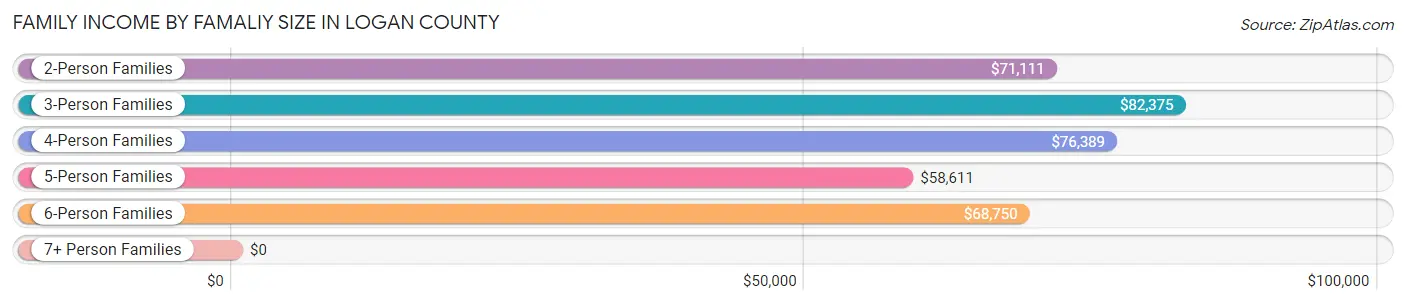
| Income Bracket | # Families | Median Income |
| 2-Person Families | 302 (61.1%) | $71,111 |
| 3-Person Families | 57 (11.5%) | $82,375 |
| 4-Person Families | 54 (10.9%) | $76,389 |
| 5-Person Families | 60 (12.1%) | $58,611 |
| 6-Person Families | 14 (2.8%) | $68,750 |
| 7+ Person Families | 7 (1.4%) | $0 |
| Total | 494 (100.0%) | $73,667 |
Family Income by Number of Earners in Logan County
The median family income in Logan County is $73,667, with families comprising 3+ earners (37) having the highest median family income of $172,083, while families with no earners (113) have the lowest median family income of $33,750, accounting for 7.5% and 22.9% of families, respectively.
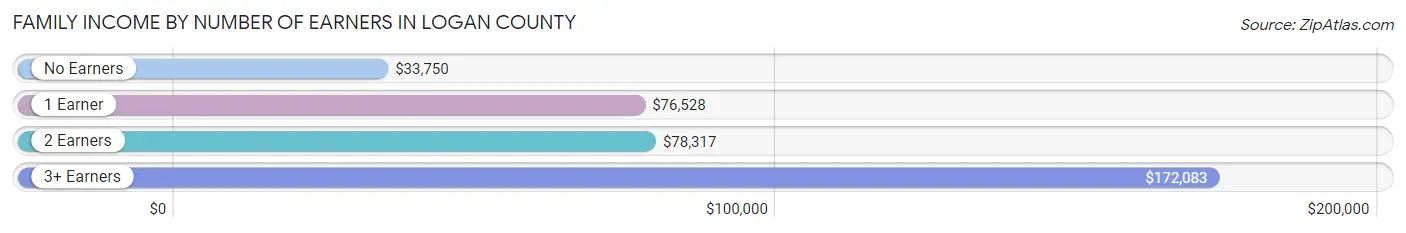
| Number of Earners | # Families | Median Income |
| No Earners | 113 (22.9%) | $33,750 |
| 1 Earner | 99 (20.0%) | $76,528 |
| 2 Earners | 245 (49.6%) | $78,317 |
| 3+ Earners | 37 (7.5%) | $172,083 |
| Total | 494 (100.0%) | $73,667 |
Household Income in Logan County
Household Income Brackets in Logan County
With 143 households falling in the category, the $75,000 to $99,999 income range is the most frequent in Logan County, accounting for 18.6% of all households. In contrast, only 17 households (2.2%) fall into the $10,000 to $14,999 income bracket, making it the least populous group.

| Income Bracket | # Households | % Households |
| Less than $10,000 | 51 | 6.6% |
| $10,000 to $14,999 | 17 | 2.2% |
| $15,000 to $24,999 | 82 | 10.6% |
| $25,000 to $34,999 | 53 | 6.9% |
| $35,000 to $49,999 | 118 | 15.3% |
| $50,000 to $74,999 | 141 | 18.3% |
| $75,000 to $99,999 | 143 | 18.6% |
| $100,000 to $149,999 | 87 | 11.3% |
| $150,000 to $199,999 | 37 | 4.8% |
| $200,000+ | 41 | 5.3% |
Household Income by Householder Age in Logan County
The median household income in Logan County is $59,750, with the highest median household income of $73,304 found in the 45 to 64 years age bracket for the primary householder. A total of 293 households (38.1%) fall into this category. Meanwhile, the 65+ years age bracket for the primary householder has the lowest median household income of $39,904, with 271 households (35.2%) in this group.
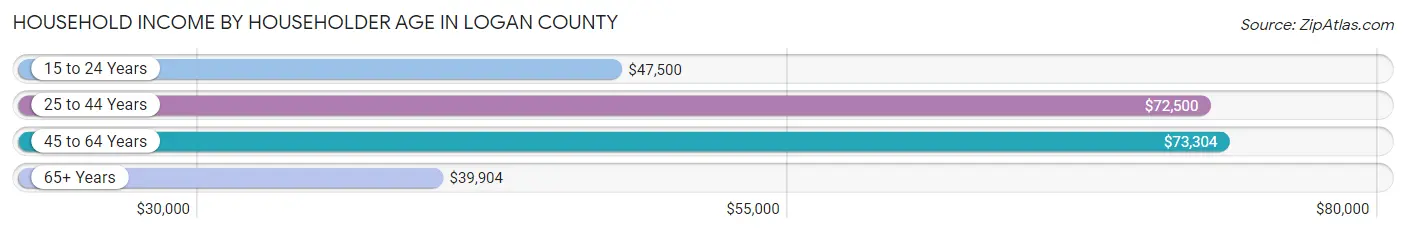
| Income Bracket | # Households | Median Income |
| 15 to 24 Years | 12 (1.6%) | $47,500 |
| 25 to 44 Years | 194 (25.2%) | $72,500 |
| 45 to 64 Years | 293 (38.1%) | $73,304 |
| 65+ Years | 271 (35.2%) | $39,904 |
| Total | 770 (100.0%) | $59,750 |
Poverty in Logan County
Income Below Poverty by Sex and Age in Logan County
With 7.7% poverty level for males and 8.7% for females among the residents of Logan County, 16 and 17 year old males and 25 to 34 year old females are the most vulnerable to poverty, with 3 males (16.7%) and 14 females (12.4%) in their respective age groups living below the poverty level.
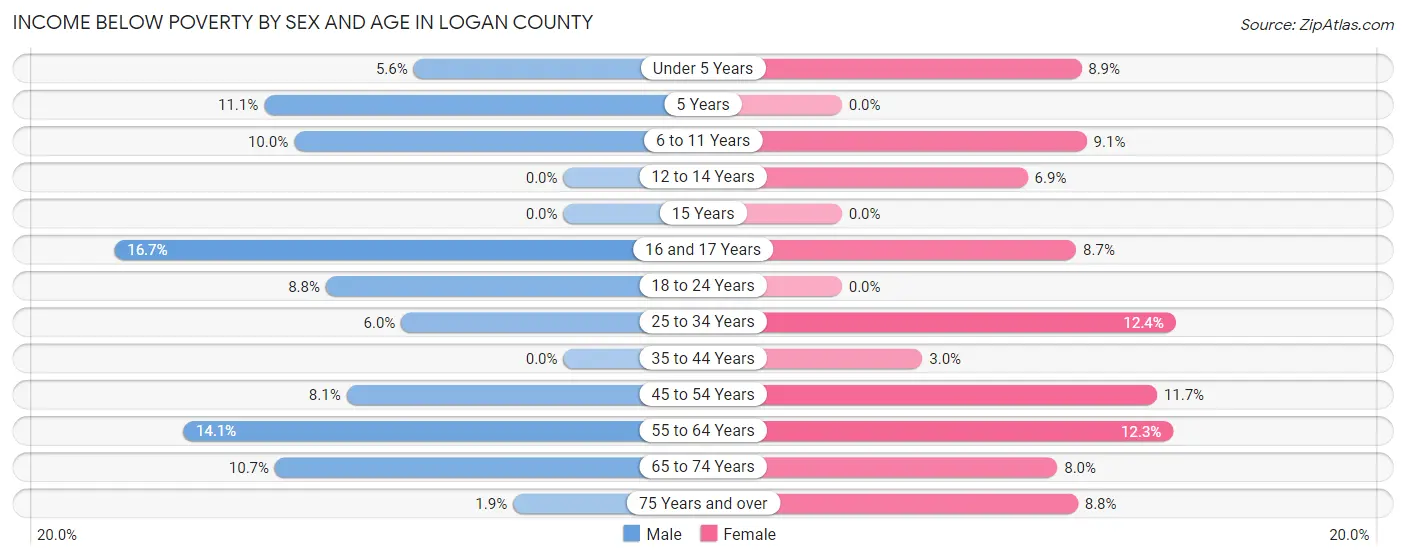
| Age Bracket | Male | Female |
| Under 5 Years | 4 (5.6%) | 4 (8.9%) |
| 5 Years | 2 (11.1%) | 0 (0.0%) |
| 6 to 11 Years | 7 (10.0%) | 5 (9.1%) |
| 12 to 14 Years | 0 (0.0%) | 2 (6.9%) |
| 15 Years | 0 (0.0%) | 0 (0.0%) |
| 16 and 17 Years | 3 (16.7%) | 4 (8.7%) |
| 18 to 24 Years | 3 (8.8%) | 0 (0.0%) |
| 25 to 34 Years | 5 (6.0%) | 14 (12.4%) |
| 35 to 44 Years | 0 (0.0%) | 2 (3.0%) |
| 45 to 54 Years | 7 (8.1%) | 11 (11.7%) |
| 55 to 64 Years | 25 (14.1%) | 15 (12.3%) |
| 65 to 74 Years | 12 (10.7%) | 6 (8.0%) |
| 75 Years and over | 2 (1.9%) | 12 (8.8%) |
| Total | 70 (7.7%) | 75 (8.7%) |
Income Above Poverty by Sex and Age in Logan County
According to the poverty statistics in Logan County, males aged 12 to 14 years and females aged 5 years are the age groups that are most secure financially, with 100.0% of males and 100.0% of females in these age groups living above the poverty line.
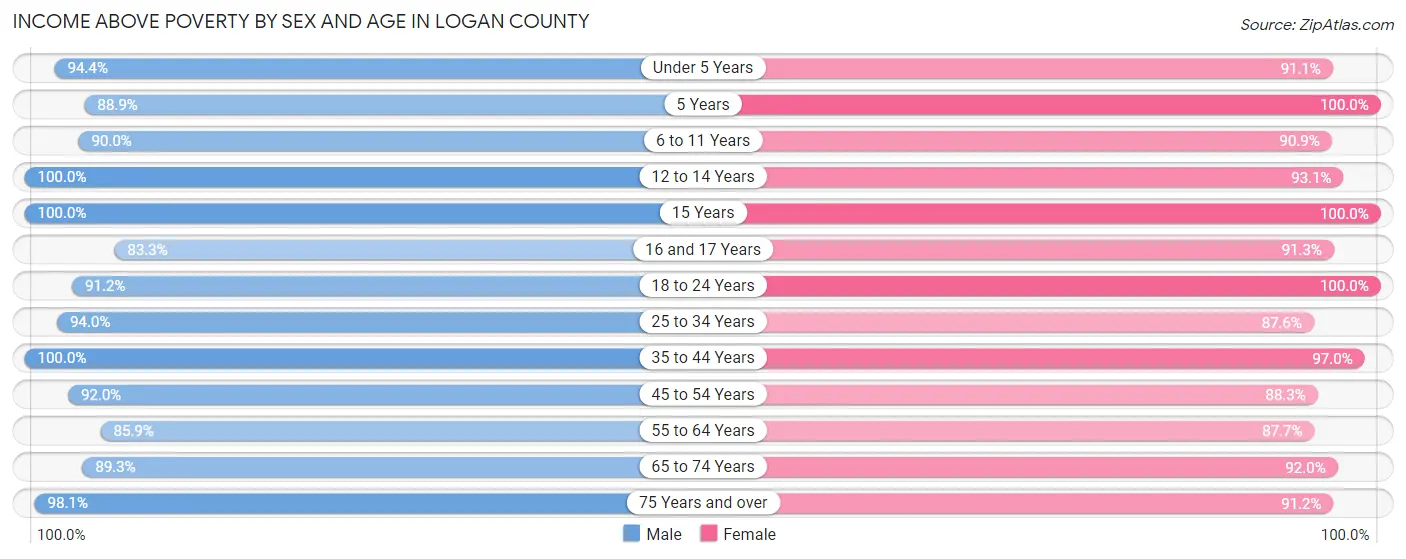
| Age Bracket | Male | Female |
| Under 5 Years | 68 (94.4%) | 41 (91.1%) |
| 5 Years | 16 (88.9%) | 8 (100.0%) |
| 6 to 11 Years | 63 (90.0%) | 50 (90.9%) |
| 12 to 14 Years | 17 (100.0%) | 27 (93.1%) |
| 15 Years | 5 (100.0%) | 26 (100.0%) |
| 16 and 17 Years | 15 (83.3%) | 42 (91.3%) |
| 18 to 24 Years | 31 (91.2%) | 46 (100.0%) |
| 25 to 34 Years | 78 (94.0%) | 99 (87.6%) |
| 35 to 44 Years | 110 (100.0%) | 65 (97.0%) |
| 45 to 54 Years | 80 (91.9%) | 83 (88.3%) |
| 55 to 64 Years | 152 (85.9%) | 107 (87.7%) |
| 65 to 74 Years | 100 (89.3%) | 69 (92.0%) |
| 75 Years and over | 105 (98.1%) | 125 (91.2%) |
| Total | 840 (92.3%) | 788 (91.3%) |
Income Below Poverty Among Married-Couple Families in Logan County
The poverty statistics for married-couple families in Logan County show that 4.5% or 21 of the total 463 families live below the poverty line. Families with 1 or 2 children have the highest poverty rate of 8.4%, comprising of 8 families. On the other hand, families with 3 or 4 children have the lowest poverty rate of 0.0%, which includes 0 families.
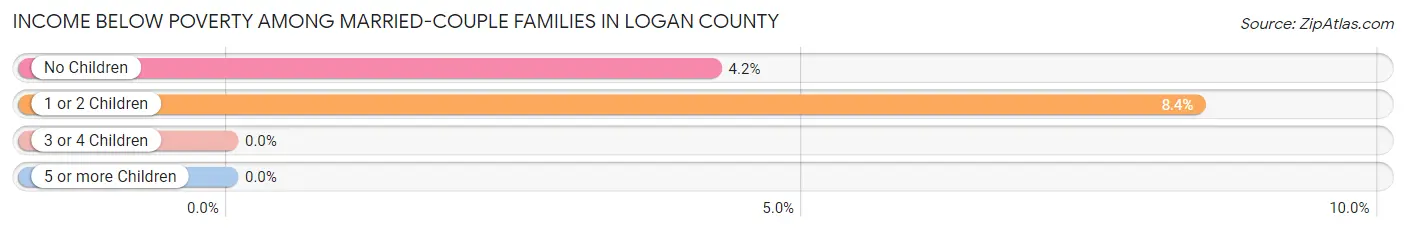
| Children | Above Poverty | Below Poverty |
| No Children | 296 (95.8%) | 13 (4.2%) |
| 1 or 2 Children | 87 (91.6%) | 8 (8.4%) |
| 3 or 4 Children | 57 (100.0%) | 0 (0.0%) |
| 5 or more Children | 2 (100.0%) | 0 (0.0%) |
| Total | 442 (95.5%) | 21 (4.5%) |
Income Below Poverty Among Single-Parent Households in Logan County
According to the poverty data in Logan County, 27.3% or 3 single-father households and 50.0% or 10 single-mother households are living below the poverty line. Among single-father households, those with no children have the highest poverty rate, with 3 households (75.0%) experiencing poverty. Likewise, among single-mother households, those with 1 or 2 children have the highest poverty rate, with 4 households (100.0%) falling below the poverty line.
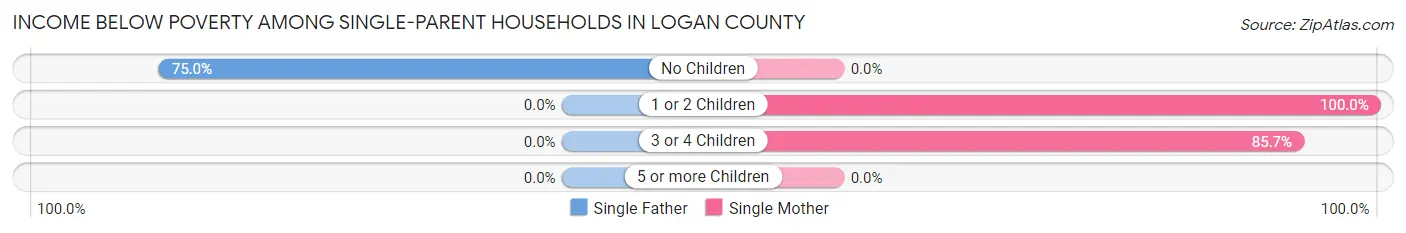
| Children | Single Father | Single Mother |
| No Children | 3 (75.0%) | 0 (0.0%) |
| 1 or 2 Children | 0 (0.0%) | 4 (100.0%) |
| 3 or 4 Children | 0 (0.0%) | 6 (85.7%) |
| 5 or more Children | 0 (0.0%) | 0 (0.0%) |
| Total | 3 (27.3%) | 10 (50.0%) |
Income Below Poverty Among Married-Couple vs Single-Parent Households in Logan County
The poverty data for Logan County shows that 21 of the married-couple family households (4.5%) and 13 of the single-parent households (41.9%) are living below the poverty level. Within the married-couple family households, those with 1 or 2 children have the highest poverty rate, with 8 households (8.4%) falling below the poverty line. Among the single-parent households, those with 3 or 4 children have the highest poverty rate, with 6 household (85.7%) living below poverty.
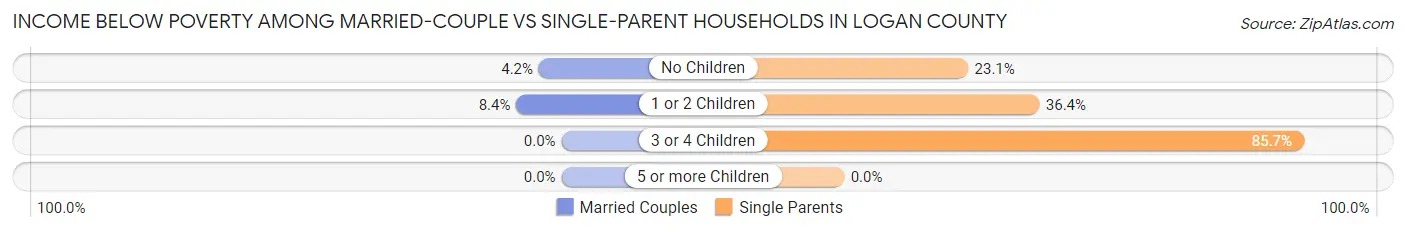
| Children | Married-Couple Families | Single-Parent Households |
| No Children | 13 (4.2%) | 3 (23.1%) |
| 1 or 2 Children | 8 (8.4%) | 4 (36.4%) |
| 3 or 4 Children | 0 (0.0%) | 6 (85.7%) |
| 5 or more Children | 0 (0.0%) | 0 (0.0%) |
| Total | 21 (4.5%) | 13 (41.9%) |
Race in Logan County
The most populous races in Logan County are White / Caucasian (1,763 | 95.4%), Two or more Races (55 | 3.0%), and Hispanic or Latino (51 | 2.8%).
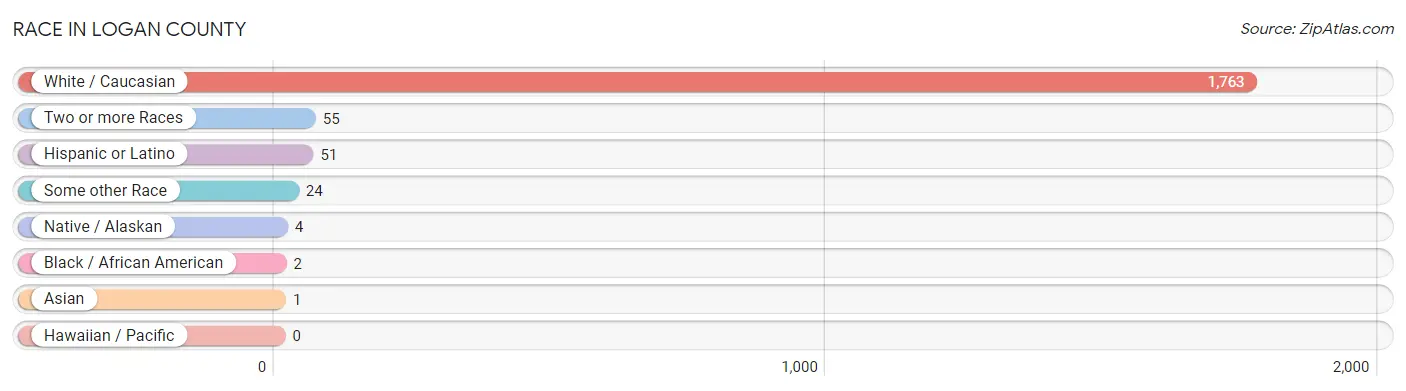
| Race | # Population | % Population |
| Asian | 1 | 0.1% |
| Black / African American | 2 | 0.1% |
| Hawaiian / Pacific | 0 | 0.0% |
| Hispanic or Latino | 51 | 2.8% |
| Native / Alaskan | 4 | 0.2% |
| White / Caucasian | 1,763 | 95.4% |
| Two or more Races | 55 | 3.0% |
| Some other Race | 24 | 1.3% |
| Total | 1,849 | 100.0% |
Ancestry in Logan County
The most populous ancestries reported in Logan County are German (1,120 | 60.6%), Russian (275 | 14.9%), Norwegian (154 | 8.3%), American (87 | 4.7%), and Irish (83 | 4.5%), together accounting for 93.0% of all Logan County residents.
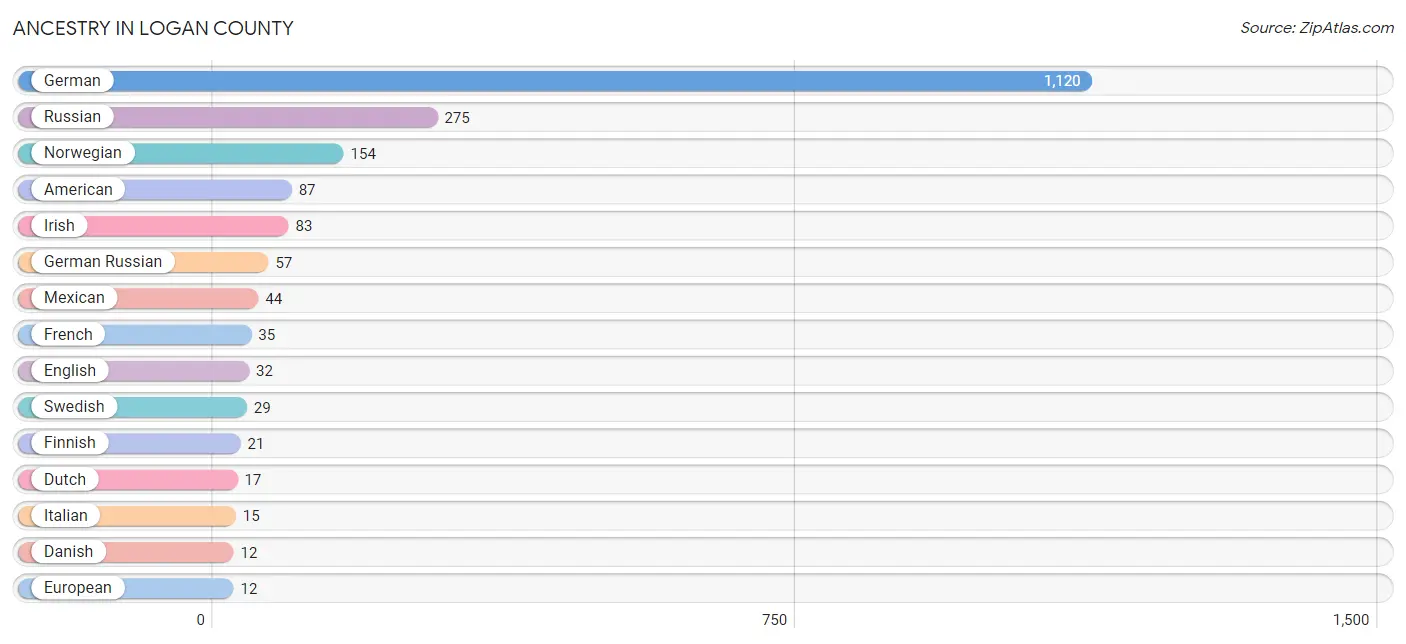
| Ancestry | # Population | % Population |
| American | 87 | 4.7% |
| Burmese | 4 | 0.2% |
| Canadian | 1 | 0.1% |
| Chippewa | 5 | 0.3% |
| Colombian | 7 | 0.4% |
| Czech | 10 | 0.5% |
| Danish | 12 | 0.6% |
| Dutch | 17 | 0.9% |
| English | 32 | 1.7% |
| European | 12 | 0.6% |
| Finnish | 21 | 1.1% |
| French | 35 | 1.9% |
| French American Indian | 2 | 0.1% |
| French Canadian | 2 | 0.1% |
| German | 1,120 | 60.6% |
| German Russian | 57 | 3.1% |
| Indian (Asian) | 1 | 0.1% |
| Irish | 83 | 4.5% |
| Italian | 15 | 0.8% |
| Liberian | 2 | 0.1% |
| Mexican | 44 | 2.4% |
| Norwegian | 154 | 8.3% |
| Polish | 11 | 0.6% |
| Russian | 275 | 14.9% |
| Scandinavian | 4 | 0.2% |
| Scotch-Irish | 1 | 0.1% |
| Scottish | 1 | 0.1% |
| South American | 7 | 0.4% |
| Subsaharan African | 2 | 0.1% |
| Swedish | 29 | 1.6% |
| Swiss | 6 | 0.3% |
| Welsh | 5 | 0.3% | View All 32 Rows |
Immigrants in Logan County
The most numerous immigrant groups reported in Logan County came from Central America (20 | 1.1%), Latin America (20 | 1.1%), Mexico (20 | 1.1%), Europe (14 | 0.8%), and Germany (10 | 0.5%), together accounting for 4.5% of all Logan County residents.
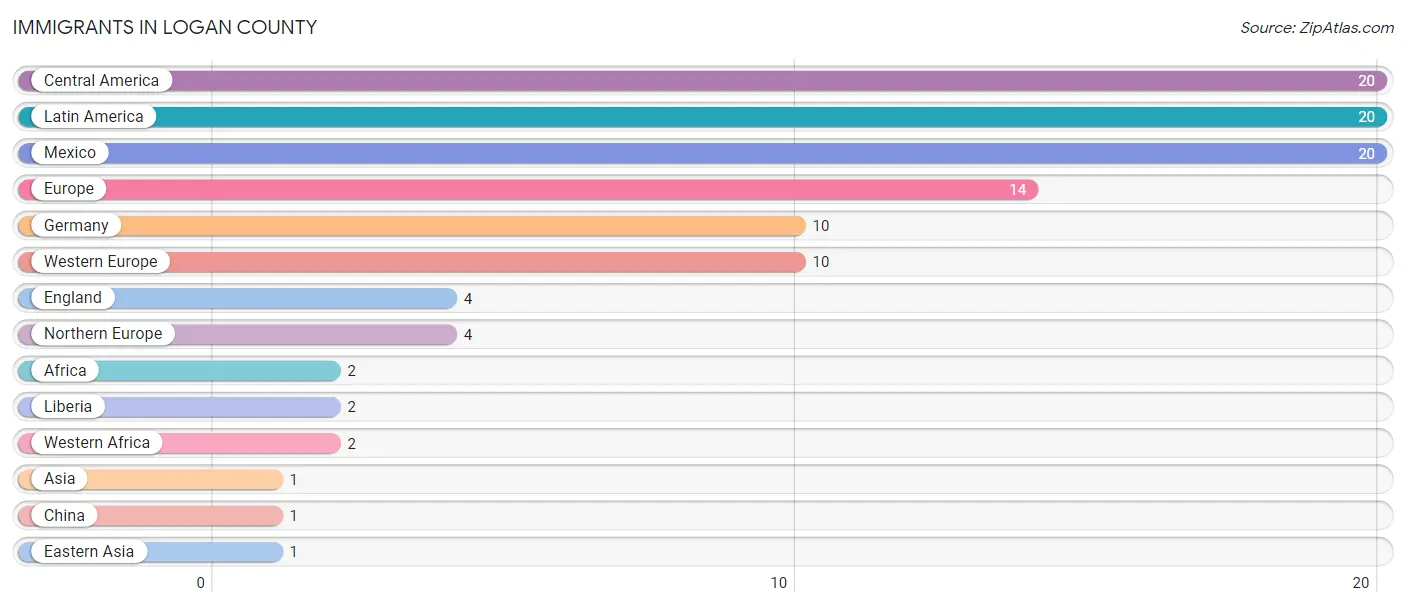
| Immigration Origin | # Population | % Population |
| Africa | 2 | 0.1% |
| Asia | 1 | 0.1% |
| Central America | 20 | 1.1% |
| China | 1 | 0.1% |
| Eastern Asia | 1 | 0.1% |
| England | 4 | 0.2% |
| Europe | 14 | 0.8% |
| Germany | 10 | 0.5% |
| Latin America | 20 | 1.1% |
| Liberia | 2 | 0.1% |
| Mexico | 20 | 1.1% |
| Northern Europe | 4 | 0.2% |
| Western Africa | 2 | 0.1% |
| Western Europe | 10 | 0.5% | View All 14 Rows |
Sex and Age in Logan County
Sex and Age in Logan County
The most populous age groups in Logan County are 60 to 64 Years (92 | 10.0%) for men and 15 to 19 Years (98 | 10.6%) for women.
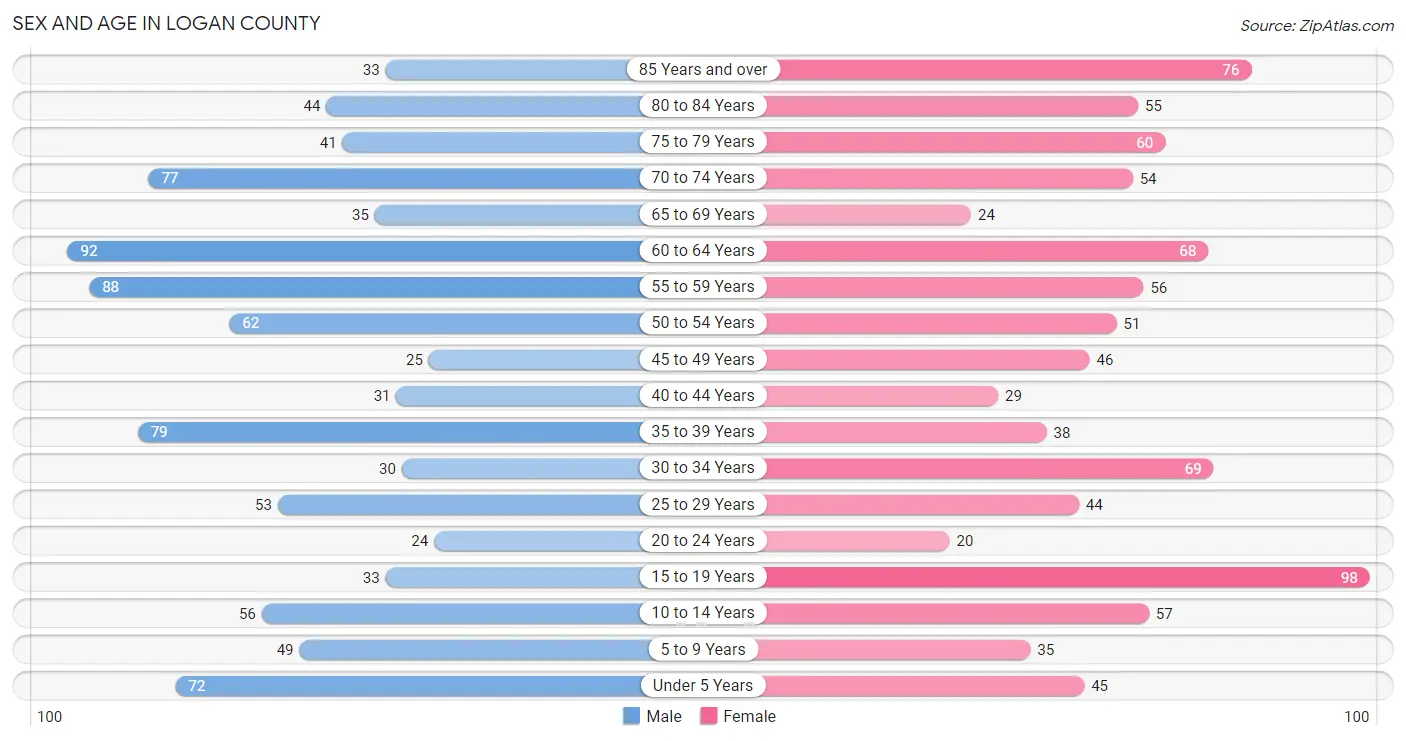
| Age Bracket | Male | Female |
| Under 5 Years | 72 (7.8%) | 45 (4.9%) |
| 5 to 9 Years | 49 (5.3%) | 35 (3.8%) |
| 10 to 14 Years | 56 (6.1%) | 57 (6.2%) |
| 15 to 19 Years | 33 (3.6%) | 98 (10.6%) |
| 20 to 24 Years | 24 (2.6%) | 20 (2.2%) |
| 25 to 29 Years | 53 (5.7%) | 44 (4.8%) |
| 30 to 34 Years | 30 (3.3%) | 69 (7.5%) |
| 35 to 39 Years | 79 (8.6%) | 38 (4.1%) |
| 40 to 44 Years | 31 (3.4%) | 29 (3.1%) |
| 45 to 49 Years | 25 (2.7%) | 46 (5.0%) |
| 50 to 54 Years | 62 (6.7%) | 51 (5.5%) |
| 55 to 59 Years | 88 (9.5%) | 56 (6.0%) |
| 60 to 64 Years | 92 (10.0%) | 68 (7.3%) |
| 65 to 69 Years | 35 (3.8%) | 24 (2.6%) |
| 70 to 74 Years | 77 (8.3%) | 54 (5.8%) |
| 75 to 79 Years | 41 (4.4%) | 60 (6.5%) |
| 80 to 84 Years | 44 (4.8%) | 55 (5.9%) |
| 85 Years and over | 33 (3.6%) | 76 (8.2%) |
| Total | 924 (100.0%) | 925 (100.0%) |
Families and Households in Logan County
Median Family Size in Logan County
The median family size in Logan County is 2.98 persons per family, with single female/mother families (20 | 4.1%) accounting for the largest median family size of 4 persons per family. On the other hand, single male/father families (11 | 2.2%) represent the smallest median family size with 2.64 persons per family.
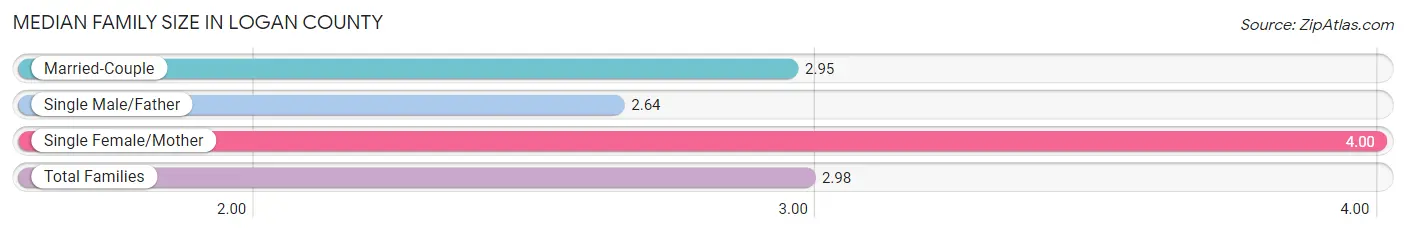
| Family Type | # Families | Family Size |
| Married-Couple | 463 (93.7%) | 2.95 |
| Single Male/Father | 11 (2.2%) | 2.64 |
| Single Female/Mother | 20 (4.1%) | 4.00 |
| Total Families | 494 (100.0%) | 2.98 |
Median Household Size in Logan County
The median household size in Logan County is 2.29 persons per household, with single female/mother households (20 | 2.6%) accounting for the largest median household size of 4 persons per household. non-family households (276 | 35.8%) represent the smallest median household size with 1.05 persons per household.
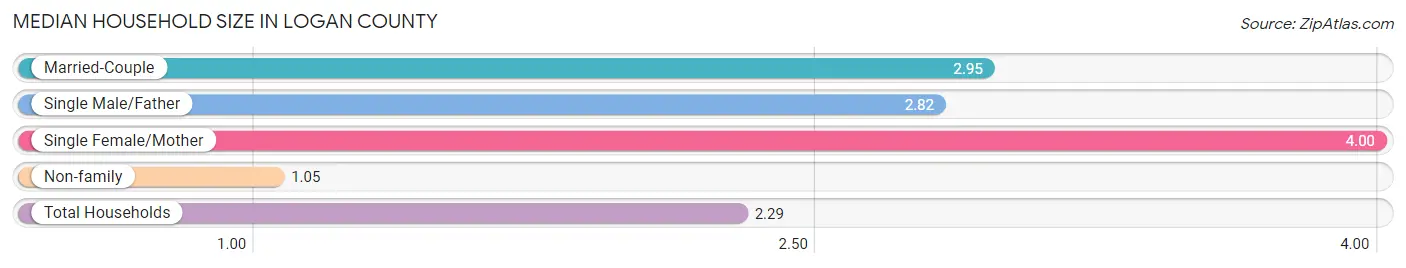
| Household Type | # Households | Household Size |
| Married-Couple | 463 (60.1%) | 2.95 |
| Single Male/Father | 11 (1.4%) | 2.82 |
| Single Female/Mother | 20 (2.6%) | 4.00 |
| Non-family | 276 (35.8%) | 1.05 |
| Total Households | 770 (100.0%) | 2.29 |
Household Size by Marriage Status in Logan County
Out of a total of 770 households in Logan County, 494 (64.2%) are family households, while 276 (35.8%) are nonfamily households. The most numerous type of family households are 2-person households, comprising 297, and the most common type of nonfamily households are 1-person households, comprising 267.
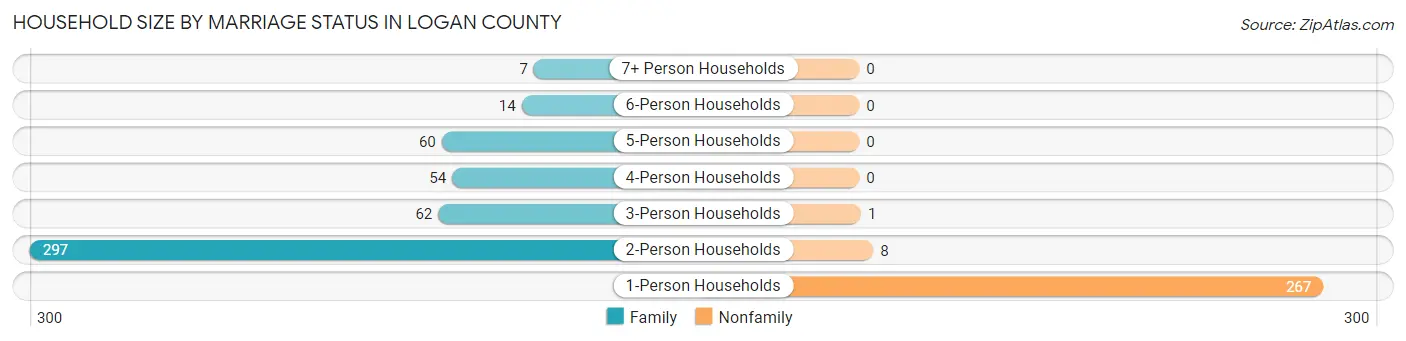
| Household Size | Family Households | Nonfamily Households |
| 1-Person Households | - | 267 (34.7%) |
| 2-Person Households | 297 (38.6%) | 8 (1.0%) |
| 3-Person Households | 62 (8.1%) | 1 (0.1%) |
| 4-Person Households | 54 (7.0%) | 0 (0.0%) |
| 5-Person Households | 60 (7.8%) | 0 (0.0%) |
| 6-Person Households | 14 (1.8%) | 0 (0.0%) |
| 7+ Person Households | 7 (0.9%) | 0 (0.0%) |
| Total | 494 (64.2%) | 276 (35.8%) |
Female Fertility in Logan County
Fertility by Age in Logan County
Average fertility rate in Logan County is 96.0 births per 1,000 women. Women in the age bracket of 20 to 34 years have the highest fertility rate with 203.0 births per 1,000 women. Women in the age bracket of 20 to 34 years acount for 79.4% of all women with births.
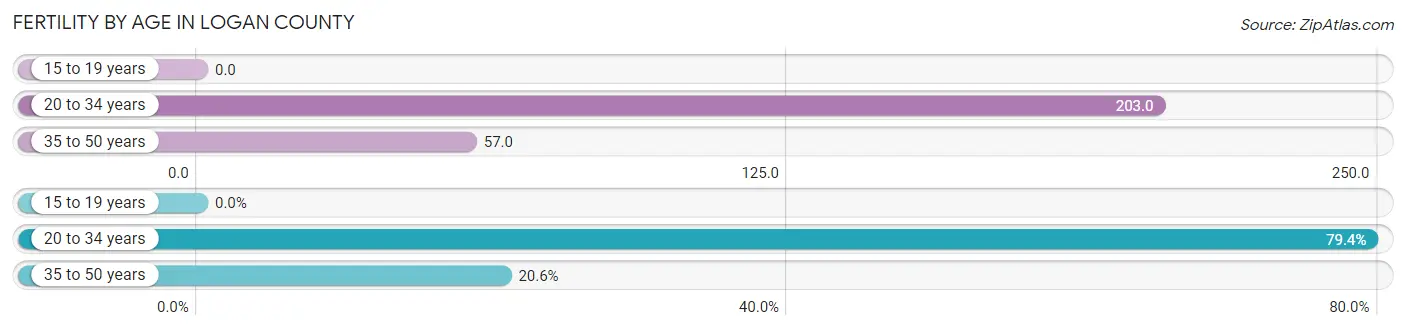
| Age Bracket | Women with Births | Births / 1,000 Women |
| 15 to 19 years | 0 (0.0%) | 0.0 |
| 20 to 34 years | 27 (79.4%) | 203.0 |
| 35 to 50 years | 7 (20.6%) | 57.0 |
| Total | 34 (100.0%) | 96.0 |
Fertility by Age by Marriage Status in Logan County
82.4% of women with births (34) in Logan County are married. The highest percentage of unmarried women with births falls into 20 to 34 years age bracket with 22.2% of them unmarried at the time of birth, while the lowest percentage of unmarried women with births belong to 35 to 50 years age bracket with 0.0% of them unmarried.
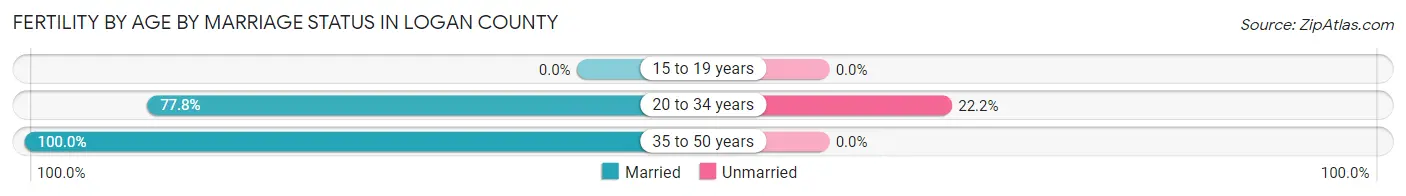
| Age Bracket | Married | Unmarried |
| 15 to 19 years | 0 (0.0%) | 0 (0.0%) |
| 20 to 34 years | 21 (77.8%) | 6 (22.2%) |
| 35 to 50 years | 7 (100.0%) | 0 (0.0%) |
| Total | 28 (82.4%) | 6 (17.6%) |
Fertility by Education in Logan County
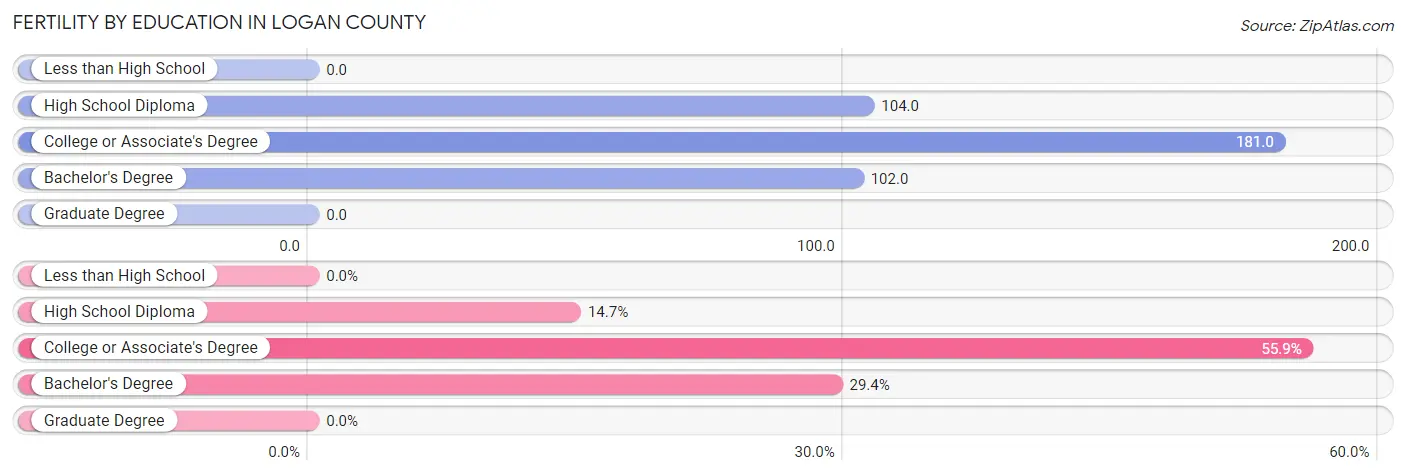
| Educational Attainment | Women with Births | Births / 1,000 Women |
| Less than High School | 0 (0.0%) | 0.0 |
| High School Diploma | 5 (14.7%) | 104.0 |
| College or Associate's Degree | 19 (55.9%) | 181.0 |
| Bachelor's Degree | 10 (29.4%) | 102.0 |
| Graduate Degree | 0 (0.0%) | 0.0 |
| Total | 34 (100.0%) | 96.0 |
Fertility by Education by Marriage Status in Logan County
17.6% of women with births in Logan County are unmarried. Women with the educational attainment of high school diploma are most likely to be married with 100.0% of them married at childbirth, while women with the educational attainment of college or associate's degree are least likely to be married with 31.6% of them unmarried at childbirth.
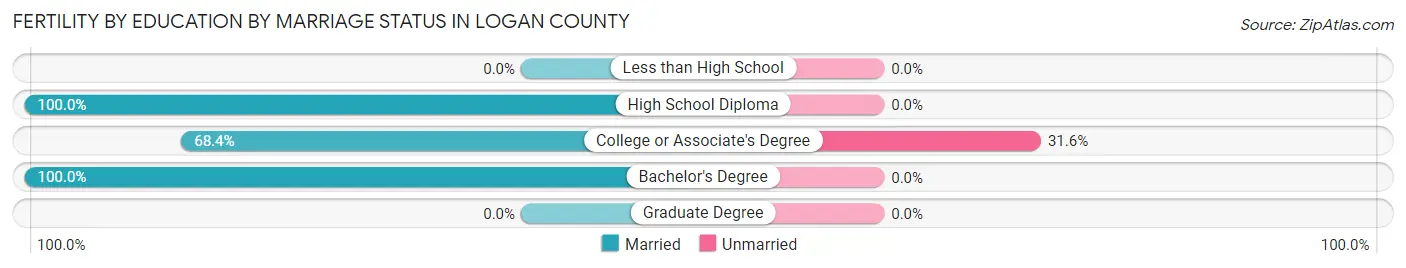
| Educational Attainment | Married | Unmarried |
| Less than High School | 0 (0.0%) | 0 (0.0%) |
| High School Diploma | 5 (100.0%) | 0 (0.0%) |
| College or Associate's Degree | 13 (68.4%) | 6 (31.6%) |
| Bachelor's Degree | 10 (100.0%) | 0 (0.0%) |
| Graduate Degree | 0 (0.0%) | 0 (0.0%) |
| Total | 28 (82.4%) | 6 (17.6%) |
Employment Characteristics in Logan County
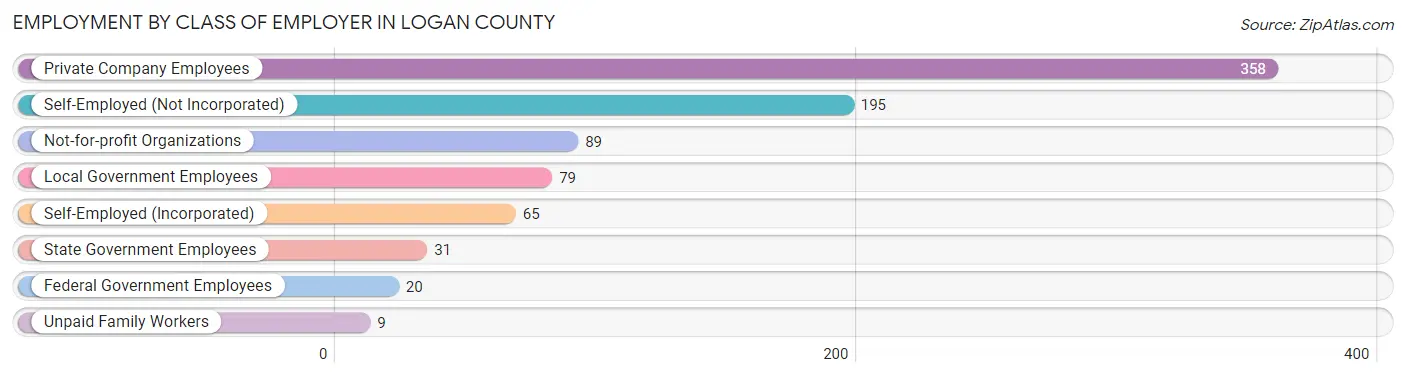
Employment by Class of Employer in Logan County
Among the 846 employed individuals in Logan County, private company employees (358 | 42.3%), self-employed (not incorporated) (195 | 23.1%), and not-for-profit organizations (89 | 10.5%) make up the most common classes of employment.
| Employer Class | # Employees | % Employees |
| Private Company Employees | 358 | 42.3% |
| Self-Employed (Incorporated) | 65 | 7.7% |
| Self-Employed (Not Incorporated) | 195 | 23.1% |
| Not-for-profit Organizations | 89 | 10.5% |
| Local Government Employees | 79 | 9.3% |
| State Government Employees | 31 | 3.7% |
| Federal Government Employees | 20 | 2.4% |
| Unpaid Family Workers | 9 | 1.1% |
| Total | 846 | 100.0% |
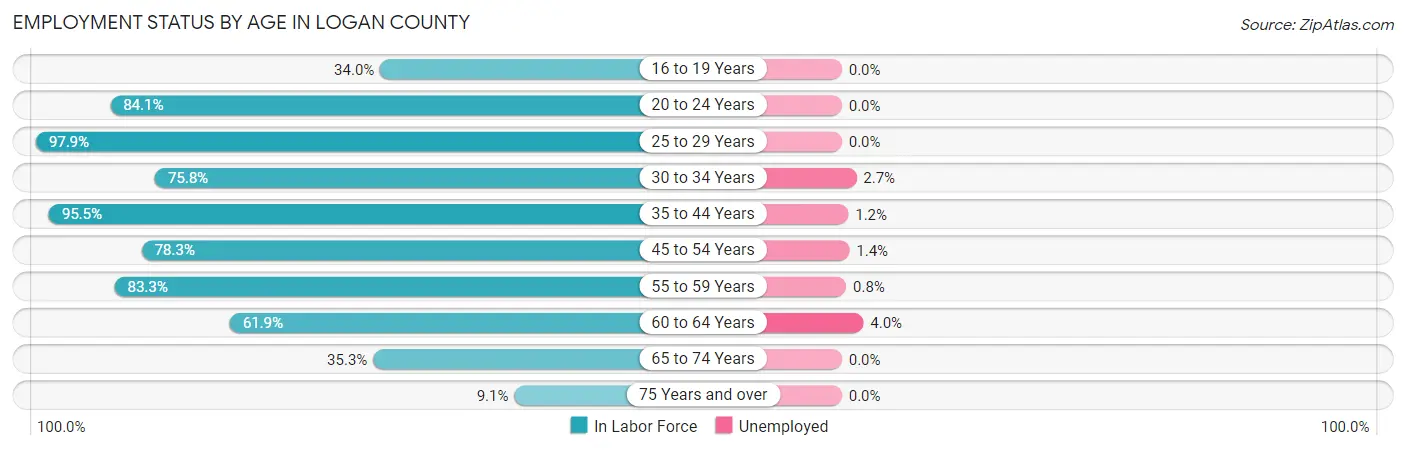
Employment Status by Age in Logan County
According to the labor force statistics for Logan County, out of the total population over 16 years of age (1,504), 57.7% or 868 individuals are in the labor force, with 1.3% or 11 of them unemployed. The age group with the highest labor force participation rate is 25 to 29 years, with 97.9% or 95 individuals in the labor force. Within the labor force, the 60 to 64 years age range has the highest percentage of unemployed individuals, with 4.0% or 4 of them being unemployed.
| Age Bracket | In Labor Force | Unemployed |
| 16 to 19 Years | 34 (34.0%) | 0 (0.0%) |
| 20 to 24 Years | 37 (84.1%) | 0 (0.0%) |
| 25 to 29 Years | 95 (97.9%) | 0 (0.0%) |
| 30 to 34 Years | 75 (75.8%) | 2 (2.7%) |
| 35 to 44 Years | 169 (95.5%) | 2 (1.2%) |
| 45 to 54 Years | 144 (78.3%) | 2 (1.4%) |
| 55 to 59 Years | 120 (83.3%) | 1 (0.8%) |
| 60 to 64 Years | 99 (61.9%) | 4 (4.0%) |
| 65 to 74 Years | 67 (35.3%) | 0 (0.0%) |
| 75 Years and over | 28 (9.1%) | 0 (0.0%) |
| Total | 868 (57.7%) | 11 (1.3%) |
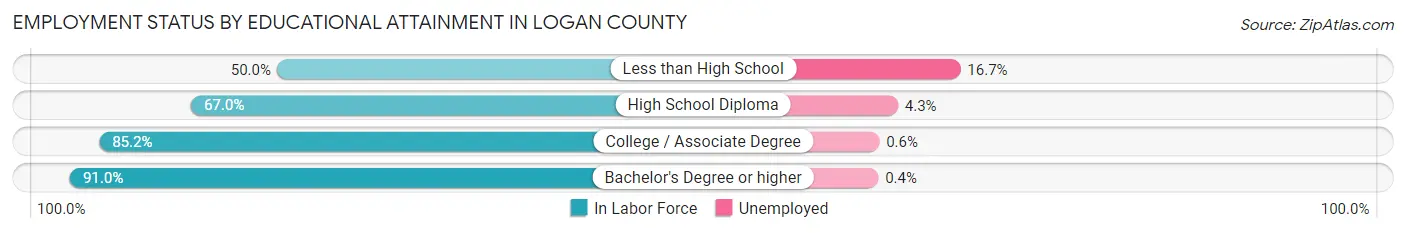
Employment Status by Educational Attainment in Logan County
According to labor force statistics for Logan County, 81.5% of individuals (702) out of the total population between 25 and 64 years of age (861) are in the labor force, with 1.6% or 11 of them being unemployed. The group with the highest labor force participation rate are those with the educational attainment of bachelor's degree or higher, with 91.0% or 233 individuals in the labor force. Within the labor force, individuals with less than high school education have the highest percentage of unemployment, with 16.7% or 2 of them being unemployed.
| Educational Attainment | In Labor Force | Unemployed |
| Less than High School | 12 (50.0%) | 4 (16.7%) |
| High School Diploma | 140 (67.0%) | 9 (4.3%) |
| College / Associate Degree | 317 (85.2%) | 2 (0.6%) |
| Bachelor's Degree or higher | 233 (91.0%) | 1 (0.4%) |
| Total | 702 (81.5%) | 14 (1.6%) |
Employment Occupations by Sex in Logan County
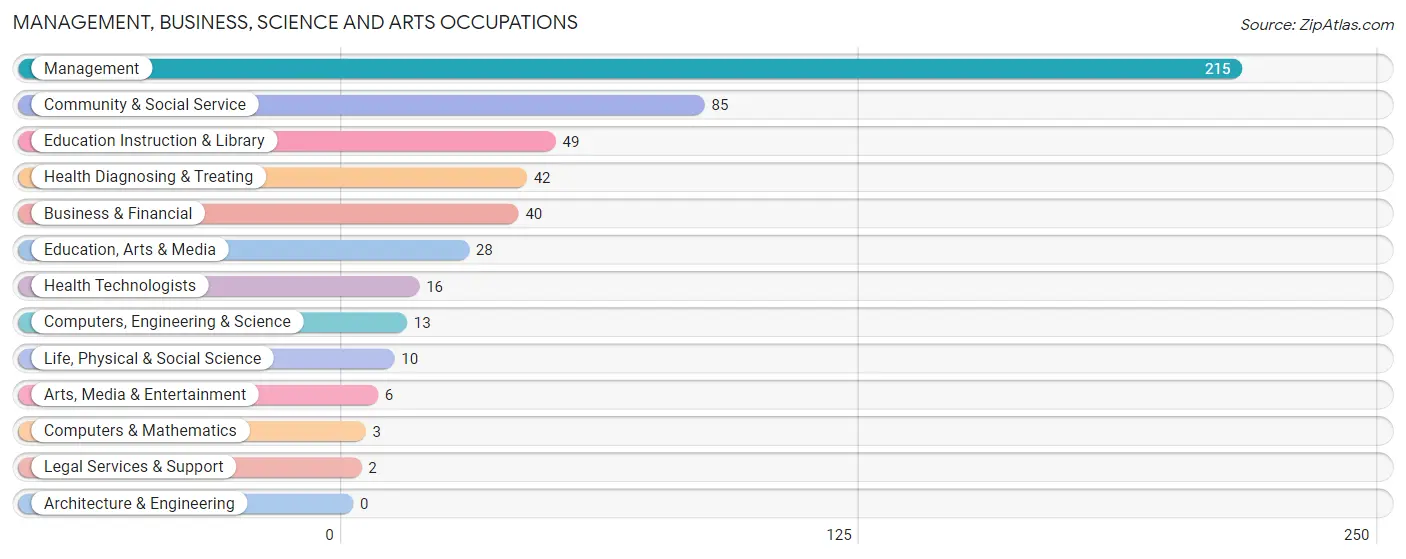
Management, Business, Science and Arts Occupations
The most common Management, Business, Science and Arts occupations in Logan County are Management (215 | 25.1%), Community & Social Service (85 | 9.9%), Education Instruction & Library (49 | 5.7%), Health Diagnosing & Treating (42 | 4.9%), and Business & Financial (40 | 4.7%).
Management, Business, Science and Arts Occupations by Sex
Within the Management, Business, Science and Arts occupations in Logan County, the most male-oriented occupations are Computers & Mathematics (100.0%), Legal Services & Support (100.0%), and Computers, Engineering & Science (84.6%), while the most female-oriented occupations are Arts, Media & Entertainment (100.0%), Health Technologists (93.8%), and Education Instruction & Library (81.6%).
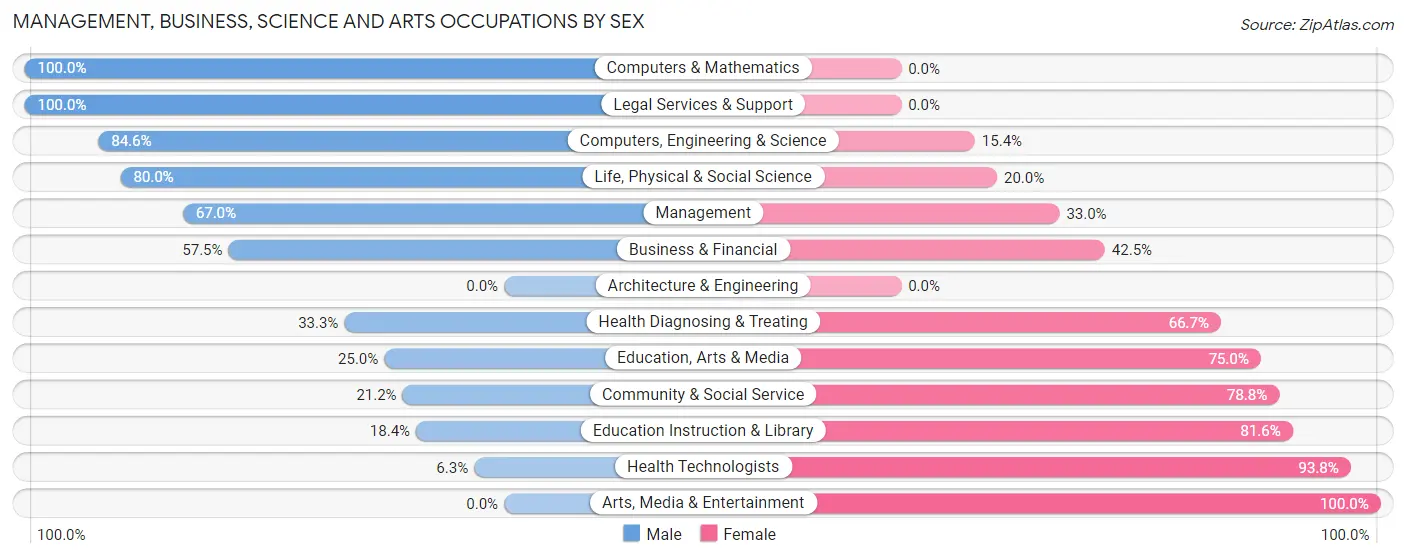
| Occupation | Male | Female |
| Management | 144 (67.0%) | 71 (33.0%) |
| Business & Financial | 23 (57.5%) | 17 (42.5%) |
| Computers, Engineering & Science | 11 (84.6%) | 2 (15.4%) |
| Computers & Mathematics | 3 (100.0%) | 0 (0.0%) |
| Architecture & Engineering | 0 (0.0%) | 0 (0.0%) |
| Life, Physical & Social Science | 8 (80.0%) | 2 (20.0%) |
| Community & Social Service | 18 (21.2%) | 67 (78.8%) |
| Education, Arts & Media | 7 (25.0%) | 21 (75.0%) |
| Legal Services & Support | 2 (100.0%) | 0 (0.0%) |
| Education Instruction & Library | 9 (18.4%) | 40 (81.6%) |
| Arts, Media & Entertainment | 0 (0.0%) | 6 (100.0%) |
| Health Diagnosing & Treating | 14 (33.3%) | 28 (66.7%) |
| Health Technologists | 1 (6.2%) | 15 (93.8%) |
| Total (Category) | 210 (53.2%) | 185 (46.8%) |
| Total (Overall) | 492 (57.4%) | 365 (42.6%) |
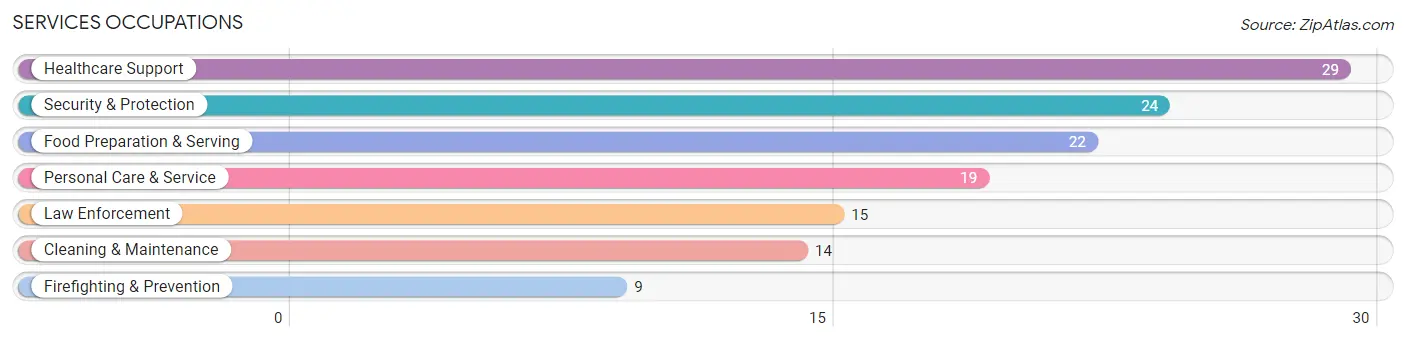
Services Occupations
The most common Services occupations in Logan County are Healthcare Support (29 | 3.4%), Security & Protection (24 | 2.8%), Food Preparation & Serving (22 | 2.6%), Personal Care & Service (19 | 2.2%), and Law Enforcement (15 | 1.8%).
Services Occupations by Sex
Within the Services occupations in Logan County, the most male-oriented occupations are Law Enforcement (93.3%), Security & Protection (70.8%), and Food Preparation & Serving (54.5%), while the most female-oriented occupations are Healthcare Support (100.0%), Personal Care & Service (68.4%), and Firefighting & Prevention (66.7%).
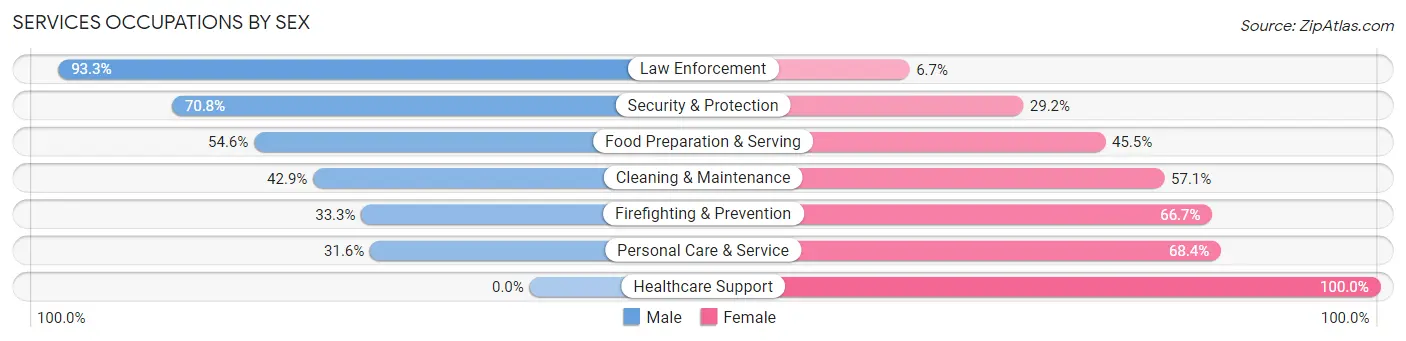
| Occupation | Male | Female |
| Healthcare Support | 0 (0.0%) | 29 (100.0%) |
| Security & Protection | 17 (70.8%) | 7 (29.2%) |
| Firefighting & Prevention | 3 (33.3%) | 6 (66.7%) |
| Law Enforcement | 14 (93.3%) | 1 (6.7%) |
| Food Preparation & Serving | 12 (54.5%) | 10 (45.5%) |
| Cleaning & Maintenance | 6 (42.9%) | 8 (57.1%) |
| Personal Care & Service | 6 (31.6%) | 13 (68.4%) |
| Total (Category) | 41 (38.0%) | 67 (62.0%) |
| Total (Overall) | 492 (57.4%) | 365 (42.6%) |
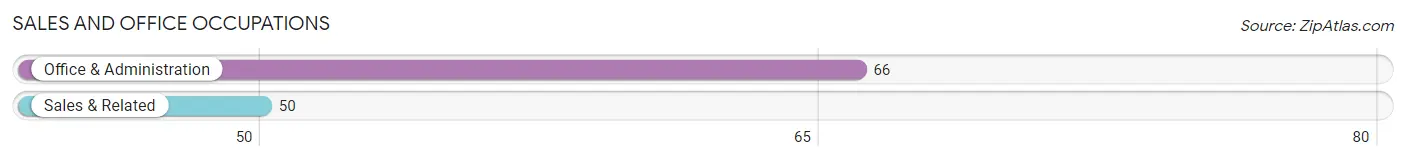
Sales and Office Occupations
The most common Sales and Office occupations in Logan County are Office & Administration (66 | 7.7%), and Sales & Related (50 | 5.8%).
Sales and Office Occupations by Sex
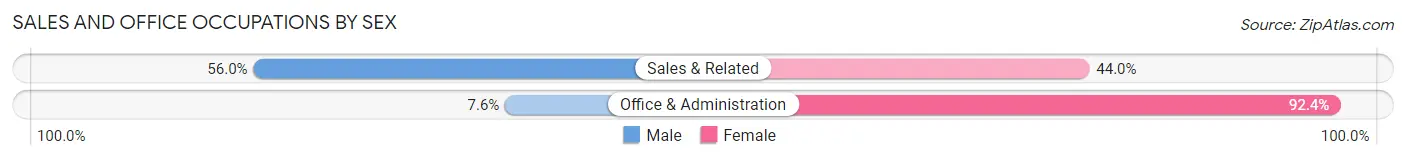
| Occupation | Male | Female |
| Sales & Related | 28 (56.0%) | 22 (44.0%) |
| Office & Administration | 5 (7.6%) | 61 (92.4%) |
| Total (Category) | 33 (28.4%) | 83 (71.6%) |
| Total (Overall) | 492 (57.4%) | 365 (42.6%) |
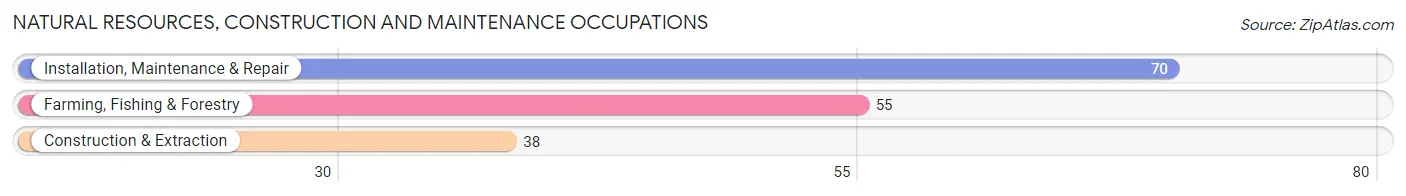
Natural Resources, Construction and Maintenance Occupations
The most common Natural Resources, Construction and Maintenance occupations in Logan County are Installation, Maintenance & Repair (70 | 8.2%), Farming, Fishing & Forestry (55 | 6.4%), and Construction & Extraction (38 | 4.4%).
Natural Resources, Construction and Maintenance Occupations by Sex
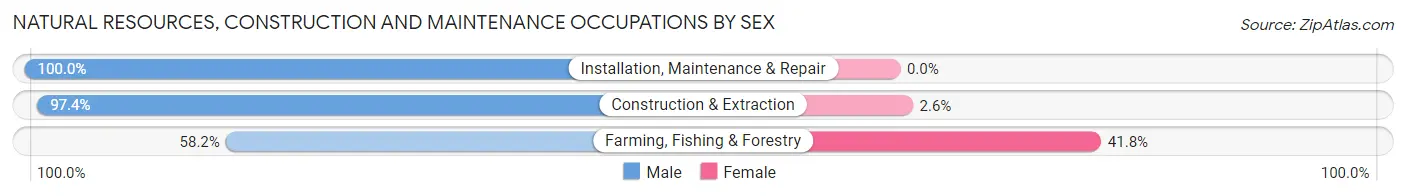
| Occupation | Male | Female |
| Farming, Fishing & Forestry | 32 (58.2%) | 23 (41.8%) |
| Construction & Extraction | 37 (97.4%) | 1 (2.6%) |
| Installation, Maintenance & Repair | 70 (100.0%) | 0 (0.0%) |
| Total (Category) | 139 (85.3%) | 24 (14.7%) |
| Total (Overall) | 492 (57.4%) | 365 (42.6%) |
Production, Transportation and Moving Occupations
The most common Production, Transportation and Moving occupations in Logan County are Transportation (37 | 4.3%), Production (27 | 3.2%), and Material Moving (11 | 1.3%).
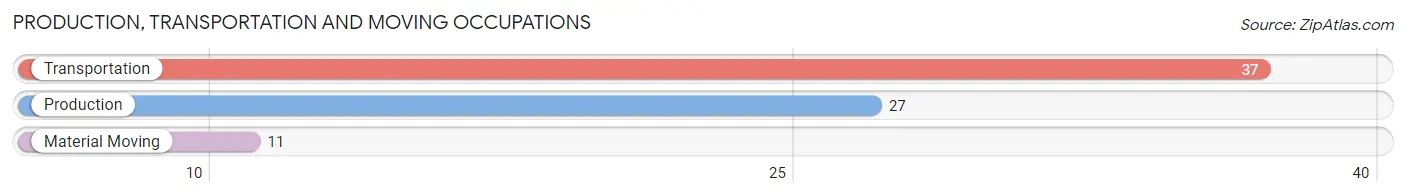
Production, Transportation and Moving Occupations by Sex
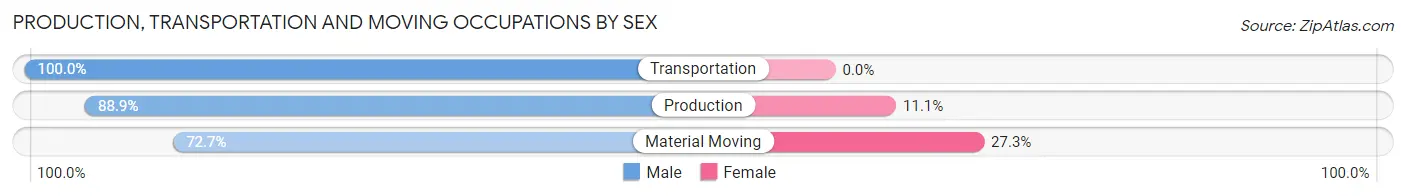
| Occupation | Male | Female |
| Production | 24 (88.9%) | 3 (11.1%) |
| Transportation | 37 (100.0%) | 0 (0.0%) |
| Material Moving | 8 (72.7%) | 3 (27.3%) |
| Total (Category) | 69 (92.0%) | 6 (8.0%) |
| Total (Overall) | 492 (57.4%) | 365 (42.6%) |
Employment Industries by Sex in Logan County
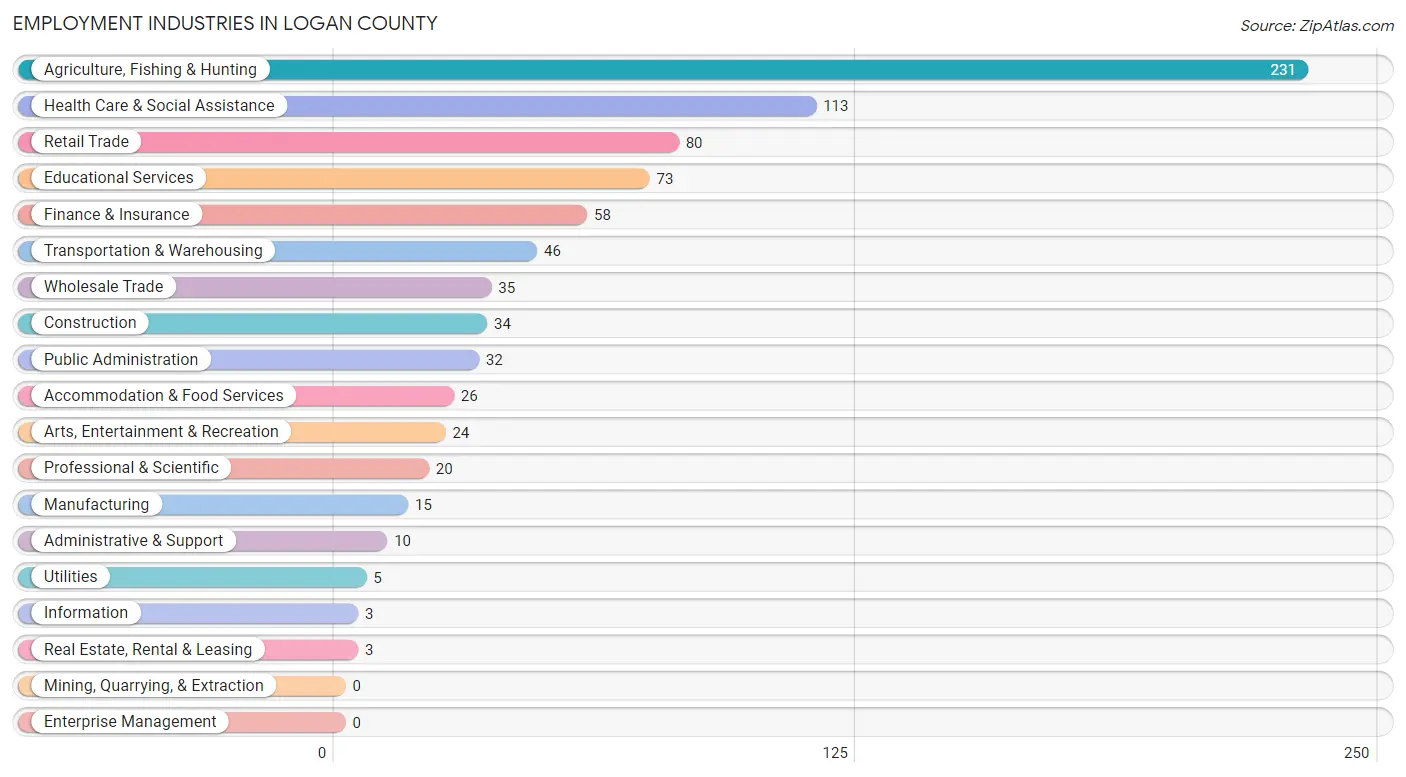
Employment Industries in Logan County
The major employment industries in Logan County include Agriculture, Fishing & Hunting (231 | 27.0%), Health Care & Social Assistance (113 | 13.2%), Retail Trade (80 | 9.3%), Educational Services (73 | 8.5%), and Finance & Insurance (58 | 6.8%).
Employment Industries by Sex in Logan County
The Logan County industries that see more men than women are Utilities (100.0%), Real Estate, Rental & Leasing (100.0%), and Administrative & Support (100.0%), whereas the industries that tend to have a higher number of women are Information (100.0%), Health Care & Social Assistance (84.1%), and Educational Services (74.0%).
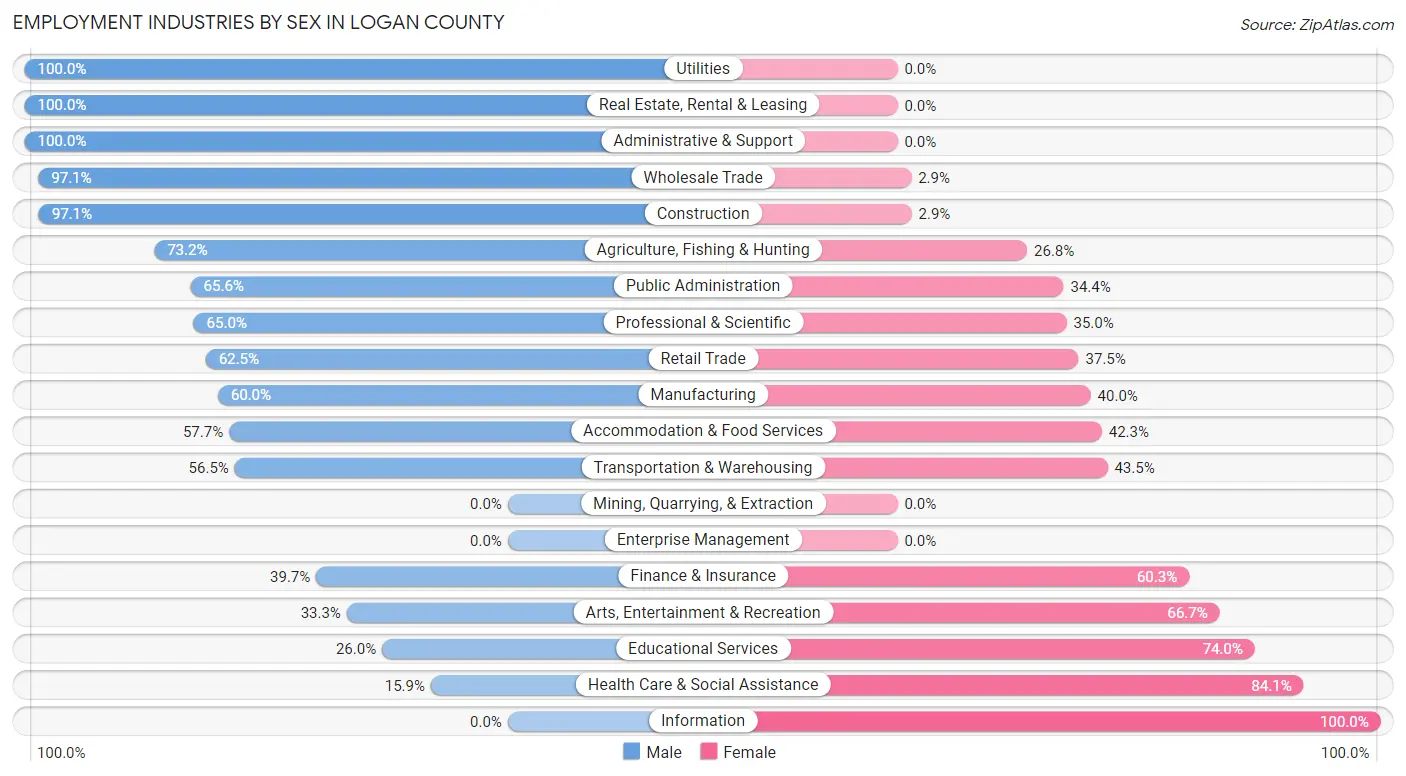
| Industry | Male | Female |
| Agriculture, Fishing & Hunting | 169 (73.2%) | 62 (26.8%) |
| Mining, Quarrying, & Extraction | 0 (0.0%) | 0 (0.0%) |
| Construction | 33 (97.1%) | 1 (2.9%) |
| Manufacturing | 9 (60.0%) | 6 (40.0%) |
| Wholesale Trade | 34 (97.1%) | 1 (2.9%) |
| Retail Trade | 50 (62.5%) | 30 (37.5%) |
| Transportation & Warehousing | 26 (56.5%) | 20 (43.5%) |
| Utilities | 5 (100.0%) | 0 (0.0%) |
| Information | 0 (0.0%) | 3 (100.0%) |
| Finance & Insurance | 23 (39.7%) | 35 (60.3%) |
| Real Estate, Rental & Leasing | 3 (100.0%) | 0 (0.0%) |
| Professional & Scientific | 13 (65.0%) | 7 (35.0%) |
| Enterprise Management | 0 (0.0%) | 0 (0.0%) |
| Administrative & Support | 10 (100.0%) | 0 (0.0%) |
| Educational Services | 19 (26.0%) | 54 (74.0%) |
| Health Care & Social Assistance | 18 (15.9%) | 95 (84.1%) |
| Arts, Entertainment & Recreation | 8 (33.3%) | 16 (66.7%) |
| Accommodation & Food Services | 15 (57.7%) | 11 (42.3%) |
| Public Administration | 21 (65.6%) | 11 (34.4%) |
| Total | 492 (57.4%) | 365 (42.6%) |
Education in Logan County
School Enrollment in Logan County
The most common levels of schooling among the 334 students in Logan County are high school (109 | 32.6%), middle school (98 | 29.3%), and elementary school (64 | 19.2%).
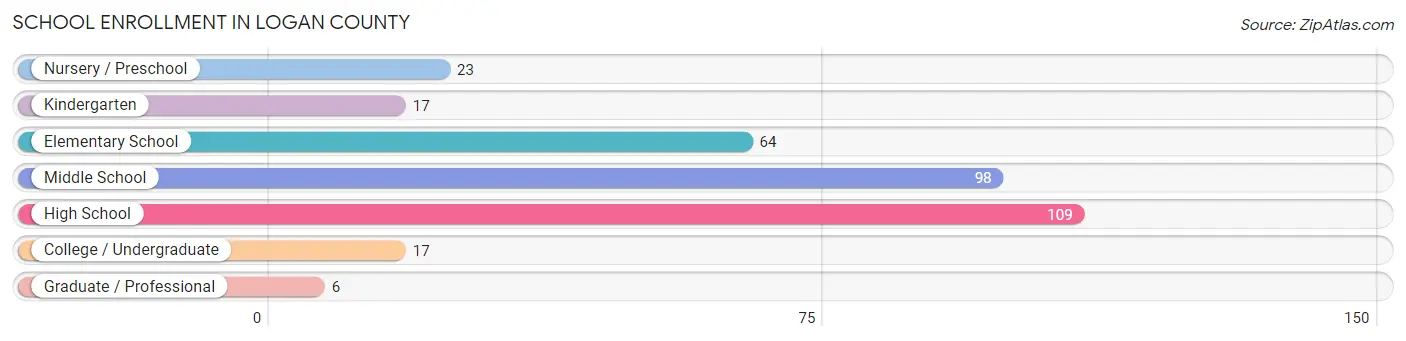
| School Level | # Students | % Students |
| Nursery / Preschool | 23 | 6.9% |
| Kindergarten | 17 | 5.1% |
| Elementary School | 64 | 19.2% |
| Middle School | 98 | 29.3% |
| High School | 109 | 32.6% |
| College / Undergraduate | 17 | 5.1% |
| Graduate / Professional | 6 | 1.8% |
| Total | 334 | 100.0% |
School Enrollment by Age by Funding Source in Logan County
Out of a total of 334 students who are enrolled in schools in Logan County, 12 (3.6%) attend a private institution, while the remaining 322 (96.4%) are enrolled in public schools. The age group of 3 to 4 year olds has the highest likelihood of being enrolled in private schools, with 2 (28.6% in the age bracket) enrolled. Conversely, the age group of 15 to 17 year olds has the lowest likelihood of being enrolled in a private school, with 95 (100.0% in the age bracket) attending a public institution.
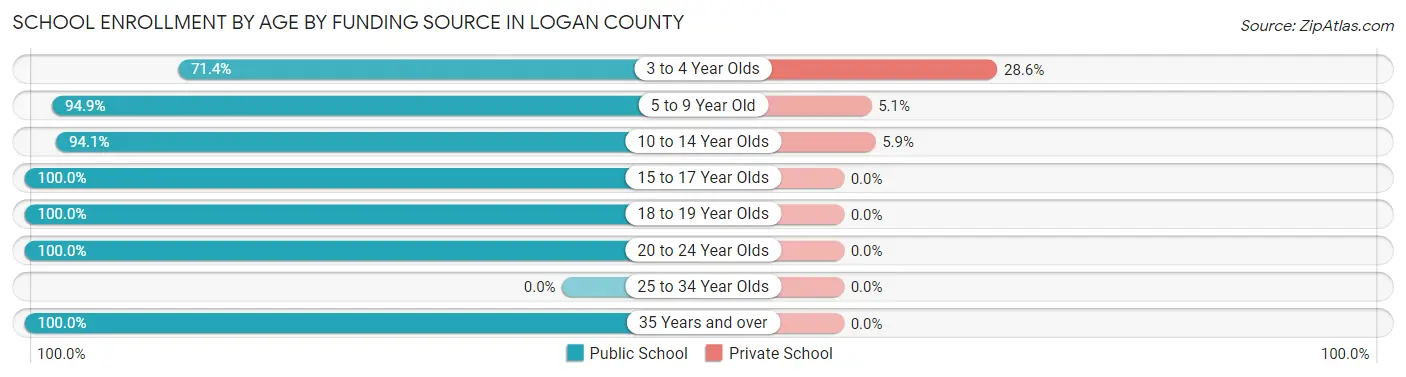
| Age Bracket | Public School | Private School |
| 3 to 4 Year Olds | 5 (71.4%) | 2 (28.6%) |
| 5 to 9 Year Old | 74 (94.9%) | 4 (5.1%) |
| 10 to 14 Year Olds | 96 (94.1%) | 6 (5.9%) |
| 15 to 17 Year Olds | 95 (100.0%) | 0 (0.0%) |
| 18 to 19 Year Olds | 32 (100.0%) | 0 (0.0%) |
| 20 to 24 Year Olds | 3 (100.0%) | 0 (0.0%) |
| 25 to 34 Year Olds | 0 (0.0%) | 0 (0.0%) |
| 35 Years and over | 17 (100.0%) | 0 (0.0%) |
| Total | 322 (96.4%) | 12 (3.6%) |
Educational Attainment by Field of Study in Logan County
Education (77 | 22.1%), business (55 | 15.8%), science & technology (53 | 15.2%), bio, nature & agricultural (51 | 14.7%), and social sciences (23 | 6.6%) are the most common fields of study among 348 individuals in Logan County who have obtained a bachelor's degree or higher.
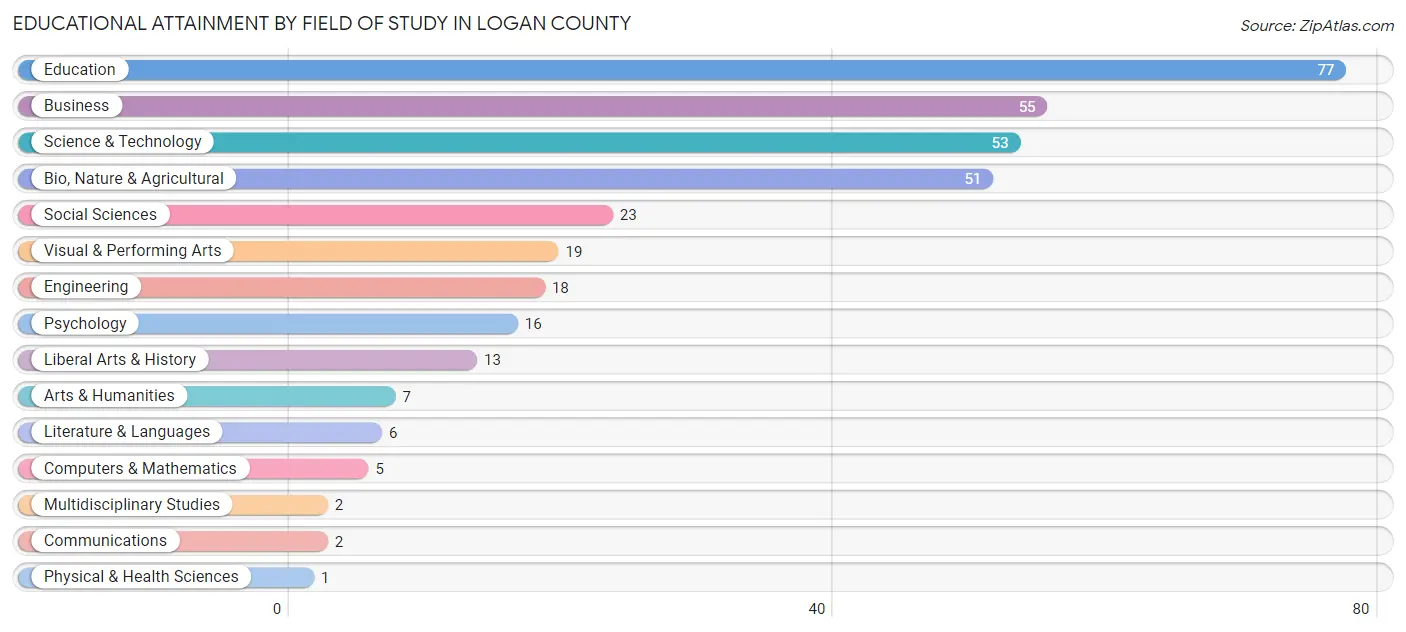
| Field of Study | # Graduates | % Graduates |
| Computers & Mathematics | 5 | 1.4% |
| Bio, Nature & Agricultural | 51 | 14.7% |
| Physical & Health Sciences | 1 | 0.3% |
| Psychology | 16 | 4.6% |
| Social Sciences | 23 | 6.6% |
| Engineering | 18 | 5.2% |
| Multidisciplinary Studies | 2 | 0.6% |
| Science & Technology | 53 | 15.2% |
| Business | 55 | 15.8% |
| Education | 77 | 22.1% |
| Literature & Languages | 6 | 1.7% |
| Liberal Arts & History | 13 | 3.7% |
| Visual & Performing Arts | 19 | 5.5% |
| Communications | 2 | 0.6% |
| Arts & Humanities | 7 | 2.0% |
| Total | 348 | 100.0% |
Transportation & Commute in Logan County
Vehicle Availability by Sex in Logan County
The most prevalent vehicle ownership categories in Logan County are males with 2 vehicles (175, accounting for 36.3%) and females with 2 vehicles (121, making up 48.5%).
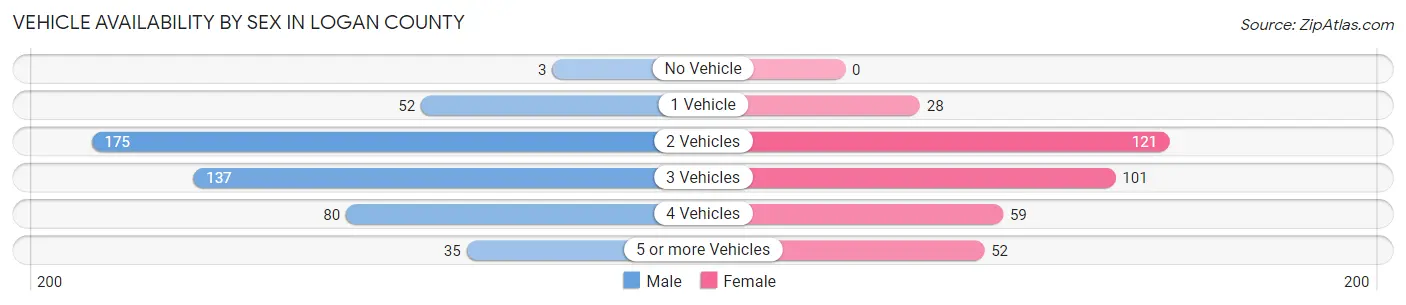
| Vehicles Available | Male | Female |
| No Vehicle | 3 (0.6%) | 0 (0.0%) |
| 1 Vehicle | 52 (10.8%) | 28 (7.8%) |
| 2 Vehicles | 175 (36.3%) | 121 (33.5%) |
| 3 Vehicles | 137 (28.4%) | 101 (28.0%) |
| 4 Vehicles | 80 (16.6%) | 59 (16.3%) |
| 5 or more Vehicles | 35 (7.3%) | 52 (14.4%) |
| Total | 482 (100.0%) | 361 (100.0%) |
Commute Time in Logan County
The most frequently occuring commute durations in Logan County are less than 5 minutes (221 commuters, 31.1%), 5 to 9 minutes (210 commuters, 29.5%), and 30 to 34 minutes (60 commuters, 8.4%).
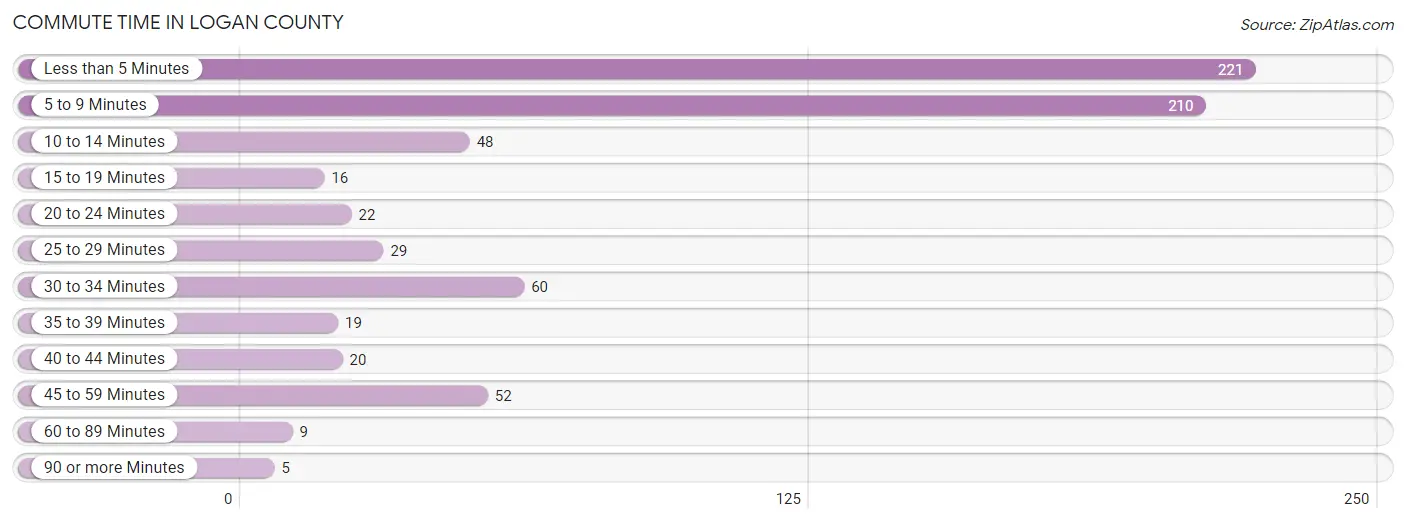
| Commute Time | # Commuters | % Commuters |
| Less than 5 Minutes | 221 | 31.1% |
| 5 to 9 Minutes | 210 | 29.5% |
| 10 to 14 Minutes | 48 | 6.8% |
| 15 to 19 Minutes | 16 | 2.2% |
| 20 to 24 Minutes | 22 | 3.1% |
| 25 to 29 Minutes | 29 | 4.1% |
| 30 to 34 Minutes | 60 | 8.4% |
| 35 to 39 Minutes | 19 | 2.7% |
| 40 to 44 Minutes | 20 | 2.8% |
| 45 to 59 Minutes | 52 | 7.3% |
| 60 to 89 Minutes | 9 | 1.3% |
| 90 or more Minutes | 5 | 0.7% |
Commute Time by Sex in Logan County
The most common commute times in Logan County are 5 to 9 minutes (138 commuters, 34.0%) for males and less than 5 minutes (99 commuters, 32.5%) for females.
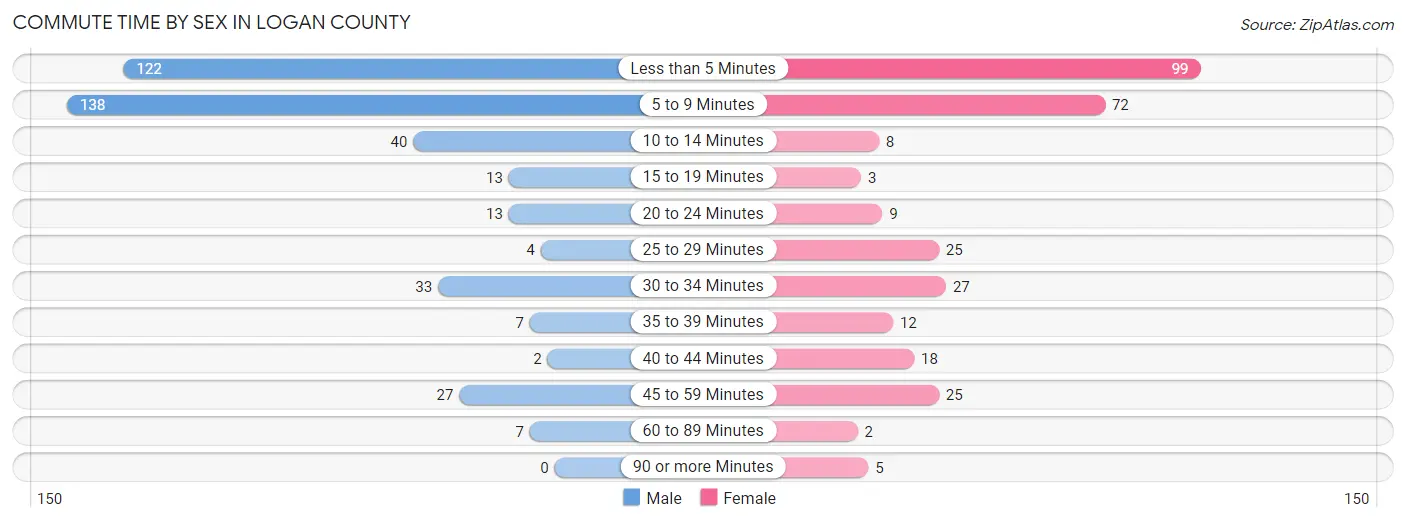
| Commute Time | Male | Female |
| Less than 5 Minutes | 122 (30.0%) | 99 (32.5%) |
| 5 to 9 Minutes | 138 (34.0%) | 72 (23.6%) |
| 10 to 14 Minutes | 40 (9.9%) | 8 (2.6%) |
| 15 to 19 Minutes | 13 (3.2%) | 3 (1.0%) |
| 20 to 24 Minutes | 13 (3.2%) | 9 (2.9%) |
| 25 to 29 Minutes | 4 (1.0%) | 25 (8.2%) |
| 30 to 34 Minutes | 33 (8.1%) | 27 (8.8%) |
| 35 to 39 Minutes | 7 (1.7%) | 12 (3.9%) |
| 40 to 44 Minutes | 2 (0.5%) | 18 (5.9%) |
| 45 to 59 Minutes | 27 (6.7%) | 25 (8.2%) |
| 60 to 89 Minutes | 7 (1.7%) | 2 (0.7%) |
| 90 or more Minutes | 0 (0.0%) | 5 (1.6%) |
Time of Departure to Work by Sex in Logan County
The most frequent times of departure to work in Logan County are 8:00 AM to 8:29 AM (105, 25.9%) for males and 7:30 AM to 7:59 AM (65, 21.3%) for females.
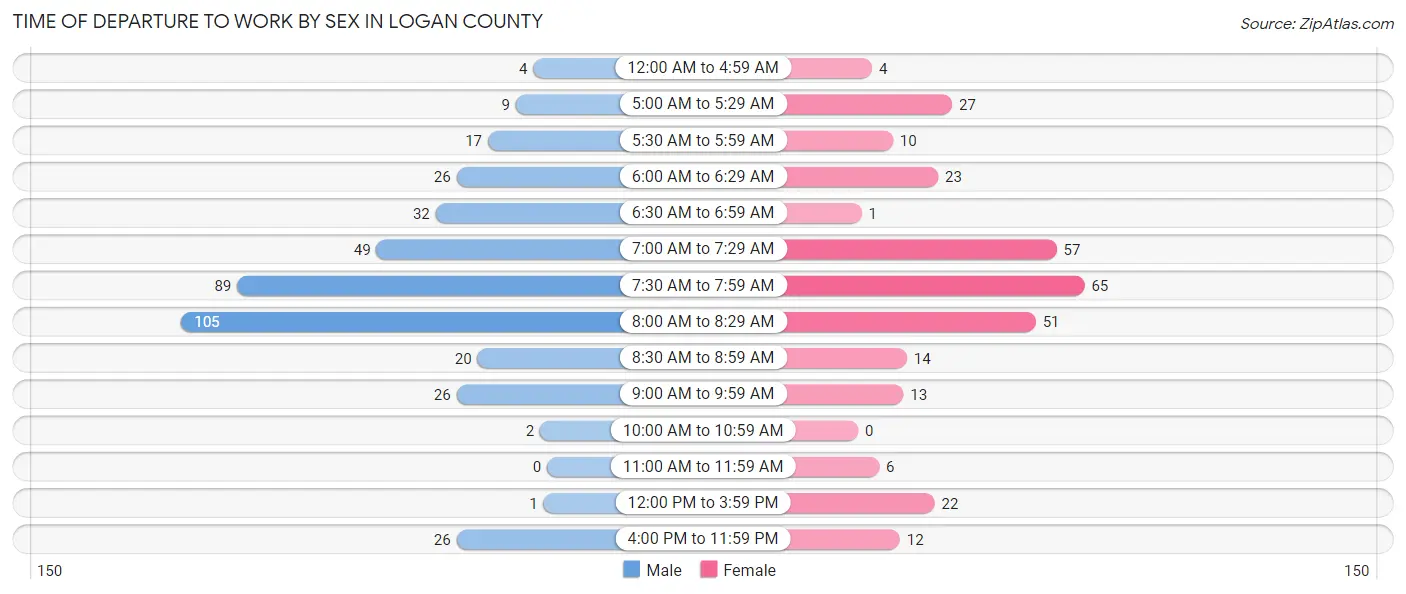
| Time of Departure | Male | Female |
| 12:00 AM to 4:59 AM | 4 (1.0%) | 4 (1.3%) |
| 5:00 AM to 5:29 AM | 9 (2.2%) | 27 (8.8%) |
| 5:30 AM to 5:59 AM | 17 (4.2%) | 10 (3.3%) |
| 6:00 AM to 6:29 AM | 26 (6.4%) | 23 (7.5%) |
| 6:30 AM to 6:59 AM | 32 (7.9%) | 1 (0.3%) |
| 7:00 AM to 7:29 AM | 49 (12.1%) | 57 (18.7%) |
| 7:30 AM to 7:59 AM | 89 (21.9%) | 65 (21.3%) |
| 8:00 AM to 8:29 AM | 105 (25.9%) | 51 (16.7%) |
| 8:30 AM to 8:59 AM | 20 (4.9%) | 14 (4.6%) |
| 9:00 AM to 9:59 AM | 26 (6.4%) | 13 (4.3%) |
| 10:00 AM to 10:59 AM | 2 (0.5%) | 0 (0.0%) |
| 11:00 AM to 11:59 AM | 0 (0.0%) | 6 (2.0%) |
| 12:00 PM to 3:59 PM | 1 (0.3%) | 22 (7.2%) |
| 4:00 PM to 11:59 PM | 26 (6.4%) | 12 (3.9%) |
| Total | 406 (100.0%) | 305 (100.0%) |
Housing Occupancy in Logan County
Occupancy by Ownership in Logan County
Of the total 770 dwellings in Logan County, owner-occupied units account for 640 (83.1%), while renter-occupied units make up 130 (16.9%).
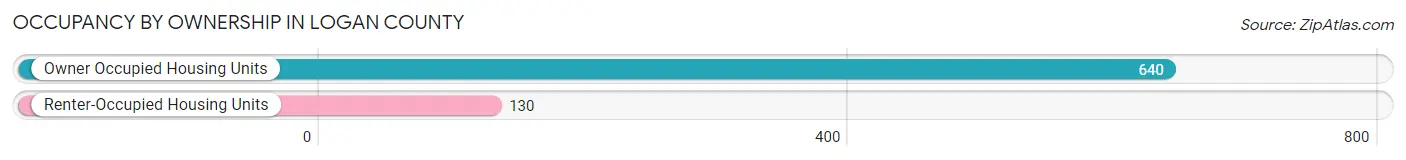
| Occupancy | # Housing Units | % Housing Units |
| Owner Occupied Housing Units | 640 | 83.1% |
| Renter-Occupied Housing Units | 130 | 16.9% |
| Total Occupied Housing Units | 770 | 100.0% |
Occupancy by Household Size in Logan County
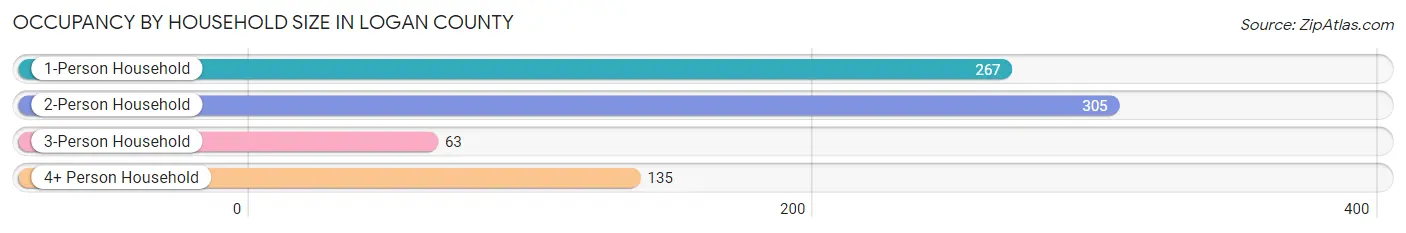
| Household Size | # Housing Units | % Housing Units |
| 1-Person Household | 267 | 34.7% |
| 2-Person Household | 305 | 39.6% |
| 3-Person Household | 63 | 8.2% |
| 4+ Person Household | 135 | 17.5% |
| Total Housing Units | 770 | 100.0% |
Occupancy by Ownership by Household Size in Logan County
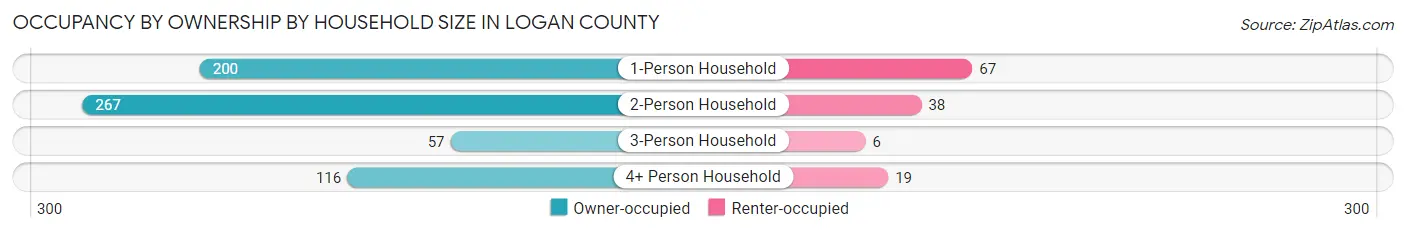
| Household Size | Owner-occupied | Renter-occupied |
| 1-Person Household | 200 (74.9%) | 67 (25.1%) |
| 2-Person Household | 267 (87.5%) | 38 (12.5%) |
| 3-Person Household | 57 (90.5%) | 6 (9.5%) |
| 4+ Person Household | 116 (85.9%) | 19 (14.1%) |
| Total Housing Units | 640 (83.1%) | 130 (16.9%) |
Occupancy by Educational Attainment in Logan County
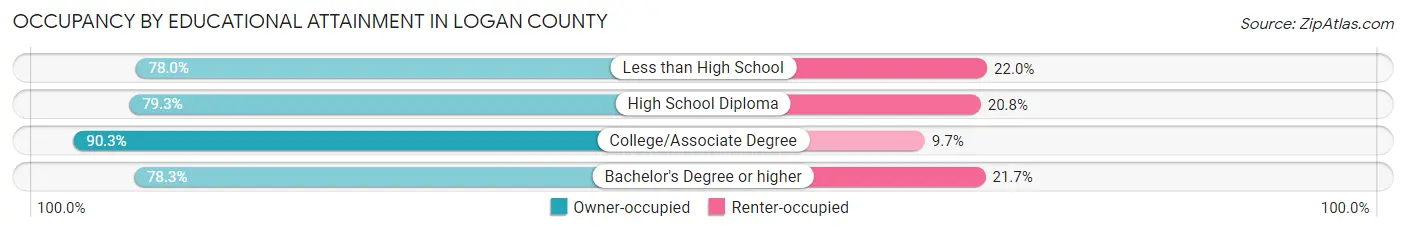
| Household Size | Owner-occupied | Renter-occupied |
| Less than High School | 39 (78.0%) | 11 (22.0%) |
| High School Diploma | 191 (79.2%) | 50 (20.7%) |
| College/Associate Degree | 262 (90.3%) | 28 (9.7%) |
| Bachelor's Degree or higher | 148 (78.3%) | 41 (21.7%) |
Occupancy by Age of Householder in Logan County
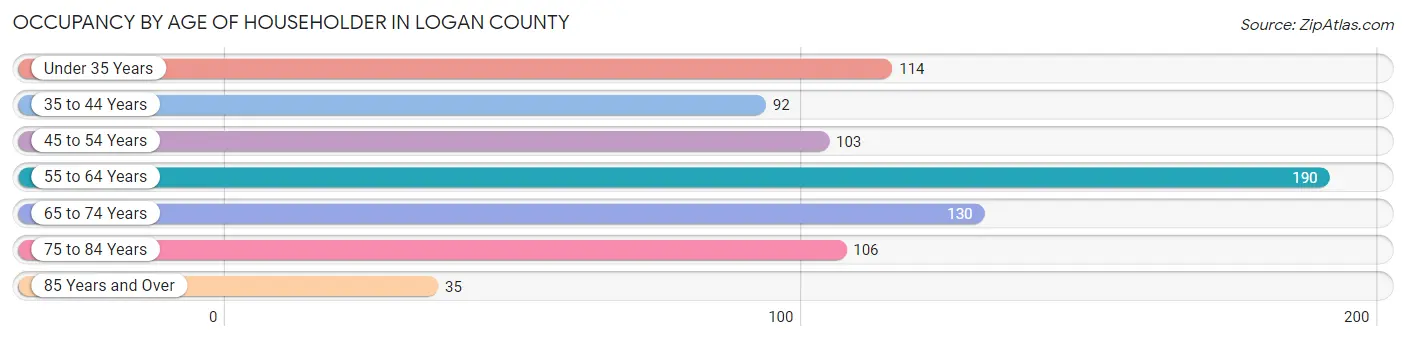
| Age Bracket | # Households | % Households |
| Under 35 Years | 114 | 14.8% |
| 35 to 44 Years | 92 | 11.9% |
| 45 to 54 Years | 103 | 13.4% |
| 55 to 64 Years | 190 | 24.7% |
| 65 to 74 Years | 130 | 16.9% |
| 75 to 84 Years | 106 | 13.8% |
| 85 Years and Over | 35 | 4.5% |
| Total | 770 | 100.0% |
Housing Finances in Logan County
Median Income by Occupancy in Logan County
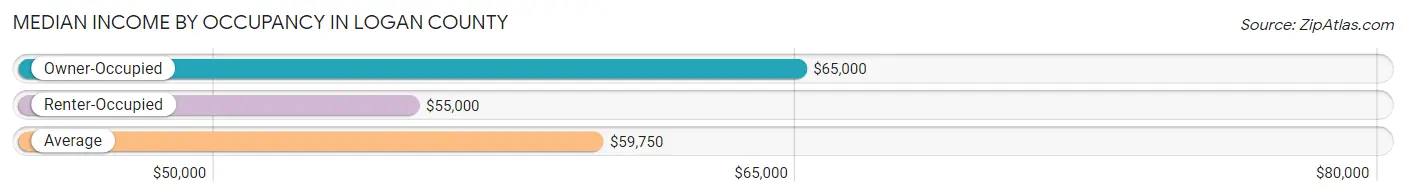
| Occupancy Type | # Households | Median Income |
| Owner-Occupied | 640 (83.1%) | $65,000 |
| Renter-Occupied | 130 (16.9%) | $55,000 |
| Average | 770 (100.0%) | $59,750 |
Occupancy by Householder Income Bracket in Logan County
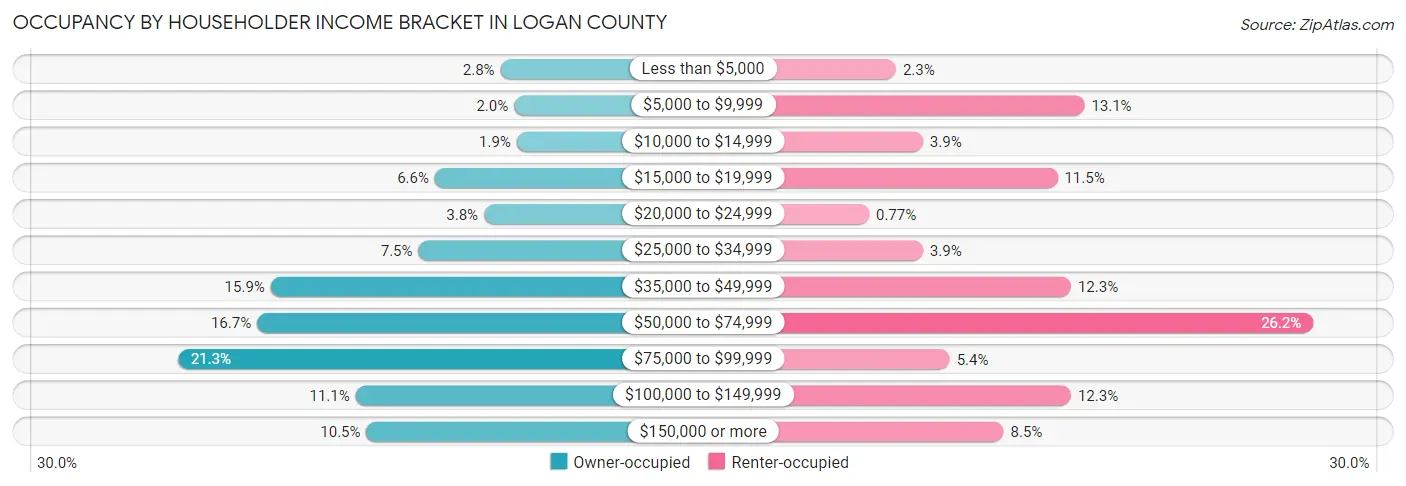
| Income Bracket | Owner-occupied | Renter-occupied |
| Less than $5,000 | 18 (2.8%) | 3 (2.3%) |
| $5,000 to $9,999 | 13 (2.0%) | 17 (13.1%) |
| $10,000 to $14,999 | 12 (1.9%) | 5 (3.8%) |
| $15,000 to $19,999 | 42 (6.6%) | 15 (11.5%) |
| $20,000 to $24,999 | 24 (3.7%) | 1 (0.8%) |
| $25,000 to $34,999 | 48 (7.5%) | 5 (3.8%) |
| $35,000 to $49,999 | 102 (15.9%) | 16 (12.3%) |
| $50,000 to $74,999 | 107 (16.7%) | 34 (26.2%) |
| $75,000 to $99,999 | 136 (21.2%) | 7 (5.4%) |
| $100,000 to $149,999 | 71 (11.1%) | 16 (12.3%) |
| $150,000 or more | 67 (10.5%) | 11 (8.5%) |
| Total | 640 (100.0%) | 130 (100.0%) |
Monthly Housing Cost Tiers in Logan County
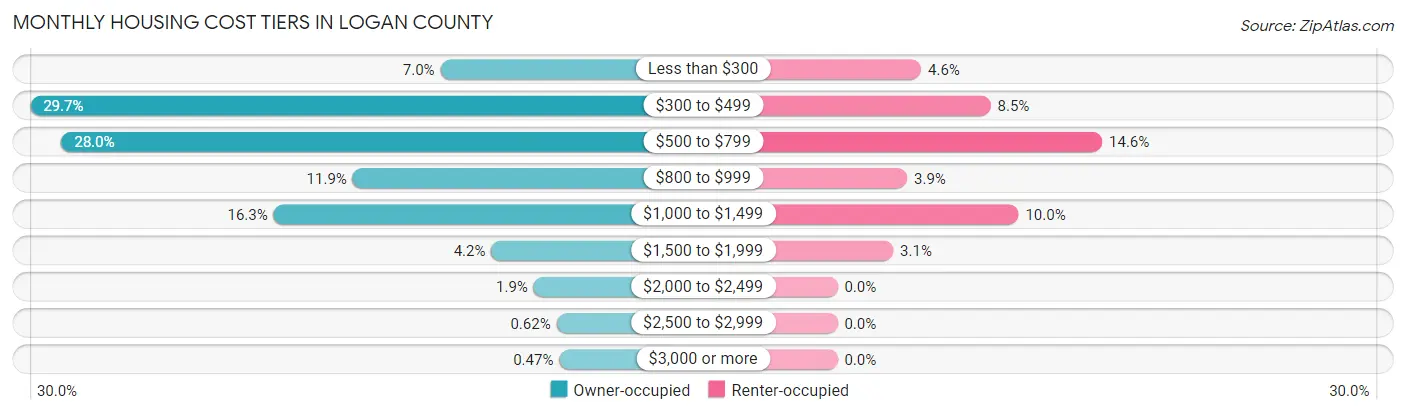
| Monthly Cost | Owner-occupied | Renter-occupied |
| Less than $300 | 45 (7.0%) | 6 (4.6%) |
| $300 to $499 | 190 (29.7%) | 11 (8.5%) |
| $500 to $799 | 179 (28.0%) | 19 (14.6%) |
| $800 to $999 | 76 (11.9%) | 5 (3.8%) |
| $1,000 to $1,499 | 104 (16.3%) | 13 (10.0%) |
| $1,500 to $1,999 | 27 (4.2%) | 4 (3.1%) |
| $2,000 to $2,499 | 12 (1.9%) | 0 (0.0%) |
| $2,500 to $2,999 | 4 (0.6%) | 0 (0.0%) |
| $3,000 or more | 3 (0.5%) | 0 (0.0%) |
| Total | 640 (100.0%) | 130 (100.0%) |
Physical Housing Characteristics in Logan County
Housing Structures in Logan County
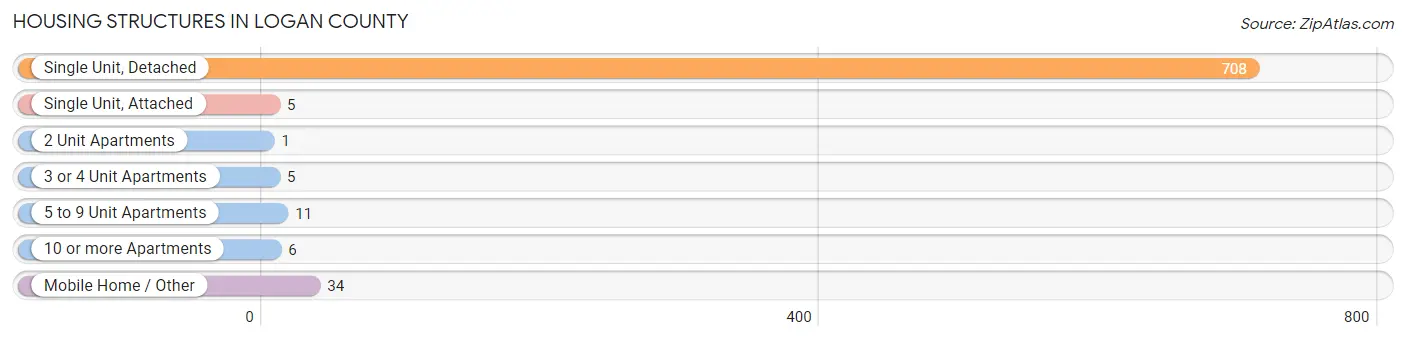
| Structure Type | # Housing Units | % Housing Units |
| Single Unit, Detached | 708 | 91.9% |
| Single Unit, Attached | 5 | 0.6% |
| 2 Unit Apartments | 1 | 0.1% |
| 3 or 4 Unit Apartments | 5 | 0.6% |
| 5 to 9 Unit Apartments | 11 | 1.4% |
| 10 or more Apartments | 6 | 0.8% |
| Mobile Home / Other | 34 | 4.4% |
| Total | 770 | 100.0% |
Housing Structures by Occupancy in Logan County
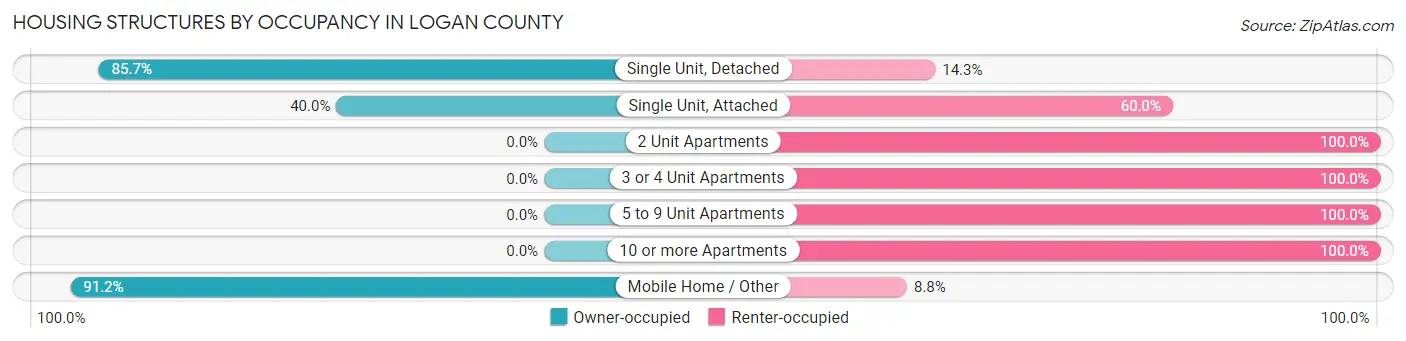
| Structure Type | Owner-occupied | Renter-occupied |
| Single Unit, Detached | 607 (85.7%) | 101 (14.3%) |
| Single Unit, Attached | 2 (40.0%) | 3 (60.0%) |
| 2 Unit Apartments | 0 (0.0%) | 1 (100.0%) |
| 3 or 4 Unit Apartments | 0 (0.0%) | 5 (100.0%) |
| 5 to 9 Unit Apartments | 0 (0.0%) | 11 (100.0%) |
| 10 or more Apartments | 0 (0.0%) | 6 (100.0%) |
| Mobile Home / Other | 31 (91.2%) | 3 (8.8%) |
| Total | 640 (83.1%) | 130 (16.9%) |
Housing Structures by Number of Rooms in Logan County
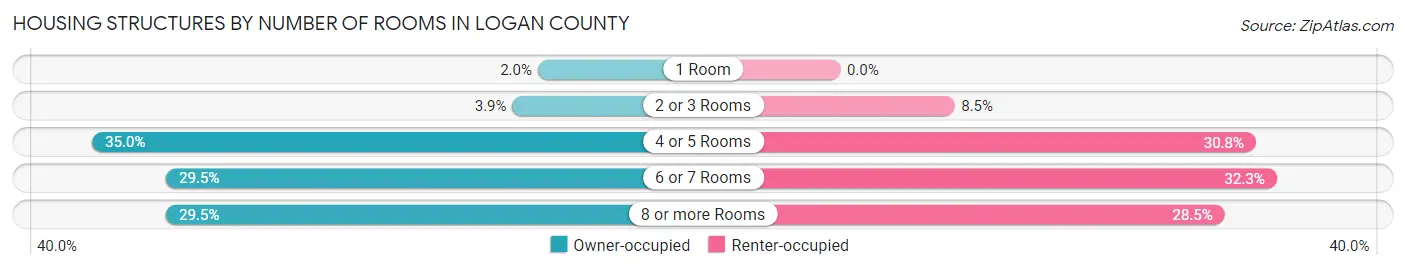
| Number of Rooms | Owner-occupied | Renter-occupied |
| 1 Room | 13 (2.0%) | 0 (0.0%) |
| 2 or 3 Rooms | 25 (3.9%) | 11 (8.5%) |
| 4 or 5 Rooms | 224 (35.0%) | 40 (30.8%) |
| 6 or 7 Rooms | 189 (29.5%) | 42 (32.3%) |
| 8 or more Rooms | 189 (29.5%) | 37 (28.5%) |
| Total | 640 (100.0%) | 130 (100.0%) |
Housing Structure by Heating Type in Logan County
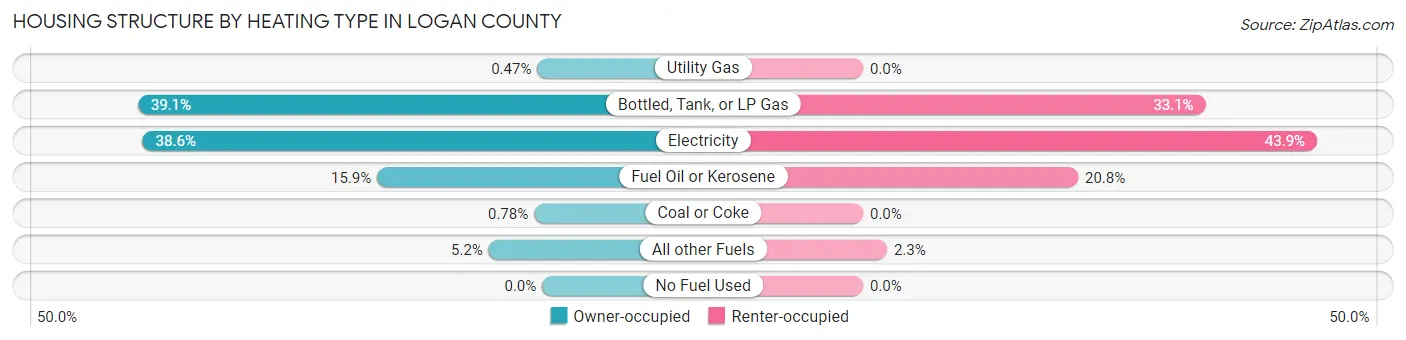
| Heating Type | Owner-occupied | Renter-occupied |
| Utility Gas | 3 (0.5%) | 0 (0.0%) |
| Bottled, Tank, or LP Gas | 250 (39.1%) | 43 (33.1%) |
| Electricity | 247 (38.6%) | 57 (43.9%) |
| Fuel Oil or Kerosene | 102 (15.9%) | 27 (20.8%) |
| Coal or Coke | 5 (0.8%) | 0 (0.0%) |
| All other Fuels | 33 (5.2%) | 3 (2.3%) |
| No Fuel Used | 0 (0.0%) | 0 (0.0%) |
| Total | 640 (100.0%) | 130 (100.0%) |
Household Vehicle Usage in Logan County
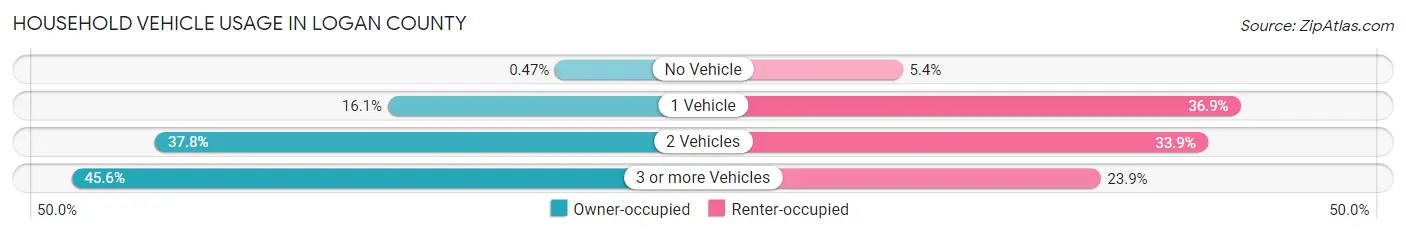
| Vehicles per Household | Owner-occupied | Renter-occupied |
| No Vehicle | 3 (0.5%) | 7 (5.4%) |
| 1 Vehicle | 103 (16.1%) | 48 (36.9%) |
| 2 Vehicles | 242 (37.8%) | 44 (33.9%) |
| 3 or more Vehicles | 292 (45.6%) | 31 (23.8%) |
| Total | 640 (100.0%) | 130 (100.0%) |
Real Estate & Mortgages in Logan County
Real Estate and Mortgage Overview in Logan County
| Characteristic | Without Mortgage | With Mortgage |
| Housing Units | 435 | 205 |
| Median Property Value | $95,200 | $89,800 |
| Median Household Income | $53,942 | $33 |
| Monthly Housing Costs | $485 | $3 |
| Real Estate Taxes | $936 | $1 |
Property Value by Mortgage Status in Logan County
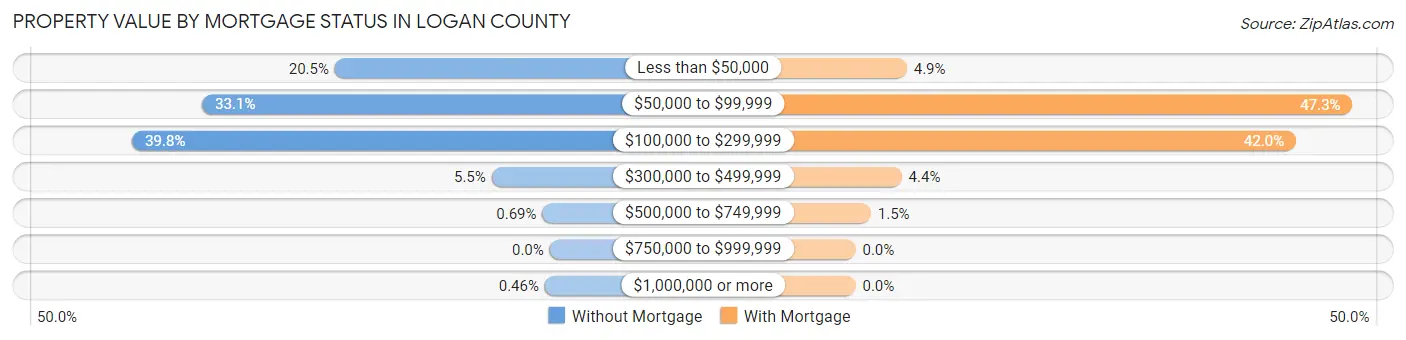
| Property Value | Without Mortgage | With Mortgage |
| Less than $50,000 | 89 (20.5%) | 10 (4.9%) |
| $50,000 to $99,999 | 144 (33.1%) | 97 (47.3%) |
| $100,000 to $299,999 | 173 (39.8%) | 86 (41.9%) |
| $300,000 to $499,999 | 24 (5.5%) | 9 (4.4%) |
| $500,000 to $749,999 | 3 (0.7%) | 3 (1.5%) |
| $750,000 to $999,999 | 0 (0.0%) | 0 (0.0%) |
| $1,000,000 or more | 2 (0.5%) | 0 (0.0%) |
| Total | 435 (100.0%) | 205 (100.0%) |
Household Income by Mortgage Status in Logan County
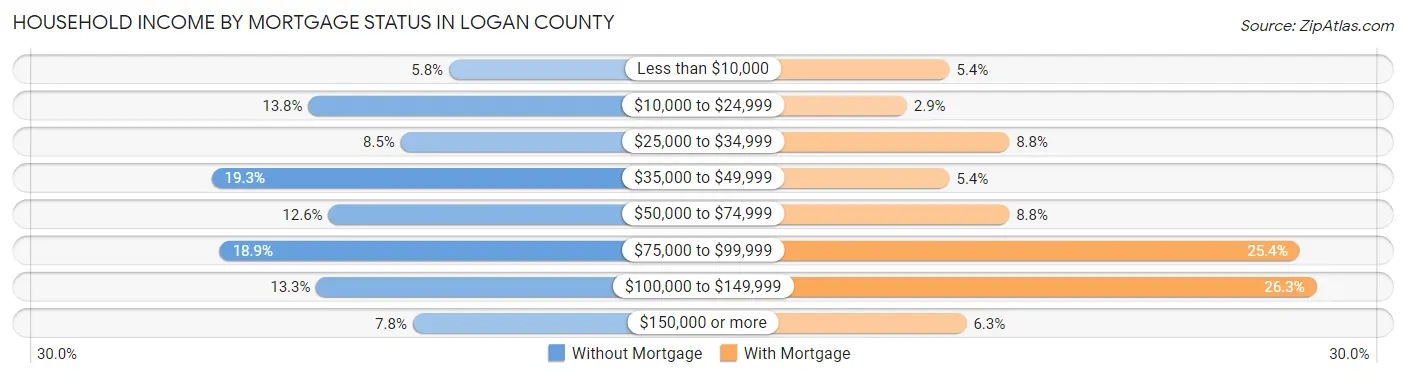
| Household Income | Without Mortgage | With Mortgage |
| Less than $10,000 | 25 (5.8%) | 11 (5.4%) |
| $10,000 to $24,999 | 60 (13.8%) | 6 (2.9%) |
| $25,000 to $34,999 | 37 (8.5%) | 18 (8.8%) |
| $35,000 to $49,999 | 84 (19.3%) | 11 (5.4%) |
| $50,000 to $74,999 | 55 (12.6%) | 18 (8.8%) |
| $75,000 to $99,999 | 82 (18.9%) | 52 (25.4%) |
| $100,000 to $149,999 | 58 (13.3%) | 54 (26.3%) |
| $150,000 or more | 34 (7.8%) | 13 (6.3%) |
| Total | 435 (100.0%) | 205 (100.0%) |
Property Value to Household Income Ratio in Logan County
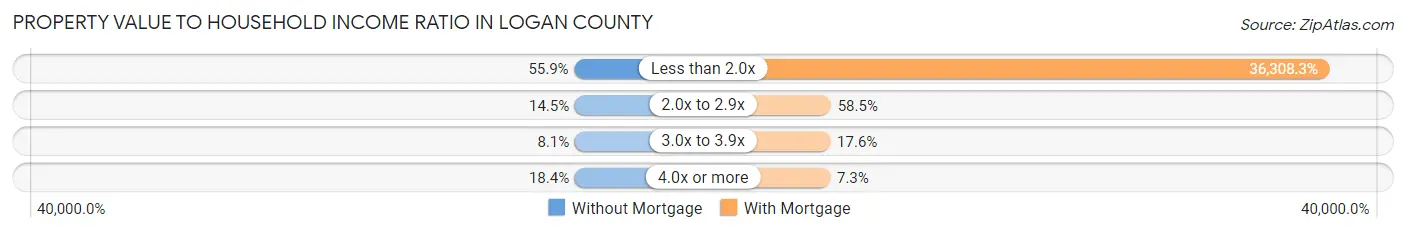
| Value-to-Income Ratio | Without Mortgage | With Mortgage |
| Less than 2.0x | 243 (55.9%) | 74,432 (36,308.3%) |
| 2.0x to 2.9x | 63 (14.5%) | 120 (58.5%) |
| 3.0x to 3.9x | 35 (8.1%) | 36 (17.6%) |
| 4.0x or more | 80 (18.4%) | 15 (7.3%) |
| Total | 435 (100.0%) | 205 (100.0%) |
Real Estate Taxes by Mortgage Status in Logan County
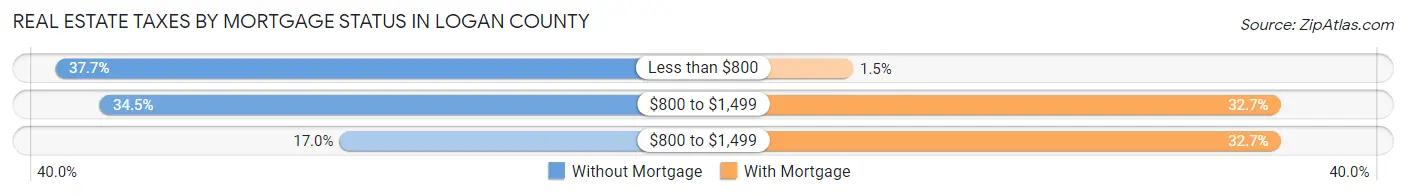
| Property Taxes | Without Mortgage | With Mortgage |
| Less than $800 | 164 (37.7%) | 3 (1.5%) |
| $800 to $1,499 | 150 (34.5%) | 67 (32.7%) |
| $800 to $1,499 | 74 (17.0%) | 67 (32.7%) |
| Total | 435 (100.0%) | 205 (100.0%) |
Health & Disability in Logan County
Health Insurance Coverage by Age in Logan County
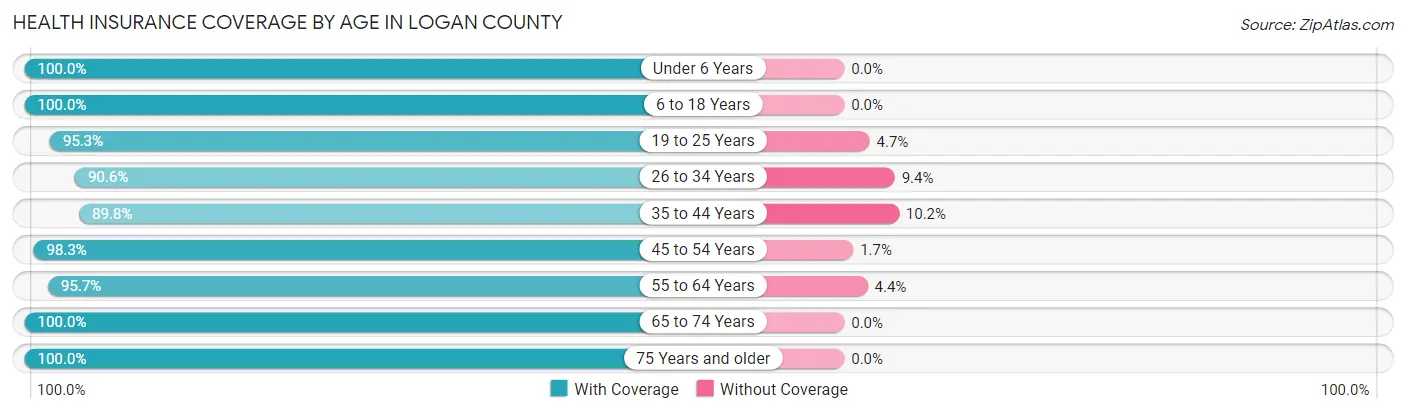
| Age Bracket | With Coverage | Without Coverage |
| Under 6 Years | 143 (100.0%) | 0 (0.0%) |
| 6 to 18 Years | 287 (100.0%) | 0 (0.0%) |
| 19 to 25 Years | 101 (95.3%) | 5 (4.7%) |
| 26 to 34 Years | 135 (90.6%) | 14 (9.4%) |
| 35 to 44 Years | 159 (89.8%) | 18 (10.2%) |
| 45 to 54 Years | 178 (98.3%) | 3 (1.7%) |
| 55 to 64 Years | 286 (95.7%) | 13 (4.3%) |
| 65 to 74 Years | 187 (100.0%) | 0 (0.0%) |
| 75 Years and older | 244 (100.0%) | 0 (0.0%) |
| Total | 1,720 (97.0%) | 53 (3.0%) |
Health Insurance Coverage by Citizenship Status in Logan County
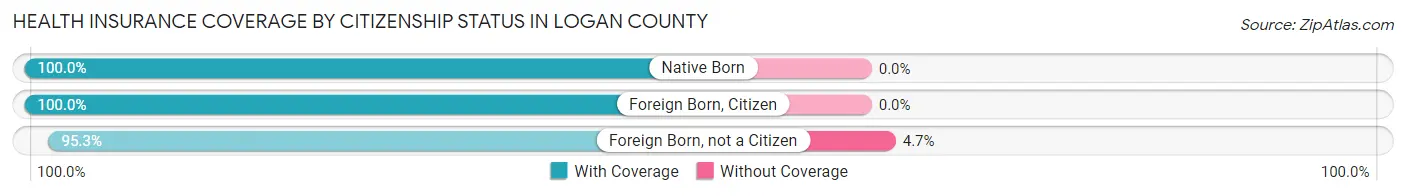
| Citizenship Status | With Coverage | Without Coverage |
| Native Born | 143 (100.0%) | 0 (0.0%) |
| Foreign Born, Citizen | 287 (100.0%) | 0 (0.0%) |
| Foreign Born, not a Citizen | 101 (95.3%) | 5 (4.7%) |
Health Insurance Coverage by Household Income in Logan County
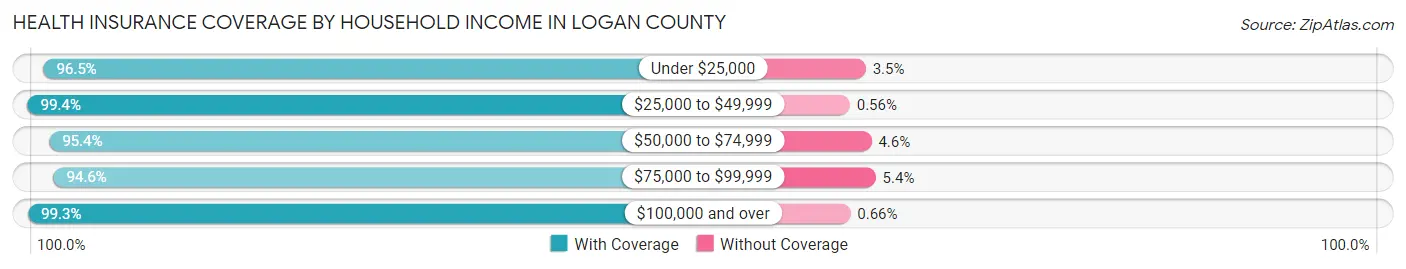
| Household Income | With Coverage | Without Coverage |
| Under $25,000 | 191 (96.5%) | 7 (3.5%) |
| $25,000 to $49,999 | 358 (99.4%) | 2 (0.6%) |
| $50,000 to $74,999 | 351 (95.4%) | 17 (4.6%) |
| $75,000 to $99,999 | 367 (94.6%) | 21 (5.4%) |
| $100,000 and over | 450 (99.3%) | 3 (0.7%) |
Public vs Private Health Insurance Coverage by Age in Logan County
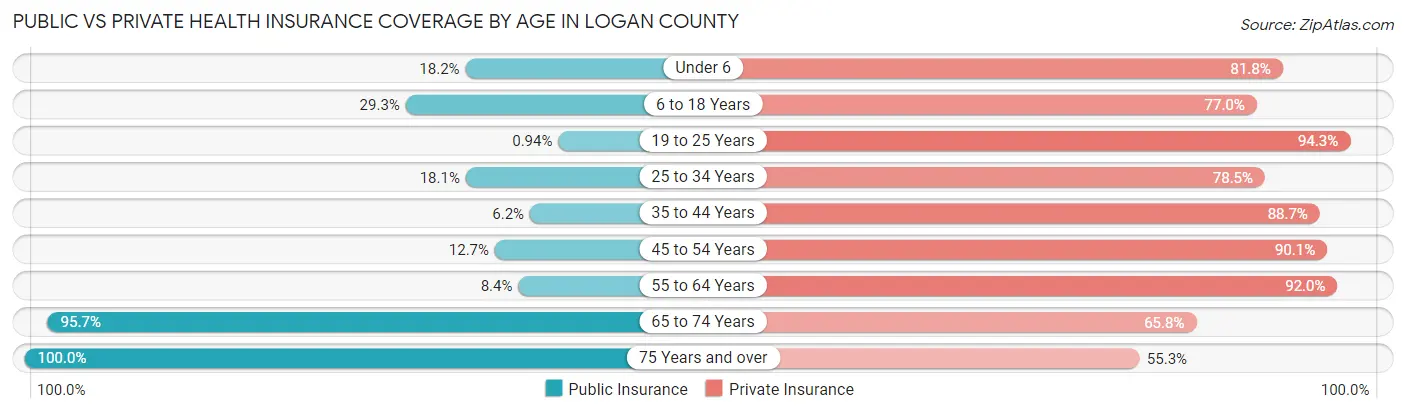
| Age Bracket | Public Insurance | Private Insurance |
| Under 6 | 26 (18.2%) | 117 (81.8%) |
| 6 to 18 Years | 84 (29.3%) | 221 (77.0%) |
| 19 to 25 Years | 1 (0.9%) | 100 (94.3%) |
| 25 to 34 Years | 27 (18.1%) | 117 (78.5%) |
| 35 to 44 Years | 11 (6.2%) | 157 (88.7%) |
| 45 to 54 Years | 23 (12.7%) | 163 (90.1%) |
| 55 to 64 Years | 25 (8.4%) | 275 (92.0%) |
| 65 to 74 Years | 179 (95.7%) | 123 (65.8%) |
| 75 Years and over | 244 (100.0%) | 135 (55.3%) |
| Total | 620 (35.0%) | 1,408 (79.4%) |
Disability Status by Sex by Age in Logan County
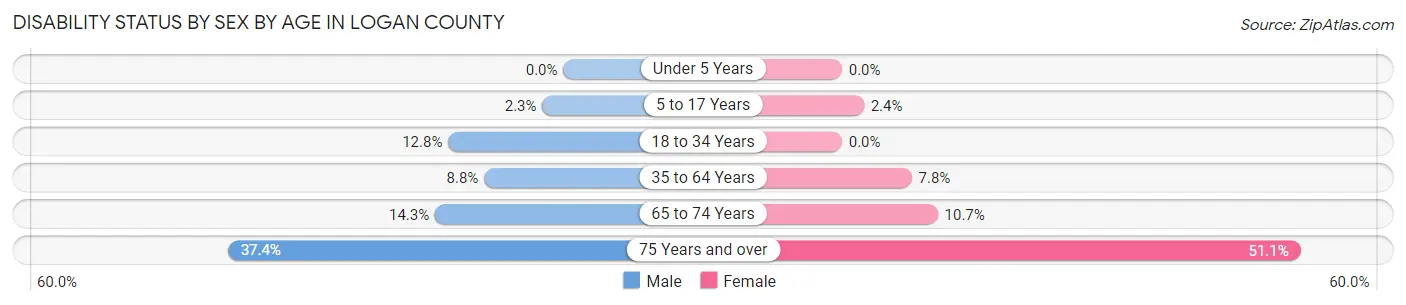
| Age Bracket | Male | Female |
| Under 5 Years | 0 (0.0%) | 0 (0.0%) |
| 5 to 17 Years | 3 (2.3%) | 4 (2.4%) |
| 18 to 34 Years | 15 (12.8%) | 0 (0.0%) |
| 35 to 64 Years | 33 (8.8%) | 22 (7.8%) |
| 65 to 74 Years | 16 (14.3%) | 8 (10.7%) |
| 75 Years and over | 40 (37.4%) | 70 (51.1%) |
Disability Class by Sex by Age in Logan County
Disability Class: Hearing Difficulty
| Age Bracket | Male | Female |
| Under 5 Years | 0 (0.0%) | 0 (0.0%) |
| 5 to 17 Years | 0 (0.0%) | 0 (0.0%) |
| 18 to 34 Years | 13 (11.1%) | 0 (0.0%) |
| 35 to 64 Years | 3 (0.8%) | 1 (0.4%) |
| 65 to 74 Years | 13 (11.6%) | 2 (2.7%) |
| 75 Years and over | 25 (23.4%) | 12 (8.8%) |
Disability Class: Vision Difficulty
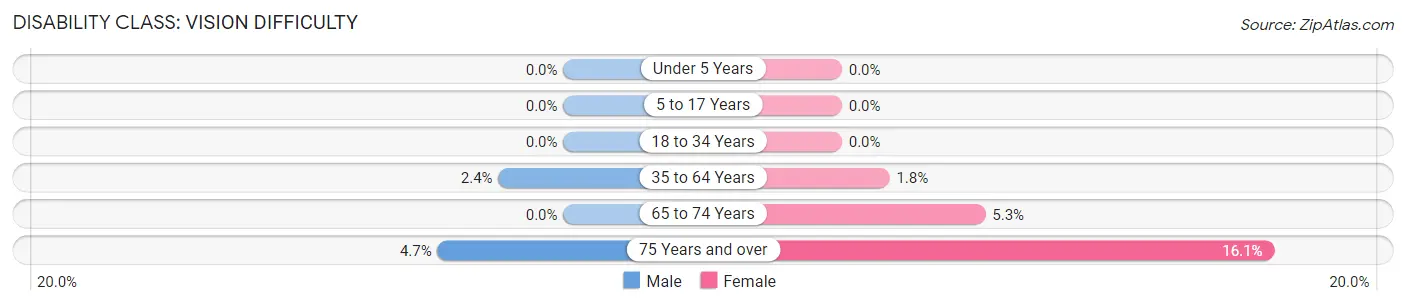
| Age Bracket | Male | Female |
| Under 5 Years | 0 (0.0%) | 0 (0.0%) |
| 5 to 17 Years | 0 (0.0%) | 0 (0.0%) |
| 18 to 34 Years | 0 (0.0%) | 0 (0.0%) |
| 35 to 64 Years | 9 (2.4%) | 5 (1.8%) |
| 65 to 74 Years | 0 (0.0%) | 4 (5.3%) |
| 75 Years and over | 5 (4.7%) | 22 (16.1%) |
Disability Class: Cognitive Difficulty
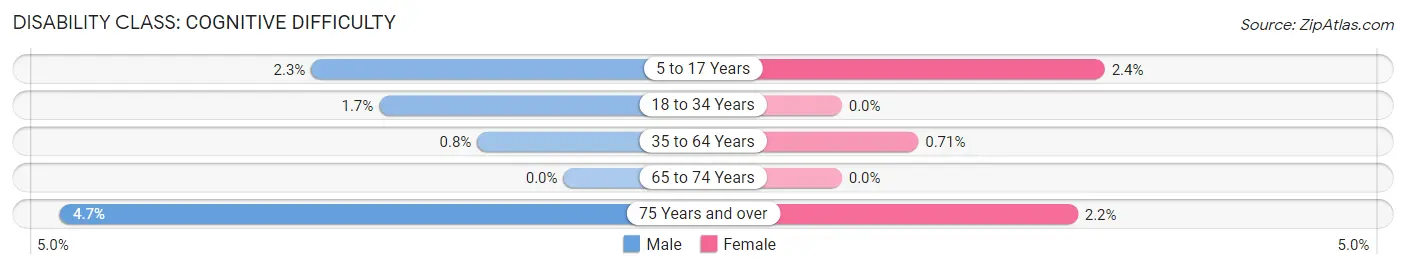
| Age Bracket | Male | Female |
| 5 to 17 Years | 3 (2.3%) | 4 (2.4%) |
| 18 to 34 Years | 2 (1.7%) | 0 (0.0%) |
| 35 to 64 Years | 3 (0.8%) | 2 (0.7%) |
| 65 to 74 Years | 0 (0.0%) | 0 (0.0%) |
| 75 Years and over | 5 (4.7%) | 3 (2.2%) |
Disability Class: Ambulatory Difficulty
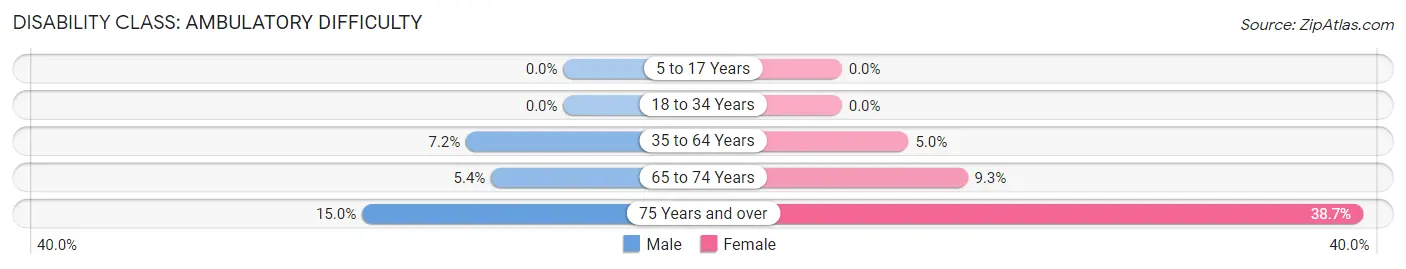
| Age Bracket | Male | Female |
| 5 to 17 Years | 0 (0.0%) | 0 (0.0%) |
| 18 to 34 Years | 0 (0.0%) | 0 (0.0%) |
| 35 to 64 Years | 27 (7.2%) | 14 (5.0%) |
| 65 to 74 Years | 6 (5.4%) | 7 (9.3%) |
| 75 Years and over | 16 (14.9%) | 53 (38.7%) |
Disability Class: Self-Care Difficulty
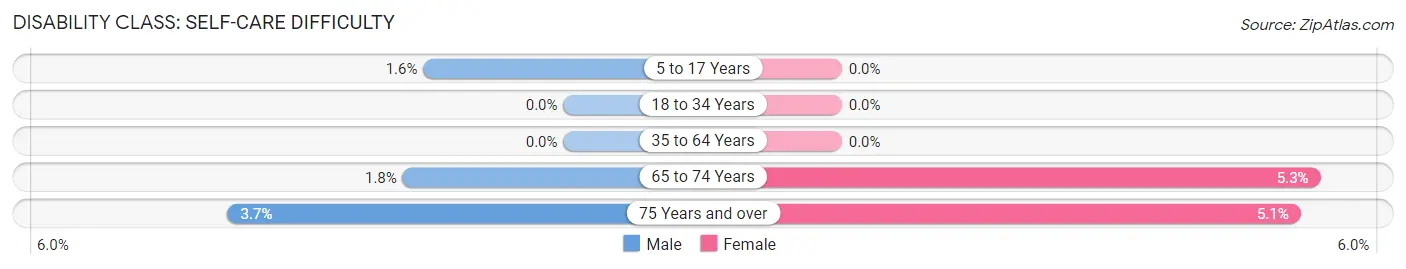
| Age Bracket | Male | Female |
| 5 to 17 Years | 2 (1.6%) | 0 (0.0%) |
| 18 to 34 Years | 0 (0.0%) | 0 (0.0%) |
| 35 to 64 Years | 0 (0.0%) | 0 (0.0%) |
| 65 to 74 Years | 2 (1.8%) | 4 (5.3%) |
| 75 Years and over | 4 (3.7%) | 7 (5.1%) |
Technology Access in Logan County
Computing Device Access in Logan County
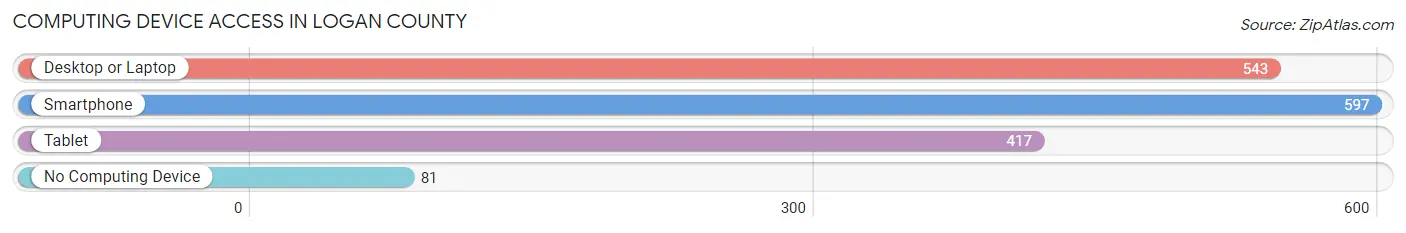
| Device Type | # Households | % Households |
| Desktop or Laptop | 543 | 70.5% |
| Smartphone | 597 | 77.5% |
| Tablet | 417 | 54.2% |
| No Computing Device | 81 | 10.5% |
| Total | 770 | 100.0% |
Internet Access in Logan County
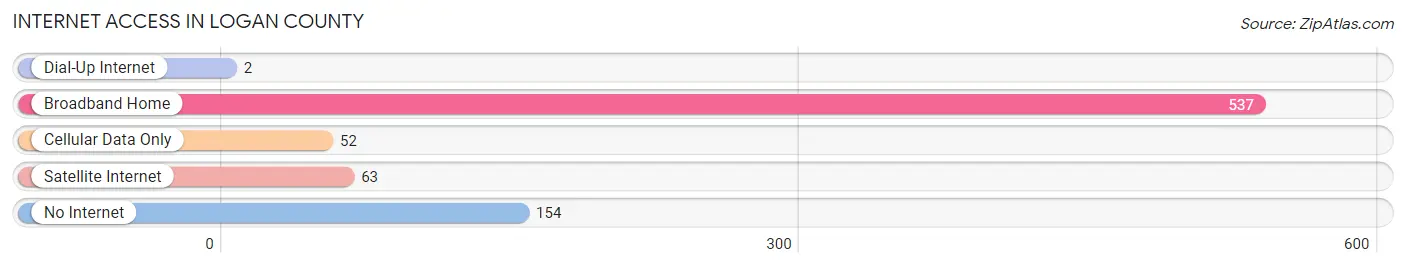
| Internet Type | # Households | % Households |
| Dial-Up Internet | 2 | 0.3% |
| Broadband Home | 537 | 69.7% |
| Cellular Data Only | 52 | 6.8% |
| Satellite Internet | 63 | 8.2% |
| No Internet | 154 | 20.0% |
| Total | 770 | 100.0% |
Logan County Summary
Logan County is located in the north-central region of North Dakota, United States. It is bordered by McLean County to the north, Mercer County to the east, Oliver County to the south, and Mountrail County to the west. The county seat is Napoleon, and the largest city is Strasburg. The county was created in 1873 and named for John A. Logan, a Civil War general and U.S. Senator from Illinois.
Geography
Logan County covers an area of 1,845 square miles and is located in the Missouri Plateau region of North Dakota. The terrain is mostly flat, with some rolling hills and ravines. The county is drained by the Little Missouri River and its tributaries. The highest point in the county is located in the northwest corner, at an elevation of 2,068 feet.
The county is home to several wildlife refuges, including the Little Missouri National Grassland, the Lostwood National Wildlife Refuge, and the Arrowwood National Wildlife Refuge. The county also contains several state parks, including the Fort Ransom State Park, the Fort Stevenson State Park, and the Cross Ranch State Park.
Climate
Logan County has a humid continental climate, with cold winters and hot summers. The average annual temperature is 45°F, and the average annual precipitation is 17 inches.
Demographics
As of the 2010 United States Census, there were 2,845 people, 1,093 households, and 790 families living in the county. The population density was 1.5 people per square mile. The racial makeup of the county was 97.3% White, 0.3% Native American, 0.2% Asian, 0.1% Black or African American, 0.1% Pacific Islander, 0.7% from other races, and 1.3% from two or more races. Hispanic or Latino of any race were 1.7% of the population.
The median income for a household in the county was $45,938, and the median income for a family was $51,964. The per capita income for the county was $20,945. About 8.2% of families and 10.2% of the population were below the poverty line, including 13.2% of those under age 18 and 8.2% of those age 65 or over.
Economy
Logan County's economy is largely based on agriculture. The county is home to several large farms, and the main crops grown are wheat, barley, oats, and hay. Livestock production is also important, with cattle, sheep, and hogs being the main animals raised.
The county is also home to several oil and gas fields, and oil and gas production is a major contributor to the local economy. Other industries in the county include manufacturing, retail, and tourism.
The county is served by two airports, the Napoleon Municipal Airport and the Strasburg Municipal Airport. The county is also served by several highways, including Interstate 94, U.S. Route 83, and North Dakota State Highway 1804.
Logan County is home to several attractions, including the Fort Ransom State Park, the Fort Stevenson State Park, and the Cross Ranch State Park. The county is also home to several museums, including the Fort Ransom Museum, the Fort Stevenson Museum, and the Cross Ranch Nature Center.
Common Questions
What is Per Capita Income in Logan County?
Per Capita income in Logan County is $33,240.
What is the Median Family Income in Logan County?
Median Family Income in Logan County is $73,667.
What is the Median Household income in Logan County?
Median Household Income in Logan County is $59,750.
What is Income or Wage Gap in Logan County?
Income or Wage Gap in Logan County is 52.3%.
Women in Logan County earn 47.7 cents for every dollar earned by a man.
What is Inequality or Gini Index in Logan County?
Inequality or Gini Index in Logan County is 0.44.
What is the Total Population of Logan County?
Total Population of Logan County is 1,849.
What is the Total Male Population of Logan County?
Total Male Population of Logan County is 924.
What is the Total Female Population of Logan County?
Total Female Population of Logan County is 925.
What is the Ratio of Males per 100 Females in Logan County?
There are 99.89 Males per 100 Females in Logan County.
What is the Ratio of Females per 100 Males in Logan County?
There are 100.11 Females per 100 Males in Logan County.
What is the Median Population Age in Logan County?
Median Population Age in Logan County is 49.2 Years.
What is the Average Family Size in Logan County
Average Family Size in Logan County is 3.0 People.
What is the Average Household Size in Logan County
Average Household Size in Logan County is 2.3 People.
How Large is the Labor Force in Logan County?
There are 868 People in the Labor Forcein in Logan County.
What is the Percentage of People in the Labor Force in Logan County?
57.7% of People are in the Labor Force in Logan County.
What is the Unemployment Rate in Logan County?
Unemployment Rate in Logan County is 1.3%.