Kidder County, ND Map & Demographics
Kidder County Map
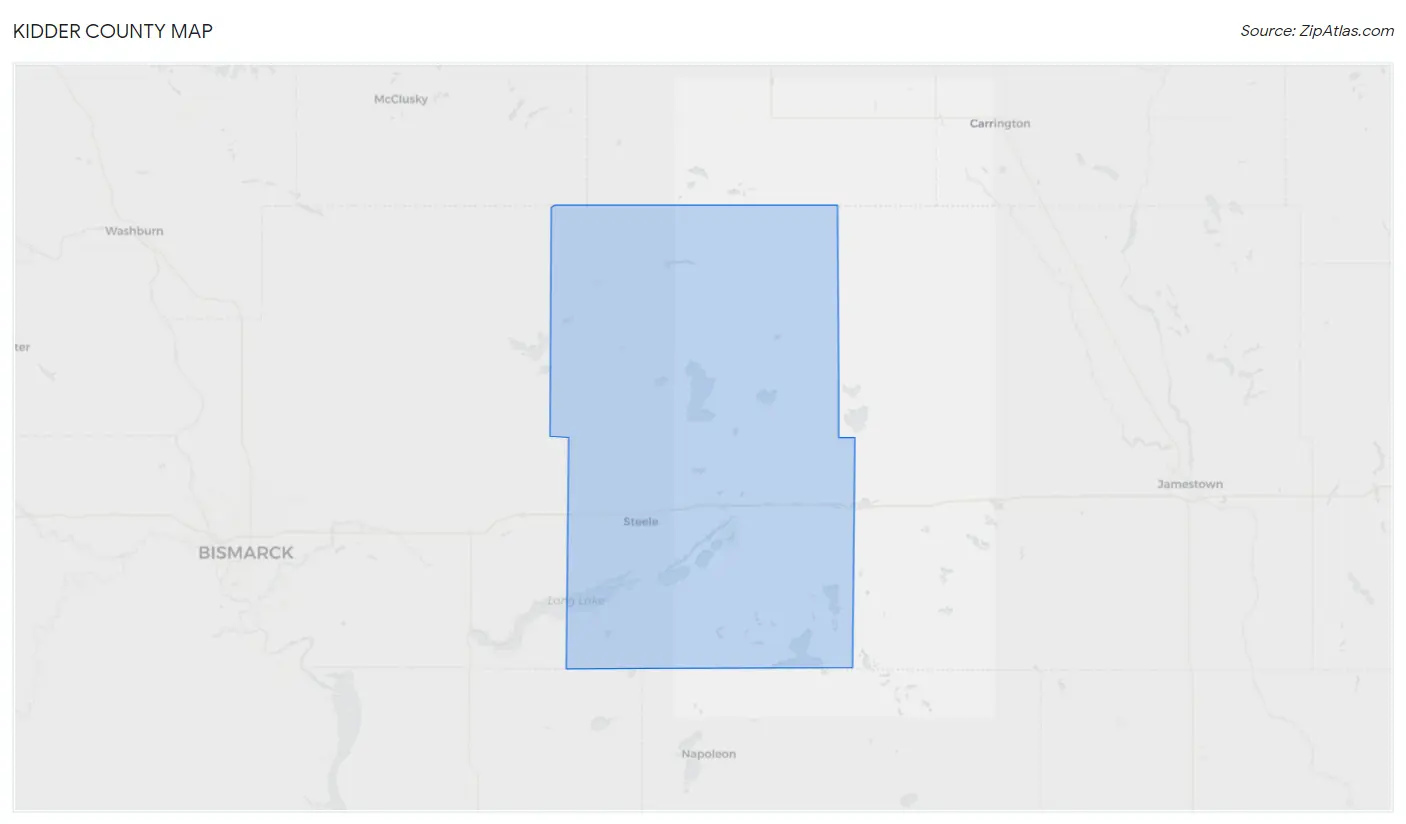
Kidder County Overview
$32,974
PER CAPITA INCOME
$76,765
AVG FAMILY INCOME
$57,240
AVG HOUSEHOLD INCOME
32.5%
WAGE / INCOME GAP [ % ]
67.5¢/ $1
WAGE / INCOME GAP [ $ ]
0.43
INEQUALITY / GINI INDEX
2,391
TOTAL POPULATION
1,319
MALE POPULATION
1,072
FEMALE POPULATION
123.04
MALES / 100 FEMALES
81.27
FEMALES / 100 MALES
48.4
MEDIAN AGE
2.9
AVG FAMILY SIZE
2.1
AVG HOUSEHOLD SIZE
1,042
LABOR FORCE [ PEOPLE ]
55.1%
PERCENT IN LABOR FORCE
1.0%
UNEMPLOYMENT RATE
Kidder County Area Codes
Income in Kidder County
Income Overview in Kidder County
Per Capita Income in Kidder County is $32,974, while median incomes of families and households are $76,765 and $57,240 respectively.
| Characteristic | Number | Measure |
| Per Capita Income | 2,391 | $32,974 |
| Median Family Income | 604 | $76,765 |
| Mean Family Income | 604 | $88,488 |
| Median Household Income | 1,111 | $57,240 |
| Mean Household Income | 1,111 | $69,876 |
| Income Deficit | 604 | $0 |
| Wage / Income Gap (%) | 2,391 | 32.51% |
| Wage / Income Gap ($) | 2,391 | 67.49¢ per $1 |
| Gini / Inequality Index | 2,391 | 0.43 |
Earnings by Sex in Kidder County
Average Earnings in Kidder County are $43,243, $49,792 for men and $33,606 for women, a difference of 32.5%.
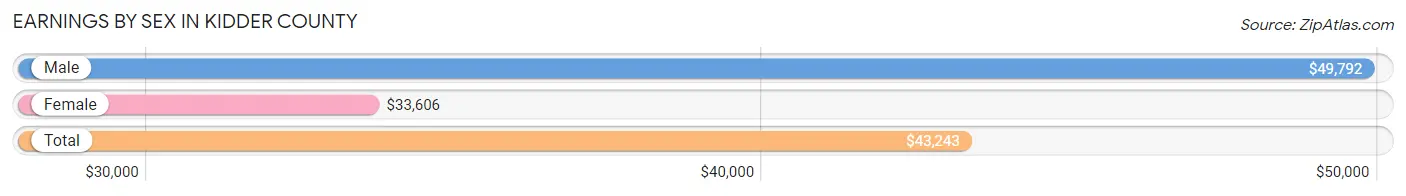
| Sex | Number | Average Earnings |
| Male | 731 (62.3%) | $49,792 |
| Female | 443 (37.7%) | $33,606 |
| Total | 1,174 (100.0%) | $43,243 |
Earnings by Sex by Income Bracket in Kidder County
The most common earnings brackets in Kidder County are $55,000 to $64,999 for men (94 | 12.9%) and $55,000 to $64,999 for women (45 | 10.2%).
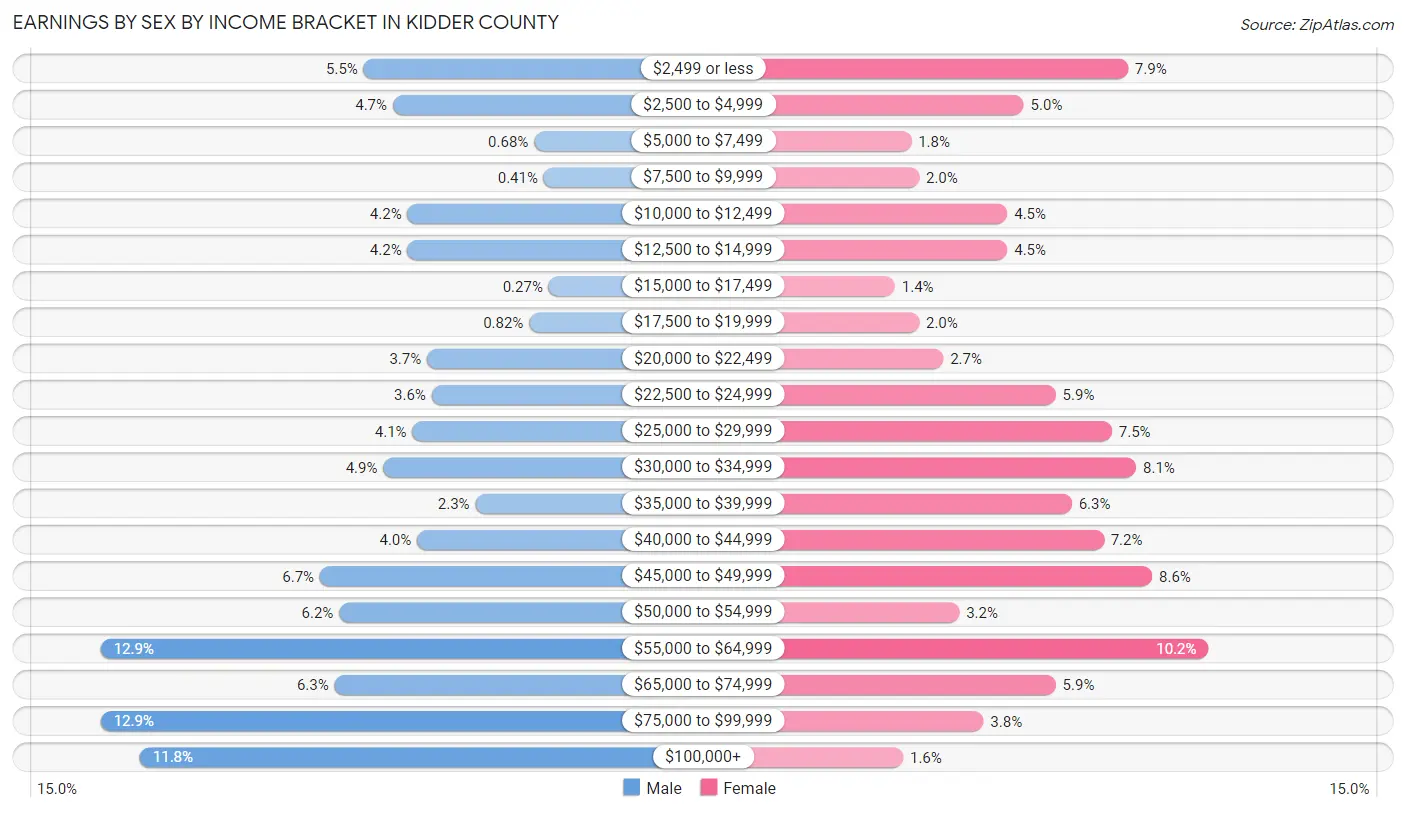
| Income | Male | Female |
| $2,499 or less | 40 (5.5%) | 35 (7.9%) |
| $2,500 to $4,999 | 34 (4.6%) | 22 (5.0%) |
| $5,000 to $7,499 | 5 (0.7%) | 8 (1.8%) |
| $7,500 to $9,999 | 3 (0.4%) | 9 (2.0%) |
| $10,000 to $12,499 | 31 (4.2%) | 20 (4.5%) |
| $12,500 to $14,999 | 31 (4.2%) | 20 (4.5%) |
| $15,000 to $17,499 | 2 (0.3%) | 6 (1.3%) |
| $17,500 to $19,999 | 6 (0.8%) | 9 (2.0%) |
| $20,000 to $22,499 | 27 (3.7%) | 12 (2.7%) |
| $22,500 to $24,999 | 26 (3.6%) | 26 (5.9%) |
| $25,000 to $29,999 | 30 (4.1%) | 33 (7.4%) |
| $30,000 to $34,999 | 36 (4.9%) | 36 (8.1%) |
| $35,000 to $39,999 | 17 (2.3%) | 28 (6.3%) |
| $40,000 to $44,999 | 29 (4.0%) | 32 (7.2%) |
| $45,000 to $49,999 | 49 (6.7%) | 38 (8.6%) |
| $50,000 to $54,999 | 45 (6.2%) | 14 (3.2%) |
| $55,000 to $64,999 | 94 (12.9%) | 45 (10.2%) |
| $65,000 to $74,999 | 46 (6.3%) | 26 (5.9%) |
| $75,000 to $99,999 | 94 (12.9%) | 17 (3.8%) |
| $100,000+ | 86 (11.8%) | 7 (1.6%) |
| Total | 731 (100.0%) | 443 (100.0%) |
Earnings by Sex by Educational Attainment in Kidder County
Average earnings in Kidder County are $51,136 for men and $33,317 for women, a difference of 34.8%. Men with an educational attainment of less than high school enjoy the highest average annual earnings of $57,778, while those with graduate degree education earn the least with $45,625. Women with an educational attainment of graduate degree earn the most with the average annual earnings of $51,250, while those with college or associate's degree education have the smallest earnings of $26,563.
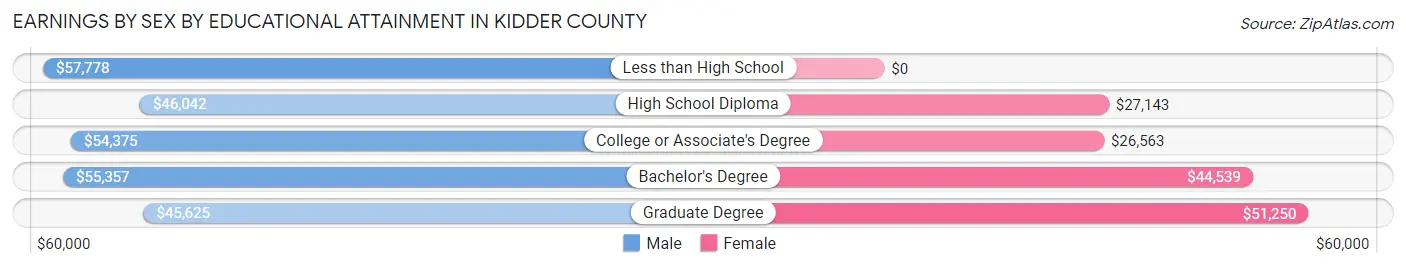
| Educational Attainment | Male Income | Female Income |
| Less than High School | $57,778 | $0 |
| High School Diploma | $46,042 | $27,143 |
| College or Associate's Degree | $54,375 | $26,563 |
| Bachelor's Degree | $55,357 | $44,539 |
| Graduate Degree | $45,625 | $51,250 |
| Total | $51,136 | $33,317 |
Family Income in Kidder County
Family Income Brackets in Kidder County
According to the Kidder County family income data, there are 122 families falling into the $75,000 to $99,999 income range, which is the most common income bracket and makes up 20.2% of all families. Conversely, the $10,000 to $14,999 income bracket is the least frequent group with only 15 families (2.5%) belonging to this category.
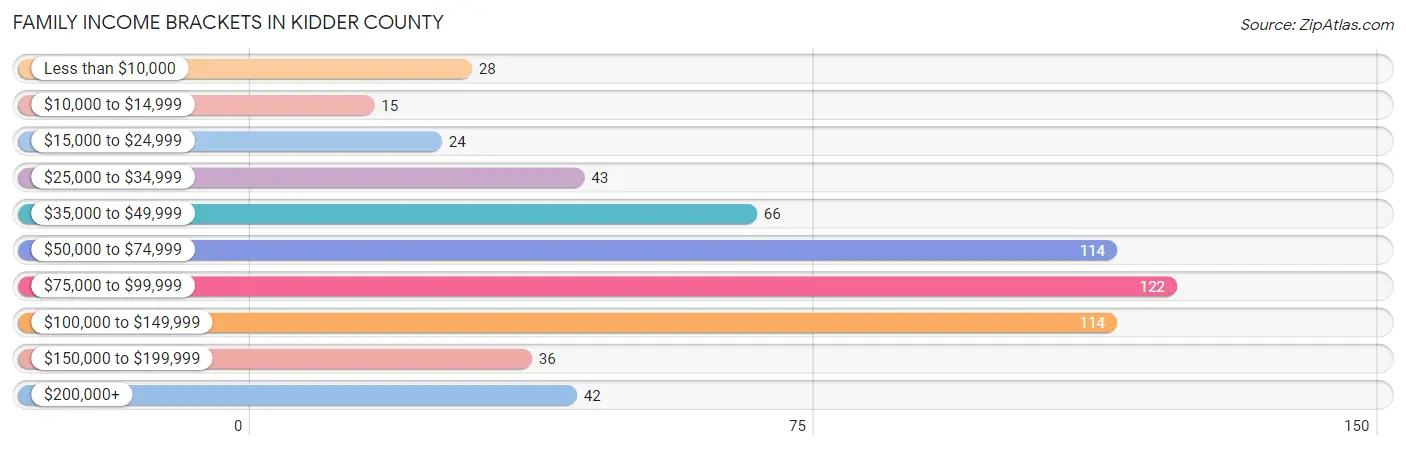
| Income Bracket | # Families | % Families |
| Less than $10,000 | 28 | 4.6% |
| $10,000 to $14,999 | 15 | 2.5% |
| $15,000 to $24,999 | 24 | 4.0% |
| $25,000 to $34,999 | 43 | 7.1% |
| $35,000 to $49,999 | 66 | 10.9% |
| $50,000 to $74,999 | 114 | 18.9% |
| $75,000 to $99,999 | 122 | 20.2% |
| $100,000 to $149,999 | 114 | 18.9% |
| $150,000 to $199,999 | 36 | 6.0% |
| $200,000+ | 42 | 7.0% |
Family Income by Famaliy Size in Kidder County
4-person families (79 | 13.1%) account for the highest median family income in Kidder County with $82,083 per family, while 2-person families (358 | 59.3%) have the highest median income of $37,308 per family member.
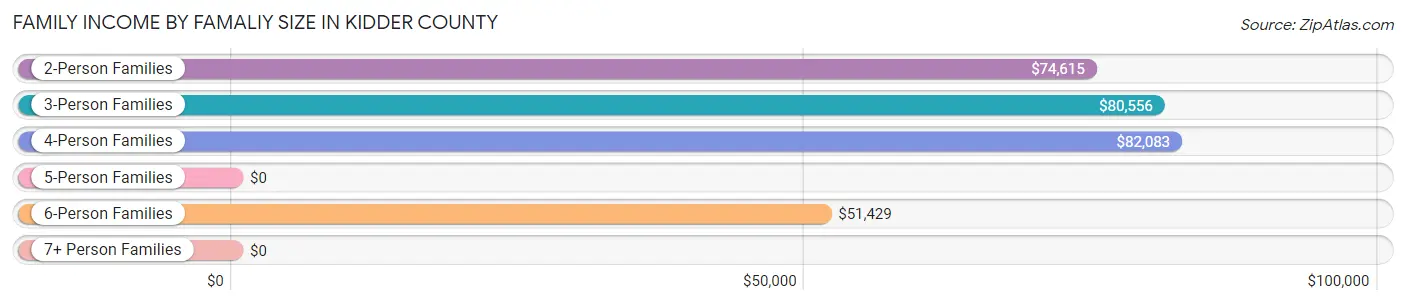
| Income Bracket | # Families | Median Income |
| 2-Person Families | 358 (59.3%) | $74,615 |
| 3-Person Families | 118 (19.5%) | $80,556 |
| 4-Person Families | 79 (13.1%) | $82,083 |
| 5-Person Families | 24 (4.0%) | $0 |
| 6-Person Families | 22 (3.6%) | $51,429 |
| 7+ Person Families | 3 (0.5%) | $0 |
| Total | 604 (100.0%) | $76,765 |
Family Income by Number of Earners in Kidder County
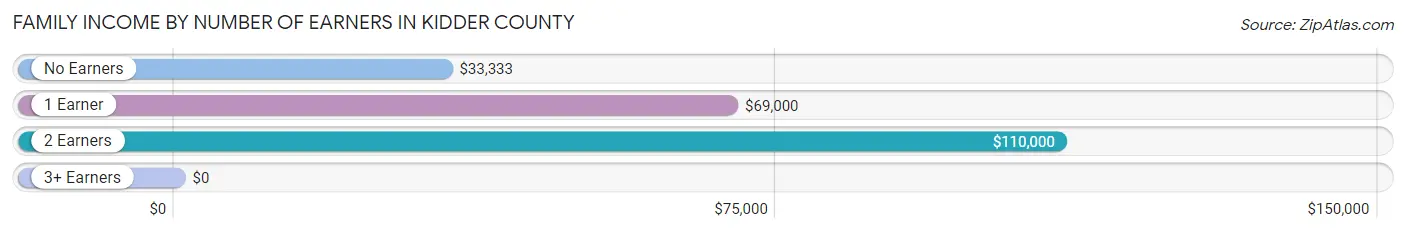
| Number of Earners | # Families | Median Income |
| No Earners | 146 (24.2%) | $33,333 |
| 1 Earner | 168 (27.8%) | $69,000 |
| 2 Earners | 250 (41.4%) | $110,000 |
| 3+ Earners | 40 (6.6%) | $0 |
| Total | 604 (100.0%) | $76,765 |
Household Income in Kidder County
Household Income Brackets in Kidder County
With 226 households falling in the category, the $50,000 to $74,999 income range is the most frequent in Kidder County, accounting for 20.3% of all households. In contrast, only 46 households (4.1%) fall into the $200,000+ income bracket, making it the least populous group.
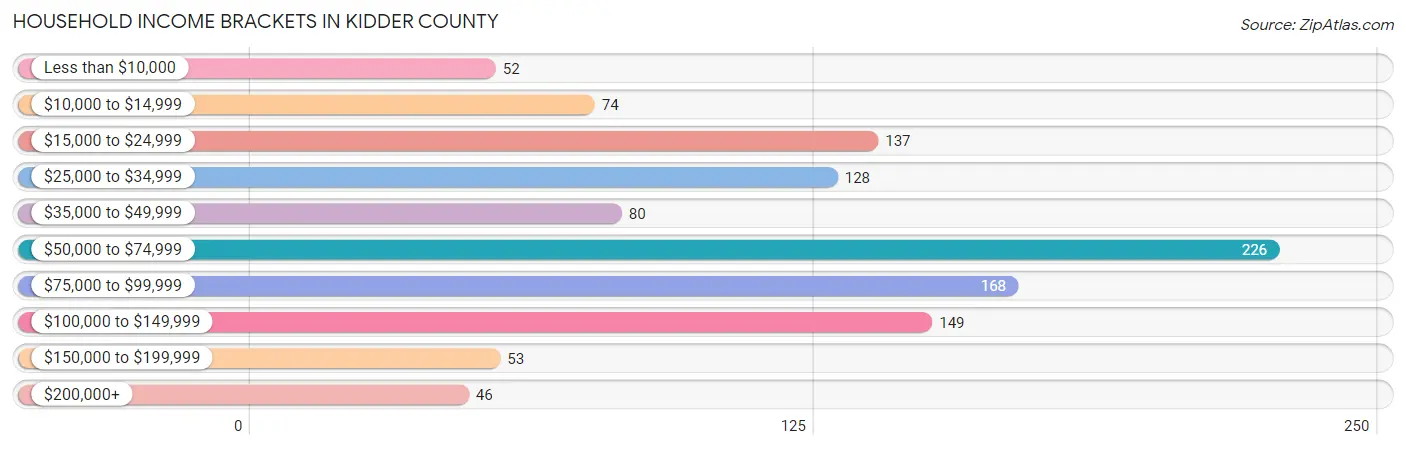
| Income Bracket | # Households | % Households |
| Less than $10,000 | 52 | 4.7% |
| $10,000 to $14,999 | 74 | 6.7% |
| $15,000 to $24,999 | 137 | 12.3% |
| $25,000 to $34,999 | 128 | 11.5% |
| $35,000 to $49,999 | 80 | 7.2% |
| $50,000 to $74,999 | 226 | 20.3% |
| $75,000 to $99,999 | 168 | 15.1% |
| $100,000 to $149,999 | 149 | 13.4% |
| $150,000 to $199,999 | 53 | 4.8% |
| $200,000+ | 46 | 4.1% |
Household Income by Householder Age in Kidder County
The median household income in Kidder County is $57,240, with the highest median household income of $78,103 found in the 15 to 24 years age bracket for the primary householder. A total of 90 households (8.1%) fall into this category. Meanwhile, the 65+ years age bracket for the primary householder has the lowest median household income of $29,705, with 427 households (38.4%) in this group.
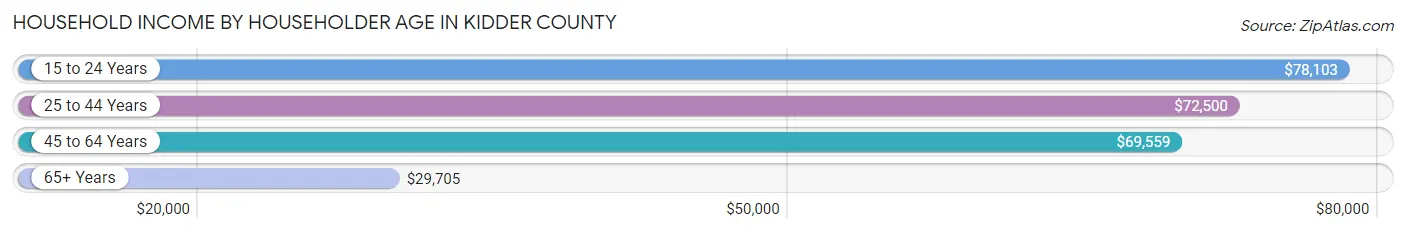
| Income Bracket | # Households | Median Income |
| 15 to 24 Years | 90 (8.1%) | $78,103 |
| 25 to 44 Years | 206 (18.5%) | $72,500 |
| 45 to 64 Years | 388 (34.9%) | $69,559 |
| 65+ Years | 427 (38.4%) | $29,705 |
| Total | 1,111 (100.0%) | $57,240 |
Poverty in Kidder County
Income Below Poverty by Sex and Age in Kidder County
With 12.1% poverty level for males and 13.6% for females among the residents of Kidder County, 6 to 11 year old males and 16 and 17 year old females are the most vulnerable to poverty, with 23 males (33.8%) and 7 females (29.2%) in their respective age groups living below the poverty level.
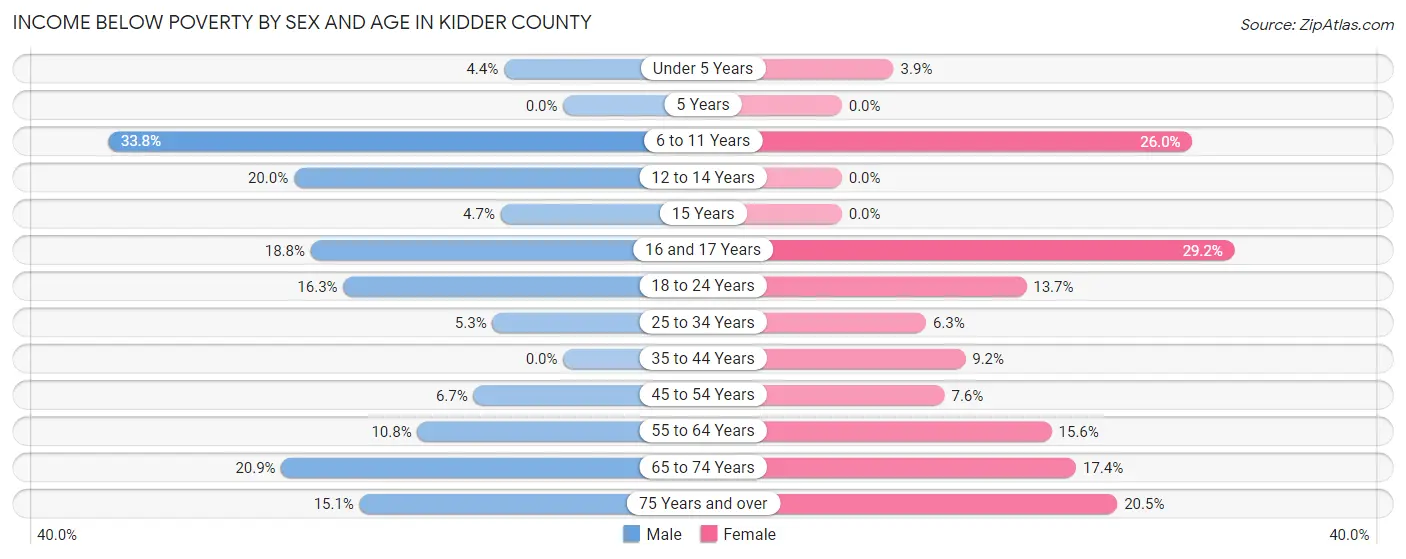
| Age Bracket | Male | Female |
| Under 5 Years | 4 (4.4%) | 2 (3.8%) |
| 5 Years | 0 (0.0%) | 0 (0.0%) |
| 6 to 11 Years | 23 (33.8%) | 19 (26.0%) |
| 12 to 14 Years | 6 (20.0%) | 0 (0.0%) |
| 15 Years | 2 (4.6%) | 0 (0.0%) |
| 16 and 17 Years | 6 (18.8%) | 7 (29.2%) |
| 18 to 24 Years | 16 (16.3%) | 10 (13.7%) |
| 25 to 34 Years | 6 (5.3%) | 3 (6.2%) |
| 35 to 44 Years | 0 (0.0%) | 10 (9.2%) |
| 45 to 54 Years | 6 (6.7%) | 10 (7.6%) |
| 55 to 64 Years | 26 (10.8%) | 24 (15.6%) |
| 65 to 74 Years | 36 (20.9%) | 28 (17.4%) |
| 75 Years and over | 26 (15.1%) | 27 (20.4%) |
| Total | 157 (12.1%) | 140 (13.6%) |
Income Above Poverty by Sex and Age in Kidder County
According to the poverty statistics in Kidder County, males aged 5 years and females aged 5 years are the age groups that are most secure financially, with 100.0% of males and 100.0% of females in these age groups living above the poverty line.
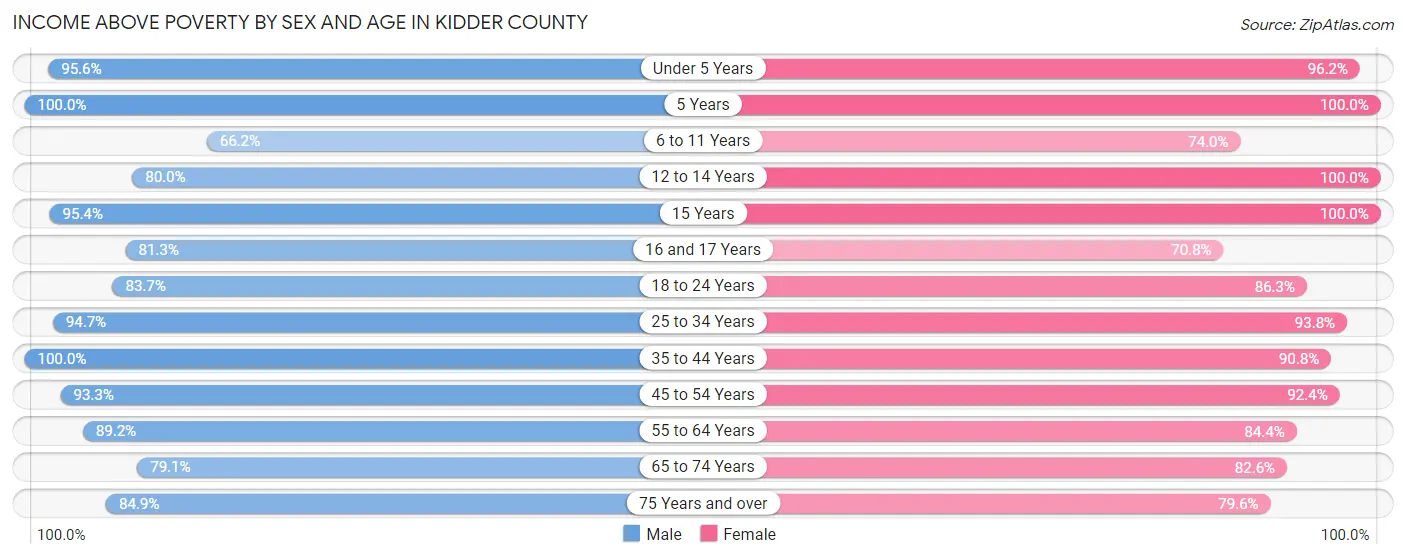
| Age Bracket | Male | Female |
| Under 5 Years | 87 (95.6%) | 50 (96.2%) |
| 5 Years | 7 (100.0%) | 6 (100.0%) |
| 6 to 11 Years | 45 (66.2%) | 54 (74.0%) |
| 12 to 14 Years | 24 (80.0%) | 48 (100.0%) |
| 15 Years | 41 (95.4%) | 16 (100.0%) |
| 16 and 17 Years | 26 (81.2%) | 17 (70.8%) |
| 18 to 24 Years | 82 (83.7%) | 63 (86.3%) |
| 25 to 34 Years | 108 (94.7%) | 45 (93.8%) |
| 35 to 44 Years | 141 (100.0%) | 99 (90.8%) |
| 45 to 54 Years | 84 (93.3%) | 121 (92.4%) |
| 55 to 64 Years | 214 (89.2%) | 130 (84.4%) |
| 65 to 74 Years | 136 (79.1%) | 133 (82.6%) |
| 75 Years and over | 146 (84.9%) | 105 (79.5%) |
| Total | 1,141 (87.9%) | 887 (86.4%) |
Income Below Poverty Among Married-Couple Families in Kidder County
The poverty statistics for married-couple families in Kidder County show that 8.6% or 47 of the total 544 families live below the poverty line. Families with 3 or 4 children have the highest poverty rate of 16.3%, comprising of 7 families. On the other hand, families with 5 or more children have the lowest poverty rate of 0.0%, which includes 0 families.
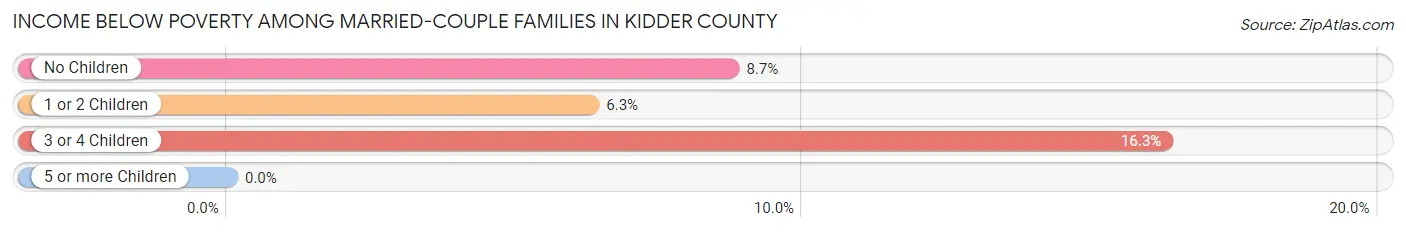
| Children | Above Poverty | Below Poverty |
| No Children | 324 (91.3%) | 31 (8.7%) |
| 1 or 2 Children | 134 (93.7%) | 9 (6.3%) |
| 3 or 4 Children | 36 (83.7%) | 7 (16.3%) |
| 5 or more Children | 3 (100.0%) | 0 (0.0%) |
| Total | 497 (91.4%) | 47 (8.6%) |
Income Below Poverty Among Single-Parent Households in Kidder County
According to the poverty data in Kidder County, 7.4% or 2 single-father households and 54.5% or 18 single-mother households are living below the poverty line. Among single-father households, those with 1 or 2 children have the highest poverty rate, with 2 households (13.3%) experiencing poverty. Likewise, among single-mother households, those with 1 or 2 children have the highest poverty rate, with 18 households (58.1%) falling below the poverty line.
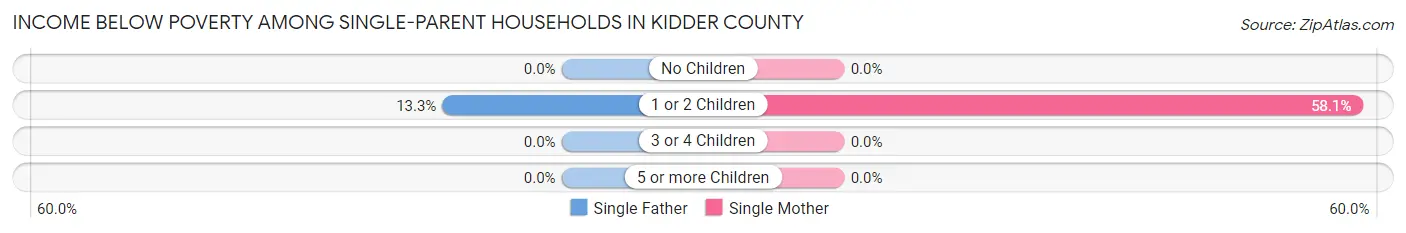
| Children | Single Father | Single Mother |
| No Children | 0 (0.0%) | 0 (0.0%) |
| 1 or 2 Children | 2 (13.3%) | 18 (58.1%) |
| 3 or 4 Children | 0 (0.0%) | 0 (0.0%) |
| 5 or more Children | 0 (0.0%) | 0 (0.0%) |
| Total | 2 (7.4%) | 18 (54.5%) |
Income Below Poverty Among Married-Couple vs Single-Parent Households in Kidder County
The poverty data for Kidder County shows that 47 of the married-couple family households (8.6%) and 20 of the single-parent households (33.3%) are living below the poverty level. Within the married-couple family households, those with 3 or 4 children have the highest poverty rate, with 7 households (16.3%) falling below the poverty line. Among the single-parent households, those with 1 or 2 children have the highest poverty rate, with 20 household (43.5%) living below poverty.
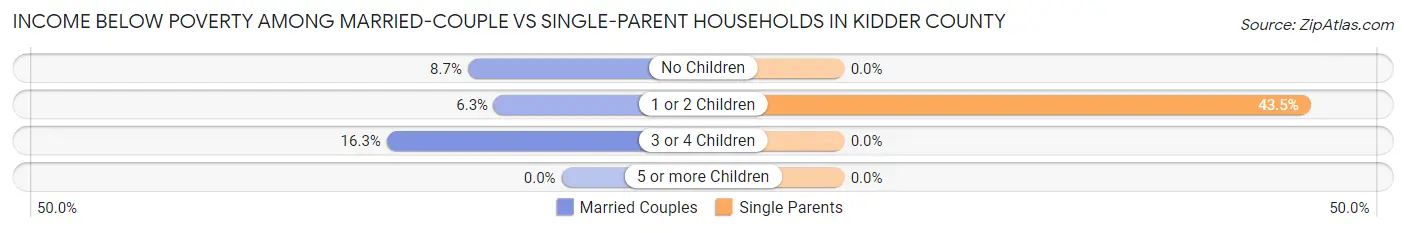
| Children | Married-Couple Families | Single-Parent Households |
| No Children | 31 (8.7%) | 0 (0.0%) |
| 1 or 2 Children | 9 (6.3%) | 20 (43.5%) |
| 3 or 4 Children | 7 (16.3%) | 0 (0.0%) |
| 5 or more Children | 0 (0.0%) | 0 (0.0%) |
| Total | 47 (8.6%) | 20 (33.3%) |
Race in Kidder County
The most populous races in Kidder County are White / Caucasian (2,250 | 94.1%), Hispanic or Latino (110 | 4.6%), and Native / Alaskan (64 | 2.7%).
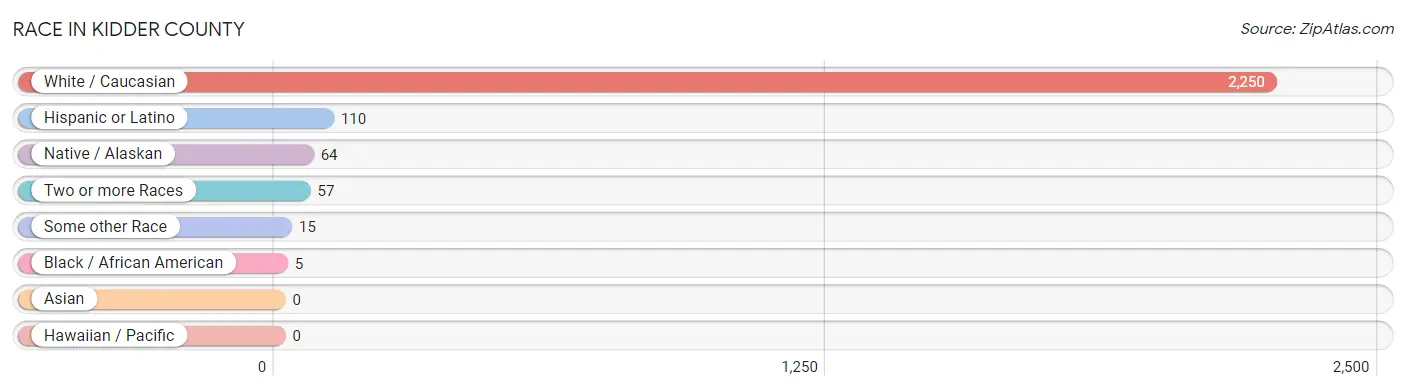
| Race | # Population | % Population |
| Asian | 0 | 0.0% |
| Black / African American | 5 | 0.2% |
| Hawaiian / Pacific | 0 | 0.0% |
| Hispanic or Latino | 110 | 4.6% |
| Native / Alaskan | 64 | 2.7% |
| White / Caucasian | 2,250 | 94.1% |
| Two or more Races | 57 | 2.4% |
| Some other Race | 15 | 0.6% |
| Total | 2,391 | 100.0% |
Ancestry in Kidder County
The most populous ancestries reported in Kidder County are German (1,258 | 52.6%), Norwegian (390 | 16.3%), Irish (202 | 8.5%), English (154 | 6.4%), and Russian (105 | 4.4%), together accounting for 88.2% of all Kidder County residents.
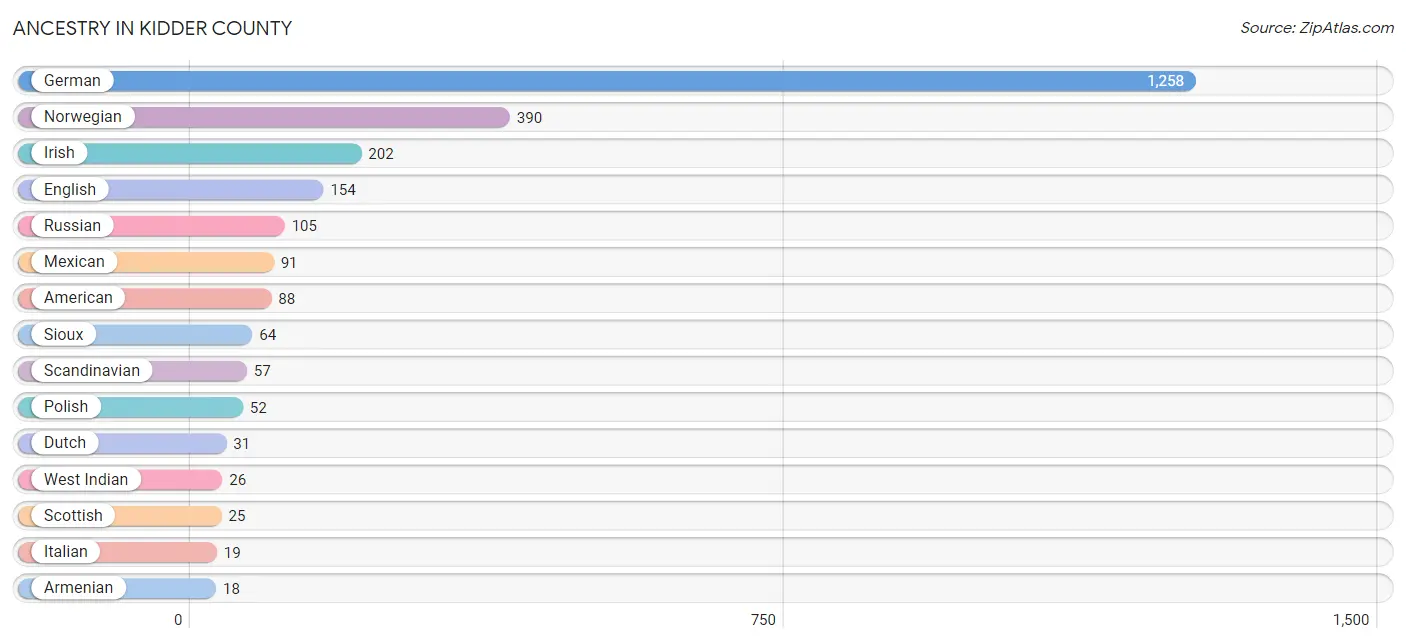
| Ancestry | # Population | % Population |
| American | 88 | 3.7% |
| Armenian | 18 | 0.7% |
| Australian | 3 | 0.1% |
| Austrian | 10 | 0.4% |
| Belgian | 1 | 0.0% |
| Bulgarian | 1 | 0.0% |
| Central American | 8 | 0.3% |
| Chippewa | 13 | 0.5% |
| Czech | 1 | 0.0% |
| Danish | 14 | 0.6% |
| Dutch | 31 | 1.3% |
| English | 154 | 6.4% |
| Finnish | 6 | 0.3% |
| French | 16 | 0.7% |
| French Canadian | 6 | 0.3% |
| German | 1,258 | 52.6% |
| German Russian | 2 | 0.1% |
| Icelander | 6 | 0.3% |
| Irish | 202 | 8.5% |
| Italian | 19 | 0.8% |
| Mexican | 91 | 3.8% |
| Northern European | 2 | 0.1% |
| Norwegian | 390 | 16.3% |
| Polish | 52 | 2.2% |
| Puerto Rican | 11 | 0.5% |
| Russian | 105 | 4.4% |
| Salvadoran | 8 | 0.3% |
| Scandinavian | 57 | 2.4% |
| Scotch-Irish | 12 | 0.5% |
| Scottish | 25 | 1.1% |
| Sioux | 64 | 2.7% |
| Swedish | 14 | 0.6% |
| Ukrainian | 1 | 0.0% |
| Welsh | 2 | 0.1% |
| West Indian | 26 | 1.1% | View All 35 Rows |
Immigrants in Kidder County
The most numerous immigrant groups reported in Kidder County came from Central America (24 | 1.0%), Latin America (24 | 1.0%), Mexico (20 | 0.8%), Canada (5 | 0.2%), and El Salvador (4 | 0.2%), together accounting for 3.2% of all Kidder County residents.
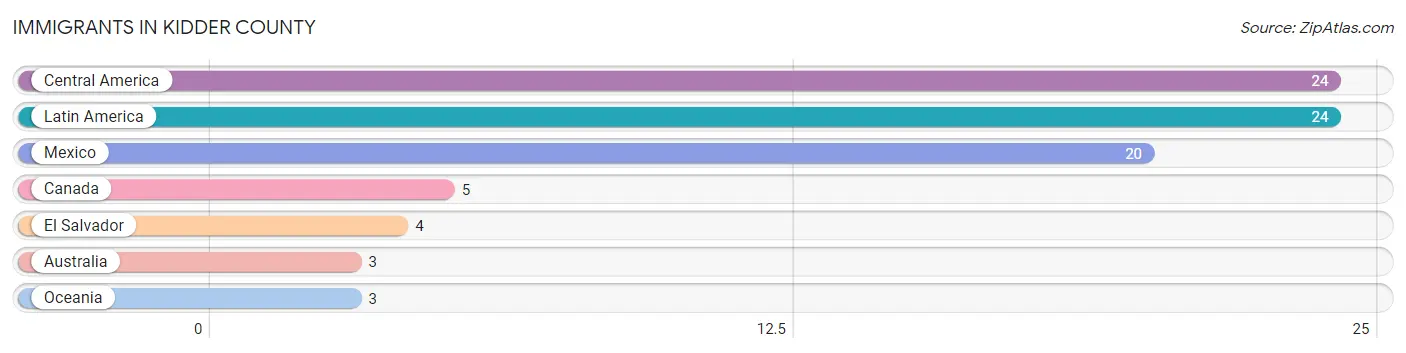
| Immigration Origin | # Population | % Population |
| Australia | 3 | 0.1% |
| Canada | 5 | 0.2% |
| Central America | 24 | 1.0% |
| El Salvador | 4 | 0.2% |
| Latin America | 24 | 1.0% |
| Mexico | 20 | 0.8% |
| Oceania | 3 | 0.1% | View All 7 Rows |
Sex and Age in Kidder County
Sex and Age in Kidder County
The most populous age groups in Kidder County are 60 to 64 Years (124 | 9.4%) for men and 65 to 69 Years (101 | 9.4%) for women.
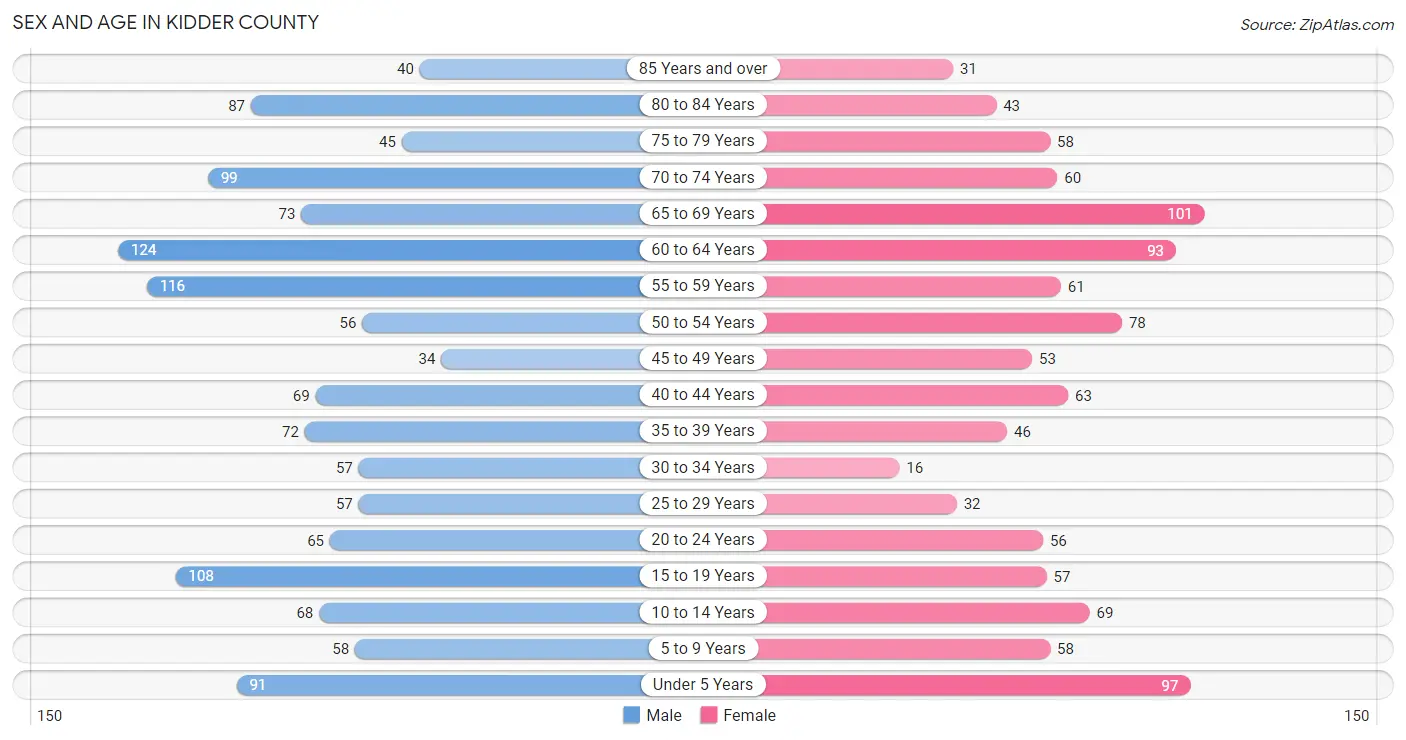
| Age Bracket | Male | Female |
| Under 5 Years | 91 (6.9%) | 97 (9.0%) |
| 5 to 9 Years | 58 (4.4%) | 58 (5.4%) |
| 10 to 14 Years | 68 (5.2%) | 69 (6.4%) |
| 15 to 19 Years | 108 (8.2%) | 57 (5.3%) |
| 20 to 24 Years | 65 (4.9%) | 56 (5.2%) |
| 25 to 29 Years | 57 (4.3%) | 32 (3.0%) |
| 30 to 34 Years | 57 (4.3%) | 16 (1.5%) |
| 35 to 39 Years | 72 (5.5%) | 46 (4.3%) |
| 40 to 44 Years | 69 (5.2%) | 63 (5.9%) |
| 45 to 49 Years | 34 (2.6%) | 53 (4.9%) |
| 50 to 54 Years | 56 (4.3%) | 78 (7.3%) |
| 55 to 59 Years | 116 (8.8%) | 61 (5.7%) |
| 60 to 64 Years | 124 (9.4%) | 93 (8.7%) |
| 65 to 69 Years | 73 (5.5%) | 101 (9.4%) |
| 70 to 74 Years | 99 (7.5%) | 60 (5.6%) |
| 75 to 79 Years | 45 (3.4%) | 58 (5.4%) |
| 80 to 84 Years | 87 (6.6%) | 43 (4.0%) |
| 85 Years and over | 40 (3.0%) | 31 (2.9%) |
| Total | 1,319 (100.0%) | 1,072 (100.0%) |
Families and Households in Kidder County
Median Family Size in Kidder County
The median family size in Kidder County is 2.94 persons per family, with single male/father families (27 | 4.5%) accounting for the largest median family size of 3.56 persons per family. On the other hand, single female/mother families (33 | 5.5%) represent the smallest median family size with 2.88 persons per family.
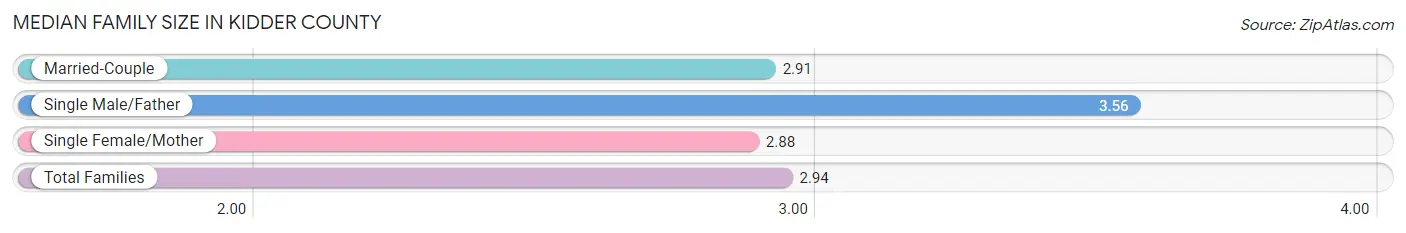
| Family Type | # Families | Family Size |
| Married-Couple | 544 (90.1%) | 2.91 |
| Single Male/Father | 27 (4.5%) | 3.56 |
| Single Female/Mother | 33 (5.5%) | 2.88 |
| Total Families | 604 (100.0%) | 2.94 |
Median Household Size in Kidder County
The median household size in Kidder County is 2.15 persons per household, with single male/father households (27 | 2.4%) accounting for the largest median household size of 3.85 persons per household. non-family households (507 | 45.6%) represent the smallest median household size with 1.04 persons per household.
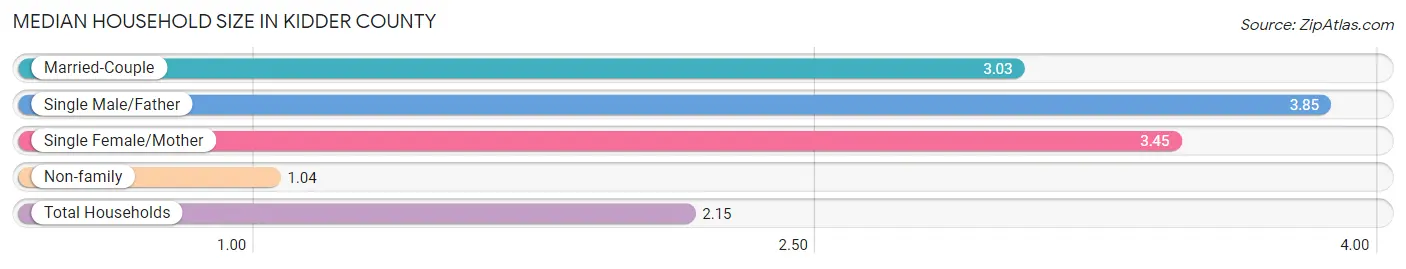
| Household Type | # Households | Household Size |
| Married-Couple | 544 (49.0%) | 3.03 |
| Single Male/Father | 27 (2.4%) | 3.85 |
| Single Female/Mother | 33 (3.0%) | 3.45 |
| Non-family | 507 (45.6%) | 1.04 |
| Total Households | 1,111 (100.0%) | 2.15 |
Household Size by Marriage Status in Kidder County
Out of a total of 1,111 households in Kidder County, 604 (54.4%) are family households, while 507 (45.6%) are nonfamily households. The most numerous type of family households are 2-person households, comprising 342, and the most common type of nonfamily households are 1-person households, comprising 492.
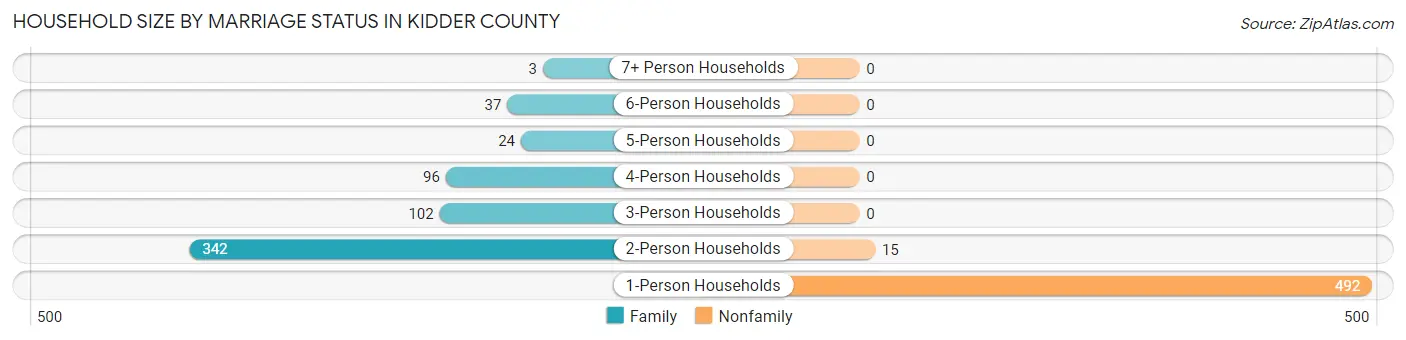
| Household Size | Family Households | Nonfamily Households |
| 1-Person Households | - | 492 (44.3%) |
| 2-Person Households | 342 (30.8%) | 15 (1.3%) |
| 3-Person Households | 102 (9.2%) | 0 (0.0%) |
| 4-Person Households | 96 (8.6%) | 0 (0.0%) |
| 5-Person Households | 24 (2.2%) | 0 (0.0%) |
| 6-Person Households | 37 (3.3%) | 0 (0.0%) |
| 7+ Person Households | 3 (0.3%) | 0 (0.0%) |
| Total | 604 (54.4%) | 507 (45.6%) |
Female Fertility in Kidder County
Fertility by Age in Kidder County
Average fertility rate in Kidder County is 101.0 births per 1,000 women. Women in the age bracket of 20 to 34 years have the highest fertility rate with 279.0 births per 1,000 women. Women in the age bracket of 20 to 34 years acount for 87.9% of all women with births.
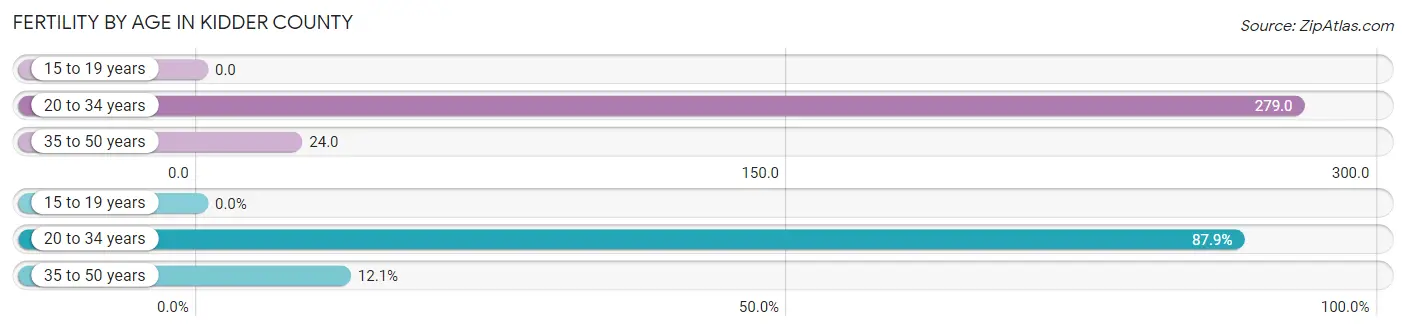
| Age Bracket | Women with Births | Births / 1,000 Women |
| 15 to 19 years | 0 (0.0%) | 0.0 |
| 20 to 34 years | 29 (87.9%) | 279.0 |
| 35 to 50 years | 4 (12.1%) | 24.0 |
| Total | 33 (100.0%) | 101.0 |
Fertility by Age by Marriage Status in Kidder County
75.8% of women with births (33) in Kidder County are married. The highest percentage of unmarried women with births falls into 20 to 34 years age bracket with 27.6% of them unmarried at the time of birth, while the lowest percentage of unmarried women with births belong to 35 to 50 years age bracket with 0.0% of them unmarried.
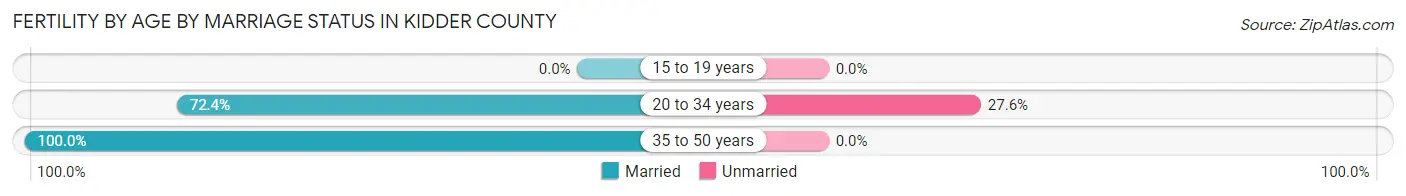
| Age Bracket | Married | Unmarried |
| 15 to 19 years | 0 (0.0%) | 0 (0.0%) |
| 20 to 34 years | 21 (72.4%) | 8 (27.6%) |
| 35 to 50 years | 4 (100.0%) | 0 (0.0%) |
| Total | 25 (75.8%) | 8 (24.2%) |
Fertility by Education in Kidder County
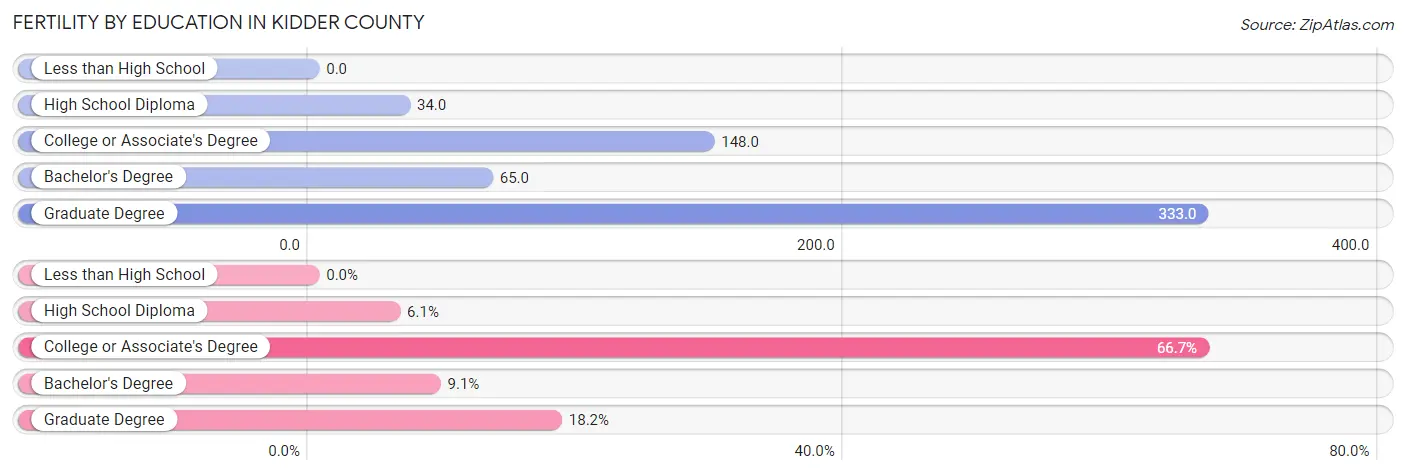
| Educational Attainment | Women with Births | Births / 1,000 Women |
| Less than High School | 0 (0.0%) | 0.0 |
| High School Diploma | 2 (6.1%) | 34.0 |
| College or Associate's Degree | 22 (66.7%) | 148.0 |
| Bachelor's Degree | 3 (9.1%) | 65.0 |
| Graduate Degree | 6 (18.2%) | 333.0 |
| Total | 33 (100.0%) | 101.0 |
Fertility by Education by Marriage Status in Kidder County
24.2% of women with births in Kidder County are unmarried. Women with the educational attainment of high school diploma are most likely to be married with 100.0% of them married at childbirth, while women with the educational attainment of college or associate's degree are least likely to be married with 36.4% of them unmarried at childbirth.
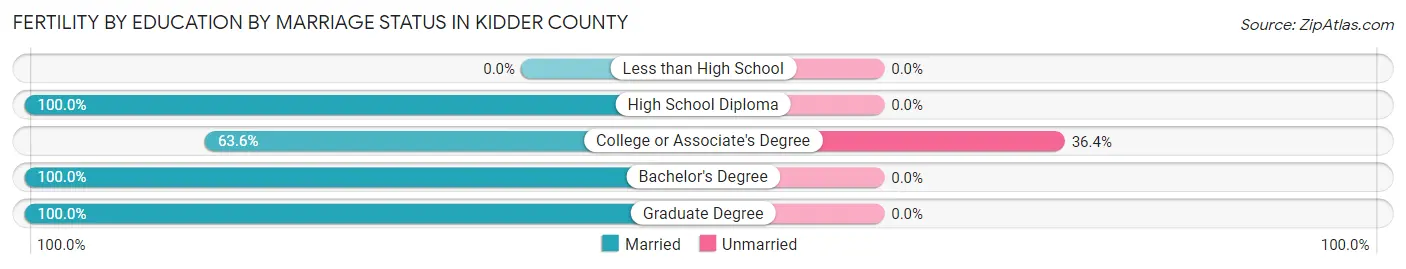
| Educational Attainment | Married | Unmarried |
| Less than High School | 0 (0.0%) | 0 (0.0%) |
| High School Diploma | 2 (100.0%) | 0 (0.0%) |
| College or Associate's Degree | 14 (63.6%) | 8 (36.4%) |
| Bachelor's Degree | 3 (100.0%) | 0 (0.0%) |
| Graduate Degree | 6 (100.0%) | 0 (0.0%) |
| Total | 25 (75.8%) | 8 (24.2%) |
Employment Characteristics in Kidder County
Employment by Class of Employer in Kidder County
Among the 1,009 employed individuals in Kidder County, private company employees (497 | 49.3%), self-employed (not incorporated) (210 | 20.8%), and not-for-profit organizations (134 | 13.3%) make up the most common classes of employment.
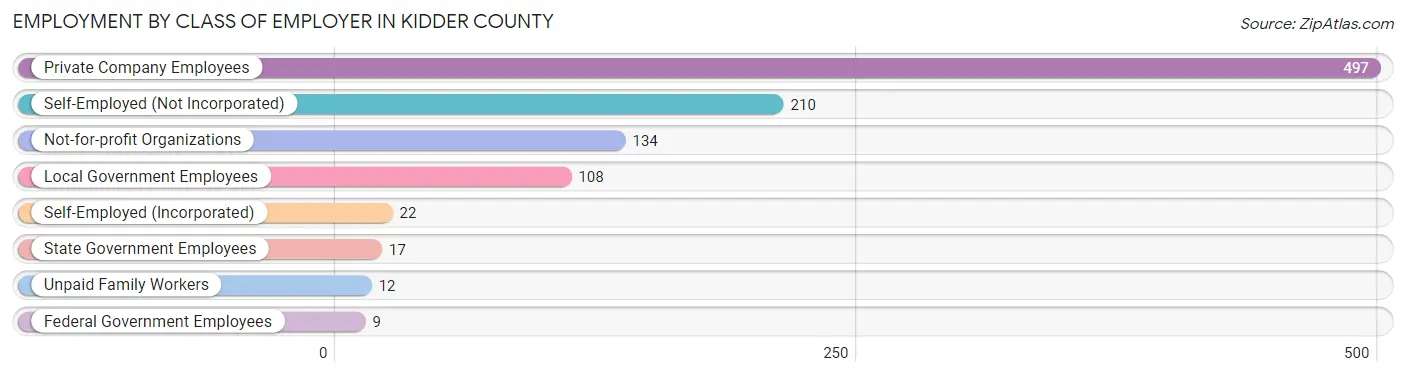
| Employer Class | # Employees | % Employees |
| Private Company Employees | 497 | 49.3% |
| Self-Employed (Incorporated) | 22 | 2.2% |
| Self-Employed (Not Incorporated) | 210 | 20.8% |
| Not-for-profit Organizations | 134 | 13.3% |
| Local Government Employees | 108 | 10.7% |
| State Government Employees | 17 | 1.7% |
| Federal Government Employees | 9 | 0.9% |
| Unpaid Family Workers | 12 | 1.2% |
| Total | 1,009 | 100.0% |
Employment Status by Age in Kidder County
According to the labor force statistics for Kidder County, out of the total population over 16 years of age (1,891), 55.1% or 1,042 individuals are in the labor force, with 1.0% or 10 of them unemployed. The age group with the highest labor force participation rate is 55 to 59 years, with 89.3% or 158 individuals in the labor force. Within the labor force, the 35 to 44 years age range has the highest percentage of unemployed individuals, with 2.7% or 6 of them being unemployed.
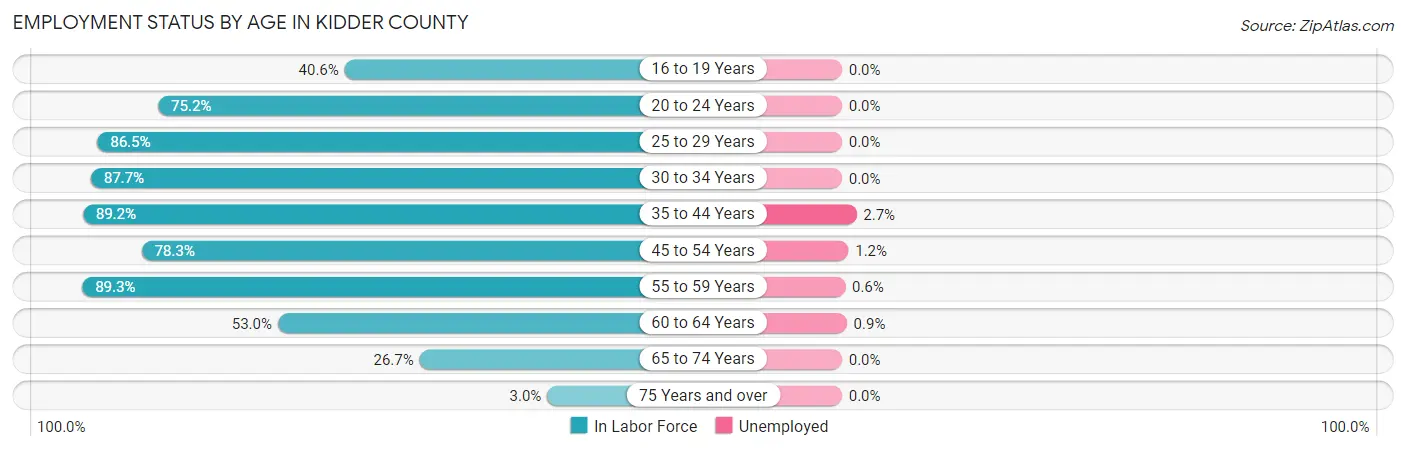
| Age Bracket | In Labor Force | Unemployed |
| 16 to 19 Years | 43 (40.6%) | 0 (0.0%) |
| 20 to 24 Years | 91 (75.2%) | 0 (0.0%) |
| 25 to 29 Years | 77 (86.5%) | 0 (0.0%) |
| 30 to 34 Years | 64 (87.7%) | 0 (0.0%) |
| 35 to 44 Years | 223 (89.2%) | 6 (2.7%) |
| 45 to 54 Years | 173 (78.3%) | 2 (1.2%) |
| 55 to 59 Years | 158 (89.3%) | 1 (0.6%) |
| 60 to 64 Years | 115 (53.0%) | 1 (0.9%) |
| 65 to 74 Years | 89 (26.7%) | 0 (0.0%) |
| 75 Years and over | 9 (3.0%) | 0 (0.0%) |
| Total | 1,042 (55.1%) | 10 (1.0%) |
Employment Status by Educational Attainment in Kidder County
According to labor force statistics for Kidder County, 78.9% of individuals (810) out of the total population between 25 and 64 years of age (1,027) are in the labor force, with 1.2% or 10 of them being unemployed. The group with the highest labor force participation rate are those with the educational attainment of high school diploma, with 82.4% or 238 individuals in the labor force. Within the labor force, individuals with college / associate degree education have the highest percentage of unemployment, with 2.5% or 9 of them being unemployed.
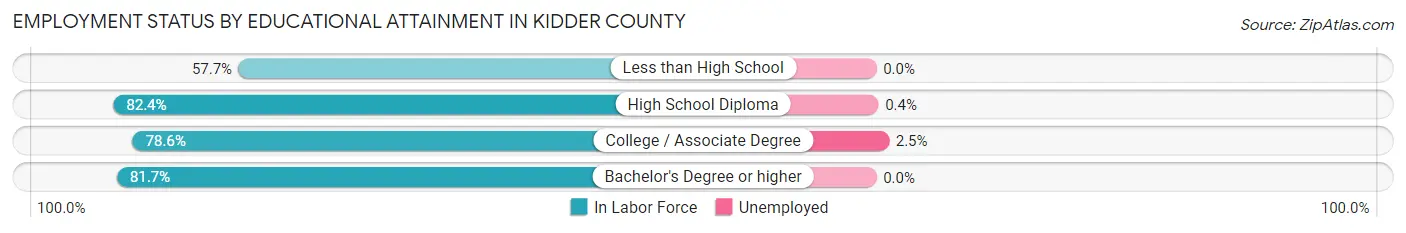
| Educational Attainment | In Labor Force | Unemployed |
| Less than High School | 41 (57.7%) | 0 (0.0%) |
| High School Diploma | 238 (82.4%) | 1 (0.4%) |
| College / Associate Degree | 353 (78.6%) | 11 (2.5%) |
| Bachelor's Degree or higher | 178 (81.7%) | 0 (0.0%) |
| Total | 810 (78.9%) | 12 (1.2%) |
Employment Occupations by Sex in Kidder County
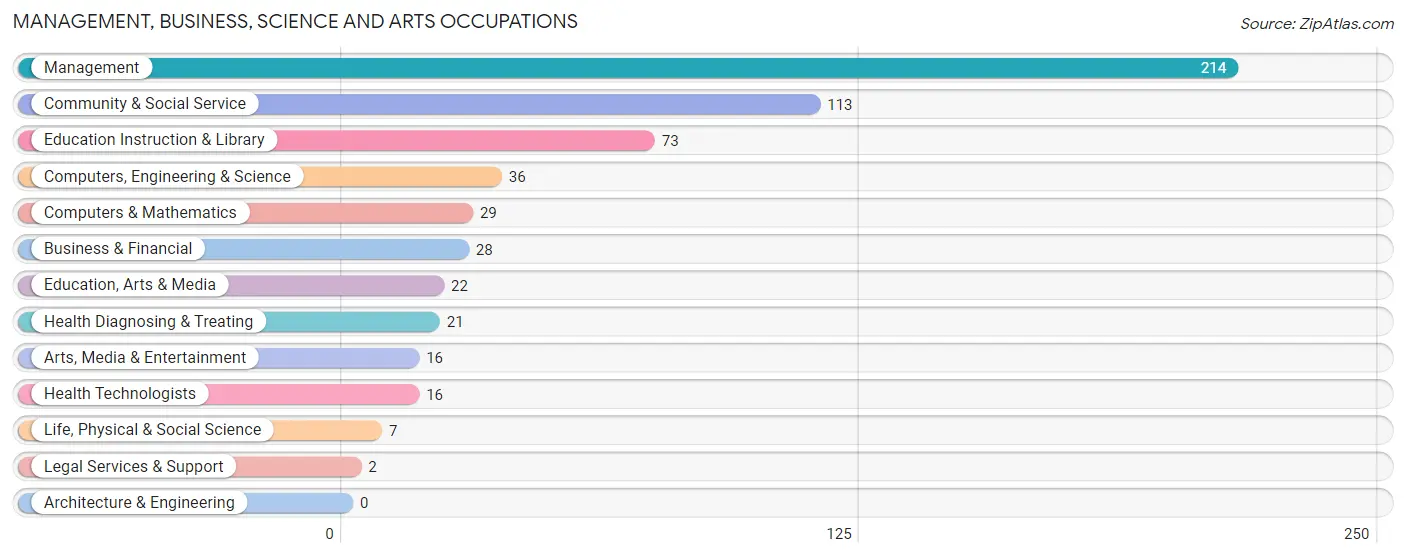
Management, Business, Science and Arts Occupations
The most common Management, Business, Science and Arts occupations in Kidder County are Management (214 | 20.7%), Community & Social Service (113 | 11.0%), Education Instruction & Library (73 | 7.1%), Computers, Engineering & Science (36 | 3.5%), and Computers & Mathematics (29 | 2.8%).
Management, Business, Science and Arts Occupations by Sex
Within the Management, Business, Science and Arts occupations in Kidder County, the most male-oriented occupations are Computers & Mathematics (100.0%), Legal Services & Support (100.0%), and Computers, Engineering & Science (94.4%), while the most female-oriented occupations are Arts, Media & Entertainment (100.0%), Education Instruction & Library (95.9%), and Business & Financial (92.9%).
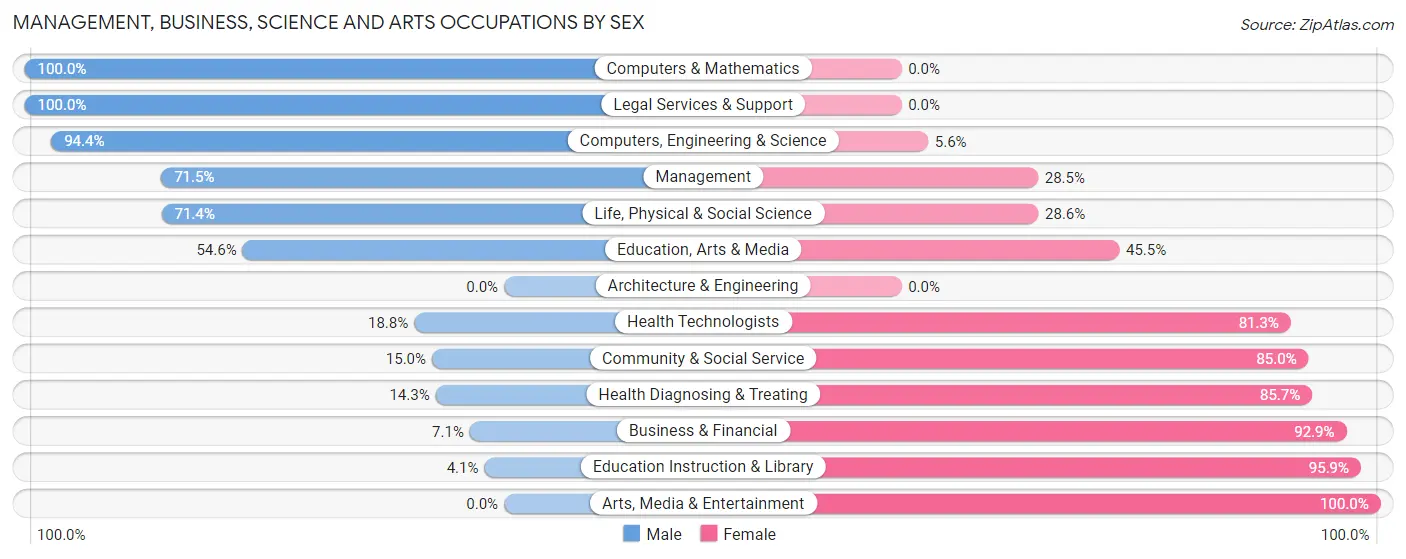
| Occupation | Male | Female |
| Management | 153 (71.5%) | 61 (28.5%) |
| Business & Financial | 2 (7.1%) | 26 (92.9%) |
| Computers, Engineering & Science | 34 (94.4%) | 2 (5.6%) |
| Computers & Mathematics | 29 (100.0%) | 0 (0.0%) |
| Architecture & Engineering | 0 (0.0%) | 0 (0.0%) |
| Life, Physical & Social Science | 5 (71.4%) | 2 (28.6%) |
| Community & Social Service | 17 (15.0%) | 96 (85.0%) |
| Education, Arts & Media | 12 (54.5%) | 10 (45.5%) |
| Legal Services & Support | 2 (100.0%) | 0 (0.0%) |
| Education Instruction & Library | 3 (4.1%) | 70 (95.9%) |
| Arts, Media & Entertainment | 0 (0.0%) | 16 (100.0%) |
| Health Diagnosing & Treating | 3 (14.3%) | 18 (85.7%) |
| Health Technologists | 3 (18.8%) | 13 (81.2%) |
| Total (Category) | 209 (50.7%) | 203 (49.3%) |
| Total (Overall) | 628 (60.9%) | 404 (39.2%) |
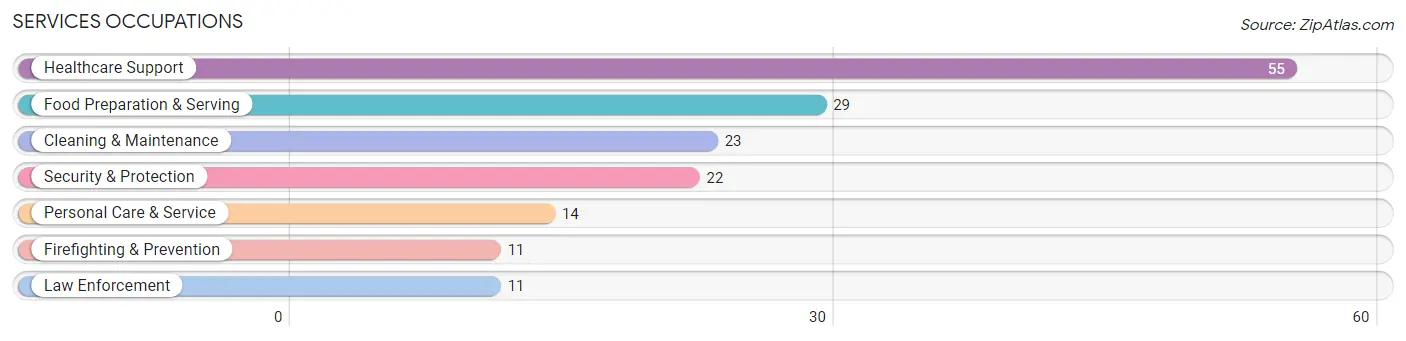
Services Occupations
The most common Services occupations in Kidder County are Healthcare Support (55 | 5.3%), Food Preparation & Serving (29 | 2.8%), Cleaning & Maintenance (23 | 2.2%), Security & Protection (22 | 2.1%), and Personal Care & Service (14 | 1.4%).
Services Occupations by Sex
Within the Services occupations in Kidder County, the most male-oriented occupations are Security & Protection (100.0%), Firefighting & Prevention (100.0%), and Law Enforcement (100.0%), while the most female-oriented occupations are Food Preparation & Serving (100.0%), Personal Care & Service (100.0%), and Cleaning & Maintenance (82.6%).
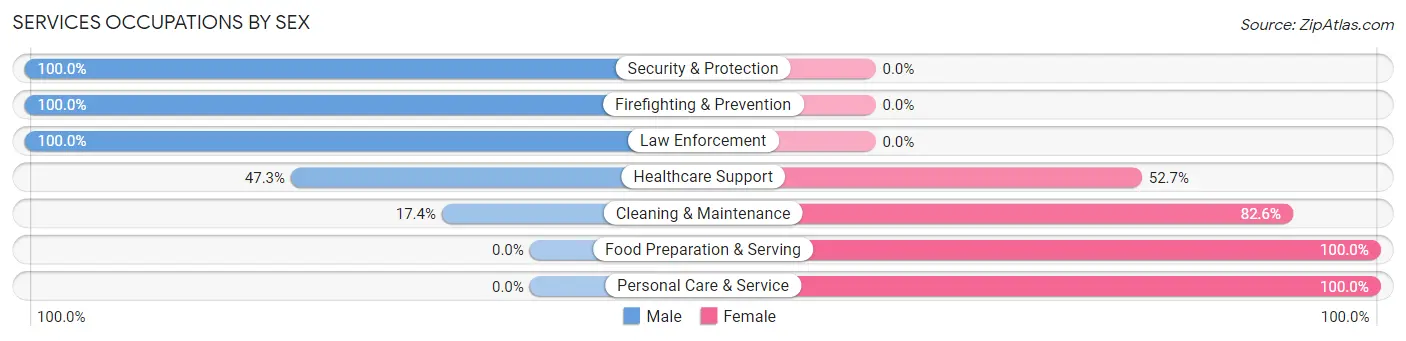
| Occupation | Male | Female |
| Healthcare Support | 26 (47.3%) | 29 (52.7%) |
| Security & Protection | 22 (100.0%) | 0 (0.0%) |
| Firefighting & Prevention | 11 (100.0%) | 0 (0.0%) |
| Law Enforcement | 11 (100.0%) | 0 (0.0%) |
| Food Preparation & Serving | 0 (0.0%) | 29 (100.0%) |
| Cleaning & Maintenance | 4 (17.4%) | 19 (82.6%) |
| Personal Care & Service | 0 (0.0%) | 14 (100.0%) |
| Total (Category) | 52 (36.4%) | 91 (63.6%) |
| Total (Overall) | 628 (60.9%) | 404 (39.2%) |
Sales and Office Occupations
The most common Sales and Office occupations in Kidder County are Sales & Related (108 | 10.5%), and Office & Administration (48 | 4.6%).
Sales and Office Occupations by Sex
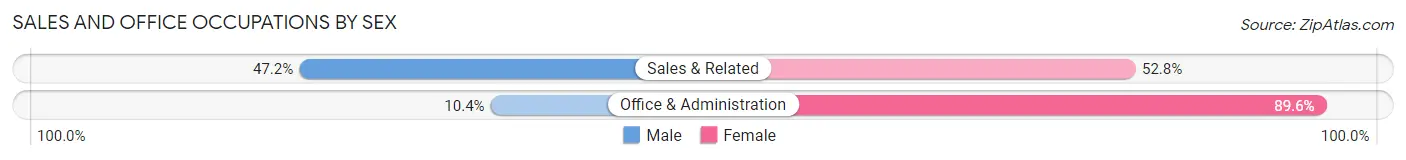
| Occupation | Male | Female |
| Sales & Related | 51 (47.2%) | 57 (52.8%) |
| Office & Administration | 5 (10.4%) | 43 (89.6%) |
| Total (Category) | 56 (35.9%) | 100 (64.1%) |
| Total (Overall) | 628 (60.9%) | 404 (39.2%) |
Natural Resources, Construction and Maintenance Occupations
The most common Natural Resources, Construction and Maintenance occupations in Kidder County are Farming, Fishing & Forestry (71 | 6.9%), Installation, Maintenance & Repair (67 | 6.5%), and Construction & Extraction (45 | 4.4%).
Natural Resources, Construction and Maintenance Occupations by Sex
| Occupation | Male | Female |
| Farming, Fishing & Forestry | 68 (95.8%) | 3 (4.2%) |
| Construction & Extraction | 45 (100.0%) | 0 (0.0%) |
| Installation, Maintenance & Repair | 67 (100.0%) | 0 (0.0%) |
| Total (Category) | 180 (98.4%) | 3 (1.6%) |
| Total (Overall) | 628 (60.9%) | 404 (39.2%) |
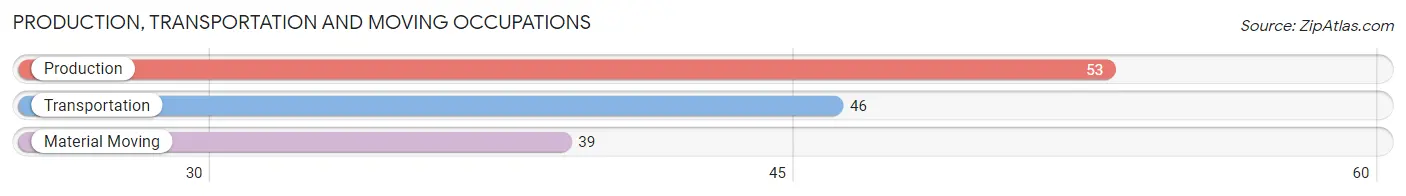
Production, Transportation and Moving Occupations
The most common Production, Transportation and Moving occupations in Kidder County are Production (53 | 5.1%), Transportation (46 | 4.5%), and Material Moving (39 | 3.8%).
Production, Transportation and Moving Occupations by Sex
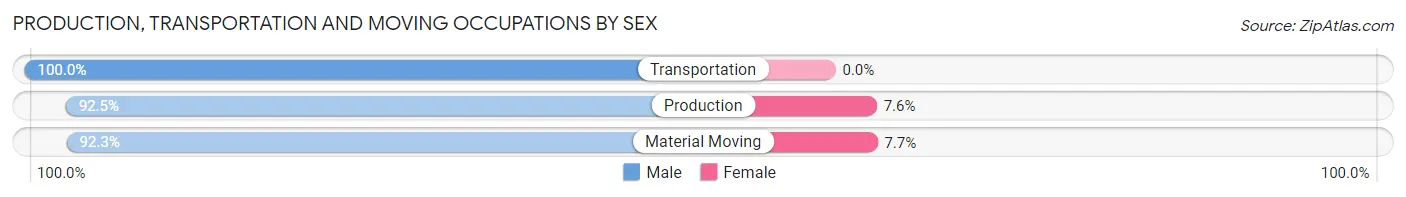
| Occupation | Male | Female |
| Production | 49 (92.4%) | 4 (7.5%) |
| Transportation | 46 (100.0%) | 0 (0.0%) |
| Material Moving | 36 (92.3%) | 3 (7.7%) |
| Total (Category) | 131 (94.9%) | 7 (5.1%) |
| Total (Overall) | 628 (60.9%) | 404 (39.2%) |
Employment Industries by Sex in Kidder County
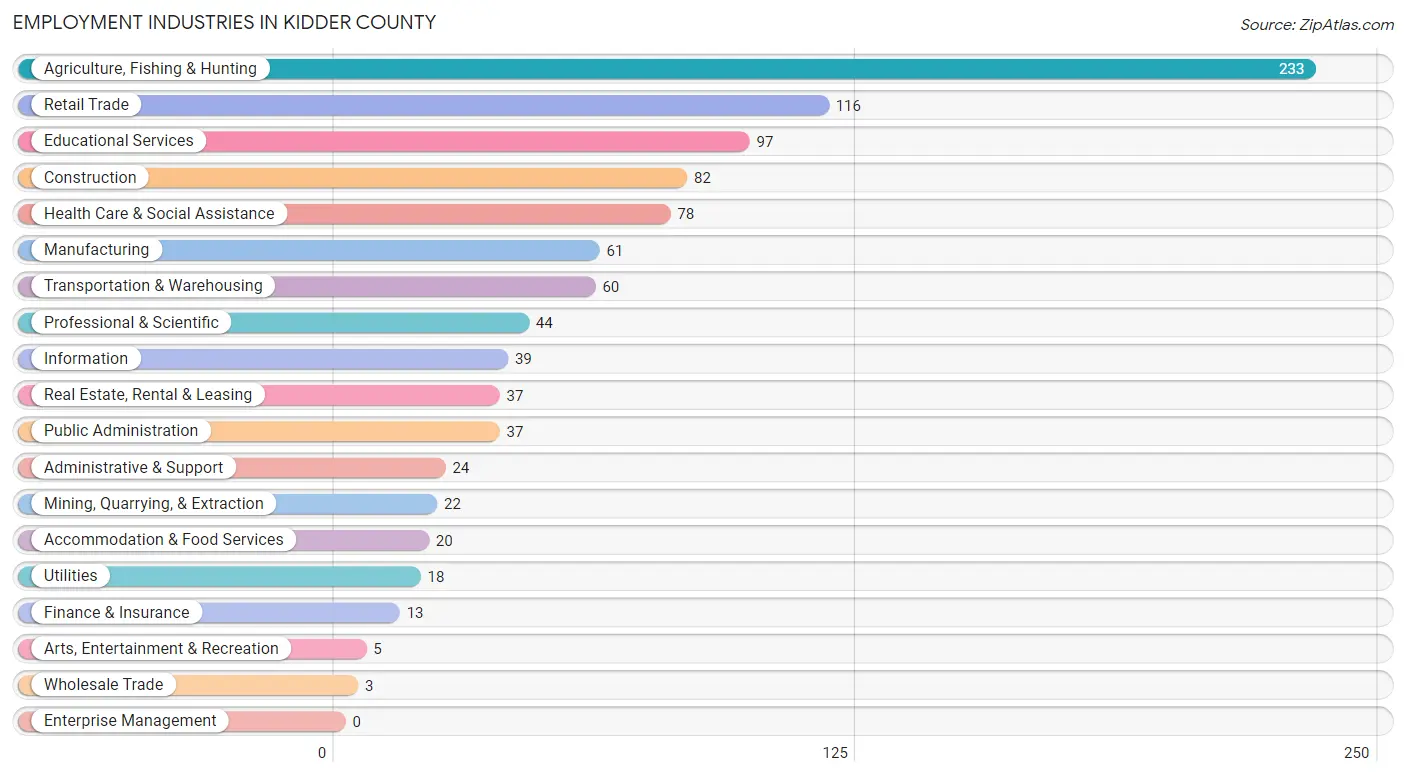
Employment Industries in Kidder County
The major employment industries in Kidder County include Agriculture, Fishing & Hunting (233 | 22.6%), Retail Trade (116 | 11.2%), Educational Services (97 | 9.4%), Construction (82 | 8.0%), and Health Care & Social Assistance (78 | 7.6%).
Employment Industries by Sex in Kidder County
The Kidder County industries that see more men than women are Mining, Quarrying, & Extraction (100.0%), Construction (100.0%), and Wholesale Trade (100.0%), whereas the industries that tend to have a higher number of women are Finance & Insurance (100.0%), Arts, Entertainment & Recreation (100.0%), and Accommodation & Food Services (100.0%).
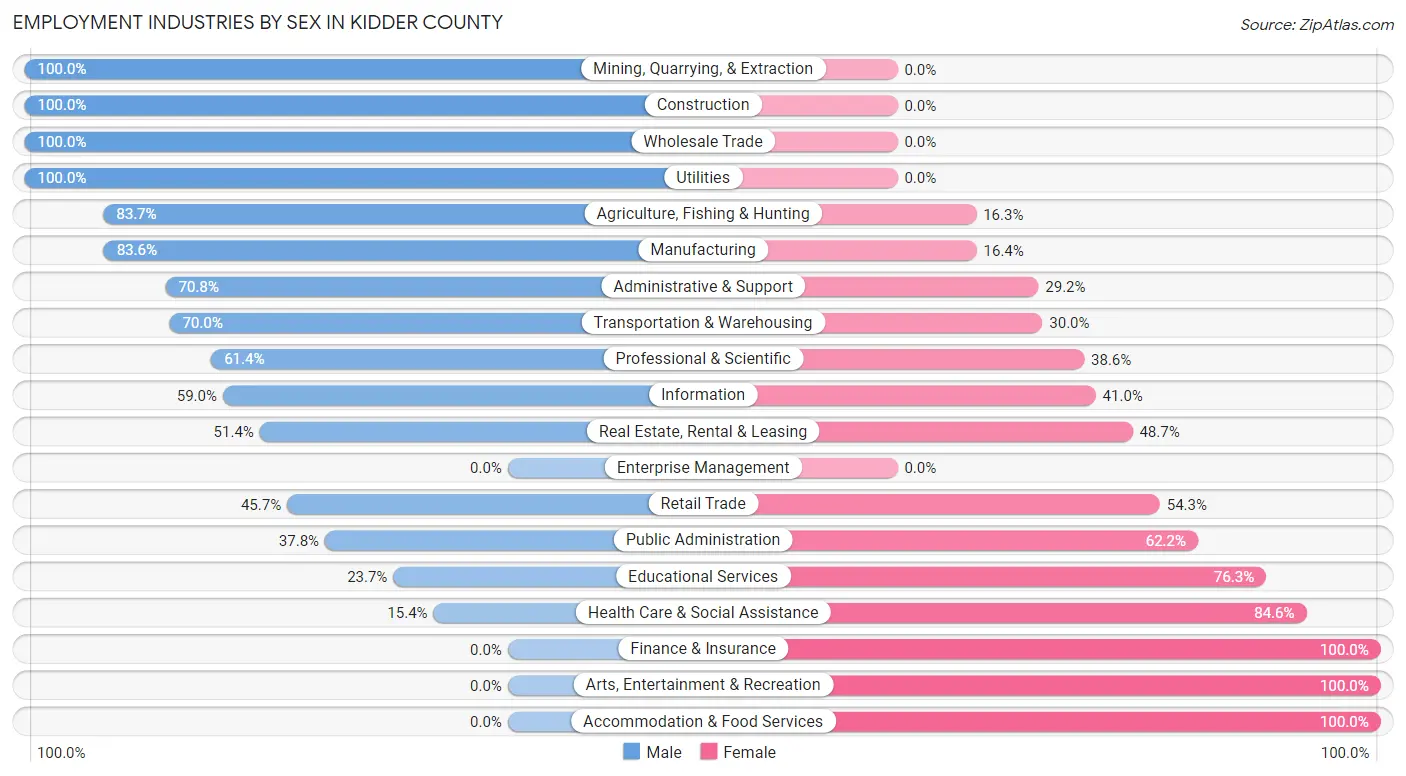
| Industry | Male | Female |
| Agriculture, Fishing & Hunting | 195 (83.7%) | 38 (16.3%) |
| Mining, Quarrying, & Extraction | 22 (100.0%) | 0 (0.0%) |
| Construction | 82 (100.0%) | 0 (0.0%) |
| Manufacturing | 51 (83.6%) | 10 (16.4%) |
| Wholesale Trade | 3 (100.0%) | 0 (0.0%) |
| Retail Trade | 53 (45.7%) | 63 (54.3%) |
| Transportation & Warehousing | 42 (70.0%) | 18 (30.0%) |
| Utilities | 18 (100.0%) | 0 (0.0%) |
| Information | 23 (59.0%) | 16 (41.0%) |
| Finance & Insurance | 0 (0.0%) | 13 (100.0%) |
| Real Estate, Rental & Leasing | 19 (51.3%) | 18 (48.6%) |
| Professional & Scientific | 27 (61.4%) | 17 (38.6%) |
| Enterprise Management | 0 (0.0%) | 0 (0.0%) |
| Administrative & Support | 17 (70.8%) | 7 (29.2%) |
| Educational Services | 23 (23.7%) | 74 (76.3%) |
| Health Care & Social Assistance | 12 (15.4%) | 66 (84.6%) |
| Arts, Entertainment & Recreation | 0 (0.0%) | 5 (100.0%) |
| Accommodation & Food Services | 0 (0.0%) | 20 (100.0%) |
| Public Administration | 14 (37.8%) | 23 (62.2%) |
| Total | 628 (60.9%) | 404 (39.2%) |
Education in Kidder County
School Enrollment in Kidder County
The most common levels of schooling among the 469 students in Kidder County are high school (152 | 32.4%), middle school (123 | 26.2%), and elementary school (88 | 18.8%).
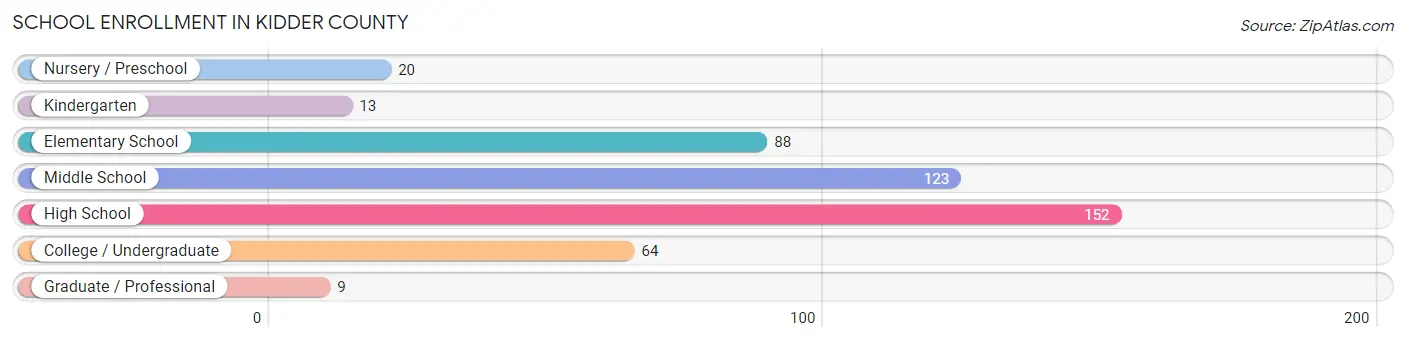
| School Level | # Students | % Students |
| Nursery / Preschool | 20 | 4.3% |
| Kindergarten | 13 | 2.8% |
| Elementary School | 88 | 18.8% |
| Middle School | 123 | 26.2% |
| High School | 152 | 32.4% |
| College / Undergraduate | 64 | 13.7% |
| Graduate / Professional | 9 | 1.9% |
| Total | 469 | 100.0% |
School Enrollment by Age by Funding Source in Kidder County
Out of a total of 469 students who are enrolled in schools in Kidder County, 12 (2.6%) attend a private institution, while the remaining 457 (97.4%) are enrolled in public schools. The age group of 5 to 9 year old has the highest likelihood of being enrolled in private schools, with 5 (5.3% in the age bracket) enrolled. Conversely, the age group of 3 to 4 year olds has the lowest likelihood of being enrolled in a private school, with 12 (100.0% in the age bracket) attending a public institution.
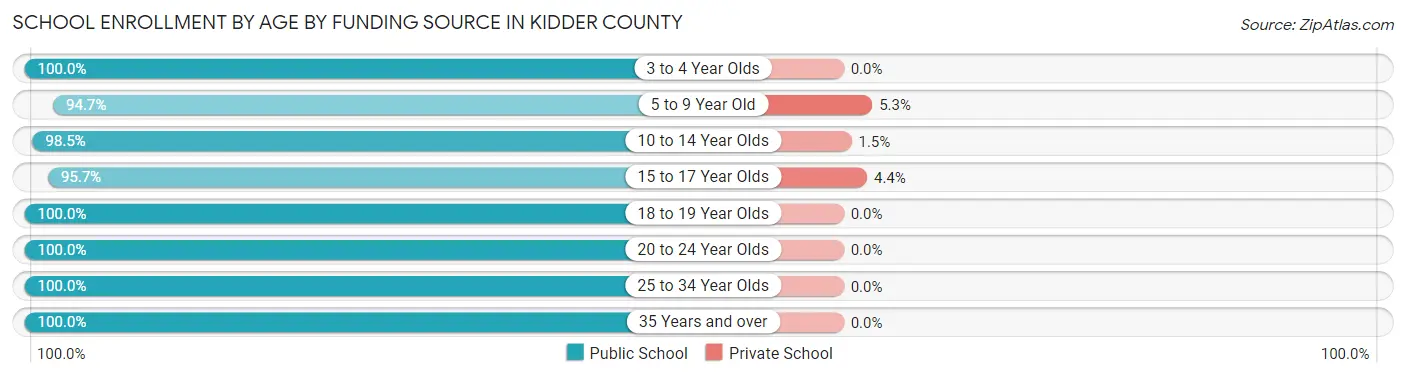
| Age Bracket | Public School | Private School |
| 3 to 4 Year Olds | 12 (100.0%) | 0 (0.0%) |
| 5 to 9 Year Old | 89 (94.7%) | 5 (5.3%) |
| 10 to 14 Year Olds | 135 (98.5%) | 2 (1.5%) |
| 15 to 17 Year Olds | 110 (95.7%) | 5 (4.3%) |
| 18 to 19 Year Olds | 38 (100.0%) | 0 (0.0%) |
| 20 to 24 Year Olds | 57 (100.0%) | 0 (0.0%) |
| 25 to 34 Year Olds | 4 (100.0%) | 0 (0.0%) |
| 35 Years and over | 12 (100.0%) | 0 (0.0%) |
| Total | 457 (97.4%) | 12 (2.6%) |
Educational Attainment by Field of Study in Kidder County
Education (102 | 30.5%), arts & humanities (43 | 12.9%), bio, nature & agricultural (35 | 10.5%), science & technology (35 | 10.5%), and social sciences (28 | 8.4%) are the most common fields of study among 334 individuals in Kidder County who have obtained a bachelor's degree or higher.
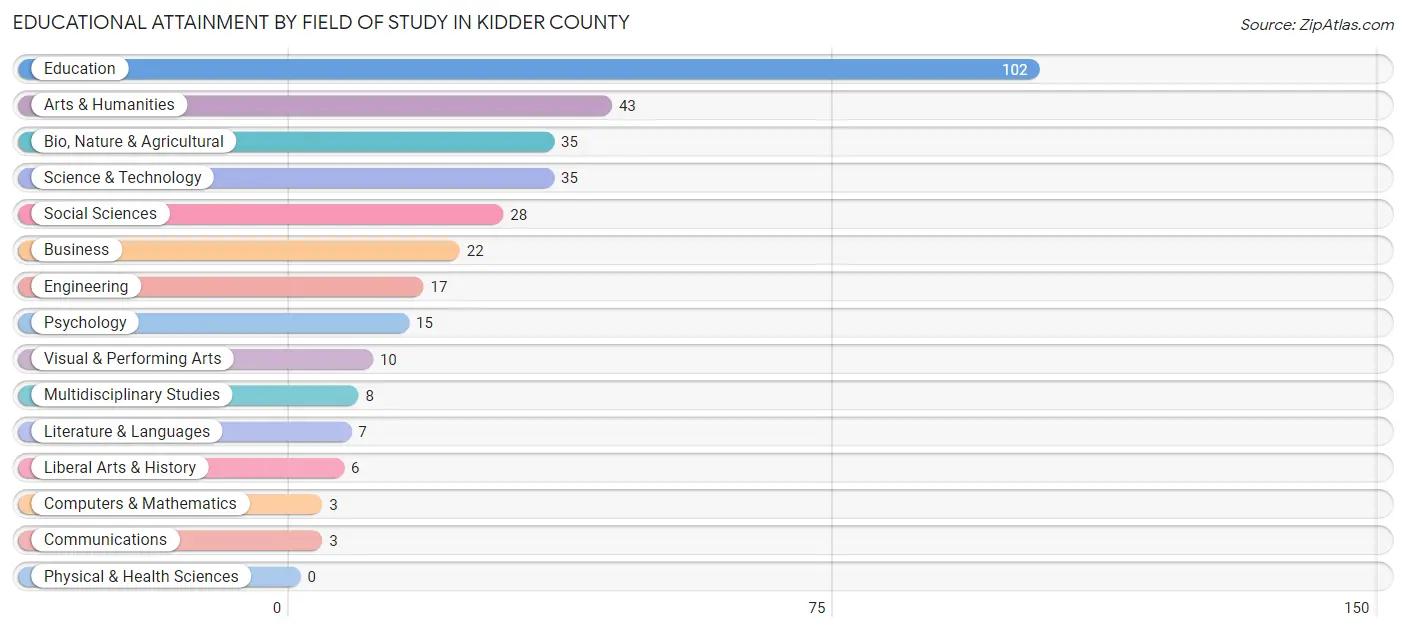
| Field of Study | # Graduates | % Graduates |
| Computers & Mathematics | 3 | 0.9% |
| Bio, Nature & Agricultural | 35 | 10.5% |
| Physical & Health Sciences | 0 | 0.0% |
| Psychology | 15 | 4.5% |
| Social Sciences | 28 | 8.4% |
| Engineering | 17 | 5.1% |
| Multidisciplinary Studies | 8 | 2.4% |
| Science & Technology | 35 | 10.5% |
| Business | 22 | 6.6% |
| Education | 102 | 30.5% |
| Literature & Languages | 7 | 2.1% |
| Liberal Arts & History | 6 | 1.8% |
| Visual & Performing Arts | 10 | 3.0% |
| Communications | 3 | 0.9% |
| Arts & Humanities | 43 | 12.9% |
| Total | 334 | 100.0% |
Transportation & Commute in Kidder County
Vehicle Availability by Sex in Kidder County
The most prevalent vehicle ownership categories in Kidder County are males with 2 vehicles (252, accounting for 40.6%) and females with 2 vehicles (136, making up 64.8%).
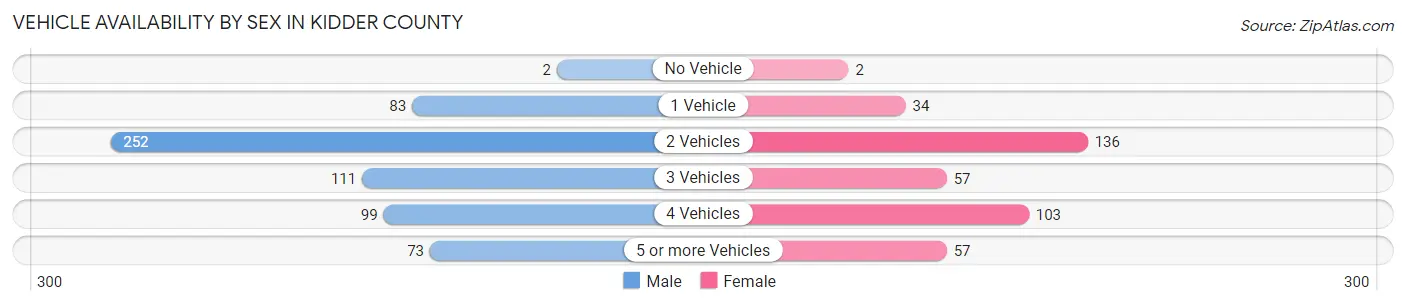
| Vehicles Available | Male | Female |
| No Vehicle | 2 (0.3%) | 2 (0.5%) |
| 1 Vehicle | 83 (13.4%) | 34 (8.7%) |
| 2 Vehicles | 252 (40.6%) | 136 (35.0%) |
| 3 Vehicles | 111 (17.9%) | 57 (14.6%) |
| 4 Vehicles | 99 (16.0%) | 103 (26.5%) |
| 5 or more Vehicles | 73 (11.8%) | 57 (14.6%) |
| Total | 620 (100.0%) | 389 (100.0%) |
Commute Time in Kidder County
The most frequently occuring commute durations in Kidder County are less than 5 minutes (200 commuters, 23.4%), 5 to 9 minutes (143 commuters, 16.7%), and 30 to 34 minutes (124 commuters, 14.5%).
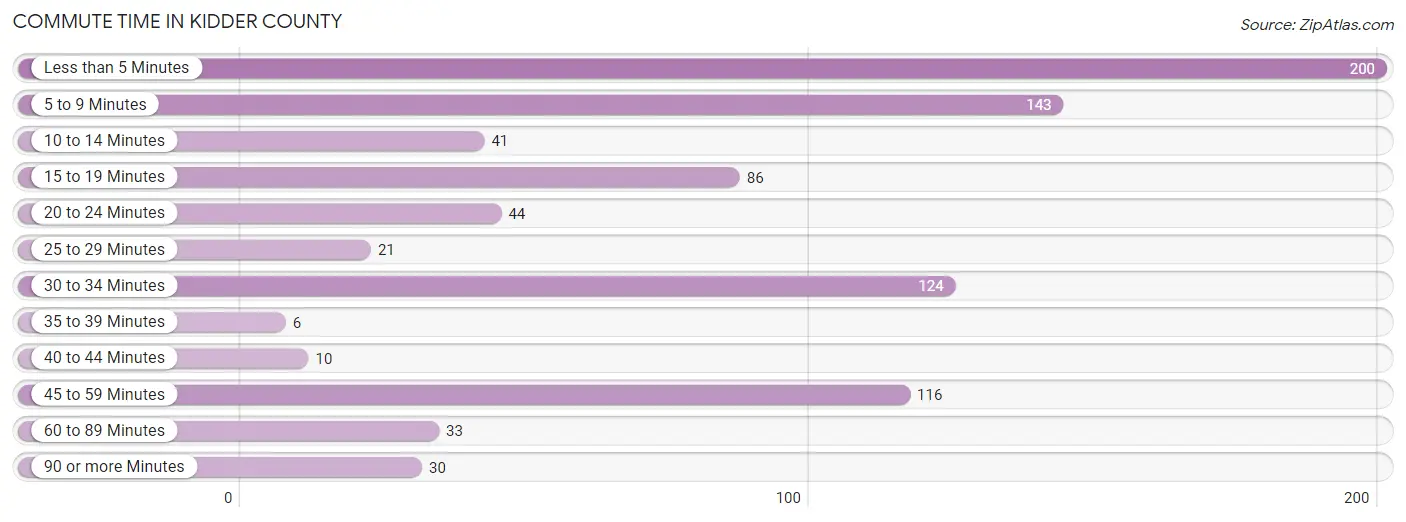
| Commute Time | # Commuters | % Commuters |
| Less than 5 Minutes | 200 | 23.4% |
| 5 to 9 Minutes | 143 | 16.7% |
| 10 to 14 Minutes | 41 | 4.8% |
| 15 to 19 Minutes | 86 | 10.1% |
| 20 to 24 Minutes | 44 | 5.1% |
| 25 to 29 Minutes | 21 | 2.5% |
| 30 to 34 Minutes | 124 | 14.5% |
| 35 to 39 Minutes | 6 | 0.7% |
| 40 to 44 Minutes | 10 | 1.2% |
| 45 to 59 Minutes | 116 | 13.6% |
| 60 to 89 Minutes | 33 | 3.9% |
| 90 or more Minutes | 30 | 3.5% |
Commute Time by Sex in Kidder County
The most common commute times in Kidder County are 5 to 9 minutes (110 commuters, 20.3%) for males and less than 5 minutes (98 commuters, 31.5%) for females.
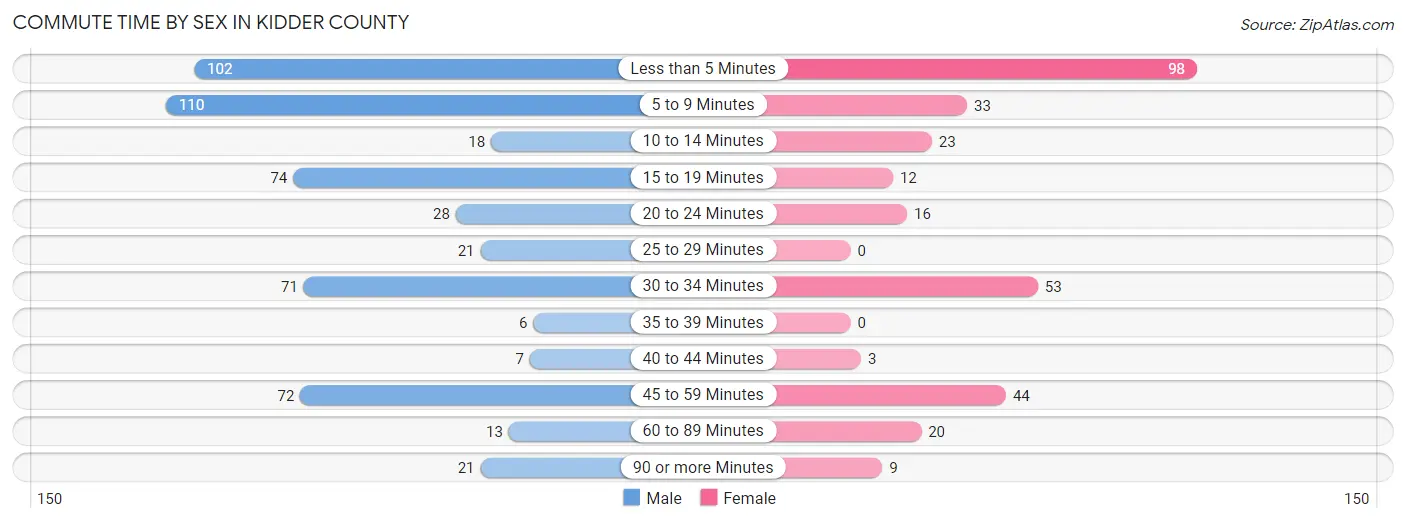
| Commute Time | Male | Female |
| Less than 5 Minutes | 102 (18.8%) | 98 (31.5%) |
| 5 to 9 Minutes | 110 (20.3%) | 33 (10.6%) |
| 10 to 14 Minutes | 18 (3.3%) | 23 (7.4%) |
| 15 to 19 Minutes | 74 (13.6%) | 12 (3.9%) |
| 20 to 24 Minutes | 28 (5.2%) | 16 (5.1%) |
| 25 to 29 Minutes | 21 (3.9%) | 0 (0.0%) |
| 30 to 34 Minutes | 71 (13.1%) | 53 (17.0%) |
| 35 to 39 Minutes | 6 (1.1%) | 0 (0.0%) |
| 40 to 44 Minutes | 7 (1.3%) | 3 (1.0%) |
| 45 to 59 Minutes | 72 (13.3%) | 44 (14.1%) |
| 60 to 89 Minutes | 13 (2.4%) | 20 (6.4%) |
| 90 or more Minutes | 21 (3.9%) | 9 (2.9%) |
Time of Departure to Work by Sex in Kidder County
The most frequent times of departure to work in Kidder County are 7:30 AM to 7:59 AM (109, 20.1%) for males and 7:00 AM to 7:29 AM (60, 19.3%) for females.
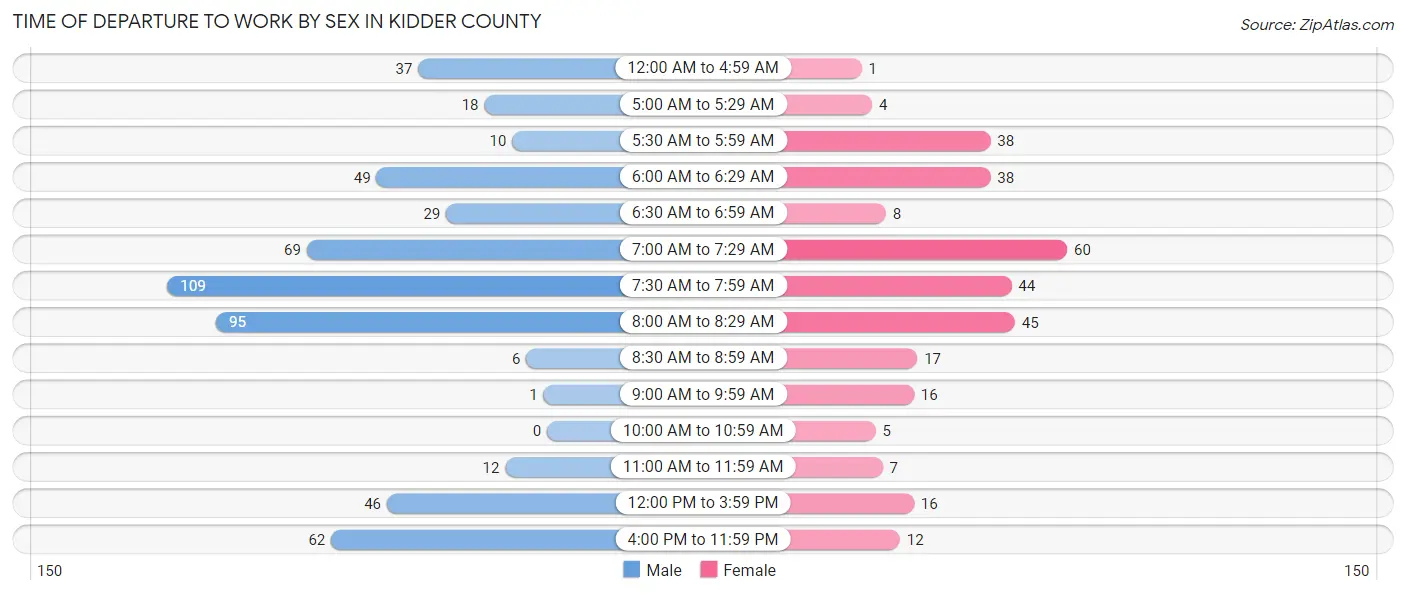
| Time of Departure | Male | Female |
| 12:00 AM to 4:59 AM | 37 (6.8%) | 1 (0.3%) |
| 5:00 AM to 5:29 AM | 18 (3.3%) | 4 (1.3%) |
| 5:30 AM to 5:59 AM | 10 (1.8%) | 38 (12.2%) |
| 6:00 AM to 6:29 AM | 49 (9.0%) | 38 (12.2%) |
| 6:30 AM to 6:59 AM | 29 (5.3%) | 8 (2.6%) |
| 7:00 AM to 7:29 AM | 69 (12.7%) | 60 (19.3%) |
| 7:30 AM to 7:59 AM | 109 (20.1%) | 44 (14.1%) |
| 8:00 AM to 8:29 AM | 95 (17.5%) | 45 (14.5%) |
| 8:30 AM to 8:59 AM | 6 (1.1%) | 17 (5.5%) |
| 9:00 AM to 9:59 AM | 1 (0.2%) | 16 (5.1%) |
| 10:00 AM to 10:59 AM | 0 (0.0%) | 5 (1.6%) |
| 11:00 AM to 11:59 AM | 12 (2.2%) | 7 (2.2%) |
| 12:00 PM to 3:59 PM | 46 (8.5%) | 16 (5.1%) |
| 4:00 PM to 11:59 PM | 62 (11.4%) | 12 (3.9%) |
| Total | 543 (100.0%) | 311 (100.0%) |
Housing Occupancy in Kidder County
Occupancy by Ownership in Kidder County
Of the total 1,111 dwellings in Kidder County, owner-occupied units account for 826 (74.4%), while renter-occupied units make up 285 (25.7%).
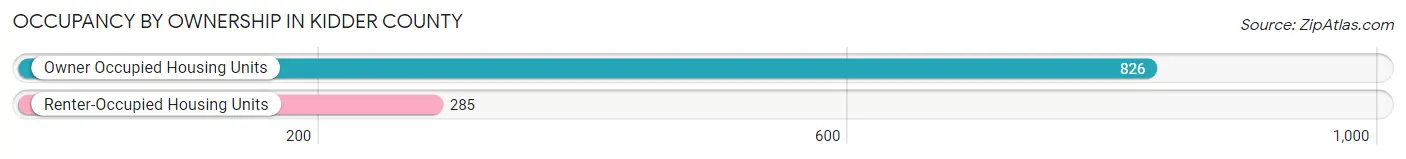
| Occupancy | # Housing Units | % Housing Units |
| Owner Occupied Housing Units | 826 | 74.4% |
| Renter-Occupied Housing Units | 285 | 25.7% |
| Total Occupied Housing Units | 1,111 | 100.0% |
Occupancy by Household Size in Kidder County
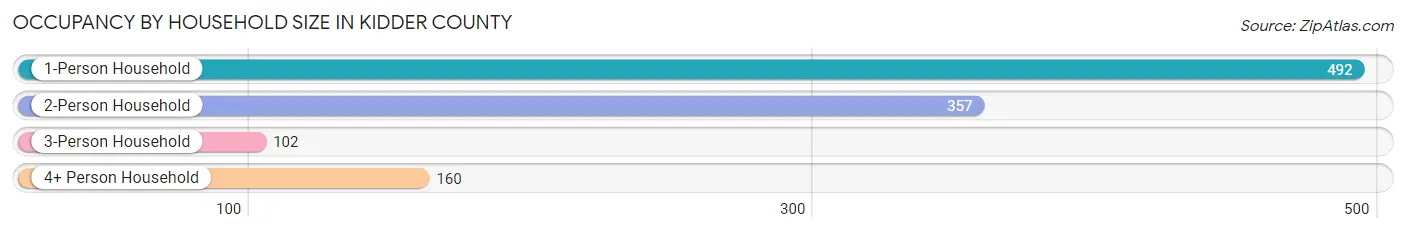
| Household Size | # Housing Units | % Housing Units |
| 1-Person Household | 492 | 44.3% |
| 2-Person Household | 357 | 32.1% |
| 3-Person Household | 102 | 9.2% |
| 4+ Person Household | 160 | 14.4% |
| Total Housing Units | 1,111 | 100.0% |
Occupancy by Ownership by Household Size in Kidder County
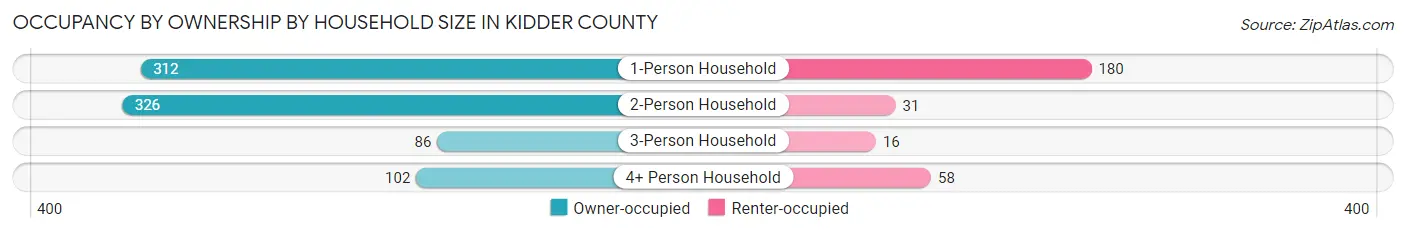
| Household Size | Owner-occupied | Renter-occupied |
| 1-Person Household | 312 (63.4%) | 180 (36.6%) |
| 2-Person Household | 326 (91.3%) | 31 (8.7%) |
| 3-Person Household | 86 (84.3%) | 16 (15.7%) |
| 4+ Person Household | 102 (63.7%) | 58 (36.2%) |
| Total Housing Units | 826 (74.4%) | 285 (25.7%) |
Occupancy by Educational Attainment in Kidder County
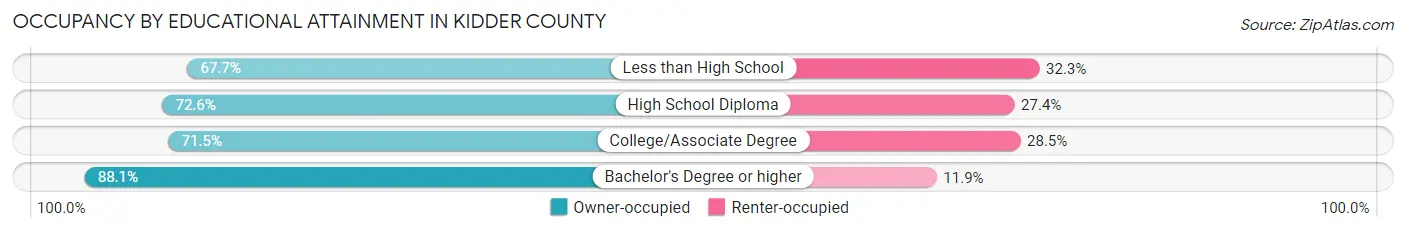
| Household Size | Owner-occupied | Renter-occupied |
| Less than High School | 88 (67.7%) | 42 (32.3%) |
| High School Diploma | 223 (72.6%) | 84 (27.4%) |
| College/Associate Degree | 338 (71.5%) | 135 (28.5%) |
| Bachelor's Degree or higher | 177 (88.1%) | 24 (11.9%) |
Occupancy by Age of Householder in Kidder County
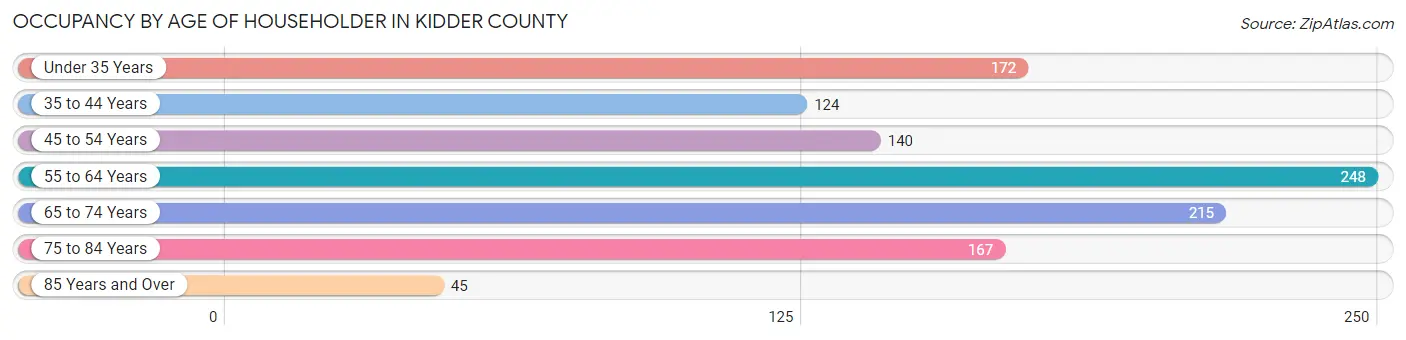
| Age Bracket | # Households | % Households |
| Under 35 Years | 172 | 15.5% |
| 35 to 44 Years | 124 | 11.2% |
| 45 to 54 Years | 140 | 12.6% |
| 55 to 64 Years | 248 | 22.3% |
| 65 to 74 Years | 215 | 19.4% |
| 75 to 84 Years | 167 | 15.0% |
| 85 Years and Over | 45 | 4.1% |
| Total | 1,111 | 100.0% |
Housing Finances in Kidder County
Median Income by Occupancy in Kidder County
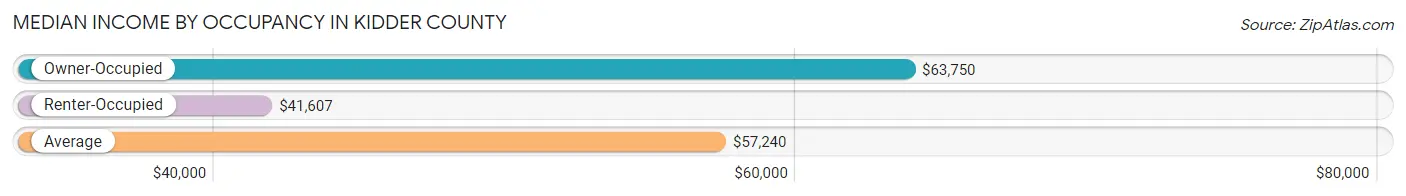
| Occupancy Type | # Households | Median Income |
| Owner-Occupied | 826 (74.4%) | $63,750 |
| Renter-Occupied | 285 (25.7%) | $41,607 |
| Average | 1,111 (100.0%) | $57,240 |
Occupancy by Householder Income Bracket in Kidder County
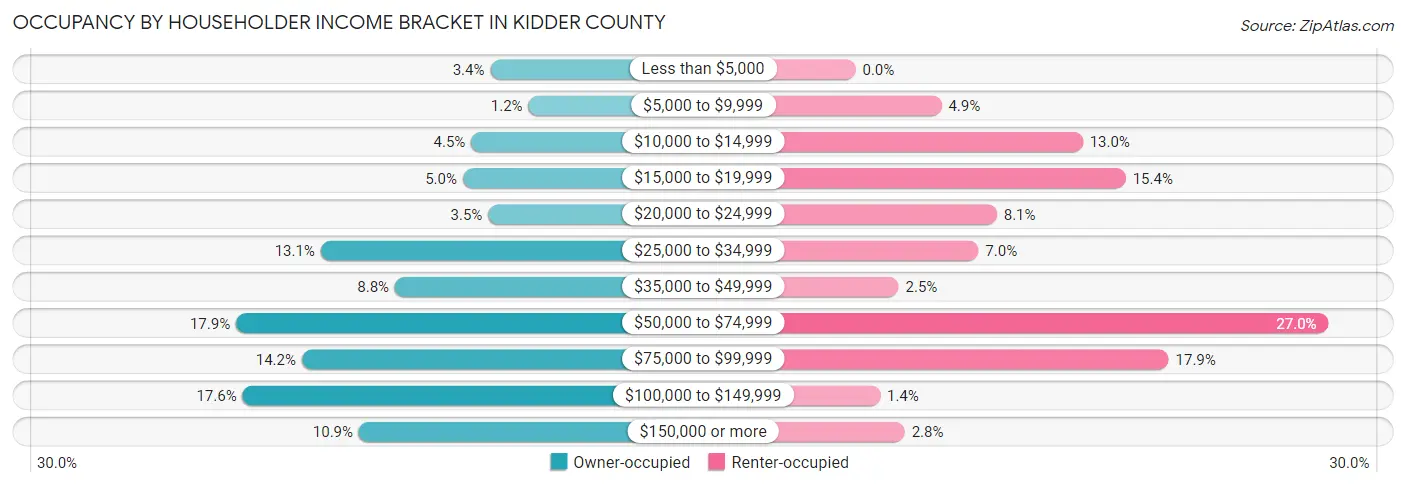
| Income Bracket | Owner-occupied | Renter-occupied |
| Less than $5,000 | 28 (3.4%) | 0 (0.0%) |
| $5,000 to $9,999 | 10 (1.2%) | 14 (4.9%) |
| $10,000 to $14,999 | 37 (4.5%) | 37 (13.0%) |
| $15,000 to $19,999 | 41 (5.0%) | 44 (15.4%) |
| $20,000 to $24,999 | 29 (3.5%) | 23 (8.1%) |
| $25,000 to $34,999 | 108 (13.1%) | 20 (7.0%) |
| $35,000 to $49,999 | 73 (8.8%) | 7 (2.5%) |
| $50,000 to $74,999 | 148 (17.9%) | 77 (27.0%) |
| $75,000 to $99,999 | 117 (14.2%) | 51 (17.9%) |
| $100,000 to $149,999 | 145 (17.5%) | 4 (1.4%) |
| $150,000 or more | 90 (10.9%) | 8 (2.8%) |
| Total | 826 (100.0%) | 285 (100.0%) |
Monthly Housing Cost Tiers in Kidder County
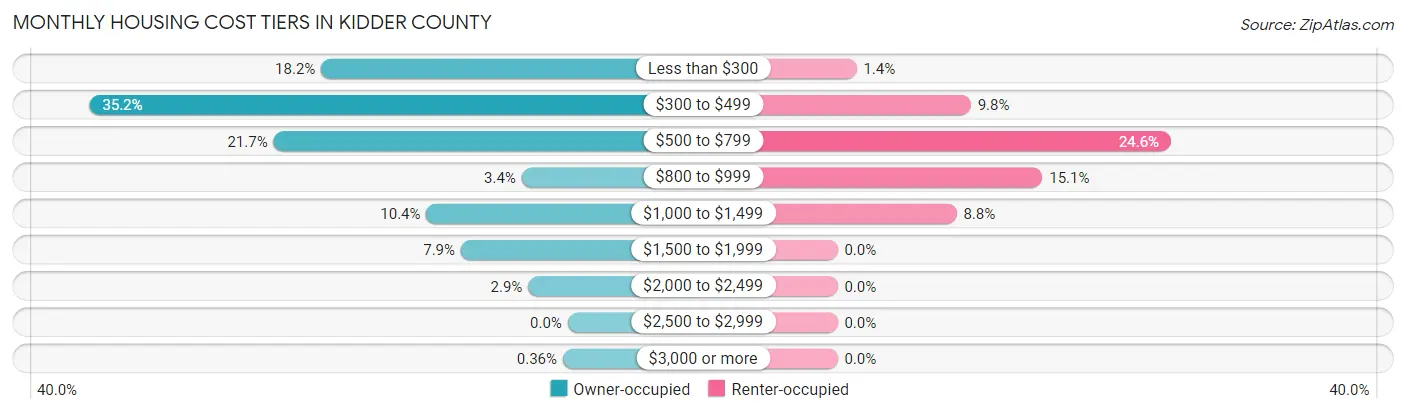
| Monthly Cost | Owner-occupied | Renter-occupied |
| Less than $300 | 150 (18.2%) | 4 (1.4%) |
| $300 to $499 | 291 (35.2%) | 28 (9.8%) |
| $500 to $799 | 179 (21.7%) | 70 (24.6%) |
| $800 to $999 | 28 (3.4%) | 43 (15.1%) |
| $1,000 to $1,499 | 86 (10.4%) | 25 (8.8%) |
| $1,500 to $1,999 | 65 (7.9%) | 0 (0.0%) |
| $2,000 to $2,499 | 24 (2.9%) | 0 (0.0%) |
| $2,500 to $2,999 | 0 (0.0%) | 0 (0.0%) |
| $3,000 or more | 3 (0.4%) | 0 (0.0%) |
| Total | 826 (100.0%) | 285 (100.0%) |
Physical Housing Characteristics in Kidder County
Housing Structures in Kidder County
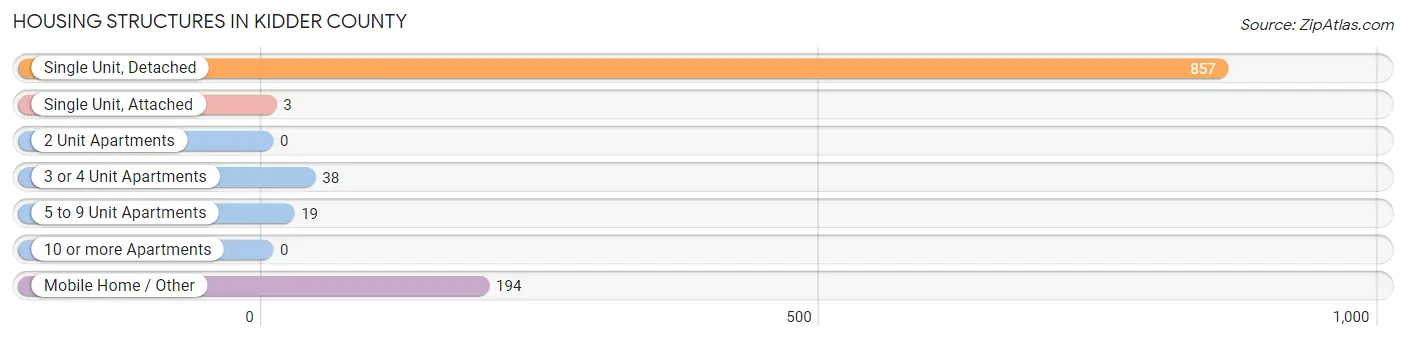
| Structure Type | # Housing Units | % Housing Units |
| Single Unit, Detached | 857 | 77.1% |
| Single Unit, Attached | 3 | 0.3% |
| 2 Unit Apartments | 0 | 0.0% |
| 3 or 4 Unit Apartments | 38 | 3.4% |
| 5 to 9 Unit Apartments | 19 | 1.7% |
| 10 or more Apartments | 0 | 0.0% |
| Mobile Home / Other | 194 | 17.5% |
| Total | 1,111 | 100.0% |
Housing Structures by Occupancy in Kidder County
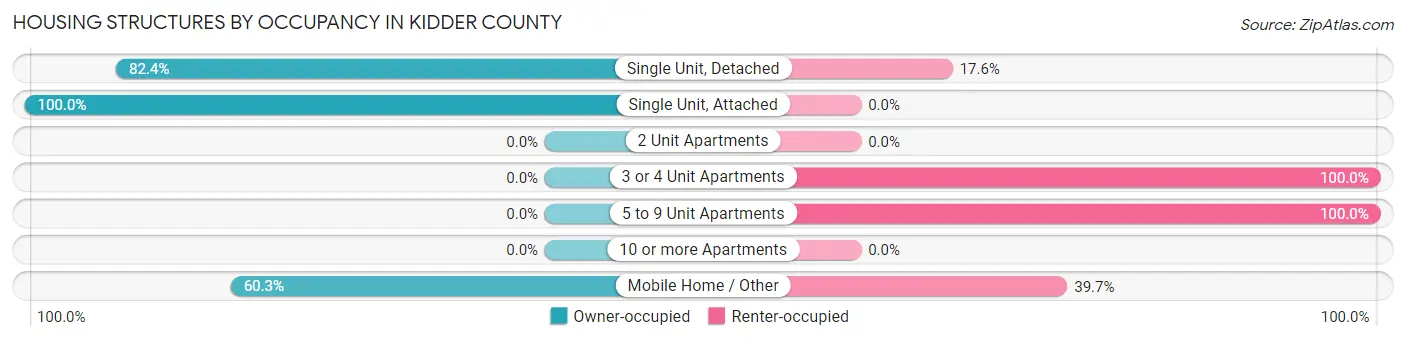
| Structure Type | Owner-occupied | Renter-occupied |
| Single Unit, Detached | 706 (82.4%) | 151 (17.6%) |
| Single Unit, Attached | 3 (100.0%) | 0 (0.0%) |
| 2 Unit Apartments | 0 (0.0%) | 0 (0.0%) |
| 3 or 4 Unit Apartments | 0 (0.0%) | 38 (100.0%) |
| 5 to 9 Unit Apartments | 0 (0.0%) | 19 (100.0%) |
| 10 or more Apartments | 0 (0.0%) | 0 (0.0%) |
| Mobile Home / Other | 117 (60.3%) | 77 (39.7%) |
| Total | 826 (74.4%) | 285 (25.7%) |
Housing Structures by Number of Rooms in Kidder County
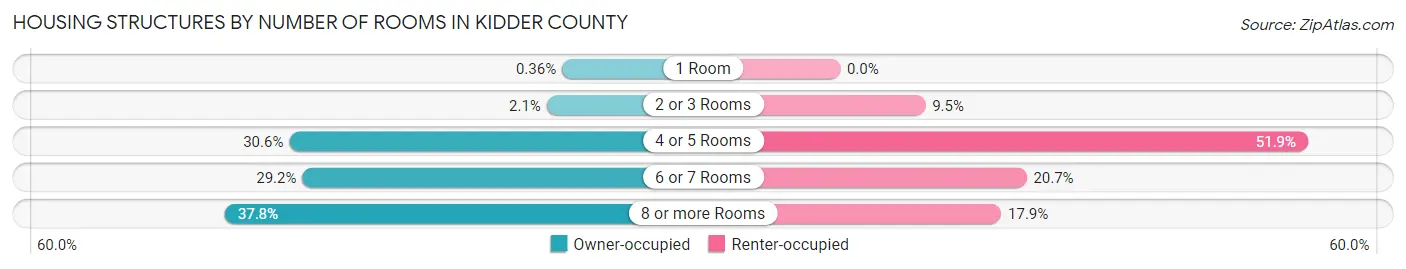
| Number of Rooms | Owner-occupied | Renter-occupied |
| 1 Room | 3 (0.4%) | 0 (0.0%) |
| 2 or 3 Rooms | 17 (2.1%) | 27 (9.5%) |
| 4 or 5 Rooms | 253 (30.6%) | 148 (51.9%) |
| 6 or 7 Rooms | 241 (29.2%) | 59 (20.7%) |
| 8 or more Rooms | 312 (37.8%) | 51 (17.9%) |
| Total | 826 (100.0%) | 285 (100.0%) |
Housing Structure by Heating Type in Kidder County
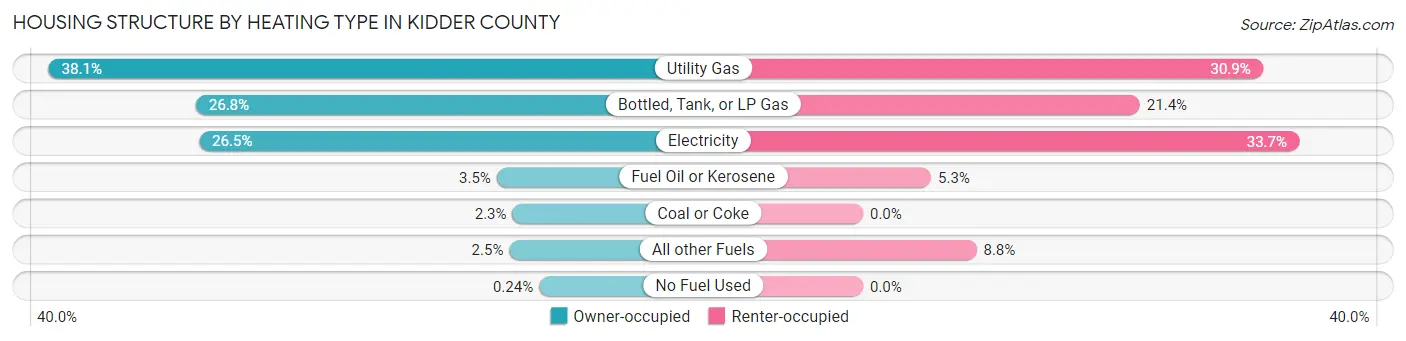
| Heating Type | Owner-occupied | Renter-occupied |
| Utility Gas | 315 (38.1%) | 88 (30.9%) |
| Bottled, Tank, or LP Gas | 221 (26.8%) | 61 (21.4%) |
| Electricity | 219 (26.5%) | 96 (33.7%) |
| Fuel Oil or Kerosene | 29 (3.5%) | 15 (5.3%) |
| Coal or Coke | 19 (2.3%) | 0 (0.0%) |
| All other Fuels | 21 (2.5%) | 25 (8.8%) |
| No Fuel Used | 2 (0.2%) | 0 (0.0%) |
| Total | 826 (100.0%) | 285 (100.0%) |
Household Vehicle Usage in Kidder County
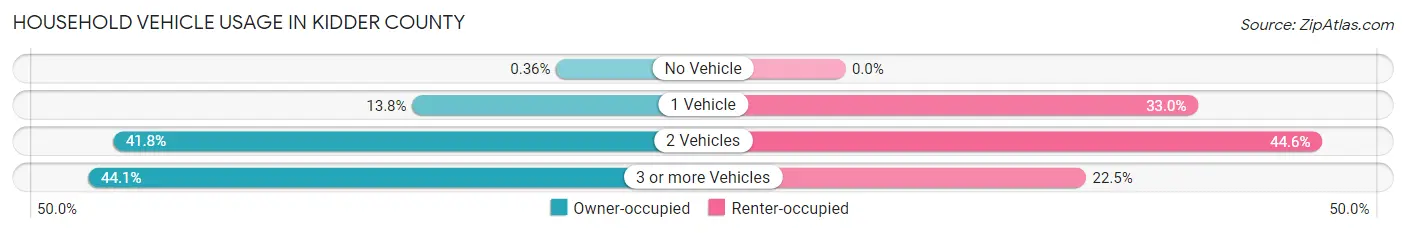
| Vehicles per Household | Owner-occupied | Renter-occupied |
| No Vehicle | 3 (0.4%) | 0 (0.0%) |
| 1 Vehicle | 114 (13.8%) | 94 (33.0%) |
| 2 Vehicles | 345 (41.8%) | 127 (44.6%) |
| 3 or more Vehicles | 364 (44.1%) | 64 (22.5%) |
| Total | 826 (100.0%) | 285 (100.0%) |
Real Estate & Mortgages in Kidder County
Real Estate and Mortgage Overview in Kidder County
| Characteristic | Without Mortgage | With Mortgage |
| Housing Units | 610 | 216 |
| Median Property Value | $109,200 | $193,100 |
| Median Household Income | $52,813 | $52 |
| Monthly Housing Costs | $408 | $3 |
| Real Estate Taxes | $739 | $26 |
Property Value by Mortgage Status in Kidder County
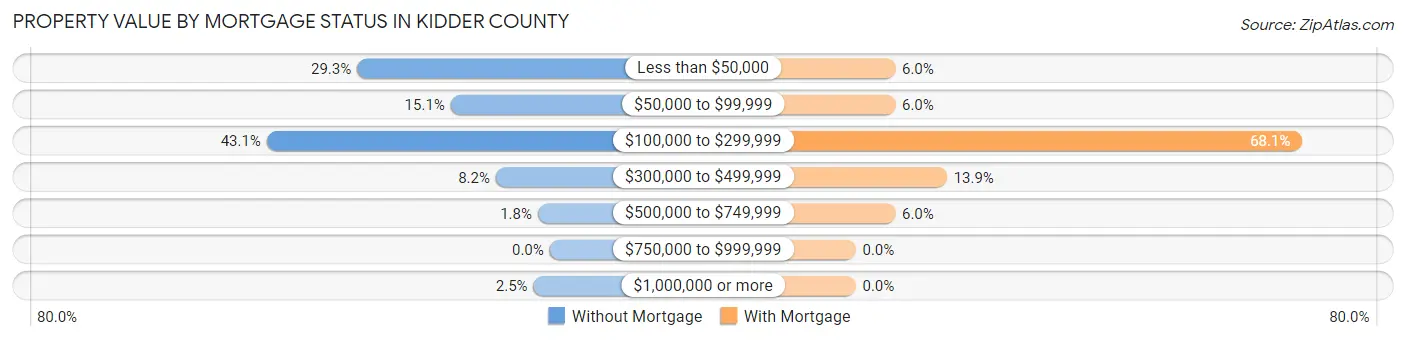
| Property Value | Without Mortgage | With Mortgage |
| Less than $50,000 | 179 (29.3%) | 13 (6.0%) |
| $50,000 to $99,999 | 92 (15.1%) | 13 (6.0%) |
| $100,000 to $299,999 | 263 (43.1%) | 147 (68.1%) |
| $300,000 to $499,999 | 50 (8.2%) | 30 (13.9%) |
| $500,000 to $749,999 | 11 (1.8%) | 13 (6.0%) |
| $750,000 to $999,999 | 0 (0.0%) | 0 (0.0%) |
| $1,000,000 or more | 15 (2.5%) | 0 (0.0%) |
| Total | 610 (100.0%) | 216 (100.0%) |
Household Income by Mortgage Status in Kidder County
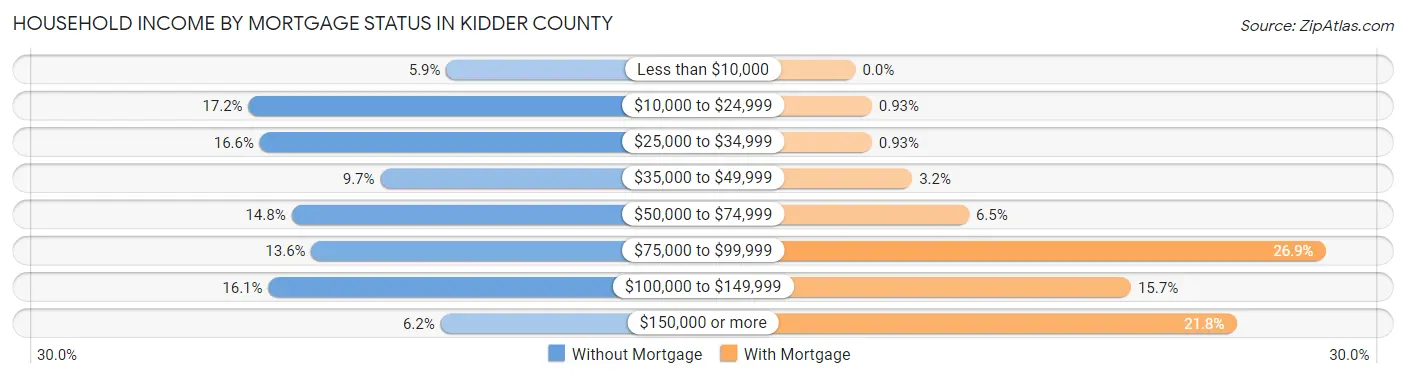
| Household Income | Without Mortgage | With Mortgage |
| Less than $10,000 | 36 (5.9%) | 0 (0.0%) |
| $10,000 to $24,999 | 105 (17.2%) | 2 (0.9%) |
| $25,000 to $34,999 | 101 (16.6%) | 2 (0.9%) |
| $35,000 to $49,999 | 59 (9.7%) | 7 (3.2%) |
| $50,000 to $74,999 | 90 (14.7%) | 14 (6.5%) |
| $75,000 to $99,999 | 83 (13.6%) | 58 (26.9%) |
| $100,000 to $149,999 | 98 (16.1%) | 34 (15.7%) |
| $150,000 or more | 38 (6.2%) | 47 (21.8%) |
| Total | 610 (100.0%) | 216 (100.0%) |
Property Value to Household Income Ratio in Kidder County
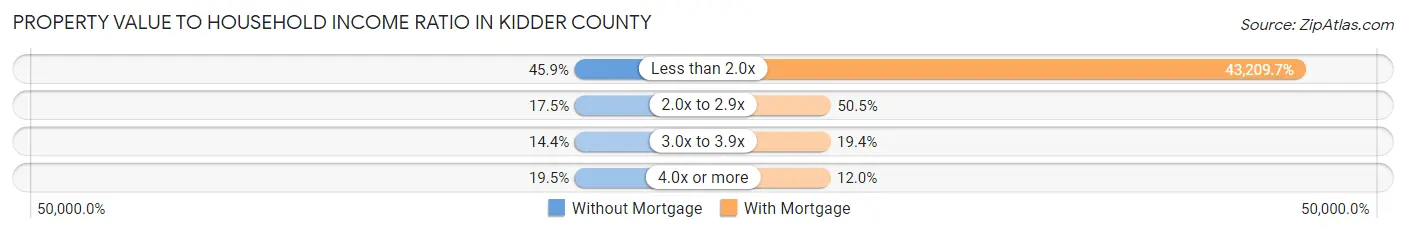
| Value-to-Income Ratio | Without Mortgage | With Mortgage |
| Less than 2.0x | 280 (45.9%) | 93,333 (43,209.7%) |
| 2.0x to 2.9x | 107 (17.5%) | 109 (50.5%) |
| 3.0x to 3.9x | 88 (14.4%) | 42 (19.4%) |
| 4.0x or more | 119 (19.5%) | 26 (12.0%) |
| Total | 610 (100.0%) | 216 (100.0%) |
Real Estate Taxes by Mortgage Status in Kidder County
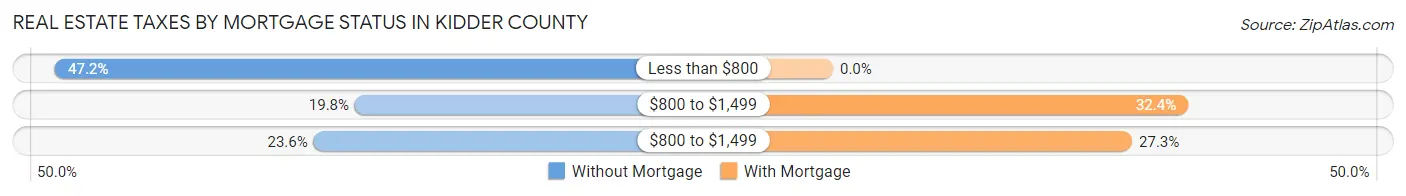
| Property Taxes | Without Mortgage | With Mortgage |
| Less than $800 | 288 (47.2%) | 0 (0.0%) |
| $800 to $1,499 | 121 (19.8%) | 70 (32.4%) |
| $800 to $1,499 | 144 (23.6%) | 59 (27.3%) |
| Total | 610 (100.0%) | 216 (100.0%) |
Health & Disability in Kidder County
Health Insurance Coverage by Age in Kidder County
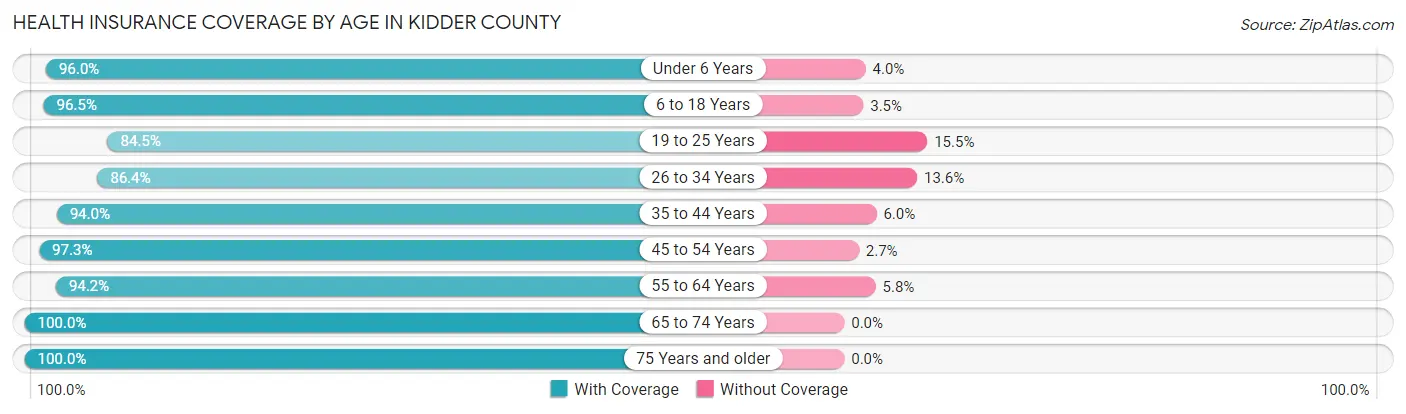
| Age Bracket | With Coverage | Without Coverage |
| Under 6 Years | 193 (96.0%) | 8 (4.0%) |
| 6 to 18 Years | 354 (96.5%) | 13 (3.5%) |
| 19 to 25 Years | 153 (84.5%) | 28 (15.5%) |
| 26 to 34 Years | 121 (86.4%) | 19 (13.6%) |
| 35 to 44 Years | 235 (94.0%) | 15 (6.0%) |
| 45 to 54 Years | 215 (97.3%) | 6 (2.7%) |
| 55 to 64 Years | 371 (94.2%) | 23 (5.8%) |
| 65 to 74 Years | 333 (100.0%) | 0 (0.0%) |
| 75 Years and older | 304 (100.0%) | 0 (0.0%) |
| Total | 2,279 (95.3%) | 112 (4.7%) |
Health Insurance Coverage by Citizenship Status in Kidder County
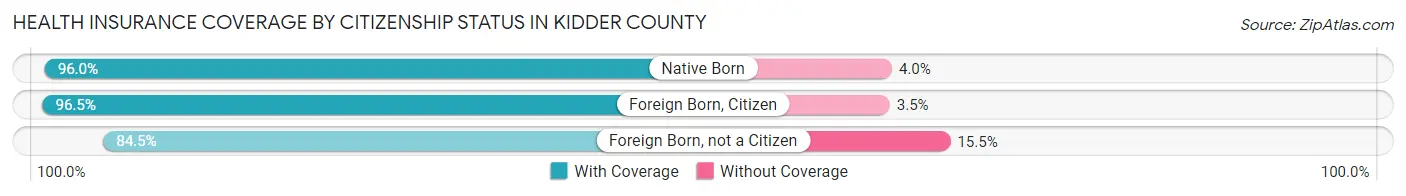
| Citizenship Status | With Coverage | Without Coverage |
| Native Born | 193 (96.0%) | 8 (4.0%) |
| Foreign Born, Citizen | 354 (96.5%) | 13 (3.5%) |
| Foreign Born, not a Citizen | 153 (84.5%) | 28 (15.5%) |
Health Insurance Coverage by Household Income in Kidder County
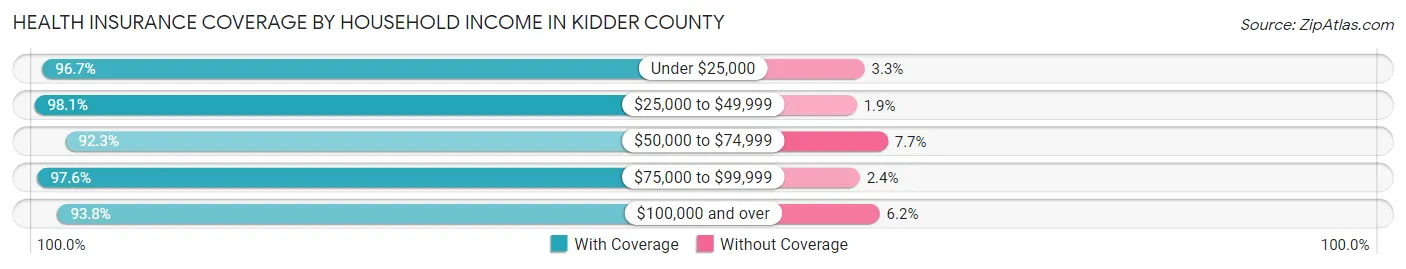
| Household Income | With Coverage | Without Coverage |
| Under $25,000 | 348 (96.7%) | 12 (3.3%) |
| $25,000 to $49,999 | 370 (98.1%) | 7 (1.9%) |
| $50,000 to $74,999 | 493 (92.3%) | 41 (7.7%) |
| $75,000 to $99,999 | 443 (97.6%) | 11 (2.4%) |
| $100,000 and over | 625 (93.8%) | 41 (6.2%) |
Public vs Private Health Insurance Coverage by Age in Kidder County
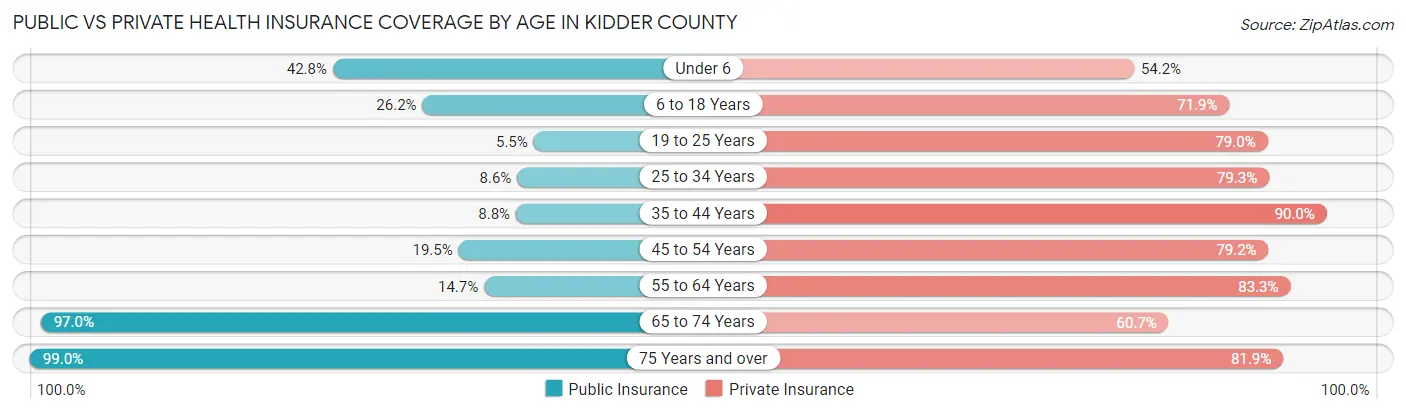
| Age Bracket | Public Insurance | Private Insurance |
| Under 6 | 86 (42.8%) | 109 (54.2%) |
| 6 to 18 Years | 96 (26.2%) | 264 (71.9%) |
| 19 to 25 Years | 10 (5.5%) | 143 (79.0%) |
| 25 to 34 Years | 12 (8.6%) | 111 (79.3%) |
| 35 to 44 Years | 22 (8.8%) | 225 (90.0%) |
| 45 to 54 Years | 43 (19.5%) | 175 (79.2%) |
| 55 to 64 Years | 58 (14.7%) | 328 (83.3%) |
| 65 to 74 Years | 323 (97.0%) | 202 (60.7%) |
| 75 Years and over | 301 (99.0%) | 249 (81.9%) |
| Total | 951 (39.8%) | 1,806 (75.5%) |
Disability Status by Sex by Age in Kidder County
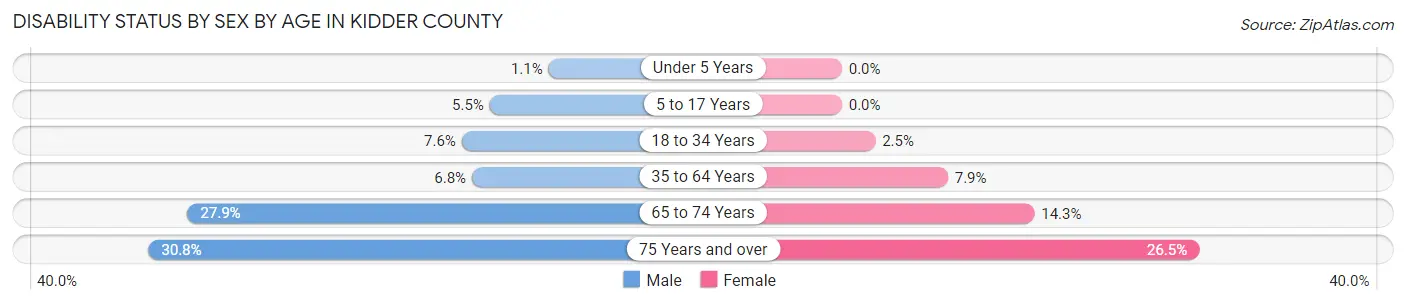
| Age Bracket | Male | Female |
| Under 5 Years | 1 (1.1%) | 0 (0.0%) |
| 5 to 17 Years | 11 (5.5%) | 0 (0.0%) |
| 18 to 34 Years | 16 (7.5%) | 3 (2.5%) |
| 35 to 64 Years | 32 (6.8%) | 31 (7.9%) |
| 65 to 74 Years | 48 (27.9%) | 23 (14.3%) |
| 75 Years and over | 53 (30.8%) | 35 (26.5%) |
Disability Class by Sex by Age in Kidder County
Disability Class: Hearing Difficulty
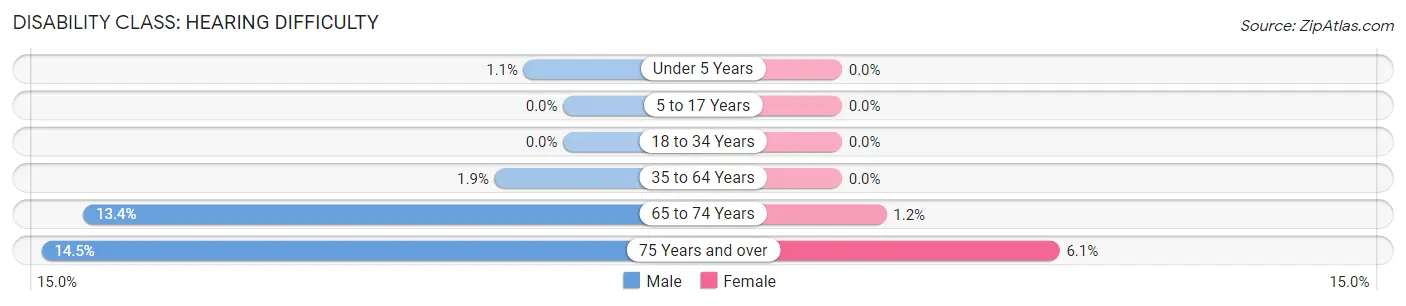
| Age Bracket | Male | Female |
| Under 5 Years | 1 (1.1%) | 0 (0.0%) |
| 5 to 17 Years | 0 (0.0%) | 0 (0.0%) |
| 18 to 34 Years | 0 (0.0%) | 0 (0.0%) |
| 35 to 64 Years | 9 (1.9%) | 0 (0.0%) |
| 65 to 74 Years | 23 (13.4%) | 2 (1.2%) |
| 75 Years and over | 25 (14.5%) | 8 (6.1%) |
Disability Class: Vision Difficulty
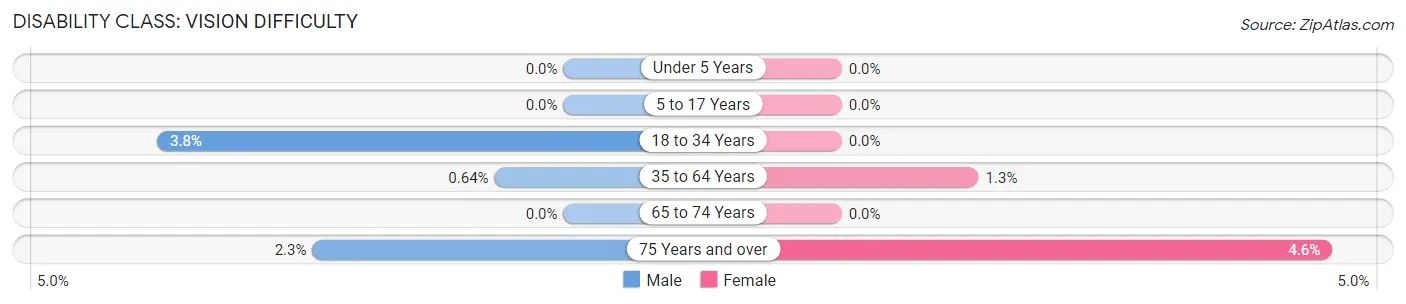
| Age Bracket | Male | Female |
| Under 5 Years | 0 (0.0%) | 0 (0.0%) |
| 5 to 17 Years | 0 (0.0%) | 0 (0.0%) |
| 18 to 34 Years | 8 (3.8%) | 0 (0.0%) |
| 35 to 64 Years | 3 (0.6%) | 5 (1.3%) |
| 65 to 74 Years | 0 (0.0%) | 0 (0.0%) |
| 75 Years and over | 4 (2.3%) | 6 (4.5%) |
Disability Class: Cognitive Difficulty
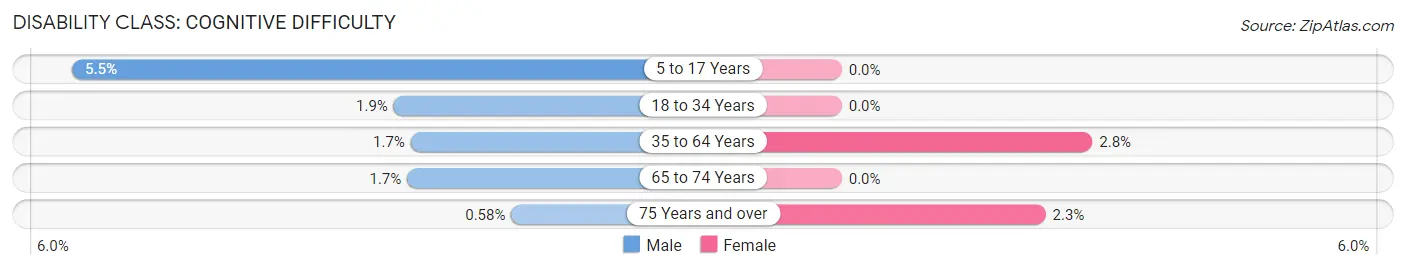
| Age Bracket | Male | Female |
| 5 to 17 Years | 11 (5.5%) | 0 (0.0%) |
| 18 to 34 Years | 4 (1.9%) | 0 (0.0%) |
| 35 to 64 Years | 8 (1.7%) | 11 (2.8%) |
| 65 to 74 Years | 3 (1.7%) | 0 (0.0%) |
| 75 Years and over | 1 (0.6%) | 3 (2.3%) |
Disability Class: Ambulatory Difficulty
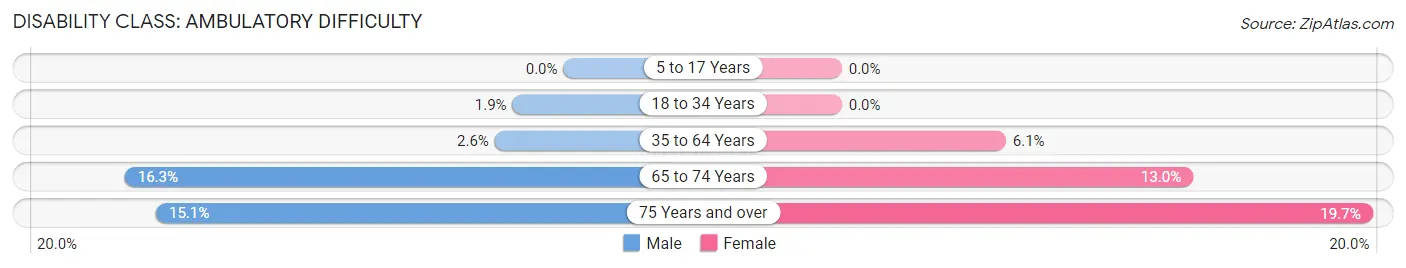
| Age Bracket | Male | Female |
| 5 to 17 Years | 0 (0.0%) | 0 (0.0%) |
| 18 to 34 Years | 4 (1.9%) | 0 (0.0%) |
| 35 to 64 Years | 12 (2.5%) | 24 (6.1%) |
| 65 to 74 Years | 28 (16.3%) | 21 (13.0%) |
| 75 Years and over | 26 (15.1%) | 26 (19.7%) |
Disability Class: Self-Care Difficulty
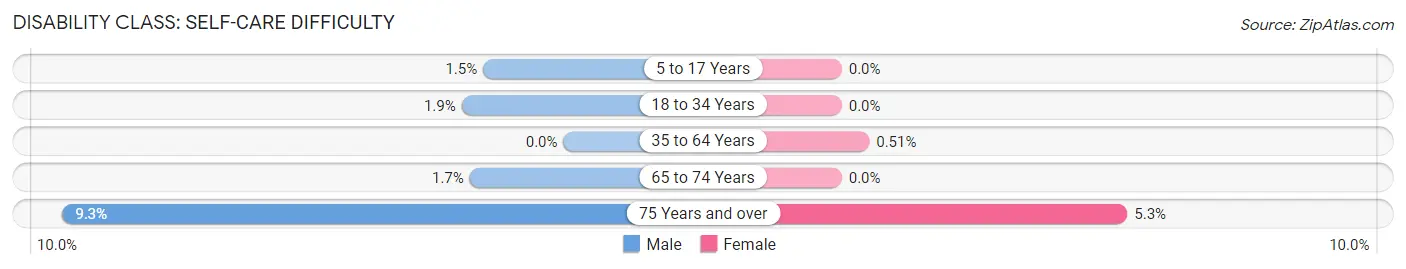
| Age Bracket | Male | Female |
| 5 to 17 Years | 3 (1.5%) | 0 (0.0%) |
| 18 to 34 Years | 4 (1.9%) | 0 (0.0%) |
| 35 to 64 Years | 0 (0.0%) | 2 (0.5%) |
| 65 to 74 Years | 3 (1.7%) | 0 (0.0%) |
| 75 Years and over | 16 (9.3%) | 7 (5.3%) |
Technology Access in Kidder County
Computing Device Access in Kidder County
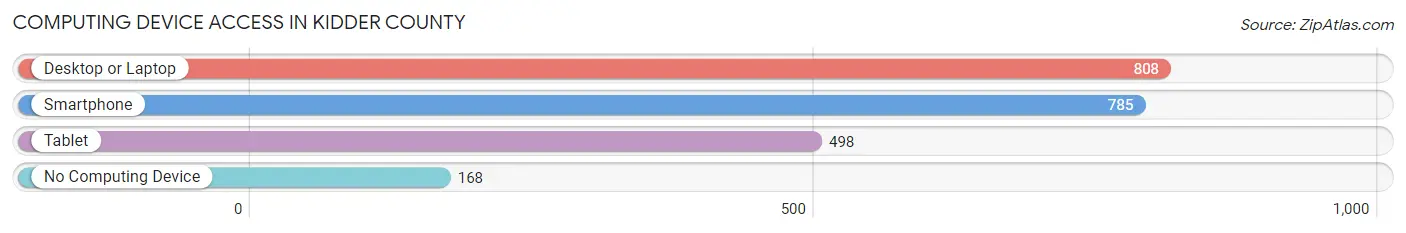
| Device Type | # Households | % Households |
| Desktop or Laptop | 808 | 72.7% |
| Smartphone | 785 | 70.7% |
| Tablet | 498 | 44.8% |
| No Computing Device | 168 | 15.1% |
| Total | 1,111 | 100.0% |
Internet Access in Kidder County
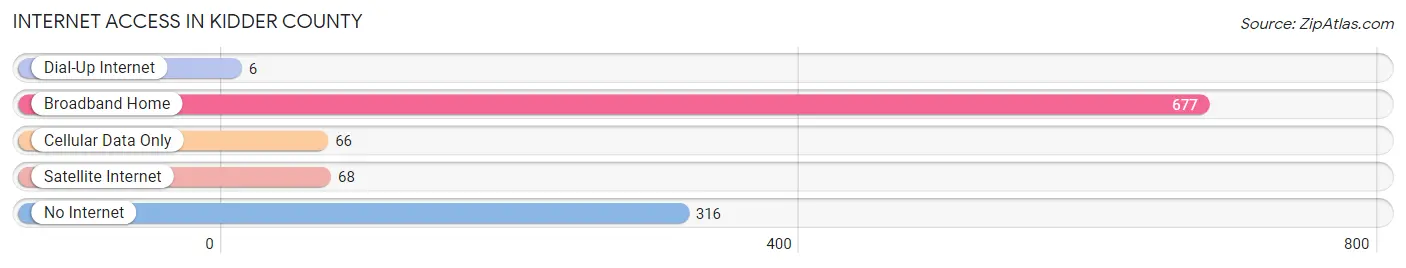
| Internet Type | # Households | % Households |
| Dial-Up Internet | 6 | 0.5% |
| Broadband Home | 677 | 60.9% |
| Cellular Data Only | 66 | 5.9% |
| Satellite Internet | 68 | 6.1% |
| No Internet | 316 | 28.4% |
| Total | 1,111 | 100.0% |
Kidder County Summary
Kidder County is located in the central region of North Dakota, in the United States. It is bordered by Stutsman County to the north, Burleigh County to the east, Emmons County to the south, and Logan County to the west. The county seat is Steele, and the largest city is Steele. The county was created in 1873 and named after Major General Thomas L. Kidder, a Civil War veteran.
Geography
Kidder County covers an area of 1,072 square miles, making it the fourth-smallest county in North Dakota. The terrain is mostly flat, with some rolling hills in the western part of the county. The county is drained by the James River, which flows through the center of the county. The county is also home to several small lakes, including Lake Williams, Lake Alice, and Lake Elsie.
The county has a humid continental climate, with cold winters and hot summers. The average annual temperature is 45°F, and the average annual precipitation is 17 inches.
Demographics
As of the 2010 census, there were 2,541 people, 1,039 households, and 690 families living in the county. The population density was 2.4 people per square mile. The racial makeup of the county was 97.3% White, 0.2% African American, 0.3% Native American, 0.2% Asian, 0.1% Pacific Islander, 0.7% from other races, and 1.2% from two or more races. Hispanic or Latino of any race were 1.7% of the population.
The median income for a household in the county was $41,944, and the median income for a family was $50,000. The per capita income for the county was $20,845. About 8.2% of families and 11.2% of the population were below the poverty line, including 14.2% of those under age 18 and 8.2% of those age 65 or over.
Economy
The economy of Kidder County is largely based on agriculture. The county is home to several large farms, which produce a variety of crops, including wheat, corn, soybeans, and sunflowers. Livestock production is also important to the local economy, with cattle, sheep, and hogs being raised in the county.
The county is also home to several small businesses, including restaurants, retail stores, and service providers. The county is served by several state and federal highways, which provide access to nearby cities and towns.
Conclusion
Kidder County is a rural county located in the central region of North Dakota. It is home to a population of 2,541 people, and the economy is largely based on agriculture. The county is served by several state and federal highways, which provide access to nearby cities and towns. The county is also home to several small businesses, which provide goods and services to the local population.
Common Questions
What is Per Capita Income in Kidder County?
Per Capita income in Kidder County is $32,974.
What is the Median Family Income in Kidder County?
Median Family Income in Kidder County is $76,765.
What is the Median Household income in Kidder County?
Median Household Income in Kidder County is $57,240.
What is Income or Wage Gap in Kidder County?
Income or Wage Gap in Kidder County is 32.5%.
Women in Kidder County earn 67.5 cents for every dollar earned by a man.
What is Inequality or Gini Index in Kidder County?
Inequality or Gini Index in Kidder County is 0.43.
What is the Total Population of Kidder County?
Total Population of Kidder County is 2,391.
What is the Total Male Population of Kidder County?
Total Male Population of Kidder County is 1,319.
What is the Total Female Population of Kidder County?
Total Female Population of Kidder County is 1,072.
What is the Ratio of Males per 100 Females in Kidder County?
There are 123.04 Males per 100 Females in Kidder County.
What is the Ratio of Females per 100 Males in Kidder County?
There are 81.27 Females per 100 Males in Kidder County.
What is the Median Population Age in Kidder County?
Median Population Age in Kidder County is 48.4 Years.
What is the Average Family Size in Kidder County
Average Family Size in Kidder County is 2.9 People.
What is the Average Household Size in Kidder County
Average Household Size in Kidder County is 2.1 People.
How Large is the Labor Force in Kidder County?
There are 1,042 People in the Labor Forcein in Kidder County.
What is the Percentage of People in the Labor Force in Kidder County?
55.1% of People are in the Labor Force in Kidder County.
What is the Unemployment Rate in Kidder County?
Unemployment Rate in Kidder County is 1.0%.