Golden Valley County, ND Map & Demographics
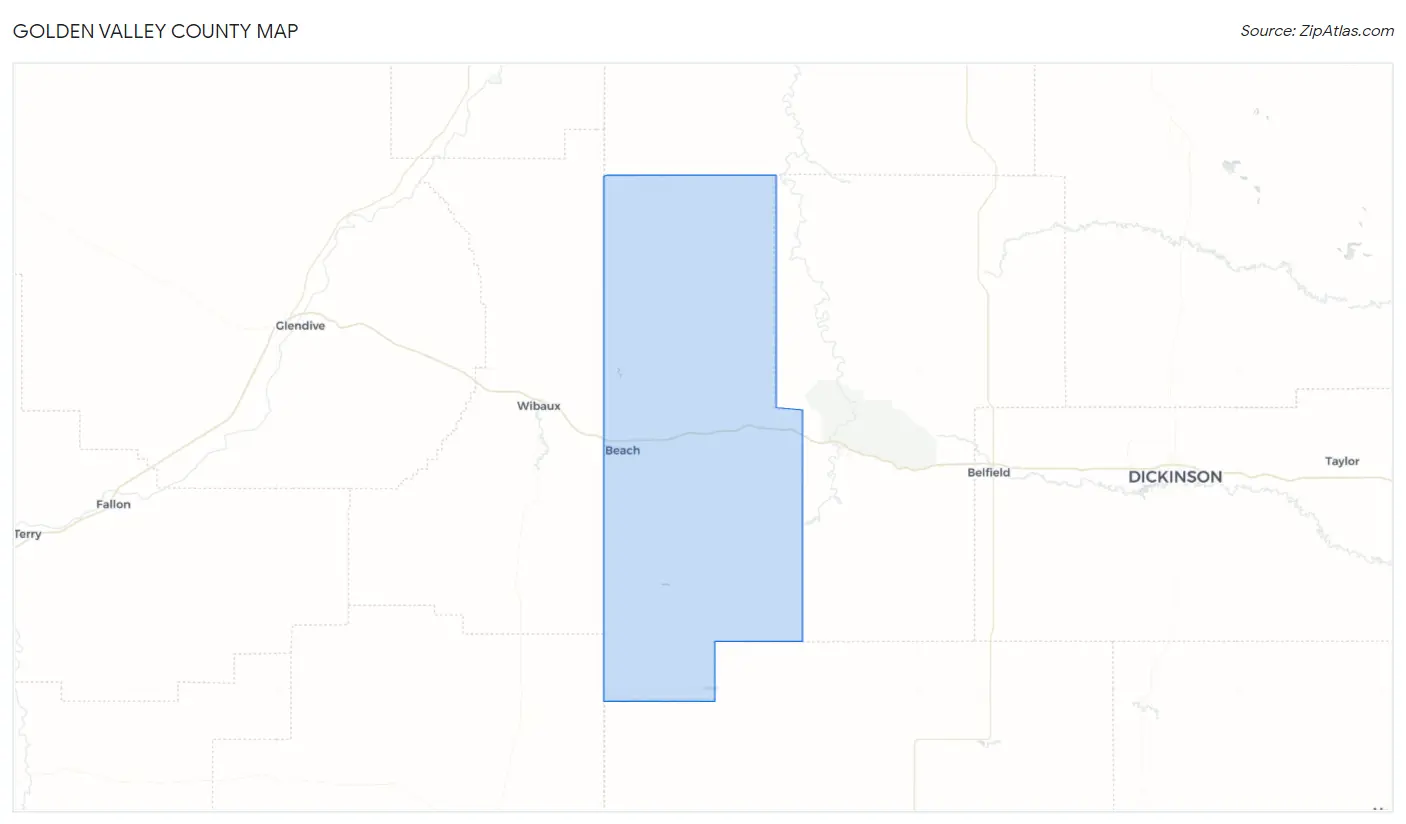
Golden Valley County Map
Golden Valley County Overview
$35,953
PER CAPITA INCOME
$95,625
AVG FAMILY INCOME
$84,750
AVG HOUSEHOLD INCOME
50.0%
WAGE / INCOME GAP [ % ]
50.0¢/ $1
WAGE / INCOME GAP [ $ ]
0.38
INEQUALITY / GINI INDEX
1,734
TOTAL POPULATION
859
MALE POPULATION
875
FEMALE POPULATION
98.17
MALES / 100 FEMALES
101.86
FEMALES / 100 MALES
45.7
MEDIAN AGE
2.9
AVG FAMILY SIZE
2.5
AVG HOUSEHOLD SIZE
856
LABOR FORCE [ PEOPLE ]
60.4%
PERCENT IN LABOR FORCE
5.4%
UNEMPLOYMENT RATE
Golden Valley County Area Codes
Income in Golden Valley County
Income Overview in Golden Valley County
Per Capita Income in Golden Valley County is $35,953, while median incomes of families and households are $95,625 and $84,750 respectively.
| Characteristic | Number | Measure |
| Per Capita Income | 1,734 | $35,953 |
| Median Family Income | 509 | $95,625 |
| Mean Family Income | 509 | $107,445 |
| Median Household Income | 673 | $84,750 |
| Mean Household Income | 673 | $92,758 |
| Income Deficit | 509 | $0 |
| Wage / Income Gap (%) | 1,734 | 49.95% |
| Wage / Income Gap ($) | 1,734 | 50.05¢ per $1 |
| Gini / Inequality Index | 1,734 | 0.38 |
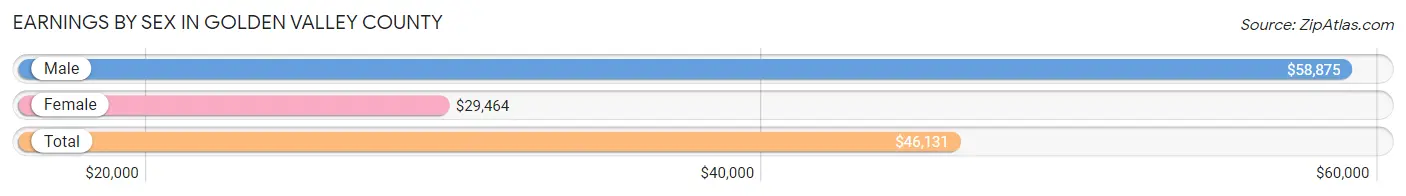
Earnings by Sex in Golden Valley County
Average Earnings in Golden Valley County are $46,131, $58,875 for men and $29,464 for women, a difference of 49.9%.
| Sex | Number | Average Earnings |
| Male | 516 (53.8%) | $58,875 |
| Female | 443 (46.2%) | $29,464 |
| Total | 959 (100.0%) | $46,131 |
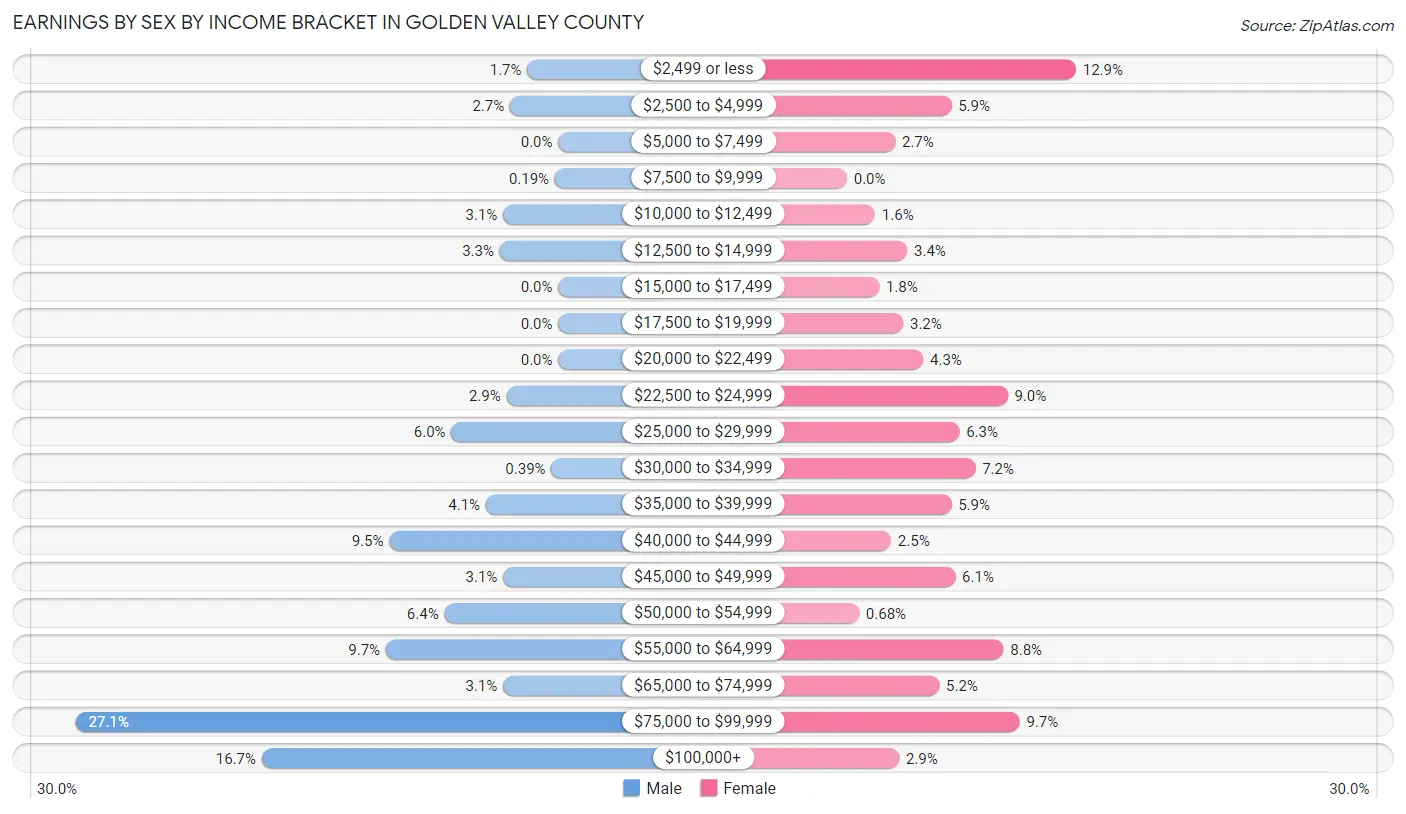
Earnings by Sex by Income Bracket in Golden Valley County
The most common earnings brackets in Golden Valley County are $75,000 to $99,999 for men (140 | 27.1%) and $2,499 or less for women (57 | 12.9%).
| Income | Male | Female |
| $2,499 or less | 9 (1.7%) | 57 (12.9%) |
| $2,500 to $4,999 | 14 (2.7%) | 26 (5.9%) |
| $5,000 to $7,499 | 0 (0.0%) | 12 (2.7%) |
| $7,500 to $9,999 | 1 (0.2%) | 0 (0.0%) |
| $10,000 to $12,499 | 16 (3.1%) | 7 (1.6%) |
| $12,500 to $14,999 | 17 (3.3%) | 15 (3.4%) |
| $15,000 to $17,499 | 0 (0.0%) | 8 (1.8%) |
| $17,500 to $19,999 | 0 (0.0%) | 14 (3.2%) |
| $20,000 to $22,499 | 0 (0.0%) | 19 (4.3%) |
| $22,500 to $24,999 | 15 (2.9%) | 40 (9.0%) |
| $25,000 to $29,999 | 31 (6.0%) | 28 (6.3%) |
| $30,000 to $34,999 | 2 (0.4%) | 32 (7.2%) |
| $35,000 to $39,999 | 21 (4.1%) | 26 (5.9%) |
| $40,000 to $44,999 | 49 (9.5%) | 11 (2.5%) |
| $45,000 to $49,999 | 16 (3.1%) | 27 (6.1%) |
| $50,000 to $54,999 | 33 (6.4%) | 3 (0.7%) |
| $55,000 to $64,999 | 50 (9.7%) | 39 (8.8%) |
| $65,000 to $74,999 | 16 (3.1%) | 23 (5.2%) |
| $75,000 to $99,999 | 140 (27.1%) | 43 (9.7%) |
| $100,000+ | 86 (16.7%) | 13 (2.9%) |
| Total | 516 (100.0%) | 443 (100.0%) |
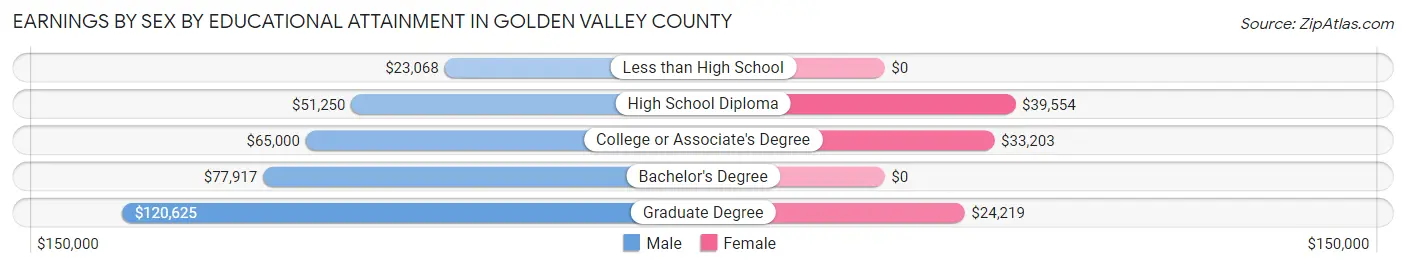
Earnings by Sex by Educational Attainment in Golden Valley County
Average earnings in Golden Valley County are $59,500 for men and $33,563 for women, a difference of 43.6%. Men with an educational attainment of graduate degree enjoy the highest average annual earnings of $120,625, while those with less than high school education earn the least with $23,068. Women with an educational attainment of high school diploma earn the most with the average annual earnings of $39,554, while those with graduate degree education have the smallest earnings of $24,219.
| Educational Attainment | Male Income | Female Income |
| Less than High School | $23,068 | $0 |
| High School Diploma | $51,250 | $39,554 |
| College or Associate's Degree | $65,000 | $33,203 |
| Bachelor's Degree | $77,917 | $0 |
| Graduate Degree | $120,625 | $24,219 |
| Total | $59,500 | $33,563 |
Family Income in Golden Valley County
Family Income Brackets in Golden Valley County
According to the Golden Valley County family income data, there are 147 families falling into the $100,000 to $149,999 income range, which is the most common income bracket and makes up 28.9% of all families. Conversely, the $15,000 to $24,999 income bracket is the least frequent group with only 3 families (0.6%) belonging to this category.
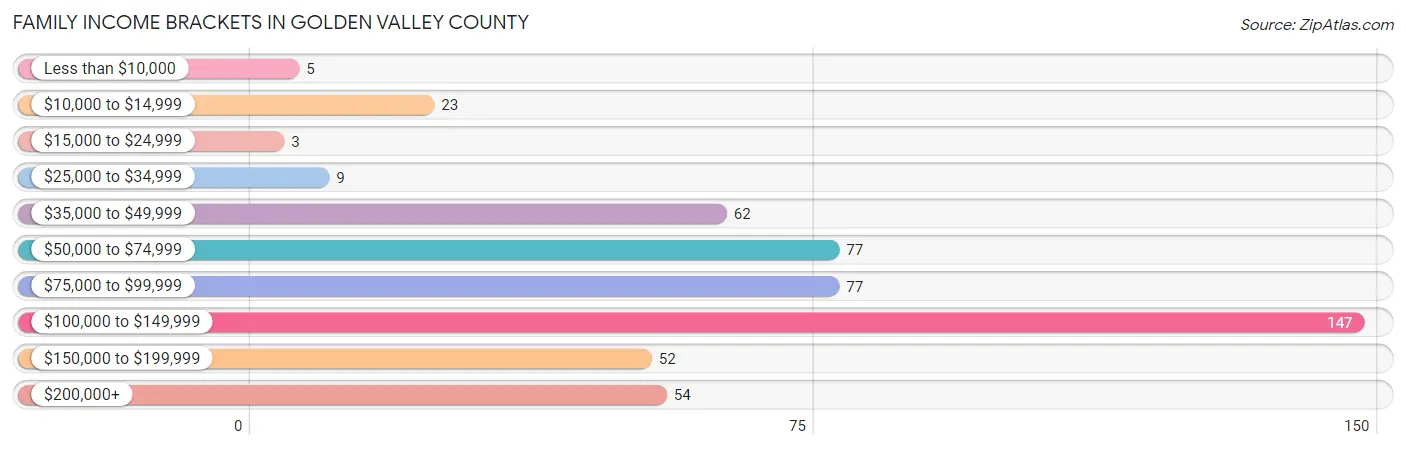
| Income Bracket | # Families | % Families |
| Less than $10,000 | 5 | 1.0% |
| $10,000 to $14,999 | 23 | 4.5% |
| $15,000 to $24,999 | 3 | 0.6% |
| $25,000 to $34,999 | 9 | 1.8% |
| $35,000 to $49,999 | 62 | 12.2% |
| $50,000 to $74,999 | 77 | 15.1% |
| $75,000 to $99,999 | 77 | 15.1% |
| $100,000 to $149,999 | 147 | 28.9% |
| $150,000 to $199,999 | 52 | 10.2% |
| $200,000+ | 54 | 10.6% |
Family Income by Famaliy Size in Golden Valley County
4-person families (40 | 7.9%) account for the highest median family income in Golden Valley County with $114,167 per family, while 2-person families (309 | 60.7%) have the highest median income of $50,042 per family member.
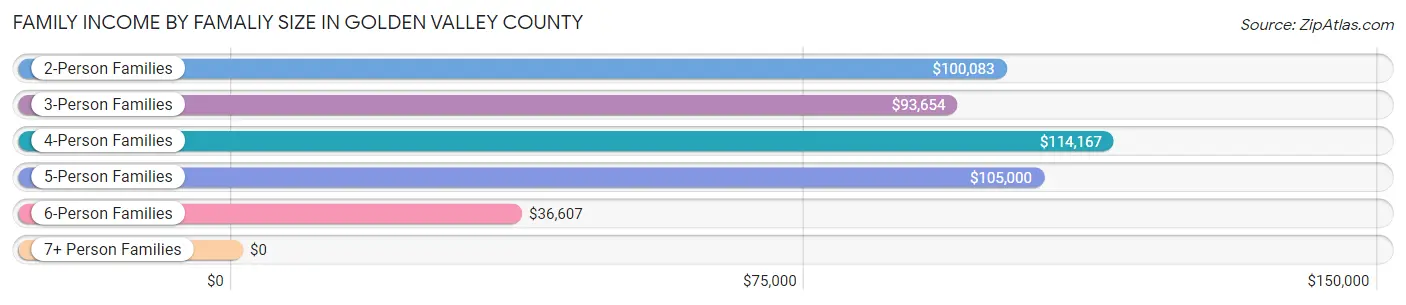
| Income Bracket | # Families | Median Income |
| 2-Person Families | 309 (60.7%) | $100,083 |
| 3-Person Families | 102 (20.0%) | $93,654 |
| 4-Person Families | 40 (7.9%) | $114,167 |
| 5-Person Families | 38 (7.5%) | $105,000 |
| 6-Person Families | 18 (3.5%) | $36,607 |
| 7+ Person Families | 2 (0.4%) | $0 |
| Total | 509 (100.0%) | $95,625 |
Family Income by Number of Earners in Golden Valley County
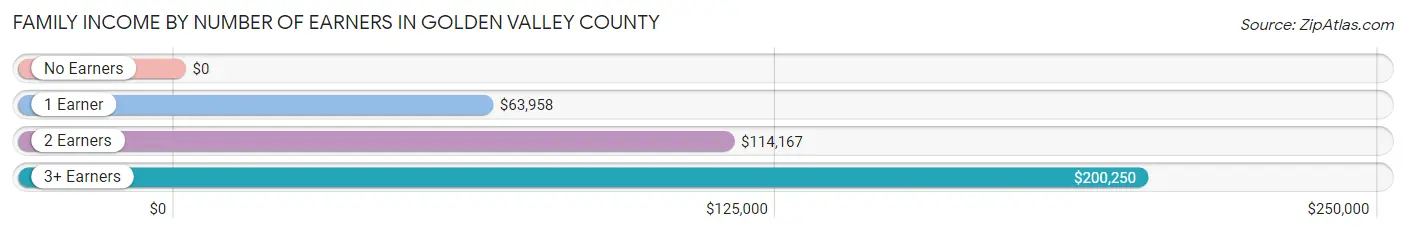
| Number of Earners | # Families | Median Income |
| No Earners | 52 (10.2%) | $0 |
| 1 Earner | 154 (30.3%) | $63,958 |
| 2 Earners | 282 (55.4%) | $114,167 |
| 3+ Earners | 21 (4.1%) | $200,250 |
| Total | 509 (100.0%) | $95,625 |
Household Income in Golden Valley County
Household Income Brackets in Golden Valley County
With 168 households falling in the category, the $100,000 to $149,999 income range is the most frequent in Golden Valley County, accounting for 25.0% of all households. In contrast, only 17 households (2.5%) fall into the less than $10,000 income bracket, making it the least populous group.
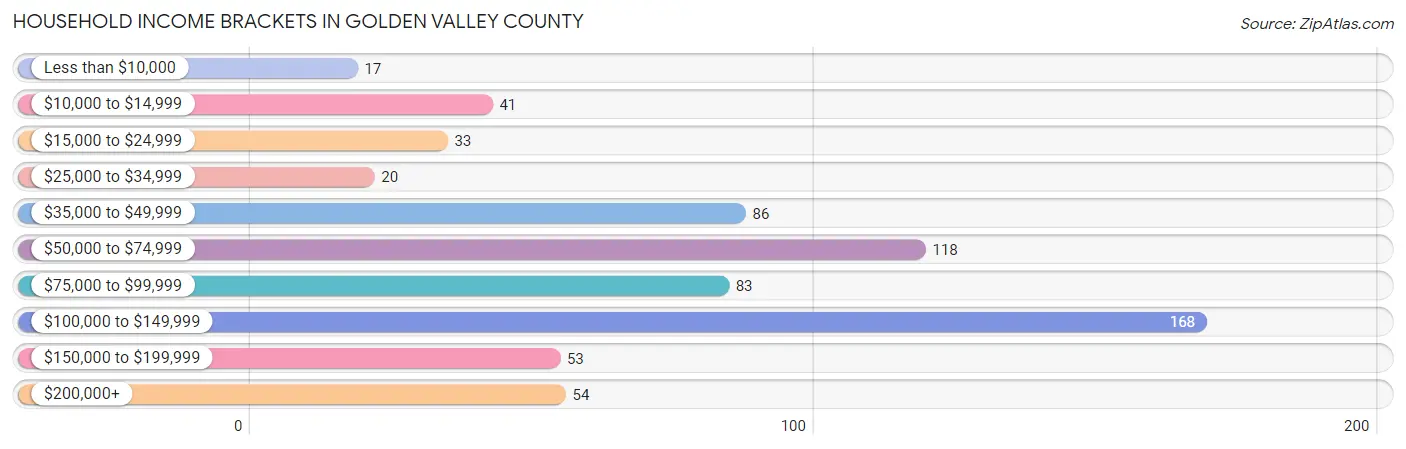
| Income Bracket | # Households | % Households |
| Less than $10,000 | 17 | 2.5% |
| $10,000 to $14,999 | 41 | 6.1% |
| $15,000 to $24,999 | 33 | 4.9% |
| $25,000 to $34,999 | 20 | 3.0% |
| $35,000 to $49,999 | 86 | 12.8% |
| $50,000 to $74,999 | 118 | 17.5% |
| $75,000 to $99,999 | 83 | 12.3% |
| $100,000 to $149,999 | 168 | 25.0% |
| $150,000 to $199,999 | 53 | 7.9% |
| $200,000+ | 54 | 8.0% |
Household Income by Householder Age in Golden Valley County
The median household income in Golden Valley County is $84,750, with the highest median household income of $107,969 found in the 25 to 44 years age bracket for the primary householder. A total of 145 households (21.5%) fall into this category. Meanwhile, the 15 to 24 years age bracket for the primary householder has the lowest median household income of $0, with 6 households (0.9%) in this group.
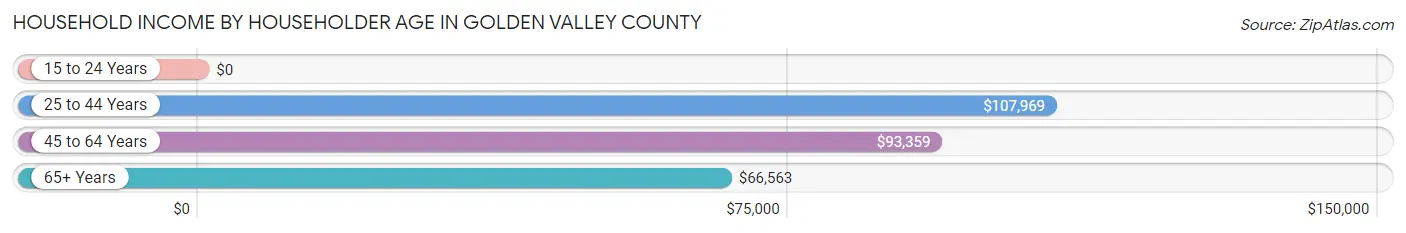
| Income Bracket | # Households | Median Income |
| 15 to 24 Years | 6 (0.9%) | $0 |
| 25 to 44 Years | 145 (21.5%) | $107,969 |
| 45 to 64 Years | 249 (37.0%) | $93,359 |
| 65+ Years | 273 (40.6%) | $66,563 |
| Total | 673 (100.0%) | $84,750 |
Poverty in Golden Valley County
Income Below Poverty by Sex and Age in Golden Valley County
With 15.4% poverty level for males and 9.8% for females among the residents of Golden Valley County, 15 year old males and 15 year old females are the most vulnerable to poverty, with 14 males (100.0%) and 9 females (81.8%) in their respective age groups living below the poverty level.
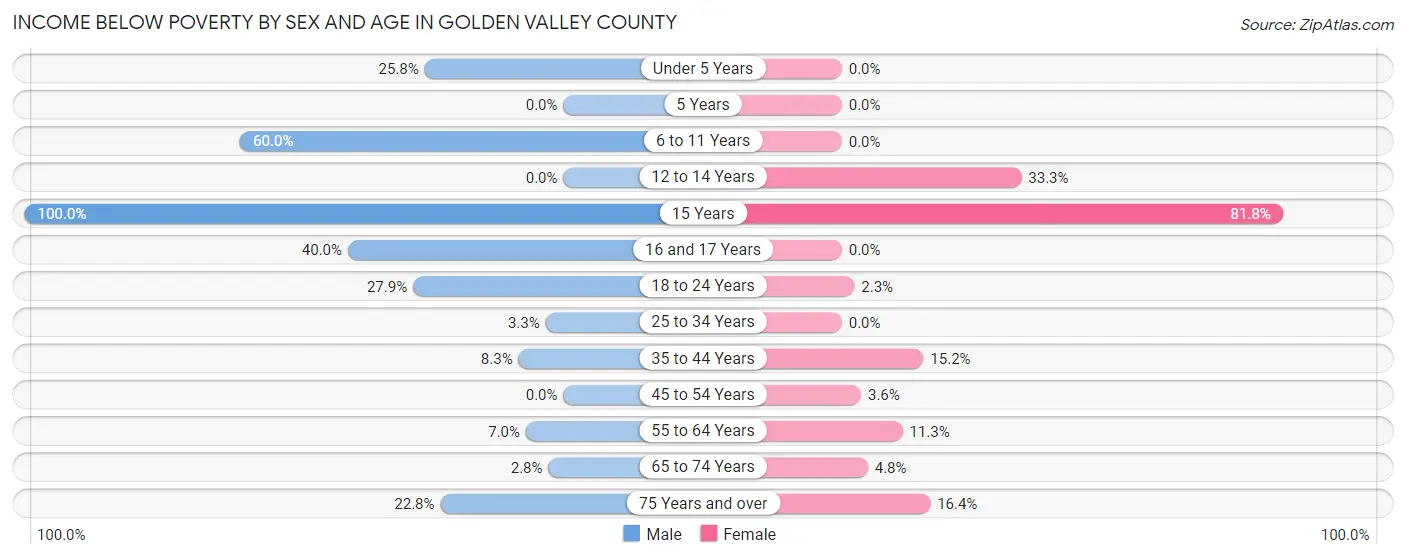
| Age Bracket | Male | Female |
| Under 5 Years | 17 (25.8%) | 0 (0.0%) |
| 5 Years | 0 (0.0%) | 0 (0.0%) |
| 6 to 11 Years | 33 (60.0%) | 0 (0.0%) |
| 12 to 14 Years | 0 (0.0%) | 14 (33.3%) |
| 15 Years | 14 (100.0%) | 9 (81.8%) |
| 16 and 17 Years | 12 (40.0%) | 0 (0.0%) |
| 18 to 24 Years | 12 (27.9%) | 1 (2.3%) |
| 25 to 34 Years | 3 (3.3%) | 0 (0.0%) |
| 35 to 44 Years | 5 (8.3%) | 15 (15.1%) |
| 45 to 54 Years | 0 (0.0%) | 4 (3.6%) |
| 55 to 64 Years | 11 (7.0%) | 16 (11.3%) |
| 65 to 74 Years | 3 (2.8%) | 4 (4.8%) |
| 75 Years and over | 21 (22.8%) | 21 (16.4%) |
| Total | 131 (15.4%) | 84 (9.8%) |
Income Above Poverty by Sex and Age in Golden Valley County
According to the poverty statistics in Golden Valley County, males aged 12 to 14 years and females aged under 5 years are the age groups that are most secure financially, with 100.0% of males and 100.0% of females in these age groups living above the poverty line.
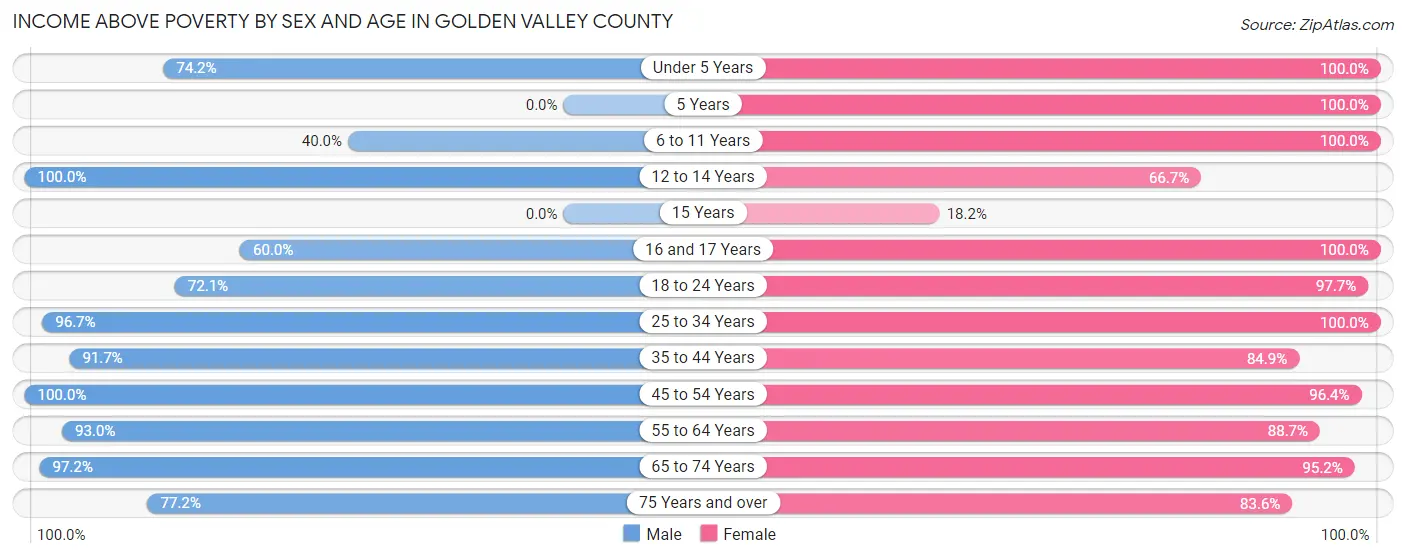
| Age Bracket | Male | Female |
| Under 5 Years | 49 (74.2%) | 51 (100.0%) |
| 5 Years | 0 (0.0%) | 5 (100.0%) |
| 6 to 11 Years | 22 (40.0%) | 41 (100.0%) |
| 12 to 14 Years | 19 (100.0%) | 28 (66.7%) |
| 15 Years | 0 (0.0%) | 2 (18.2%) |
| 16 and 17 Years | 18 (60.0%) | 13 (100.0%) |
| 18 to 24 Years | 31 (72.1%) | 42 (97.7%) |
| 25 to 34 Years | 88 (96.7%) | 89 (100.0%) |
| 35 to 44 Years | 55 (91.7%) | 84 (84.9%) |
| 45 to 54 Years | 116 (100.0%) | 108 (96.4%) |
| 55 to 64 Years | 147 (93.0%) | 126 (88.7%) |
| 65 to 74 Years | 105 (97.2%) | 79 (95.2%) |
| 75 Years and over | 71 (77.2%) | 107 (83.6%) |
| Total | 721 (84.6%) | 775 (90.2%) |
Income Below Poverty Among Married-Couple Families in Golden Valley County
The poverty statistics for married-couple families in Golden Valley County show that 5.0% or 22 of the total 444 families live below the poverty line. Families with no children have the highest poverty rate of 6.9%, comprising of 22 families. On the other hand, families with 1 or 2 children have the lowest poverty rate of 0.0%, which includes 0 families.
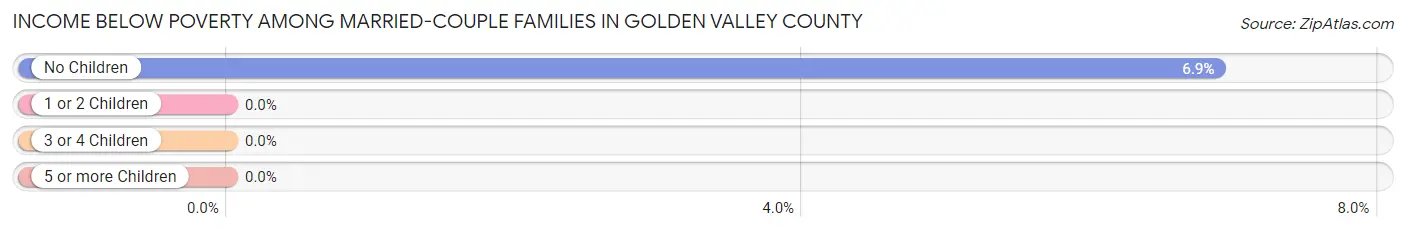
| Children | Above Poverty | Below Poverty |
| No Children | 298 (93.1%) | 22 (6.9%) |
| 1 or 2 Children | 90 (100.0%) | 0 (0.0%) |
| 3 or 4 Children | 32 (100.0%) | 0 (0.0%) |
| 5 or more Children | 2 (100.0%) | 0 (0.0%) |
| Total | 422 (95.1%) | 22 (5.0%) |
Income Below Poverty Among Single-Parent Households in Golden Valley County
According to the poverty data in Golden Valley County, 15.6% or 5 single-father households and 45.5% or 15 single-mother households are living below the poverty line. Among single-father households, those with no children have the highest poverty rate, with 5 households (20.0%) experiencing poverty. Likewise, among single-mother households, those with 5 or more children have the highest poverty rate, with 14 households (100.0%) falling below the poverty line.
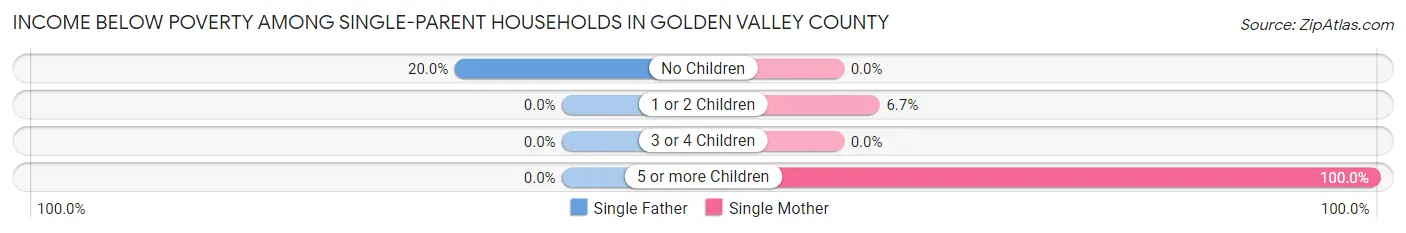
| Children | Single Father | Single Mother |
| No Children | 5 (20.0%) | 0 (0.0%) |
| 1 or 2 Children | 0 (0.0%) | 1 (6.7%) |
| 3 or 4 Children | 0 (0.0%) | 0 (0.0%) |
| 5 or more Children | 0 (0.0%) | 14 (100.0%) |
| Total | 5 (15.6%) | 15 (45.5%) |
Income Below Poverty Among Married-Couple vs Single-Parent Households in Golden Valley County
The poverty data for Golden Valley County shows that 22 of the married-couple family households (5.0%) and 20 of the single-parent households (30.8%) are living below the poverty level. Within the married-couple family households, those with no children have the highest poverty rate, with 22 households (6.9%) falling below the poverty line. Among the single-parent households, those with 5 or more children have the highest poverty rate, with 14 household (100.0%) living below poverty.
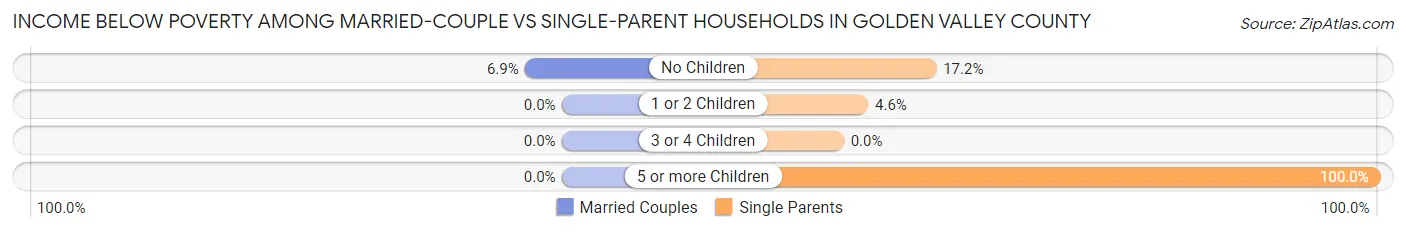
| Children | Married-Couple Families | Single-Parent Households |
| No Children | 22 (6.9%) | 5 (17.2%) |
| 1 or 2 Children | 0 (0.0%) | 1 (4.5%) |
| 3 or 4 Children | 0 (0.0%) | 0 (0.0%) |
| 5 or more Children | 0 (0.0%) | 14 (100.0%) |
| Total | 22 (5.0%) | 20 (30.8%) |
Race in Golden Valley County
The most populous races in Golden Valley County are White / Caucasian (1,554 | 89.6%), Two or more Races (164 | 9.5%), and Hispanic or Latino (92 | 5.3%).
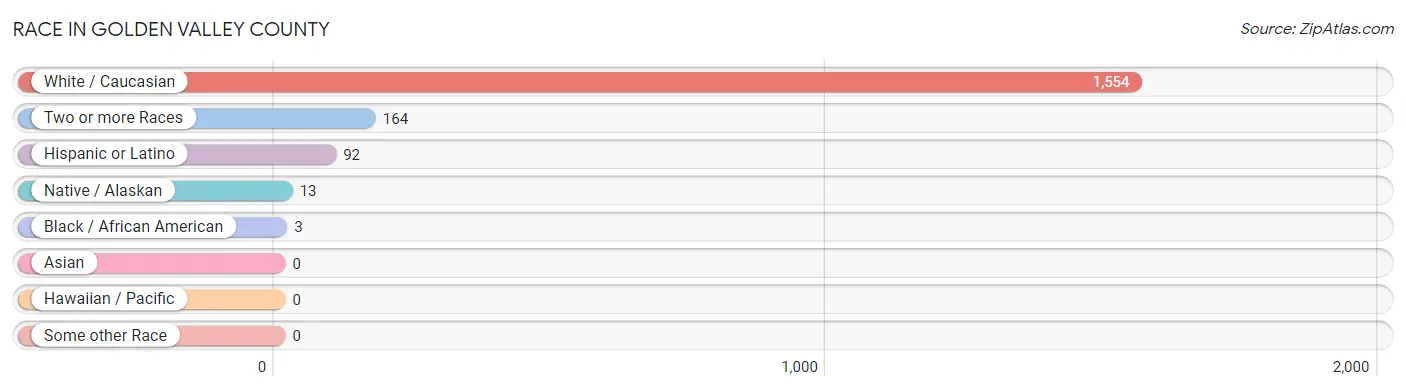
| Race | # Population | % Population |
| Asian | 0 | 0.0% |
| Black / African American | 3 | 0.2% |
| Hawaiian / Pacific | 0 | 0.0% |
| Hispanic or Latino | 92 | 5.3% |
| Native / Alaskan | 13 | 0.7% |
| White / Caucasian | 1,554 | 89.6% |
| Two or more Races | 164 | 9.5% |
| Some other Race | 0 | 0.0% |
| Total | 1,734 | 100.0% |
Ancestry in Golden Valley County
The most populous ancestries reported in Golden Valley County are German (927 | 53.5%), Irish (241 | 13.9%), Polish (123 | 7.1%), Norwegian (101 | 5.8%), and English (100 | 5.8%), together accounting for 86.0% of all Golden Valley County residents.
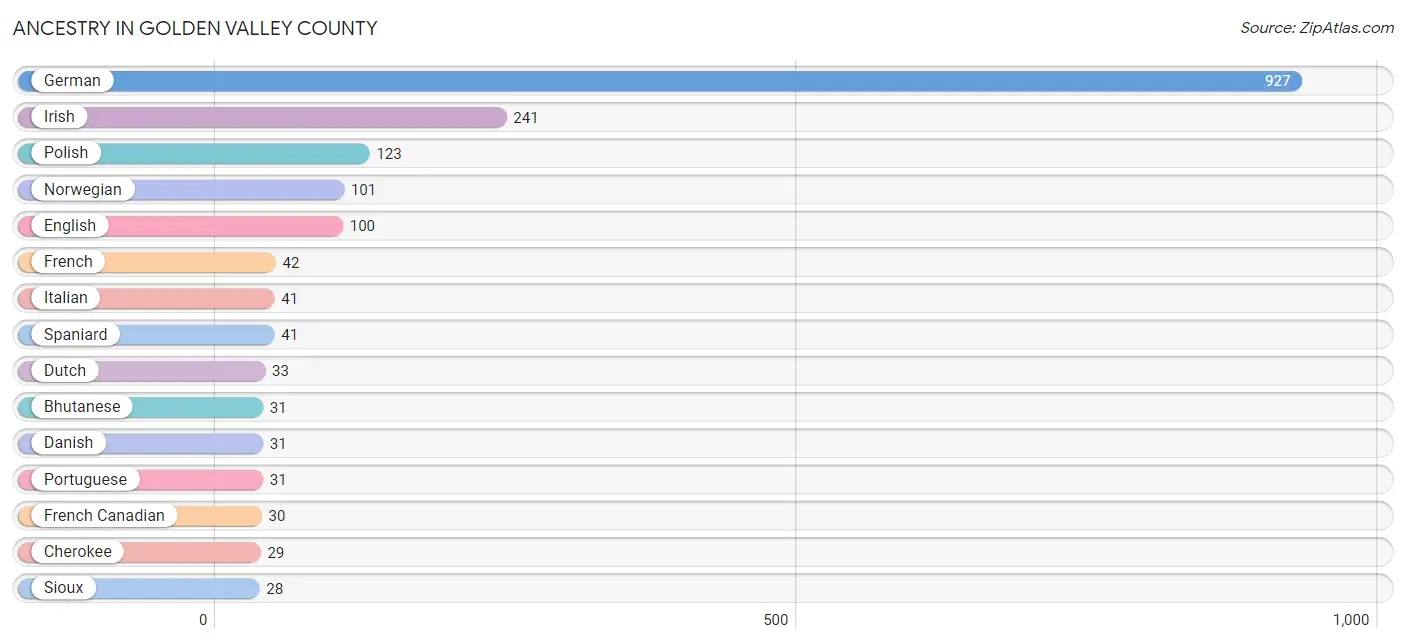
| Ancestry | # Population | % Population |
| American | 14 | 0.8% |
| Bhutanese | 31 | 1.8% |
| Bulgarian | 11 | 0.6% |
| Cherokee | 29 | 1.7% |
| Czech | 19 | 1.1% |
| Danish | 31 | 1.8% |
| Dutch | 33 | 1.9% |
| English | 100 | 5.8% |
| European | 7 | 0.4% |
| French | 42 | 2.4% |
| French Canadian | 30 | 1.7% |
| German | 927 | 53.5% |
| German Russian | 3 | 0.2% |
| Hungarian | 9 | 0.5% |
| Irish | 241 | 13.9% |
| Italian | 41 | 2.4% |
| Mexican | 12 | 0.7% |
| Norwegian | 101 | 5.8% |
| Polish | 123 | 7.1% |
| Portuguese | 31 | 1.8% |
| Puerto Rican | 13 | 0.7% |
| Russian | 16 | 0.9% |
| Scotch-Irish | 5 | 0.3% |
| Scottish | 5 | 0.3% |
| Sioux | 28 | 1.6% |
| Spaniard | 41 | 2.4% |
| Spanish | 26 | 1.5% |
| Swedish | 22 | 1.3% |
| Swiss | 16 | 0.9% | View All 29 Rows |
Immigrants in Golden Valley County
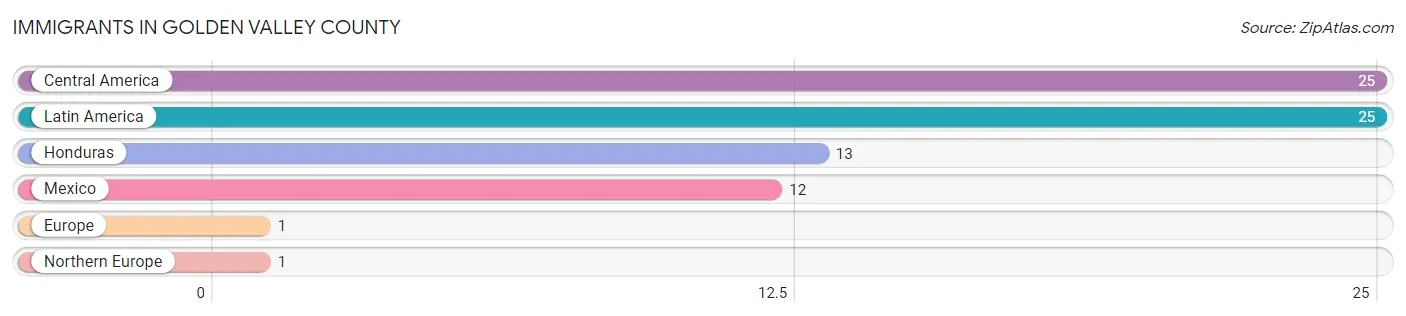
The most numerous immigrant groups reported in Golden Valley County came from Central America (25 | 1.4%), Latin America (25 | 1.4%), Honduras (13 | 0.7%), Mexico (12 | 0.7%), and Europe (1 | 0.1%), together accounting for 4.4% of all Golden Valley County residents.
| Immigration Origin | # Population | % Population |
| Central America | 25 | 1.4% |
| Europe | 1 | 0.1% |
| Honduras | 13 | 0.7% |
| Latin America | 25 | 1.4% |
| Mexico | 12 | 0.7% |
| Northern Europe | 1 | 0.1% | View All 6 Rows |
Sex and Age in Golden Valley County
Sex and Age in Golden Valley County
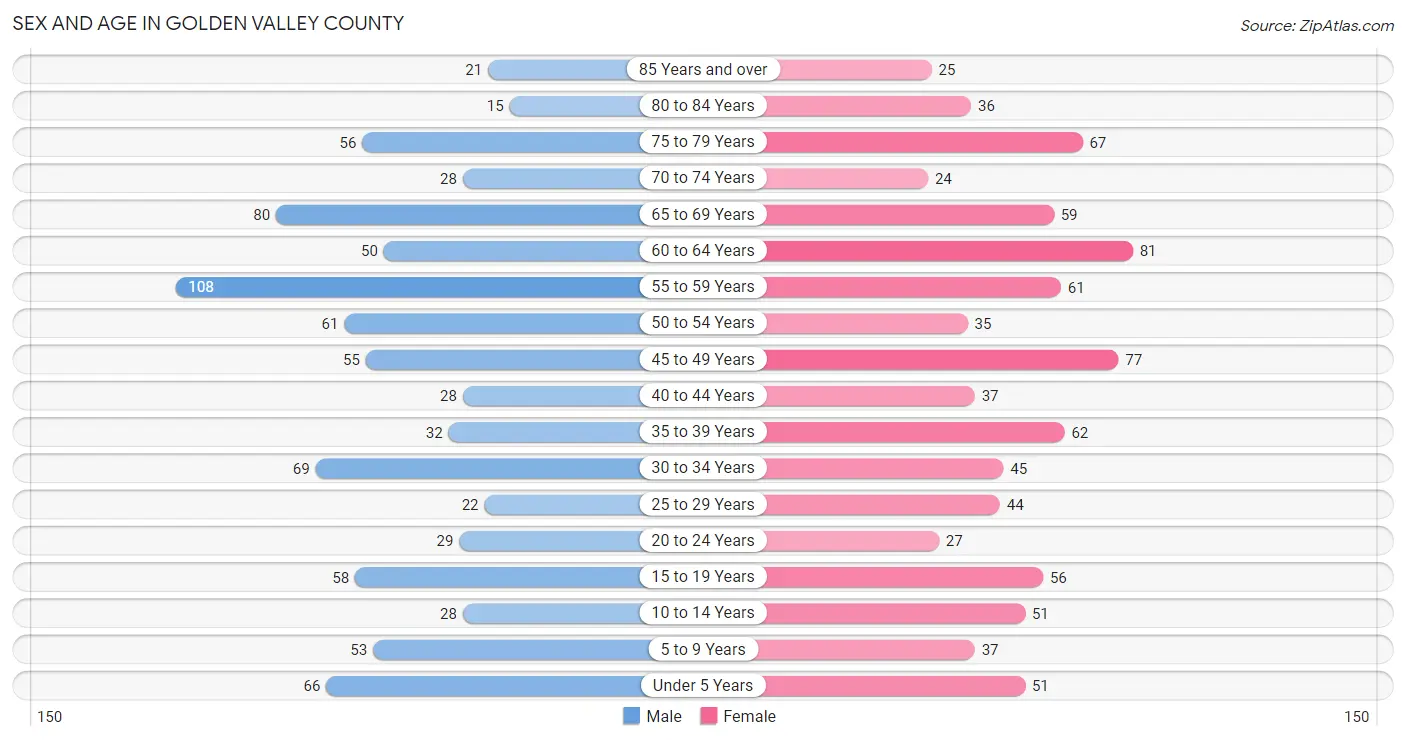
The most populous age groups in Golden Valley County are 55 to 59 Years (108 | 12.6%) for men and 60 to 64 Years (81 | 9.3%) for women.
| Age Bracket | Male | Female |
| Under 5 Years | 66 (7.7%) | 51 (5.8%) |
| 5 to 9 Years | 53 (6.2%) | 37 (4.2%) |
| 10 to 14 Years | 28 (3.3%) | 51 (5.8%) |
| 15 to 19 Years | 58 (6.8%) | 56 (6.4%) |
| 20 to 24 Years | 29 (3.4%) | 27 (3.1%) |
| 25 to 29 Years | 22 (2.6%) | 44 (5.0%) |
| 30 to 34 Years | 69 (8.0%) | 45 (5.1%) |
| 35 to 39 Years | 32 (3.7%) | 62 (7.1%) |
| 40 to 44 Years | 28 (3.3%) | 37 (4.2%) |
| 45 to 49 Years | 55 (6.4%) | 77 (8.8%) |
| 50 to 54 Years | 61 (7.1%) | 35 (4.0%) |
| 55 to 59 Years | 108 (12.6%) | 61 (7.0%) |
| 60 to 64 Years | 50 (5.8%) | 81 (9.3%) |
| 65 to 69 Years | 80 (9.3%) | 59 (6.7%) |
| 70 to 74 Years | 28 (3.3%) | 24 (2.7%) |
| 75 to 79 Years | 56 (6.5%) | 67 (7.7%) |
| 80 to 84 Years | 15 (1.8%) | 36 (4.1%) |
| 85 Years and over | 21 (2.4%) | 25 (2.9%) |
| Total | 859 (100.0%) | 875 (100.0%) |
Families and Households in Golden Valley County
Median Family Size in Golden Valley County
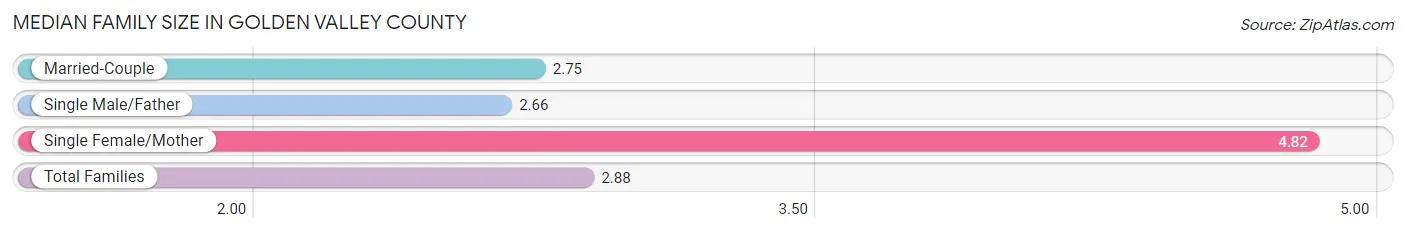
The median family size in Golden Valley County is 2.88 persons per family, with single female/mother families (33 | 6.5%) accounting for the largest median family size of 4.82 persons per family. On the other hand, single male/father families (32 | 6.3%) represent the smallest median family size with 2.66 persons per family.
| Family Type | # Families | Family Size |
| Married-Couple | 444 (87.2%) | 2.75 |
| Single Male/Father | 32 (6.3%) | 2.66 |
| Single Female/Mother | 33 (6.5%) | 4.82 |
| Total Families | 509 (100.0%) | 2.88 |
Median Household Size in Golden Valley County
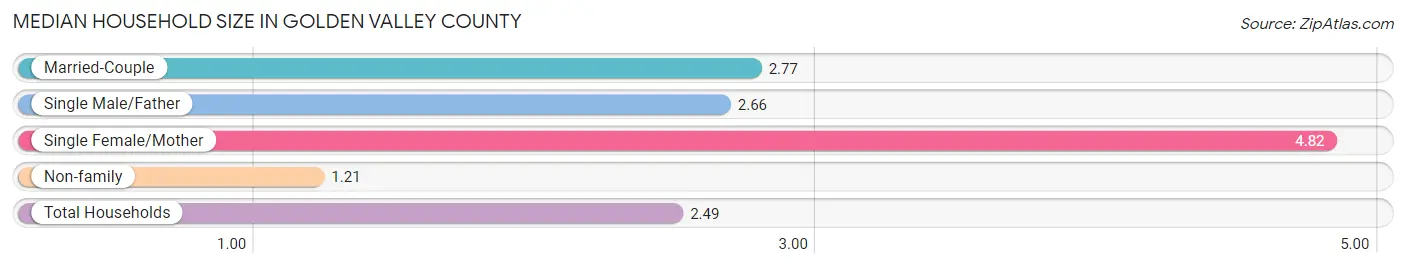
The median household size in Golden Valley County is 2.49 persons per household, with single female/mother households (33 | 4.9%) accounting for the largest median household size of 4.82 persons per household. non-family households (164 | 24.4%) represent the smallest median household size with 1.21 persons per household.
| Household Type | # Households | Household Size |
| Married-Couple | 444 (66.0%) | 2.77 |
| Single Male/Father | 32 (4.8%) | 2.66 |
| Single Female/Mother | 33 (4.9%) | 4.82 |
| Non-family | 164 (24.4%) | 1.21 |
| Total Households | 673 (100.0%) | 2.49 |
Household Size by Marriage Status in Golden Valley County
Out of a total of 673 households in Golden Valley County, 509 (75.6%) are family households, while 164 (24.4%) are nonfamily households. The most numerous type of family households are 2-person households, comprising 309, and the most common type of nonfamily households are 1-person households, comprising 147.
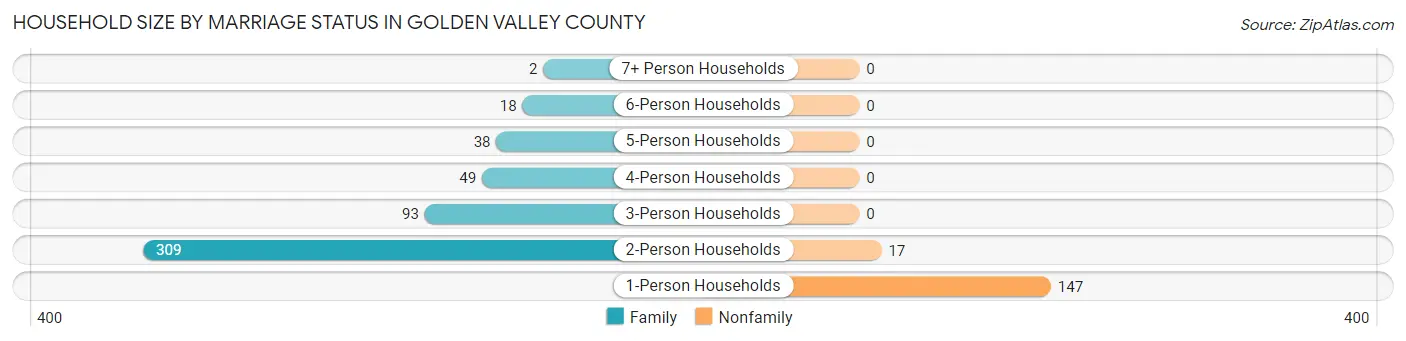
| Household Size | Family Households | Nonfamily Households |
| 1-Person Households | - | 147 (21.8%) |
| 2-Person Households | 309 (45.9%) | 17 (2.5%) |
| 3-Person Households | 93 (13.8%) | 0 (0.0%) |
| 4-Person Households | 49 (7.3%) | 0 (0.0%) |
| 5-Person Households | 38 (5.7%) | 0 (0.0%) |
| 6-Person Households | 18 (2.7%) | 0 (0.0%) |
| 7+ Person Households | 2 (0.3%) | 0 (0.0%) |
| Total | 509 (75.6%) | 164 (24.4%) |
Female Fertility in Golden Valley County
Fertility by Age in Golden Valley County
Average fertility rate in Golden Valley County is 6.0 births per 1,000 women. Women in the age bracket of 20 to 34 years have the highest fertility rate with 9.0 births per 1,000 women. Women in the age bracket of 20 to 34 years acount for 50.0% of all women with births.
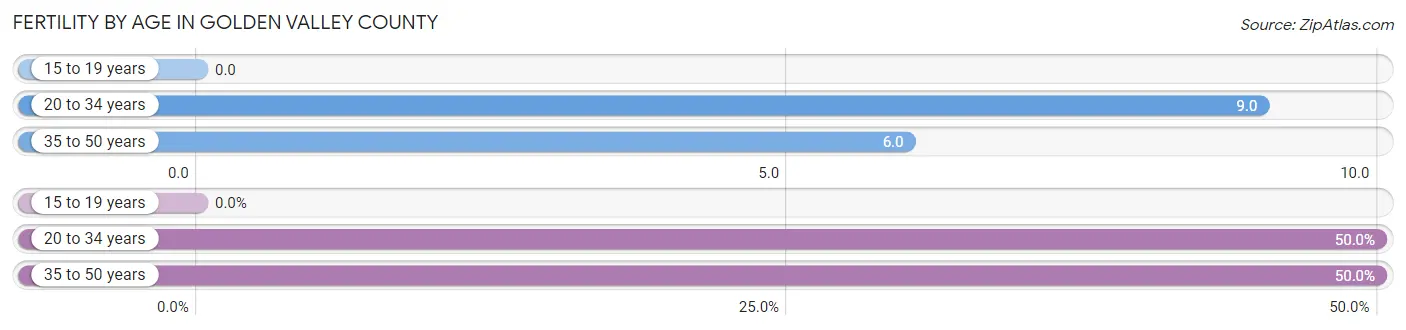
| Age Bracket | Women with Births | Births / 1,000 Women |
| 15 to 19 years | 0 (0.0%) | 0.0 |
| 20 to 34 years | 1 (50.0%) | 9.0 |
| 35 to 50 years | 1 (50.0%) | 6.0 |
| Total | 2 (100.0%) | 6.0 |
Fertility by Age by Marriage Status in Golden Valley County
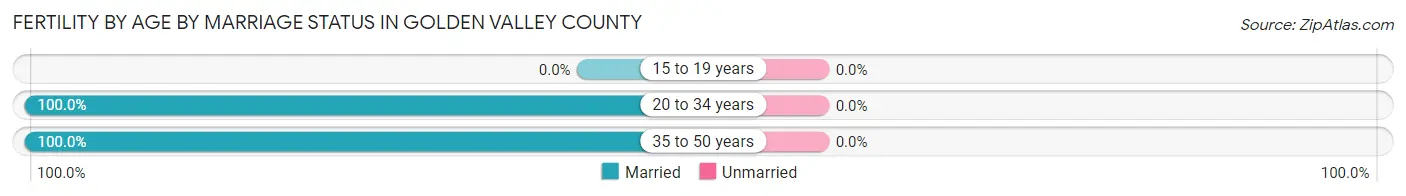
| Age Bracket | Married | Unmarried |
| 15 to 19 years | 0 (0.0%) | 0 (0.0%) |
| 20 to 34 years | 1 (100.0%) | 0 (0.0%) |
| 35 to 50 years | 1 (100.0%) | 0 (0.0%) |
| Total | 2 (100.0%) | 0 (0.0%) |
Fertility by Education in Golden Valley County
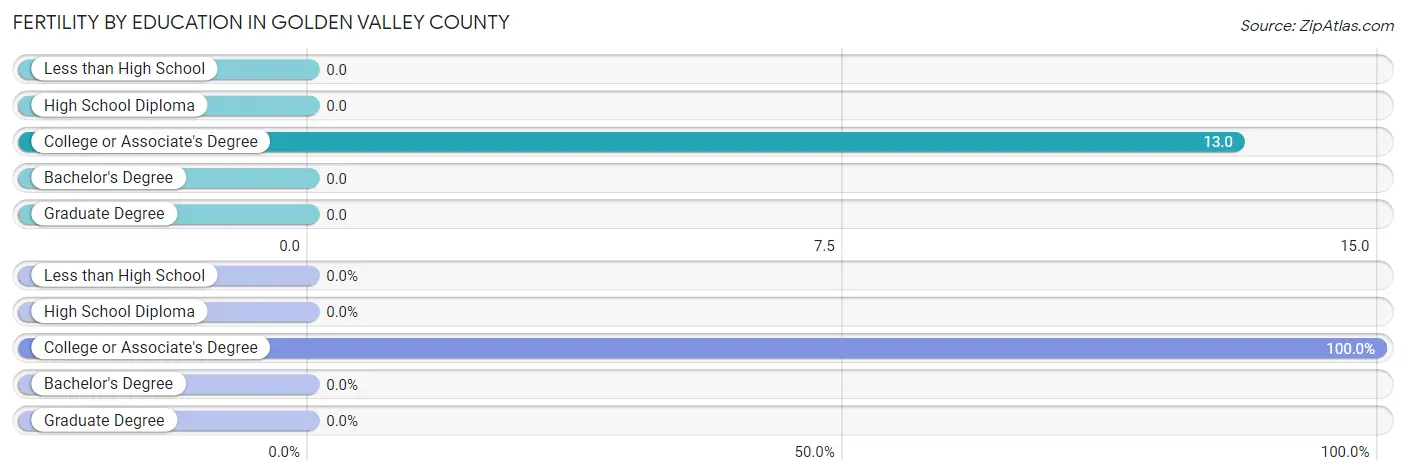
| Educational Attainment | Women with Births | Births / 1,000 Women |
| Less than High School | 0 (0.0%) | 0.0 |
| High School Diploma | 0 (0.0%) | 0.0 |
| College or Associate's Degree | 2 (100.0%) | 13.0 |
| Bachelor's Degree | 0 (0.0%) | 0.0 |
| Graduate Degree | 0 (0.0%) | 0.0 |
| Total | 2 (100.0%) | 6.0 |
Fertility by Education by Marriage Status in Golden Valley County
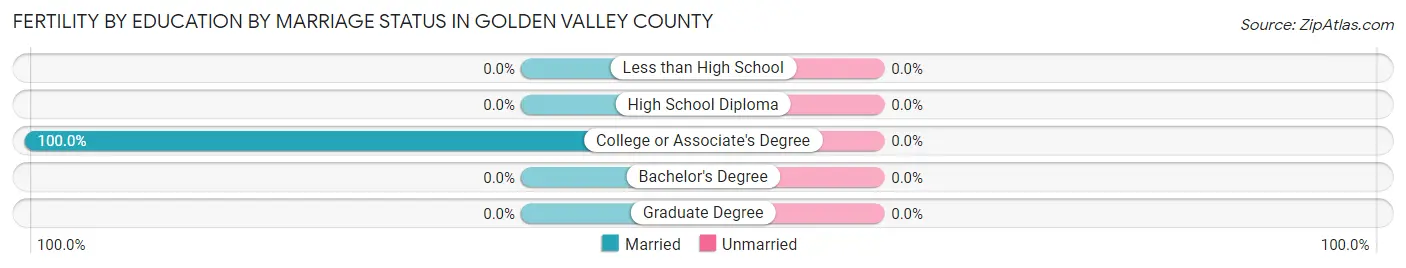
| Educational Attainment | Married | Unmarried |
| Less than High School | 0 (0.0%) | 0 (0.0%) |
| High School Diploma | 0 (0.0%) | 0 (0.0%) |
| College or Associate's Degree | 2 (100.0%) | 0 (0.0%) |
| Bachelor's Degree | 0 (0.0%) | 0 (0.0%) |
| Graduate Degree | 0 (0.0%) | 0 (0.0%) |
| Total | 2 (100.0%) | 0 (0.0%) |
Employment Characteristics in Golden Valley County
Employment by Class of Employer in Golden Valley County
Among the 808 employed individuals in Golden Valley County, private company employees (384 | 47.5%), not-for-profit organizations (107 | 13.2%), and self-employed (not incorporated) (105 | 13.0%) make up the most common classes of employment.
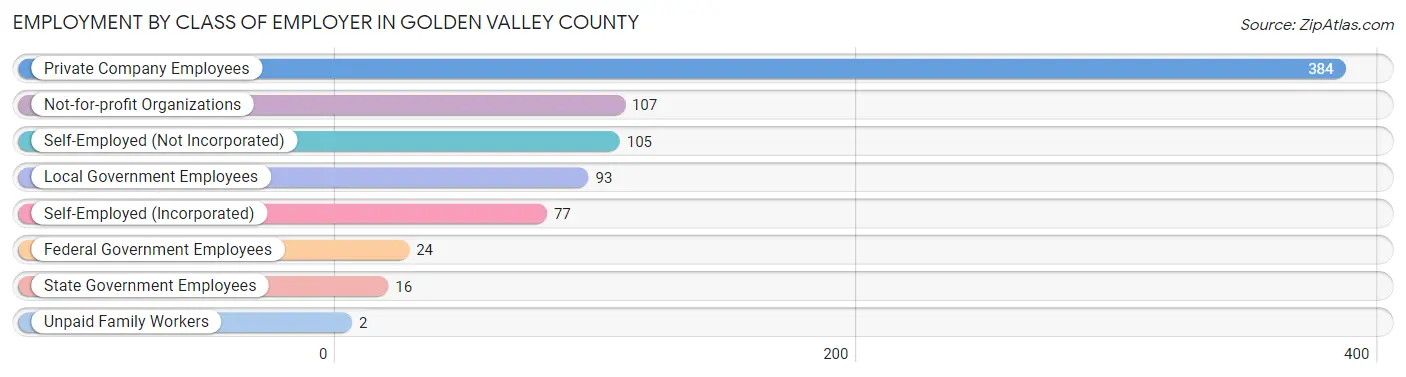
| Employer Class | # Employees | % Employees |
| Private Company Employees | 384 | 47.5% |
| Self-Employed (Incorporated) | 77 | 9.5% |
| Self-Employed (Not Incorporated) | 105 | 13.0% |
| Not-for-profit Organizations | 107 | 13.2% |
| Local Government Employees | 93 | 11.5% |
| State Government Employees | 16 | 2.0% |
| Federal Government Employees | 24 | 3.0% |
| Unpaid Family Workers | 2 | 0.3% |
| Total | 808 | 100.0% |
Employment Status by Age in Golden Valley County
According to the labor force statistics for Golden Valley County, out of the total population over 16 years of age (1,418), 60.4% or 856 individuals are in the labor force, with 5.4% or 46 of them unemployed. The age group with the highest labor force participation rate is 25 to 29 years, with 100.0% or 66 individuals in the labor force. Within the labor force, the 35 to 44 years age range has the highest percentage of unemployed individuals, with 15.4% or 19 of them being unemployed.
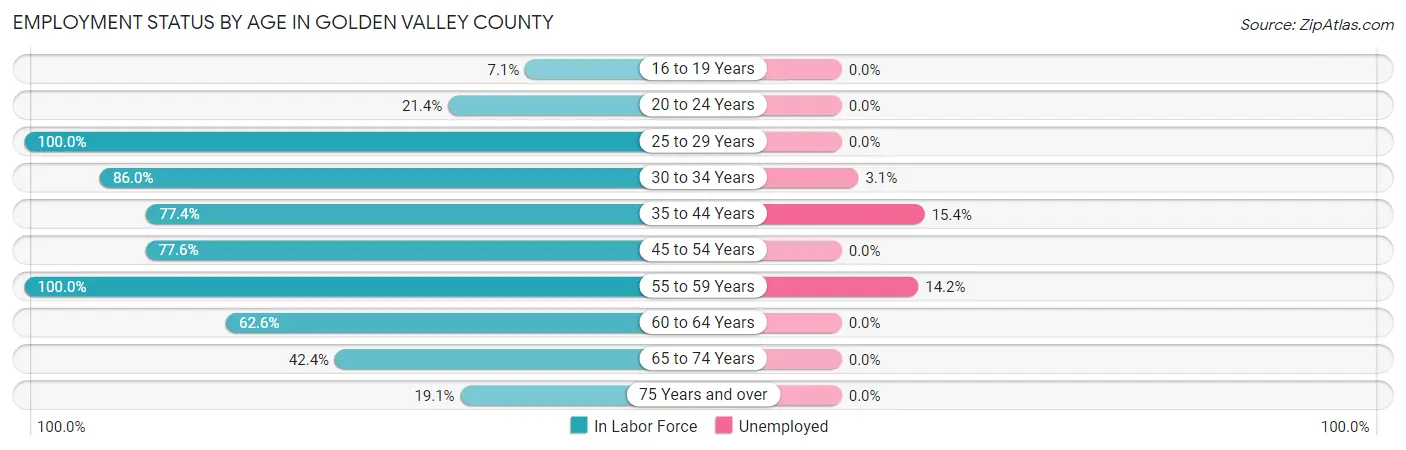
| Age Bracket | In Labor Force | Unemployed |
| 16 to 19 Years | 6 (7.1%) | 0 (0.0%) |
| 20 to 24 Years | 12 (21.4%) | 0 (0.0%) |
| 25 to 29 Years | 66 (100.0%) | 0 (0.0%) |
| 30 to 34 Years | 98 (86.0%) | 3 (3.1%) |
| 35 to 44 Years | 123 (77.4%) | 19 (15.4%) |
| 45 to 54 Years | 177 (77.6%) | 0 (0.0%) |
| 55 to 59 Years | 169 (100.0%) | 24 (14.2%) |
| 60 to 64 Years | 82 (62.6%) | 0 (0.0%) |
| 65 to 74 Years | 81 (42.4%) | 0 (0.0%) |
| 75 Years and over | 42 (19.1%) | 0 (0.0%) |
| Total | 856 (60.4%) | 46 (5.4%) |
Employment Status by Educational Attainment in Golden Valley County
According to labor force statistics for Golden Valley County, 82.5% of individuals (715) out of the total population between 25 and 64 years of age (867) are in the labor force, with 6.4% or 46 of them being unemployed. The group with the highest labor force participation rate are those with the educational attainment of high school diploma, with 90.2% or 129 individuals in the labor force. Within the labor force, individuals with less than high school education have the highest percentage of unemployment, with 30.0% or 3 of them being unemployed.
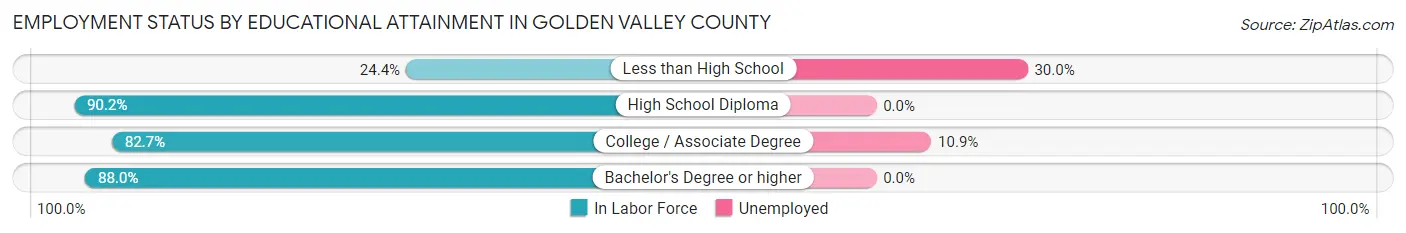
| Educational Attainment | In Labor Force | Unemployed |
| Less than High School | 10 (24.4%) | 12 (30.0%) |
| High School Diploma | 129 (90.2%) | 0 (0.0%) |
| College / Associate Degree | 393 (82.7%) | 52 (10.9%) |
| Bachelor's Degree or higher | 183 (88.0%) | 0 (0.0%) |
| Total | 715 (82.5%) | 55 (6.4%) |
Employment Occupations by Sex in Golden Valley County
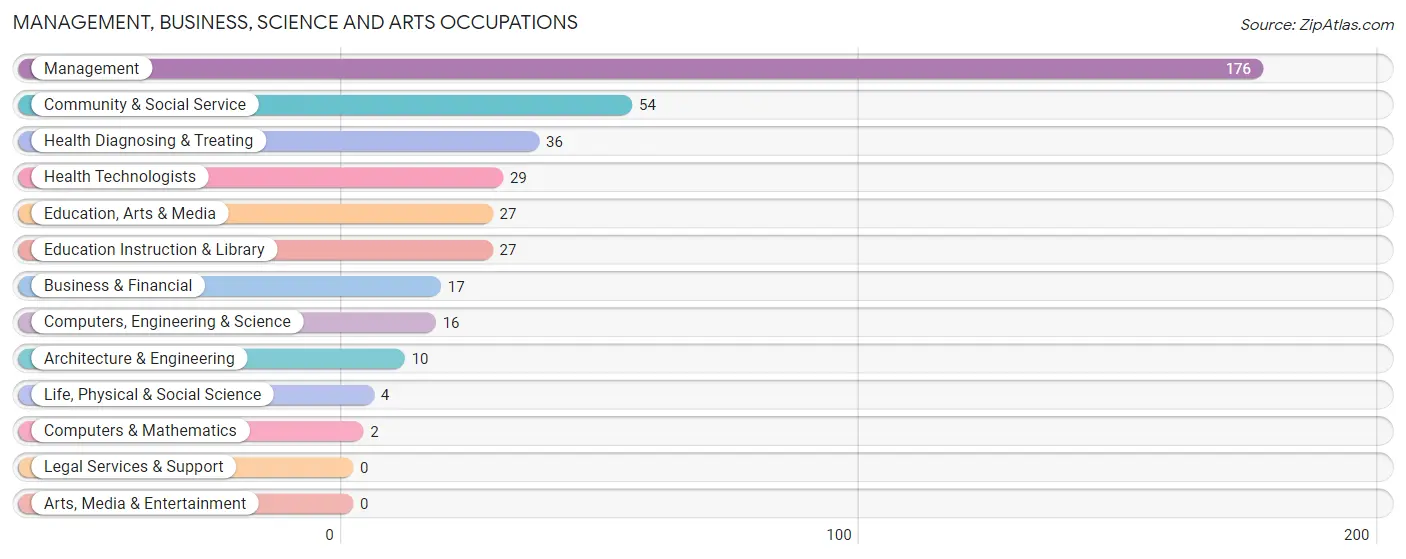
Management, Business, Science and Arts Occupations
The most common Management, Business, Science and Arts occupations in Golden Valley County are Management (176 | 21.7%), Community & Social Service (54 | 6.7%), Health Diagnosing & Treating (36 | 4.4%), Health Technologists (29 | 3.6%), and Education, Arts & Media (27 | 3.3%).
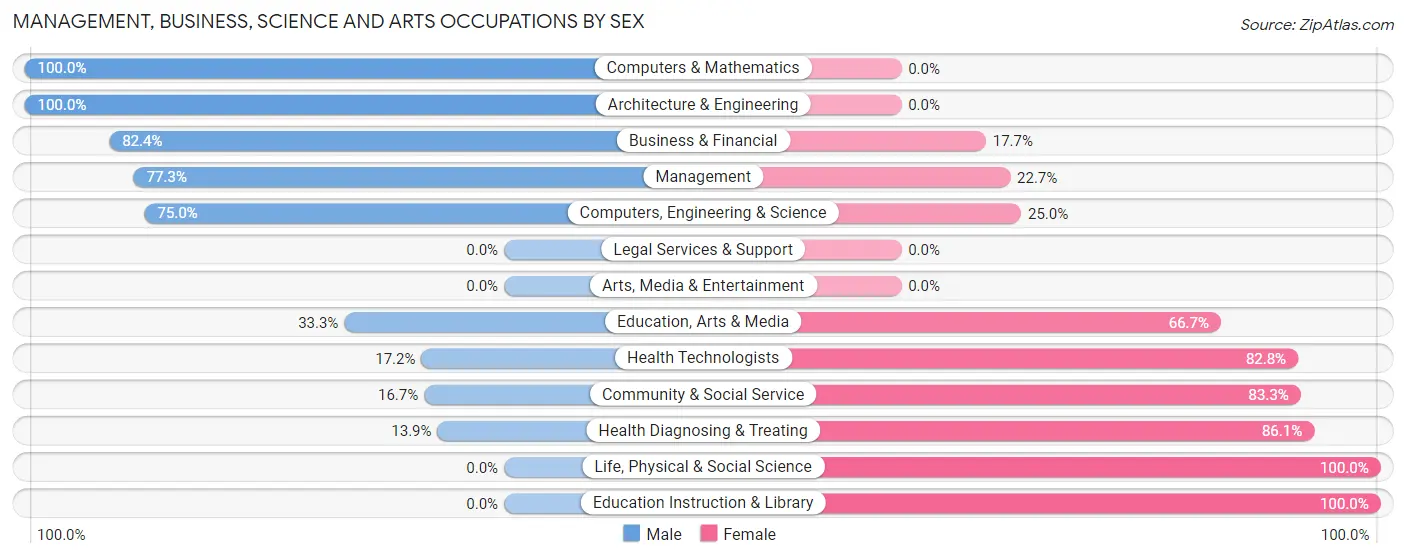
Management, Business, Science and Arts Occupations by Sex
Within the Management, Business, Science and Arts occupations in Golden Valley County, the most male-oriented occupations are Computers & Mathematics (100.0%), Architecture & Engineering (100.0%), and Business & Financial (82.4%), while the most female-oriented occupations are Life, Physical & Social Science (100.0%), Education Instruction & Library (100.0%), and Health Diagnosing & Treating (86.1%).
| Occupation | Male | Female |
| Management | 136 (77.3%) | 40 (22.7%) |
| Business & Financial | 14 (82.4%) | 3 (17.6%) |
| Computers, Engineering & Science | 12 (75.0%) | 4 (25.0%) |
| Computers & Mathematics | 2 (100.0%) | 0 (0.0%) |
| Architecture & Engineering | 10 (100.0%) | 0 (0.0%) |
| Life, Physical & Social Science | 0 (0.0%) | 4 (100.0%) |
| Community & Social Service | 9 (16.7%) | 45 (83.3%) |
| Education, Arts & Media | 9 (33.3%) | 18 (66.7%) |
| Legal Services & Support | 0 (0.0%) | 0 (0.0%) |
| Education Instruction & Library | 0 (0.0%) | 27 (100.0%) |
| Arts, Media & Entertainment | 0 (0.0%) | 0 (0.0%) |
| Health Diagnosing & Treating | 5 (13.9%) | 31 (86.1%) |
| Health Technologists | 5 (17.2%) | 24 (82.8%) |
| Total (Category) | 176 (58.9%) | 123 (41.1%) |
| Total (Overall) | 458 (56.5%) | 352 (43.5%) |
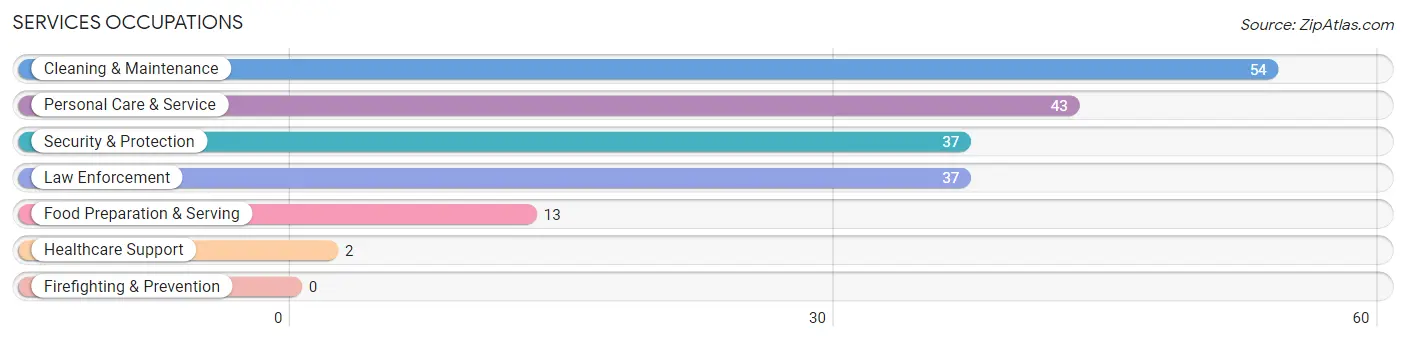
Services Occupations
The most common Services occupations in Golden Valley County are Cleaning & Maintenance (54 | 6.7%), Personal Care & Service (43 | 5.3%), Security & Protection (37 | 4.6%), Law Enforcement (37 | 4.6%), and Food Preparation & Serving (13 | 1.6%).
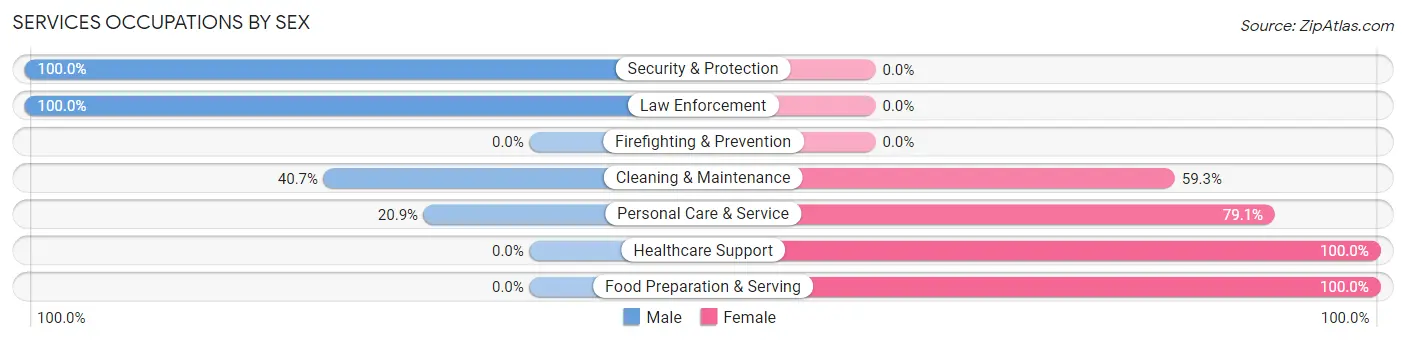
Services Occupations by Sex
Within the Services occupations in Golden Valley County, the most male-oriented occupations are Security & Protection (100.0%), Law Enforcement (100.0%), and Cleaning & Maintenance (40.7%), while the most female-oriented occupations are Healthcare Support (100.0%), Food Preparation & Serving (100.0%), and Personal Care & Service (79.1%).
| Occupation | Male | Female |
| Healthcare Support | 0 (0.0%) | 2 (100.0%) |
| Security & Protection | 37 (100.0%) | 0 (0.0%) |
| Firefighting & Prevention | 0 (0.0%) | 0 (0.0%) |
| Law Enforcement | 37 (100.0%) | 0 (0.0%) |
| Food Preparation & Serving | 0 (0.0%) | 13 (100.0%) |
| Cleaning & Maintenance | 22 (40.7%) | 32 (59.3%) |
| Personal Care & Service | 9 (20.9%) | 34 (79.1%) |
| Total (Category) | 68 (45.6%) | 81 (54.4%) |
| Total (Overall) | 458 (56.5%) | 352 (43.5%) |
Sales and Office Occupations
The most common Sales and Office occupations in Golden Valley County are Office & Administration (104 | 12.8%), and Sales & Related (39 | 4.8%).
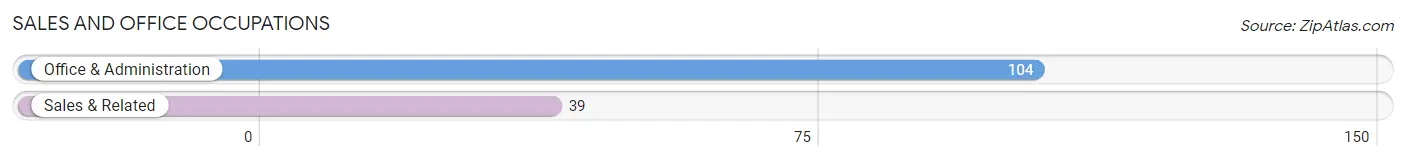
Sales and Office Occupations by Sex
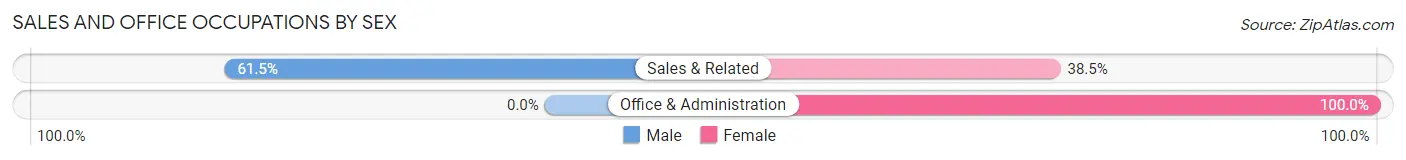
| Occupation | Male | Female |
| Sales & Related | 24 (61.5%) | 15 (38.5%) |
| Office & Administration | 0 (0.0%) | 104 (100.0%) |
| Total (Category) | 24 (16.8%) | 119 (83.2%) |
| Total (Overall) | 458 (56.5%) | 352 (43.5%) |
Natural Resources, Construction and Maintenance Occupations
The most common Natural Resources, Construction and Maintenance occupations in Golden Valley County are Farming, Fishing & Forestry (29 | 3.6%), Installation, Maintenance & Repair (22 | 2.7%), and Construction & Extraction (18 | 2.2%).
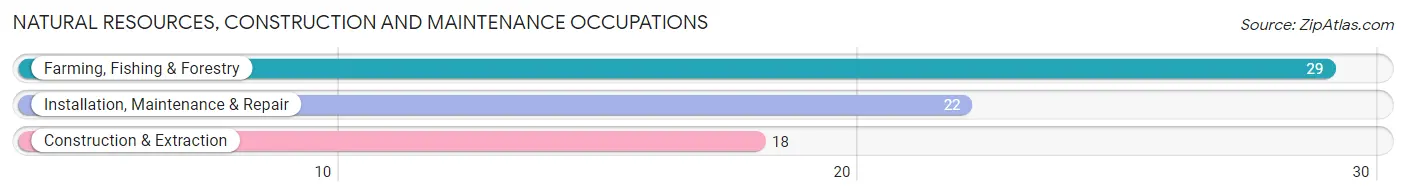
Natural Resources, Construction and Maintenance Occupations by Sex
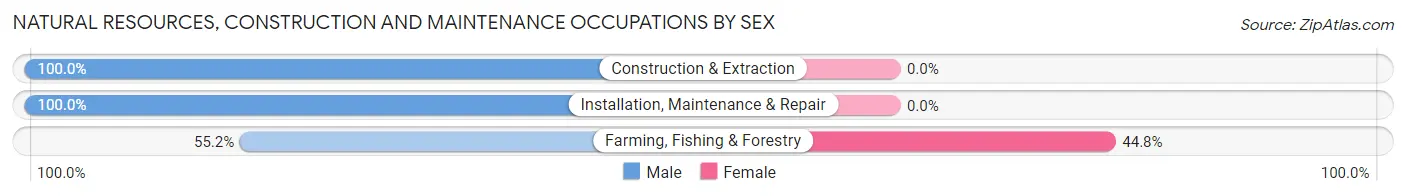
| Occupation | Male | Female |
| Farming, Fishing & Forestry | 16 (55.2%) | 13 (44.8%) |
| Construction & Extraction | 18 (100.0%) | 0 (0.0%) |
| Installation, Maintenance & Repair | 22 (100.0%) | 0 (0.0%) |
| Total (Category) | 56 (81.2%) | 13 (18.8%) |
| Total (Overall) | 458 (56.5%) | 352 (43.5%) |
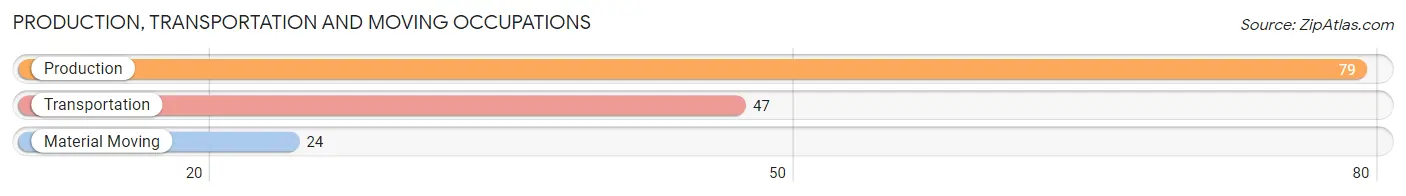
Production, Transportation and Moving Occupations
The most common Production, Transportation and Moving occupations in Golden Valley County are Production (79 | 9.8%), Transportation (47 | 5.8%), and Material Moving (24 | 3.0%).
Production, Transportation and Moving Occupations by Sex
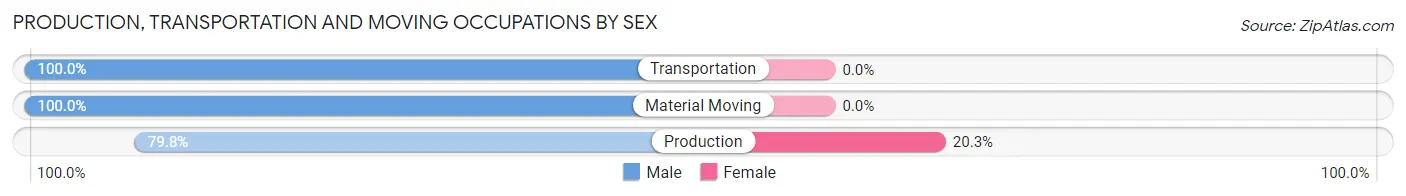
| Occupation | Male | Female |
| Production | 63 (79.7%) | 16 (20.3%) |
| Transportation | 47 (100.0%) | 0 (0.0%) |
| Material Moving | 24 (100.0%) | 0 (0.0%) |
| Total (Category) | 134 (89.3%) | 16 (10.7%) |
| Total (Overall) | 458 (56.5%) | 352 (43.5%) |
Employment Industries by Sex in Golden Valley County
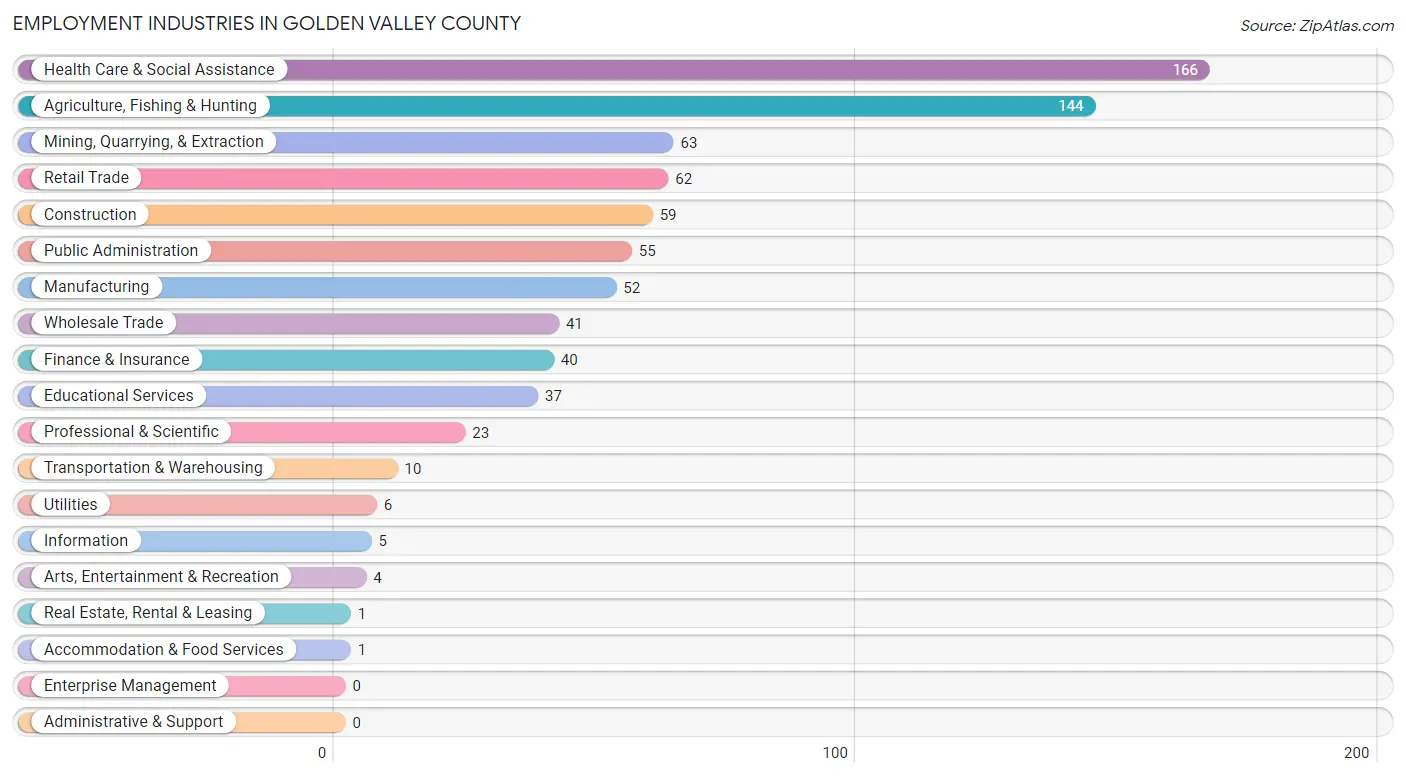
Employment Industries in Golden Valley County
The major employment industries in Golden Valley County include Health Care & Social Assistance (166 | 20.5%), Agriculture, Fishing & Hunting (144 | 17.8%), Mining, Quarrying, & Extraction (63 | 7.8%), Retail Trade (62 | 7.6%), and Construction (59 | 7.3%).
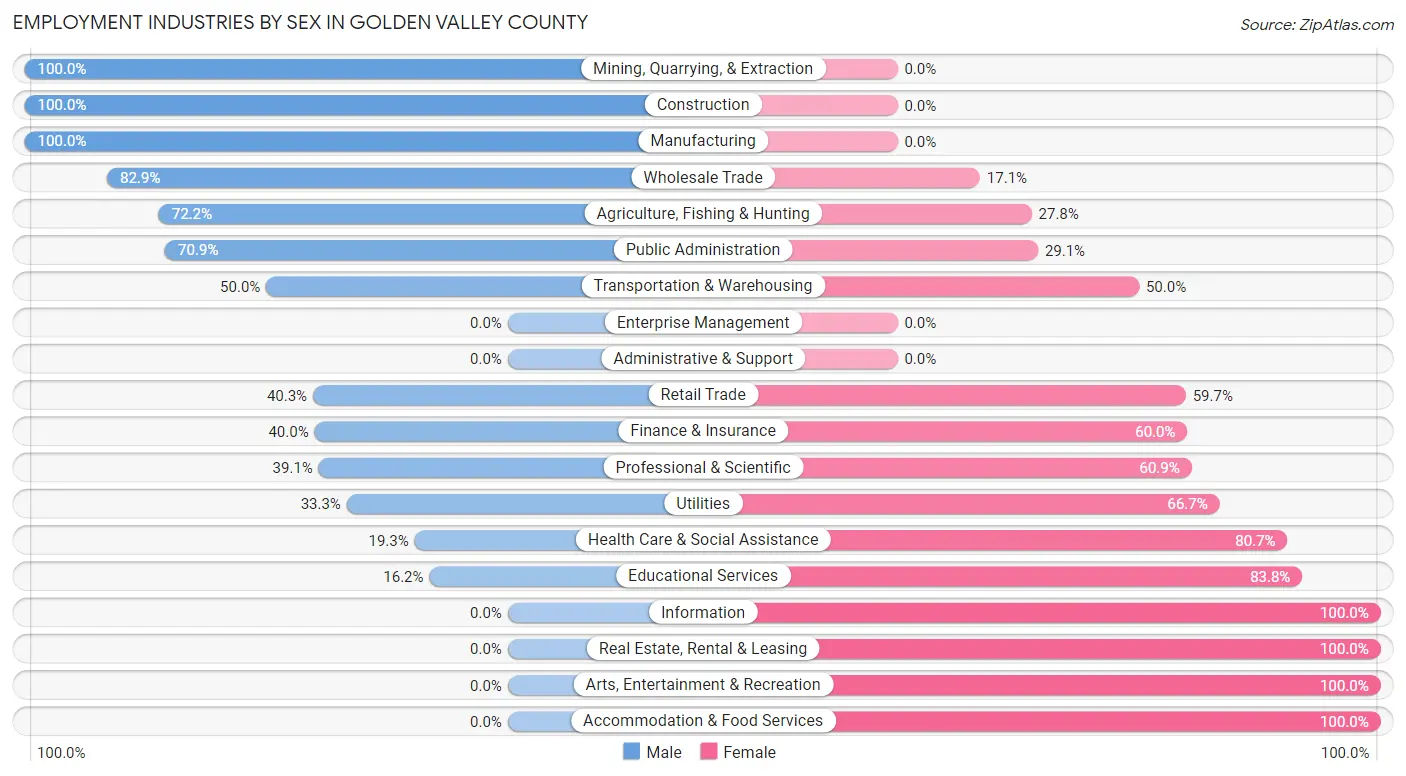
Employment Industries by Sex in Golden Valley County
The Golden Valley County industries that see more men than women are Mining, Quarrying, & Extraction (100.0%), Construction (100.0%), and Manufacturing (100.0%), whereas the industries that tend to have a higher number of women are Information (100.0%), Real Estate, Rental & Leasing (100.0%), and Arts, Entertainment & Recreation (100.0%).
| Industry | Male | Female |
| Agriculture, Fishing & Hunting | 104 (72.2%) | 40 (27.8%) |
| Mining, Quarrying, & Extraction | 63 (100.0%) | 0 (0.0%) |
| Construction | 59 (100.0%) | 0 (0.0%) |
| Manufacturing | 52 (100.0%) | 0 (0.0%) |
| Wholesale Trade | 34 (82.9%) | 7 (17.1%) |
| Retail Trade | 25 (40.3%) | 37 (59.7%) |
| Transportation & Warehousing | 5 (50.0%) | 5 (50.0%) |
| Utilities | 2 (33.3%) | 4 (66.7%) |
| Information | 0 (0.0%) | 5 (100.0%) |
| Finance & Insurance | 16 (40.0%) | 24 (60.0%) |
| Real Estate, Rental & Leasing | 0 (0.0%) | 1 (100.0%) |
| Professional & Scientific | 9 (39.1%) | 14 (60.9%) |
| Enterprise Management | 0 (0.0%) | 0 (0.0%) |
| Administrative & Support | 0 (0.0%) | 0 (0.0%) |
| Educational Services | 6 (16.2%) | 31 (83.8%) |
| Health Care & Social Assistance | 32 (19.3%) | 134 (80.7%) |
| Arts, Entertainment & Recreation | 0 (0.0%) | 4 (100.0%) |
| Accommodation & Food Services | 0 (0.0%) | 1 (100.0%) |
| Public Administration | 39 (70.9%) | 16 (29.1%) |
| Total | 458 (56.5%) | 352 (43.5%) |
Education in Golden Valley County
School Enrollment in Golden Valley County
The most common levels of schooling among the 382 students in Golden Valley County are high school (121 | 31.7%), elementary school (76 | 19.9%), and middle school (65 | 17.0%).
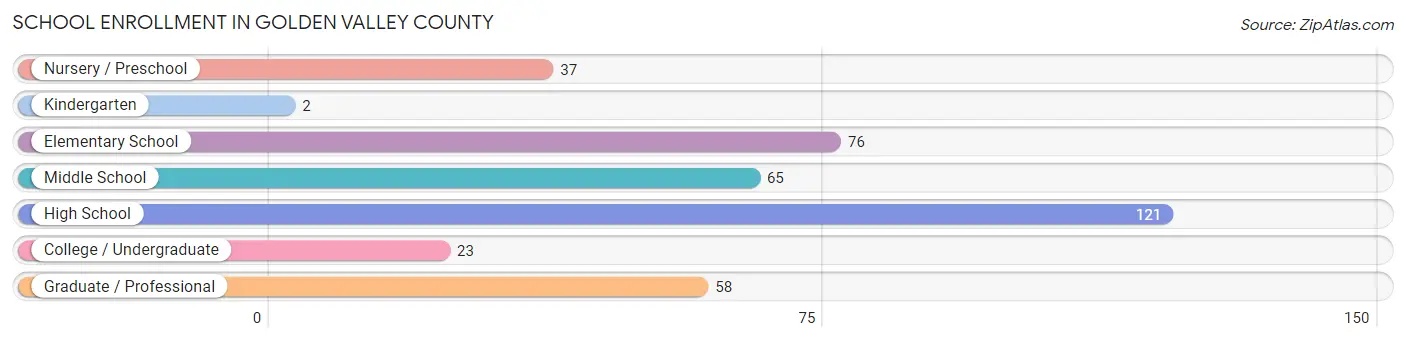
| School Level | # Students | % Students |
| Nursery / Preschool | 37 | 9.7% |
| Kindergarten | 2 | 0.5% |
| Elementary School | 76 | 19.9% |
| Middle School | 65 | 17.0% |
| High School | 121 | 31.7% |
| College / Undergraduate | 23 | 6.0% |
| Graduate / Professional | 58 | 15.2% |
| Total | 382 | 100.0% |
School Enrollment by Age by Funding Source in Golden Valley County
Out of a total of 382 students who are enrolled in schools in Golden Valley County, 12 (3.1%) attend a private institution, while the remaining 370 (96.9%) are enrolled in public schools. The age group of 15 to 17 year olds has the highest likelihood of being enrolled in private schools, with 7 (10.1% in the age bracket) enrolled. Conversely, the age group of 3 to 4 year olds has the lowest likelihood of being enrolled in a private school, with 34 (100.0% in the age bracket) attending a public institution.
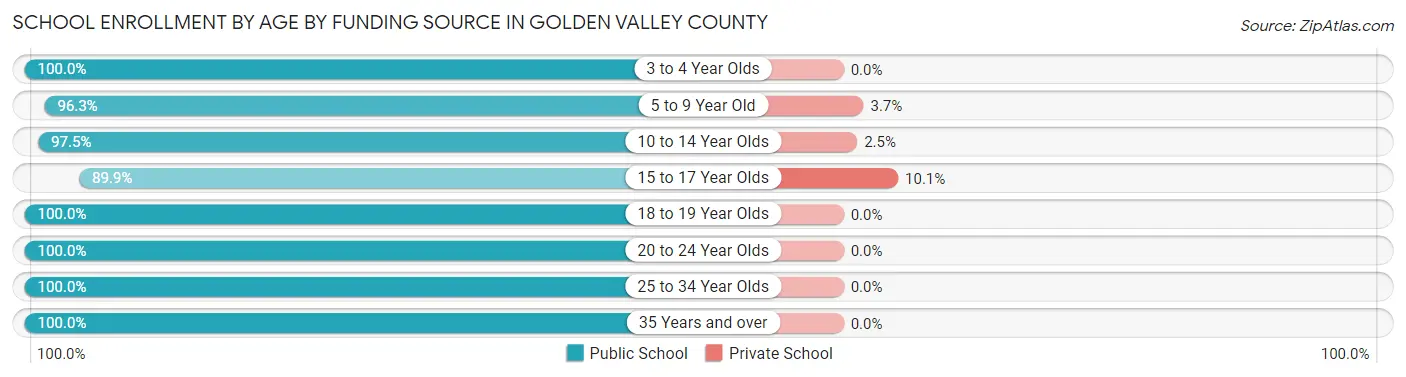
| Age Bracket | Public School | Private School |
| 3 to 4 Year Olds | 34 (100.0%) | 0 (0.0%) |
| 5 to 9 Year Old | 78 (96.3%) | 3 (3.7%) |
| 10 to 14 Year Olds | 77 (97.5%) | 2 (2.5%) |
| 15 to 17 Year Olds | 62 (89.9%) | 7 (10.1%) |
| 18 to 19 Year Olds | 34 (100.0%) | 0 (0.0%) |
| 20 to 24 Year Olds | 20 (100.0%) | 0 (0.0%) |
| 25 to 34 Year Olds | 40 (100.0%) | 0 (0.0%) |
| 35 Years and over | 25 (100.0%) | 0 (0.0%) |
| Total | 370 (96.9%) | 12 (3.1%) |
Educational Attainment by Field of Study in Golden Valley County
Arts & humanities (74 | 23.0%), education (64 | 19.9%), science & technology (48 | 14.9%), physical & health sciences (34 | 10.6%), and business (26 | 8.1%) are the most common fields of study among 322 individuals in Golden Valley County who have obtained a bachelor's degree or higher.
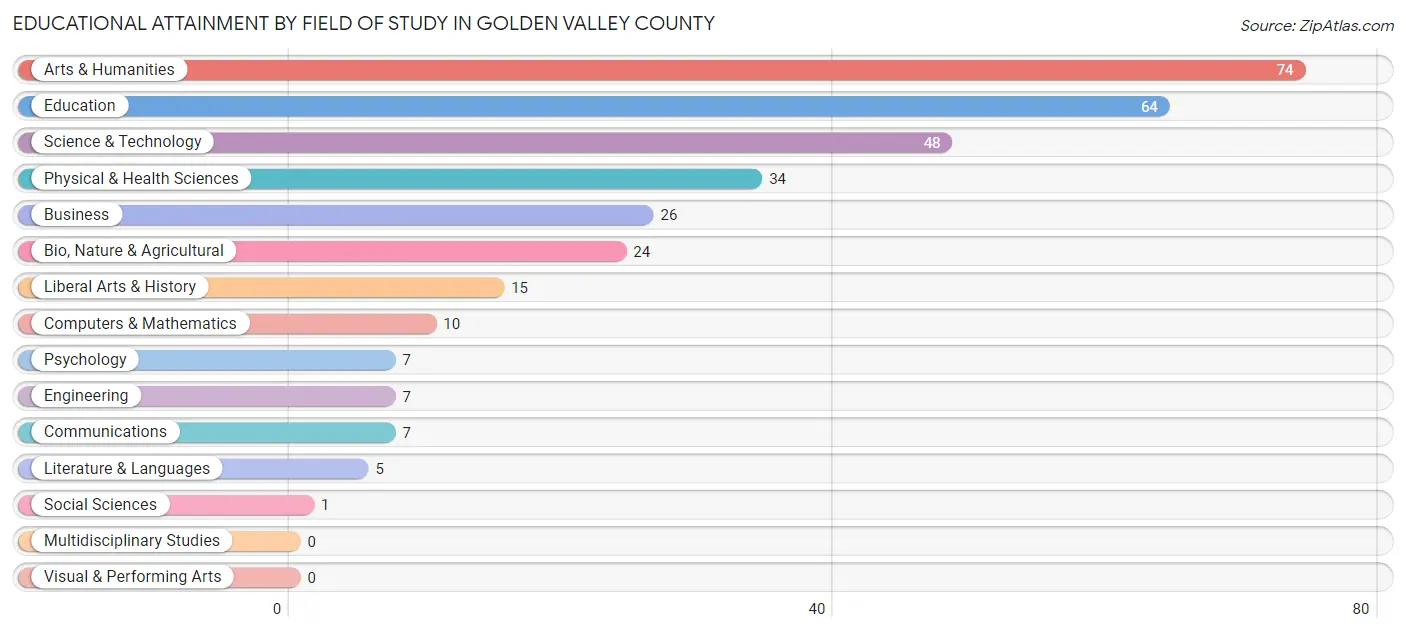
| Field of Study | # Graduates | % Graduates |
| Computers & Mathematics | 10 | 3.1% |
| Bio, Nature & Agricultural | 24 | 7.4% |
| Physical & Health Sciences | 34 | 10.6% |
| Psychology | 7 | 2.2% |
| Social Sciences | 1 | 0.3% |
| Engineering | 7 | 2.2% |
| Multidisciplinary Studies | 0 | 0.0% |
| Science & Technology | 48 | 14.9% |
| Business | 26 | 8.1% |
| Education | 64 | 19.9% |
| Literature & Languages | 5 | 1.5% |
| Liberal Arts & History | 15 | 4.7% |
| Visual & Performing Arts | 0 | 0.0% |
| Communications | 7 | 2.2% |
| Arts & Humanities | 74 | 23.0% |
| Total | 322 | 100.0% |
Transportation & Commute in Golden Valley County
Vehicle Availability by Sex in Golden Valley County
The most prevalent vehicle ownership categories in Golden Valley County are males with 2 vehicles (161, accounting for 35.3%) and females with 2 vehicles (103, making up 45.7%).
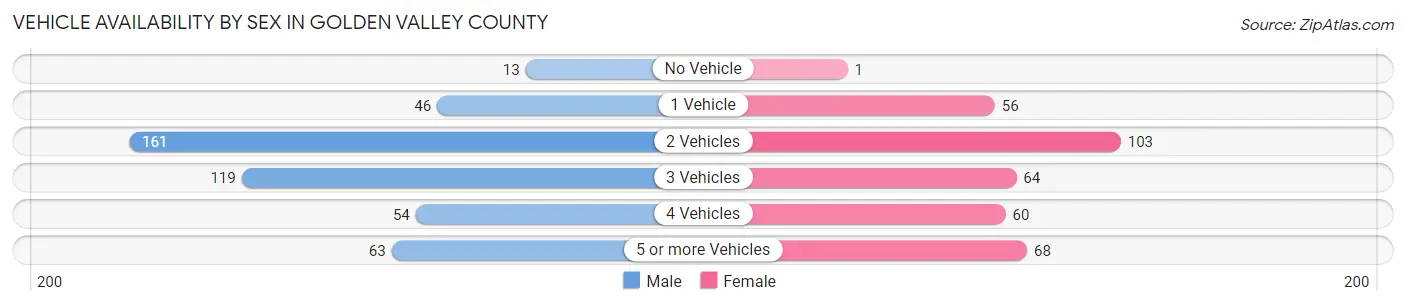
| Vehicles Available | Male | Female |
| No Vehicle | 13 (2.9%) | 1 (0.3%) |
| 1 Vehicle | 46 (10.1%) | 56 (15.9%) |
| 2 Vehicles | 161 (35.3%) | 103 (29.3%) |
| 3 Vehicles | 119 (26.1%) | 64 (18.2%) |
| 4 Vehicles | 54 (11.8%) | 60 (17.1%) |
| 5 or more Vehicles | 63 (13.8%) | 68 (19.3%) |
| Total | 456 (100.0%) | 352 (100.0%) |
Commute Time in Golden Valley County
The most frequently occuring commute durations in Golden Valley County are less than 5 minutes (165 commuters, 20.7%), 20 to 24 minutes (139 commuters, 17.5%), and 5 to 9 minutes (106 commuters, 13.3%).
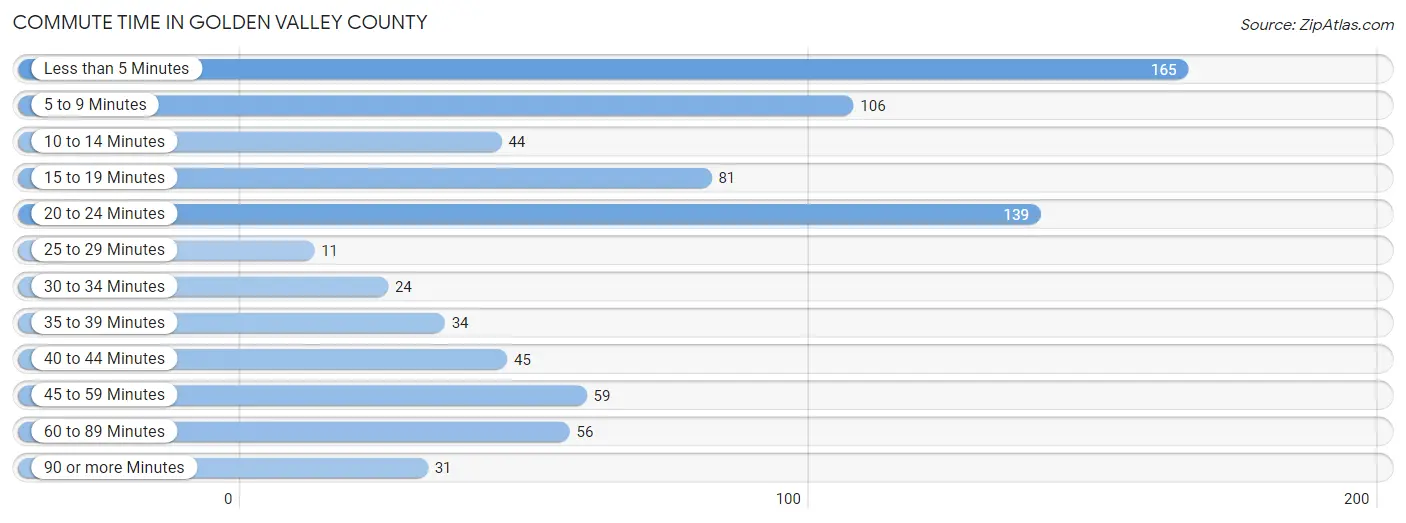
| Commute Time | # Commuters | % Commuters |
| Less than 5 Minutes | 165 | 20.7% |
| 5 to 9 Minutes | 106 | 13.3% |
| 10 to 14 Minutes | 44 | 5.5% |
| 15 to 19 Minutes | 81 | 10.2% |
| 20 to 24 Minutes | 139 | 17.5% |
| 25 to 29 Minutes | 11 | 1.4% |
| 30 to 34 Minutes | 24 | 3.0% |
| 35 to 39 Minutes | 34 | 4.3% |
| 40 to 44 Minutes | 45 | 5.7% |
| 45 to 59 Minutes | 59 | 7.4% |
| 60 to 89 Minutes | 56 | 7.0% |
| 90 or more Minutes | 31 | 3.9% |
Commute Time by Sex in Golden Valley County
The most common commute times in Golden Valley County are less than 5 minutes (92 commuters, 20.7%) for males and less than 5 minutes (73 commuters, 20.9%) for females.
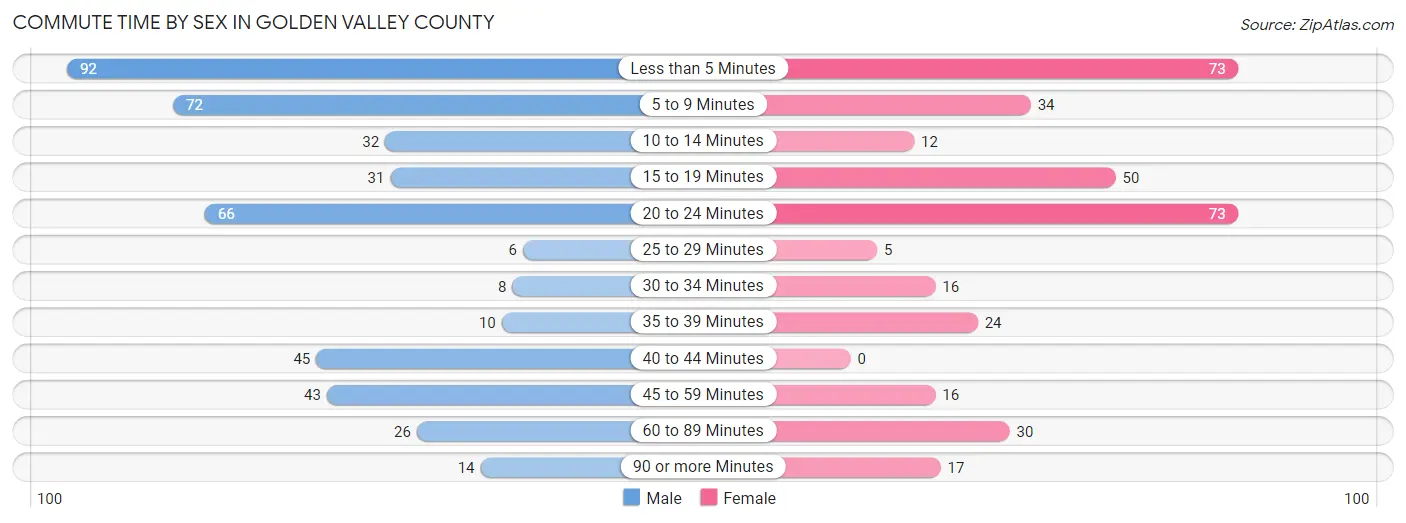
| Commute Time | Male | Female |
| Less than 5 Minutes | 92 (20.7%) | 73 (20.9%) |
| 5 to 9 Minutes | 72 (16.2%) | 34 (9.7%) |
| 10 to 14 Minutes | 32 (7.2%) | 12 (3.4%) |
| 15 to 19 Minutes | 31 (7.0%) | 50 (14.3%) |
| 20 to 24 Minutes | 66 (14.8%) | 73 (20.9%) |
| 25 to 29 Minutes | 6 (1.3%) | 5 (1.4%) |
| 30 to 34 Minutes | 8 (1.8%) | 16 (4.6%) |
| 35 to 39 Minutes | 10 (2.2%) | 24 (6.9%) |
| 40 to 44 Minutes | 45 (10.1%) | 0 (0.0%) |
| 45 to 59 Minutes | 43 (9.7%) | 16 (4.6%) |
| 60 to 89 Minutes | 26 (5.8%) | 30 (8.6%) |
| 90 or more Minutes | 14 (3.2%) | 17 (4.9%) |
Time of Departure to Work by Sex in Golden Valley County
The most frequent times of departure to work in Golden Valley County are 7:30 AM to 7:59 AM (136, 30.6%) for males and 8:00 AM to 8:29 AM (73, 20.9%) for females.
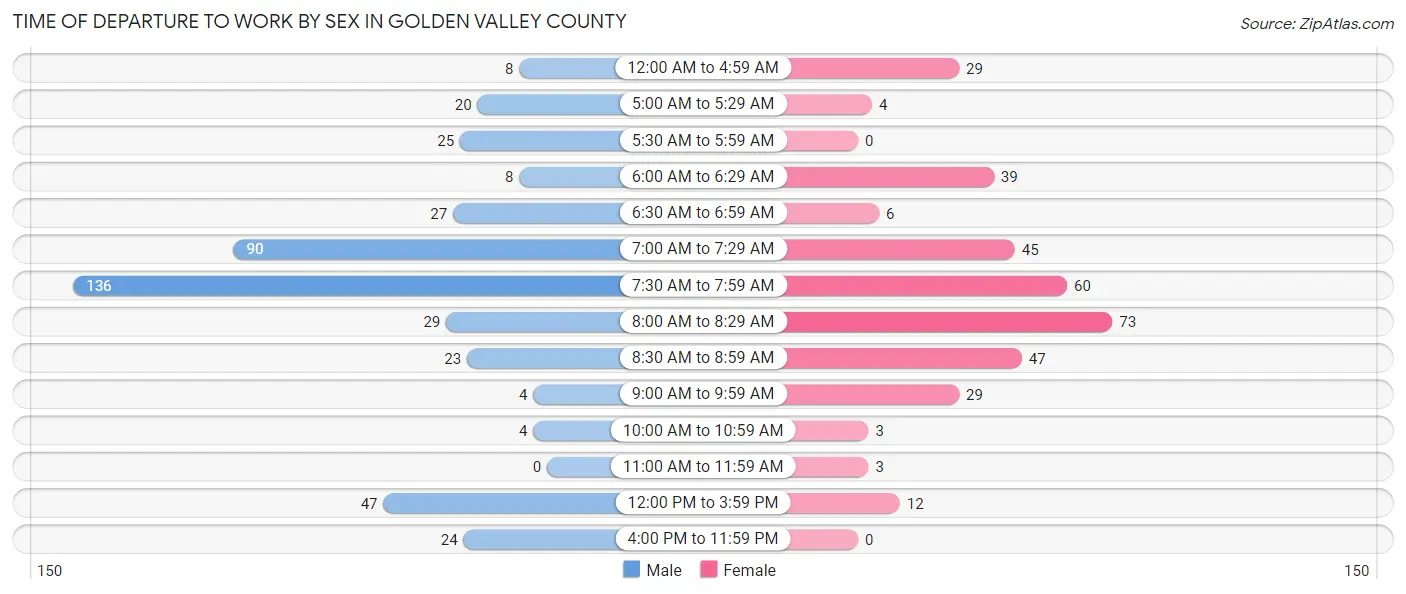
| Time of Departure | Male | Female |
| 12:00 AM to 4:59 AM | 8 (1.8%) | 29 (8.3%) |
| 5:00 AM to 5:29 AM | 20 (4.5%) | 4 (1.1%) |
| 5:30 AM to 5:59 AM | 25 (5.6%) | 0 (0.0%) |
| 6:00 AM to 6:29 AM | 8 (1.8%) | 39 (11.1%) |
| 6:30 AM to 6:59 AM | 27 (6.1%) | 6 (1.7%) |
| 7:00 AM to 7:29 AM | 90 (20.2%) | 45 (12.9%) |
| 7:30 AM to 7:59 AM | 136 (30.6%) | 60 (17.1%) |
| 8:00 AM to 8:29 AM | 29 (6.5%) | 73 (20.9%) |
| 8:30 AM to 8:59 AM | 23 (5.2%) | 47 (13.4%) |
| 9:00 AM to 9:59 AM | 4 (0.9%) | 29 (8.3%) |
| 10:00 AM to 10:59 AM | 4 (0.9%) | 3 (0.9%) |
| 11:00 AM to 11:59 AM | 0 (0.0%) | 3 (0.9%) |
| 12:00 PM to 3:59 PM | 47 (10.6%) | 12 (3.4%) |
| 4:00 PM to 11:59 PM | 24 (5.4%) | 0 (0.0%) |
| Total | 445 (100.0%) | 350 (100.0%) |
Housing Occupancy in Golden Valley County
Occupancy by Ownership in Golden Valley County
Of the total 673 dwellings in Golden Valley County, owner-occupied units account for 503 (74.7%), while renter-occupied units make up 170 (25.3%).
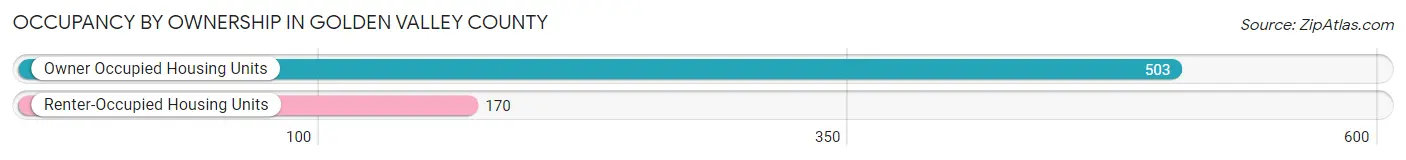
| Occupancy | # Housing Units | % Housing Units |
| Owner Occupied Housing Units | 503 | 74.7% |
| Renter-Occupied Housing Units | 170 | 25.3% |
| Total Occupied Housing Units | 673 | 100.0% |
Occupancy by Household Size in Golden Valley County
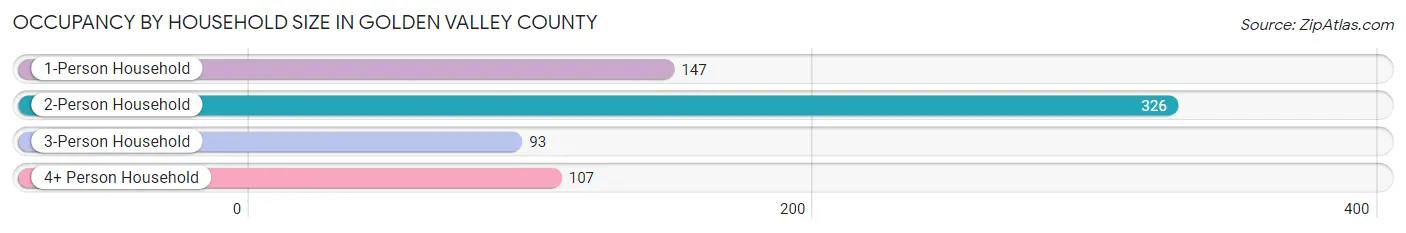
| Household Size | # Housing Units | % Housing Units |
| 1-Person Household | 147 | 21.8% |
| 2-Person Household | 326 | 48.4% |
| 3-Person Household | 93 | 13.8% |
| 4+ Person Household | 107 | 15.9% |
| Total Housing Units | 673 | 100.0% |
Occupancy by Ownership by Household Size in Golden Valley County
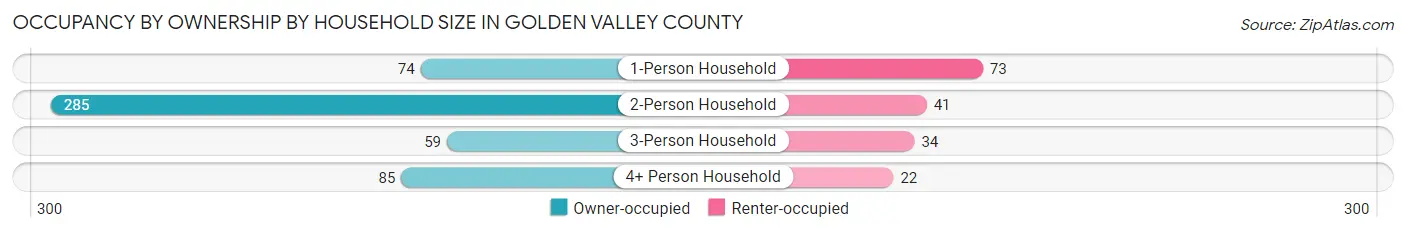
| Household Size | Owner-occupied | Renter-occupied |
| 1-Person Household | 74 (50.3%) | 73 (49.7%) |
| 2-Person Household | 285 (87.4%) | 41 (12.6%) |
| 3-Person Household | 59 (63.4%) | 34 (36.6%) |
| 4+ Person Household | 85 (79.4%) | 22 (20.6%) |
| Total Housing Units | 503 (74.7%) | 170 (25.3%) |
Occupancy by Educational Attainment in Golden Valley County
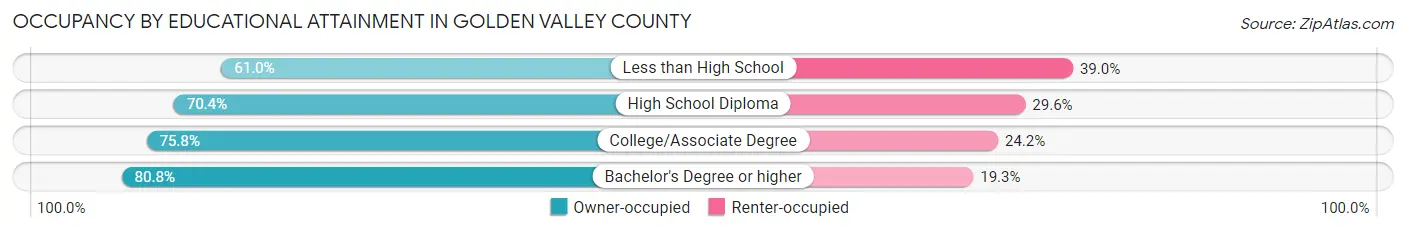
| Household Size | Owner-occupied | Renter-occupied |
| Less than High School | 25 (61.0%) | 16 (39.0%) |
| High School Diploma | 119 (70.4%) | 50 (29.6%) |
| College/Associate Degree | 229 (75.8%) | 73 (24.2%) |
| Bachelor's Degree or higher | 130 (80.7%) | 31 (19.3%) |
Occupancy by Age of Householder in Golden Valley County
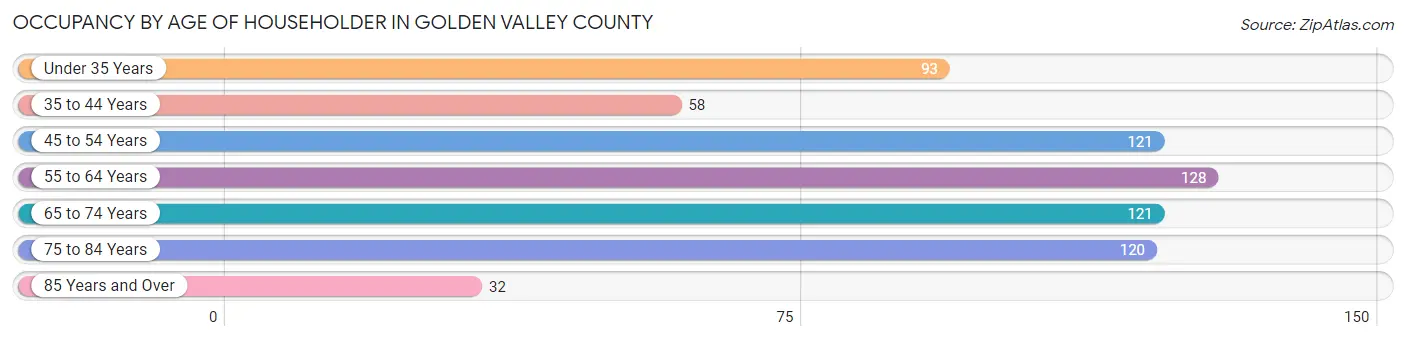
| Age Bracket | # Households | % Households |
| Under 35 Years | 93 | 13.8% |
| 35 to 44 Years | 58 | 8.6% |
| 45 to 54 Years | 121 | 18.0% |
| 55 to 64 Years | 128 | 19.0% |
| 65 to 74 Years | 121 | 18.0% |
| 75 to 84 Years | 120 | 17.8% |
| 85 Years and Over | 32 | 4.8% |
| Total | 673 | 100.0% |
Housing Finances in Golden Valley County
Median Income by Occupancy in Golden Valley County
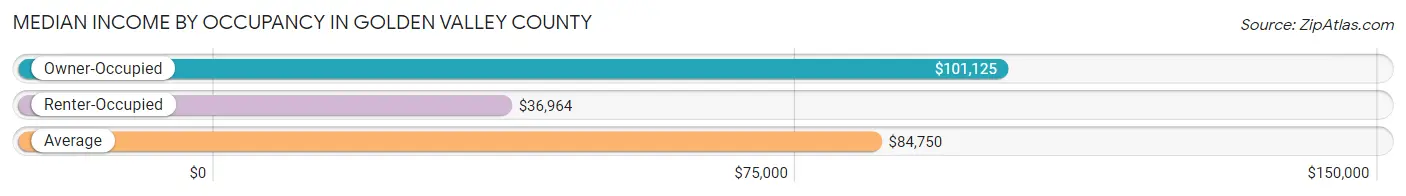
| Occupancy Type | # Households | Median Income |
| Owner-Occupied | 503 (74.7%) | $101,125 |
| Renter-Occupied | 170 (25.3%) | $36,964 |
| Average | 673 (100.0%) | $84,750 |
Occupancy by Householder Income Bracket in Golden Valley County
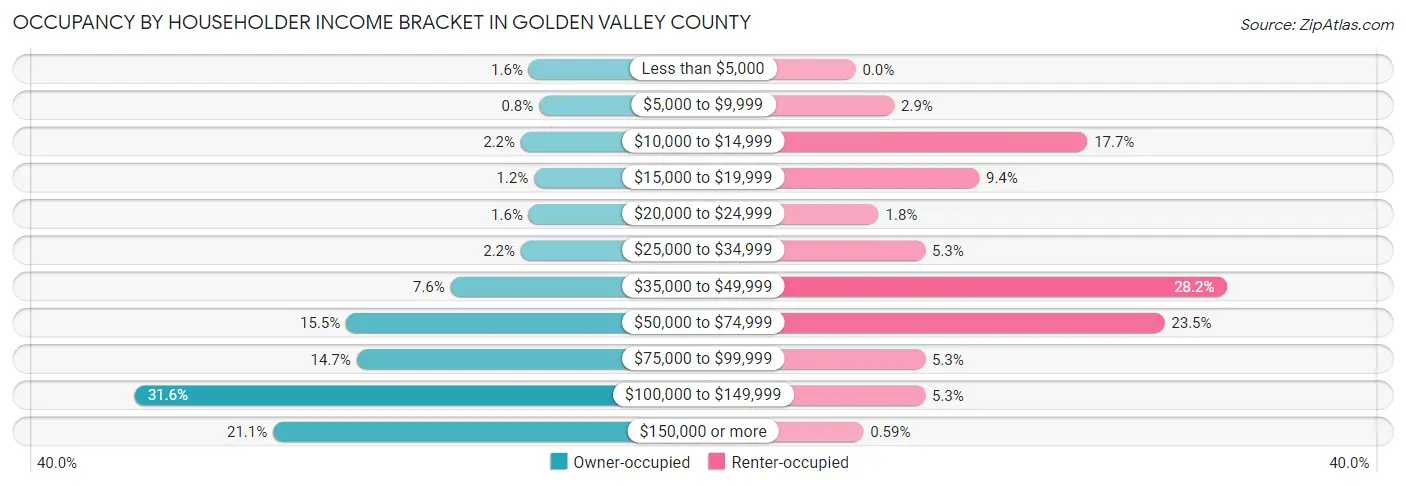
| Income Bracket | Owner-occupied | Renter-occupied |
| Less than $5,000 | 8 (1.6%) | 0 (0.0%) |
| $5,000 to $9,999 | 4 (0.8%) | 5 (2.9%) |
| $10,000 to $14,999 | 11 (2.2%) | 30 (17.6%) |
| $15,000 to $19,999 | 6 (1.2%) | 16 (9.4%) |
| $20,000 to $24,999 | 8 (1.6%) | 3 (1.8%) |
| $25,000 to $34,999 | 11 (2.2%) | 9 (5.3%) |
| $35,000 to $49,999 | 38 (7.5%) | 48 (28.2%) |
| $50,000 to $74,999 | 78 (15.5%) | 40 (23.5%) |
| $75,000 to $99,999 | 74 (14.7%) | 9 (5.3%) |
| $100,000 to $149,999 | 159 (31.6%) | 9 (5.3%) |
| $150,000 or more | 106 (21.1%) | 1 (0.6%) |
| Total | 503 (100.0%) | 170 (100.0%) |
Monthly Housing Cost Tiers in Golden Valley County
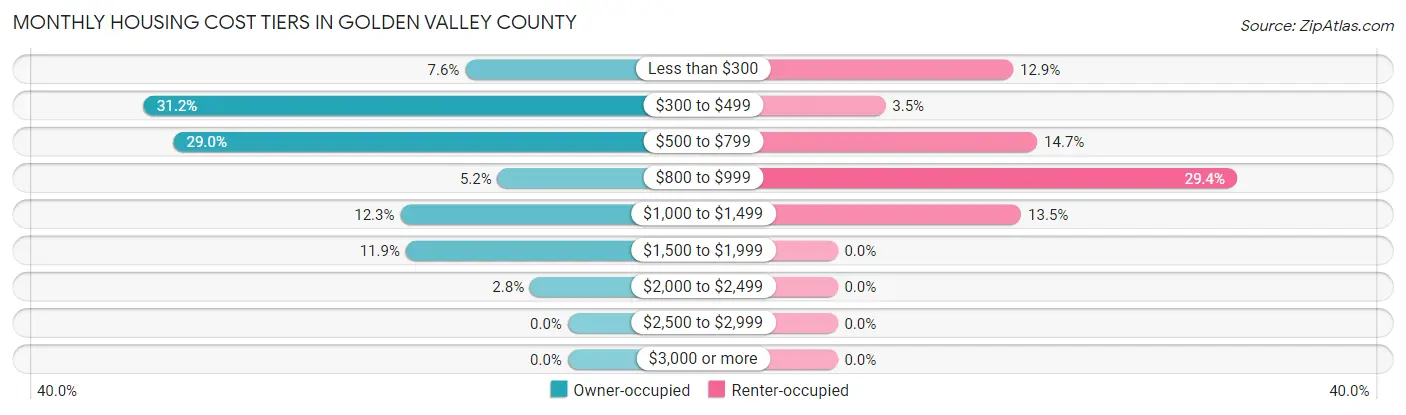
| Monthly Cost | Owner-occupied | Renter-occupied |
| Less than $300 | 38 (7.5%) | 22 (12.9%) |
| $300 to $499 | 157 (31.2%) | 6 (3.5%) |
| $500 to $799 | 146 (29.0%) | 25 (14.7%) |
| $800 to $999 | 26 (5.2%) | 50 (29.4%) |
| $1,000 to $1,499 | 62 (12.3%) | 23 (13.5%) |
| $1,500 to $1,999 | 60 (11.9%) | 0 (0.0%) |
| $2,000 to $2,499 | 14 (2.8%) | 0 (0.0%) |
| $2,500 to $2,999 | 0 (0.0%) | 0 (0.0%) |
| $3,000 or more | 0 (0.0%) | 0 (0.0%) |
| Total | 503 (100.0%) | 170 (100.0%) |
Physical Housing Characteristics in Golden Valley County
Housing Structures in Golden Valley County
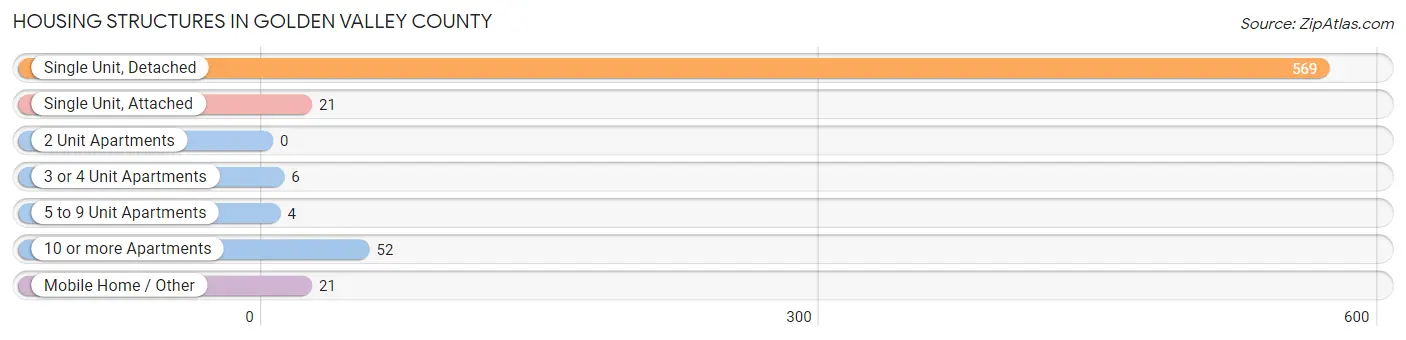
| Structure Type | # Housing Units | % Housing Units |
| Single Unit, Detached | 569 | 84.6% |
| Single Unit, Attached | 21 | 3.1% |
| 2 Unit Apartments | 0 | 0.0% |
| 3 or 4 Unit Apartments | 6 | 0.9% |
| 5 to 9 Unit Apartments | 4 | 0.6% |
| 10 or more Apartments | 52 | 7.7% |
| Mobile Home / Other | 21 | 3.1% |
| Total | 673 | 100.0% |
Housing Structures by Occupancy in Golden Valley County
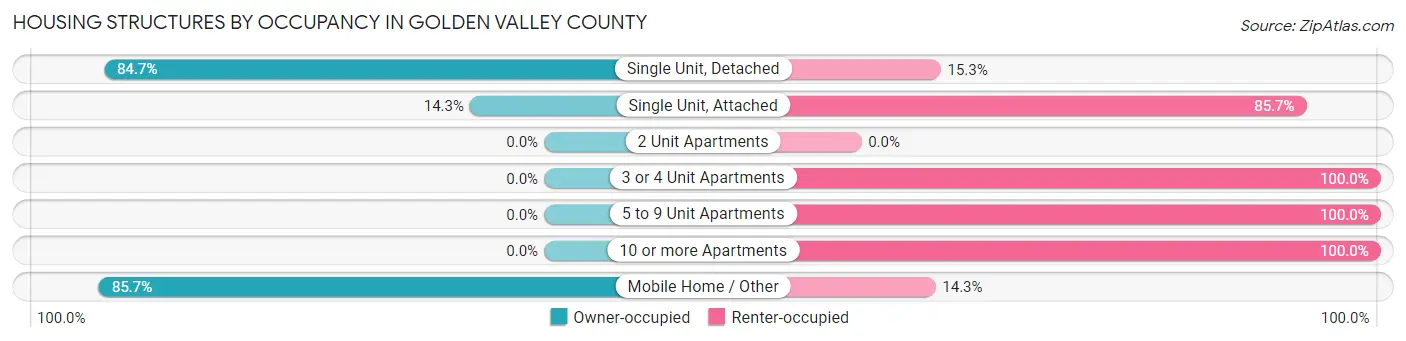
| Structure Type | Owner-occupied | Renter-occupied |
| Single Unit, Detached | 482 (84.7%) | 87 (15.3%) |
| Single Unit, Attached | 3 (14.3%) | 18 (85.7%) |
| 2 Unit Apartments | 0 (0.0%) | 0 (0.0%) |
| 3 or 4 Unit Apartments | 0 (0.0%) | 6 (100.0%) |
| 5 to 9 Unit Apartments | 0 (0.0%) | 4 (100.0%) |
| 10 or more Apartments | 0 (0.0%) | 52 (100.0%) |
| Mobile Home / Other | 18 (85.7%) | 3 (14.3%) |
| Total | 503 (74.7%) | 170 (25.3%) |
Housing Structures by Number of Rooms in Golden Valley County
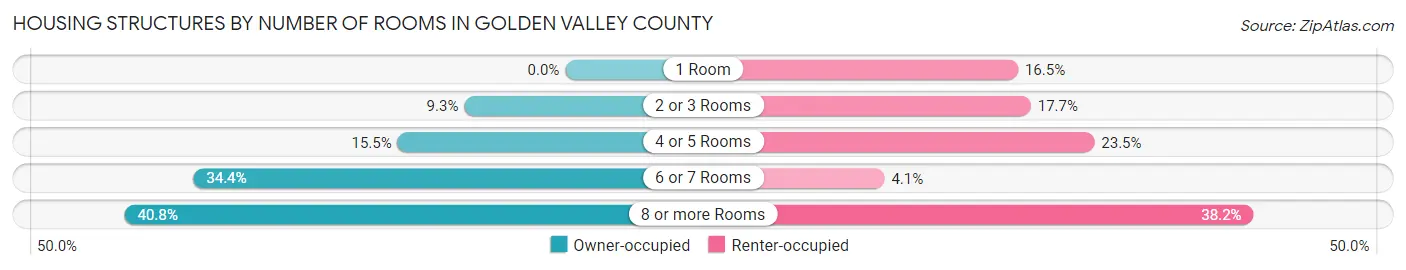
| Number of Rooms | Owner-occupied | Renter-occupied |
| 1 Room | 0 (0.0%) | 28 (16.5%) |
| 2 or 3 Rooms | 47 (9.3%) | 30 (17.6%) |
| 4 or 5 Rooms | 78 (15.5%) | 40 (23.5%) |
| 6 or 7 Rooms | 173 (34.4%) | 7 (4.1%) |
| 8 or more Rooms | 205 (40.8%) | 65 (38.2%) |
| Total | 503 (100.0%) | 170 (100.0%) |
Housing Structure by Heating Type in Golden Valley County
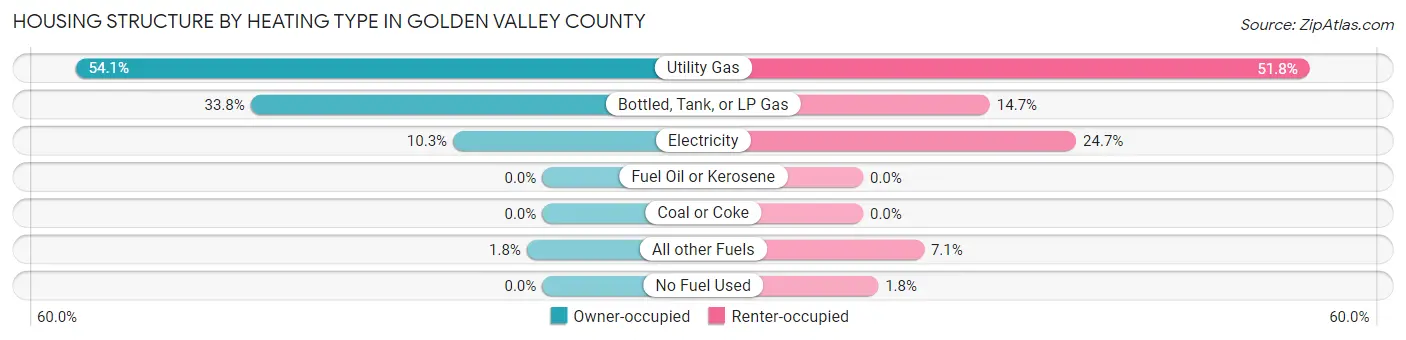
| Heating Type | Owner-occupied | Renter-occupied |
| Utility Gas | 272 (54.1%) | 88 (51.8%) |
| Bottled, Tank, or LP Gas | 170 (33.8%) | 25 (14.7%) |
| Electricity | 52 (10.3%) | 42 (24.7%) |
| Fuel Oil or Kerosene | 0 (0.0%) | 0 (0.0%) |
| Coal or Coke | 0 (0.0%) | 0 (0.0%) |
| All other Fuels | 9 (1.8%) | 12 (7.1%) |
| No Fuel Used | 0 (0.0%) | 3 (1.8%) |
| Total | 503 (100.0%) | 170 (100.0%) |
Household Vehicle Usage in Golden Valley County
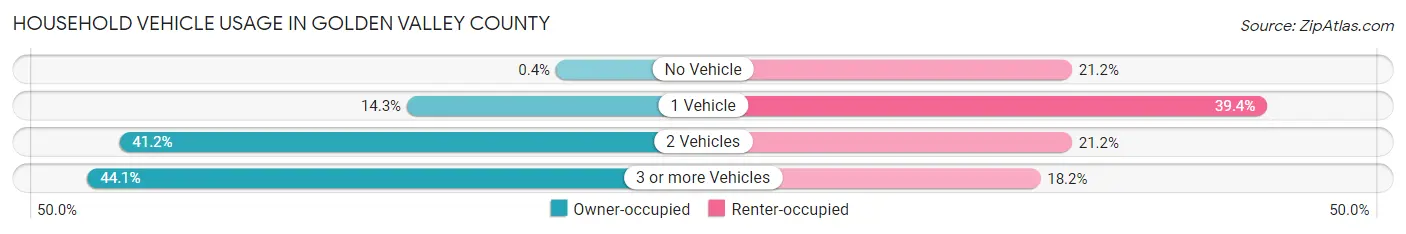
| Vehicles per Household | Owner-occupied | Renter-occupied |
| No Vehicle | 2 (0.4%) | 36 (21.2%) |
| 1 Vehicle | 72 (14.3%) | 67 (39.4%) |
| 2 Vehicles | 207 (41.1%) | 36 (21.2%) |
| 3 or more Vehicles | 222 (44.1%) | 31 (18.2%) |
| Total | 503 (100.0%) | 170 (100.0%) |
Real Estate & Mortgages in Golden Valley County
Real Estate and Mortgage Overview in Golden Valley County
| Characteristic | Without Mortgage | With Mortgage |
| Housing Units | 321 | 182 |
| Median Property Value | $120,700 | $168,500 |
| Median Household Income | $94,851 | $41 |
| Monthly Housing Costs | $458 | $0 |
| Real Estate Taxes | $1,170 | $2 |
Property Value by Mortgage Status in Golden Valley County
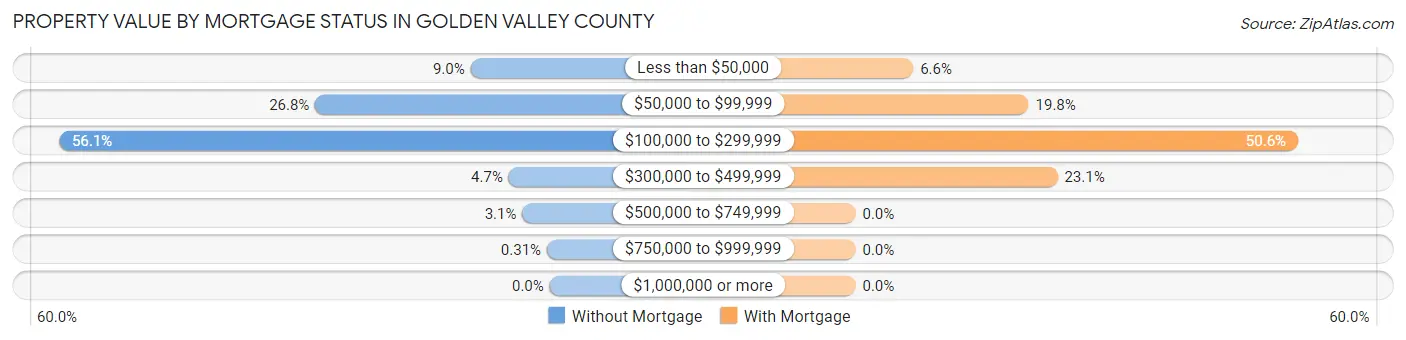
| Property Value | Without Mortgage | With Mortgage |
| Less than $50,000 | 29 (9.0%) | 12 (6.6%) |
| $50,000 to $99,999 | 86 (26.8%) | 36 (19.8%) |
| $100,000 to $299,999 | 180 (56.1%) | 92 (50.5%) |
| $300,000 to $499,999 | 15 (4.7%) | 42 (23.1%) |
| $500,000 to $749,999 | 10 (3.1%) | 0 (0.0%) |
| $750,000 to $999,999 | 1 (0.3%) | 0 (0.0%) |
| $1,000,000 or more | 0 (0.0%) | 0 (0.0%) |
| Total | 321 (100.0%) | 182 (100.0%) |
Household Income by Mortgage Status in Golden Valley County
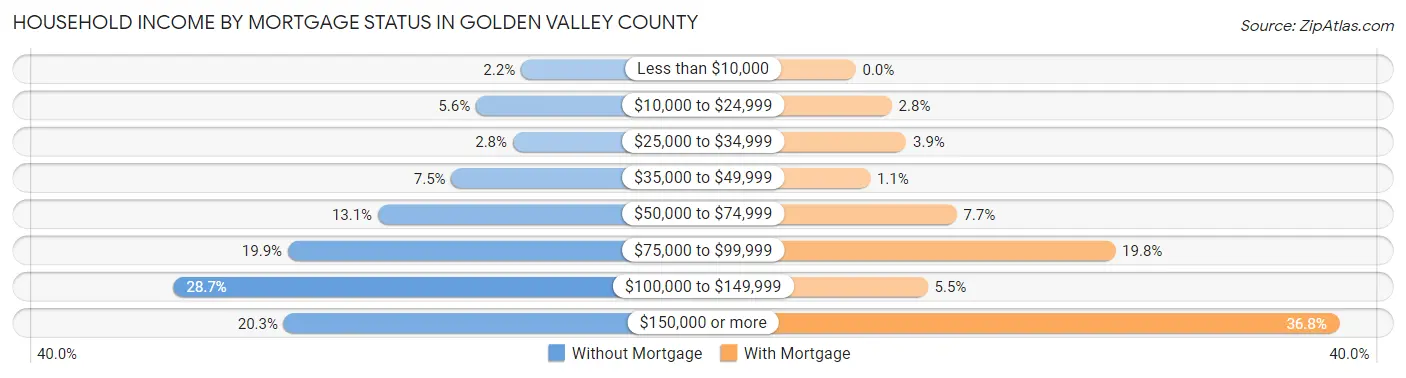
| Household Income | Without Mortgage | With Mortgage |
| Less than $10,000 | 7 (2.2%) | 0 (0.0%) |
| $10,000 to $24,999 | 18 (5.6%) | 5 (2.8%) |
| $25,000 to $34,999 | 9 (2.8%) | 7 (3.8%) |
| $35,000 to $49,999 | 24 (7.5%) | 2 (1.1%) |
| $50,000 to $74,999 | 42 (13.1%) | 14 (7.7%) |
| $75,000 to $99,999 | 64 (19.9%) | 36 (19.8%) |
| $100,000 to $149,999 | 92 (28.7%) | 10 (5.5%) |
| $150,000 or more | 65 (20.3%) | 67 (36.8%) |
| Total | 321 (100.0%) | 182 (100.0%) |
Property Value to Household Income Ratio in Golden Valley County
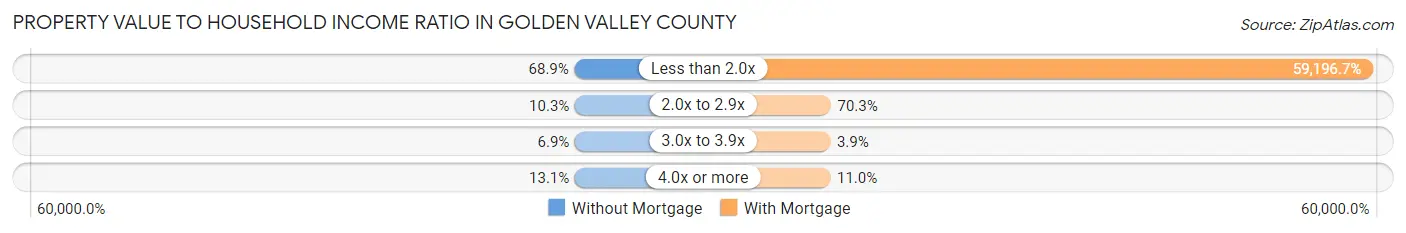
| Value-to-Income Ratio | Without Mortgage | With Mortgage |
| Less than 2.0x | 221 (68.9%) | 107,738 (59,196.7%) |
| 2.0x to 2.9x | 33 (10.3%) | 128 (70.3%) |
| 3.0x to 3.9x | 22 (6.9%) | 7 (3.8%) |
| 4.0x or more | 42 (13.1%) | 20 (11.0%) |
| Total | 321 (100.0%) | 182 (100.0%) |
Real Estate Taxes by Mortgage Status in Golden Valley County
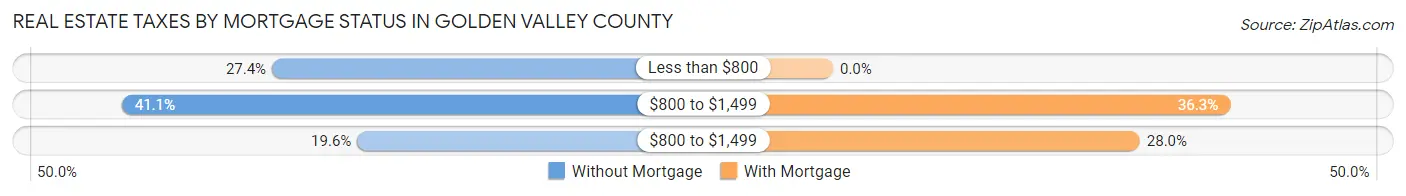
| Property Taxes | Without Mortgage | With Mortgage |
| Less than $800 | 88 (27.4%) | 0 (0.0%) |
| $800 to $1,499 | 132 (41.1%) | 66 (36.3%) |
| $800 to $1,499 | 63 (19.6%) | 51 (28.0%) |
| Total | 321 (100.0%) | 182 (100.0%) |
Health & Disability in Golden Valley County
Health Insurance Coverage by Age in Golden Valley County
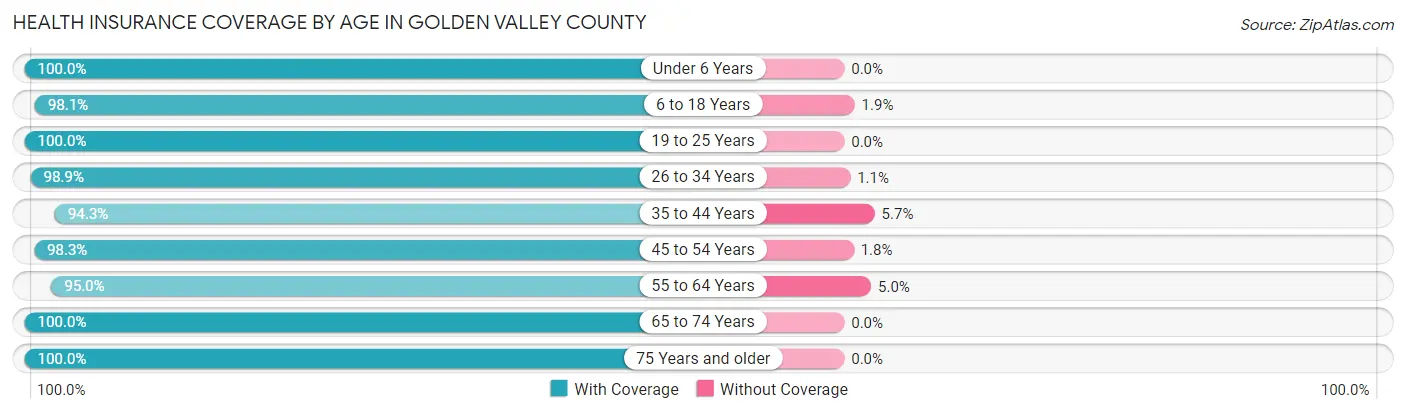
| Age Bracket | With Coverage | Without Coverage |
| Under 6 Years | 122 (100.0%) | 0 (0.0%) |
| 6 to 18 Years | 254 (98.1%) | 5 (1.9%) |
| 19 to 25 Years | 52 (100.0%) | 0 (0.0%) |
| 26 to 34 Years | 178 (98.9%) | 2 (1.1%) |
| 35 to 44 Years | 150 (94.3%) | 9 (5.7%) |
| 45 to 54 Years | 224 (98.3%) | 4 (1.8%) |
| 55 to 64 Years | 285 (95.0%) | 15 (5.0%) |
| 65 to 74 Years | 191 (100.0%) | 0 (0.0%) |
| 75 Years and older | 220 (100.0%) | 0 (0.0%) |
| Total | 1,676 (98.0%) | 35 (2.1%) |
Health Insurance Coverage by Citizenship Status in Golden Valley County
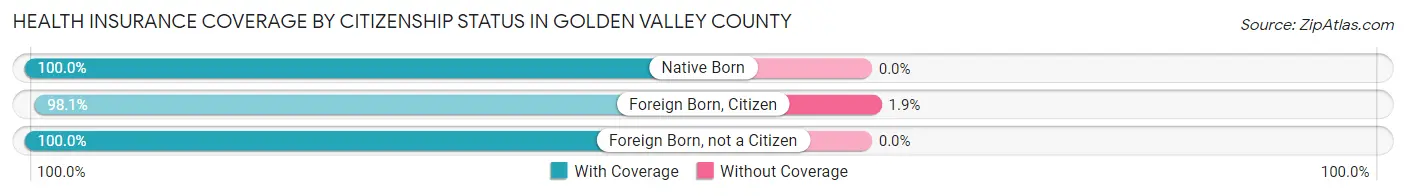
| Citizenship Status | With Coverage | Without Coverage |
| Native Born | 122 (100.0%) | 0 (0.0%) |
| Foreign Born, Citizen | 254 (98.1%) | 5 (1.9%) |
| Foreign Born, not a Citizen | 52 (100.0%) | 0 (0.0%) |
Health Insurance Coverage by Household Income in Golden Valley County
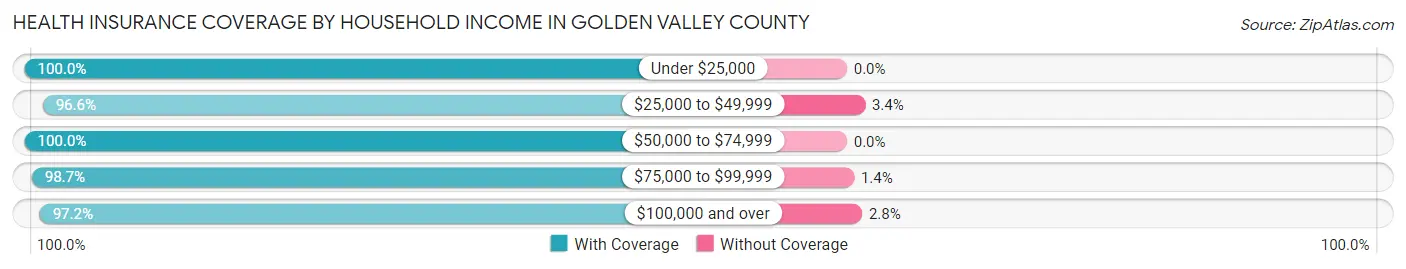
| Household Income | With Coverage | Without Coverage |
| Under $25,000 | 131 (100.0%) | 0 (0.0%) |
| $25,000 to $49,999 | 284 (96.6%) | 10 (3.4%) |
| $50,000 to $74,999 | 253 (100.0%) | 0 (0.0%) |
| $75,000 to $99,999 | 220 (98.7%) | 3 (1.3%) |
| $100,000 and over | 752 (97.2%) | 22 (2.8%) |
Public vs Private Health Insurance Coverage by Age in Golden Valley County
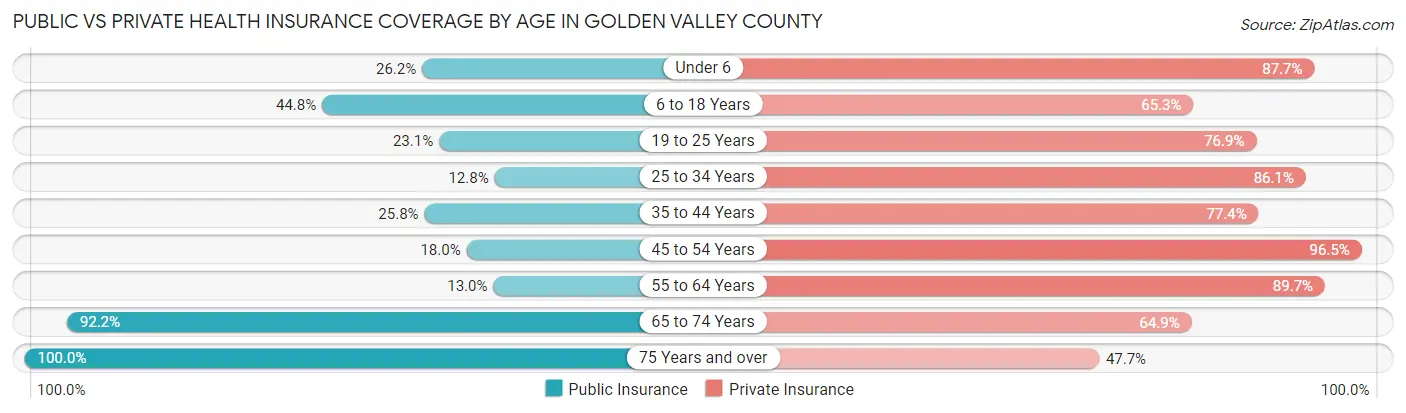
| Age Bracket | Public Insurance | Private Insurance |
| Under 6 | 32 (26.2%) | 107 (87.7%) |
| 6 to 18 Years | 116 (44.8%) | 169 (65.2%) |
| 19 to 25 Years | 12 (23.1%) | 40 (76.9%) |
| 25 to 34 Years | 23 (12.8%) | 155 (86.1%) |
| 35 to 44 Years | 41 (25.8%) | 123 (77.4%) |
| 45 to 54 Years | 41 (18.0%) | 220 (96.5%) |
| 55 to 64 Years | 39 (13.0%) | 269 (89.7%) |
| 65 to 74 Years | 176 (92.1%) | 124 (64.9%) |
| 75 Years and over | 220 (100.0%) | 105 (47.7%) |
| Total | 700 (40.9%) | 1,312 (76.7%) |
Disability Status by Sex by Age in Golden Valley County
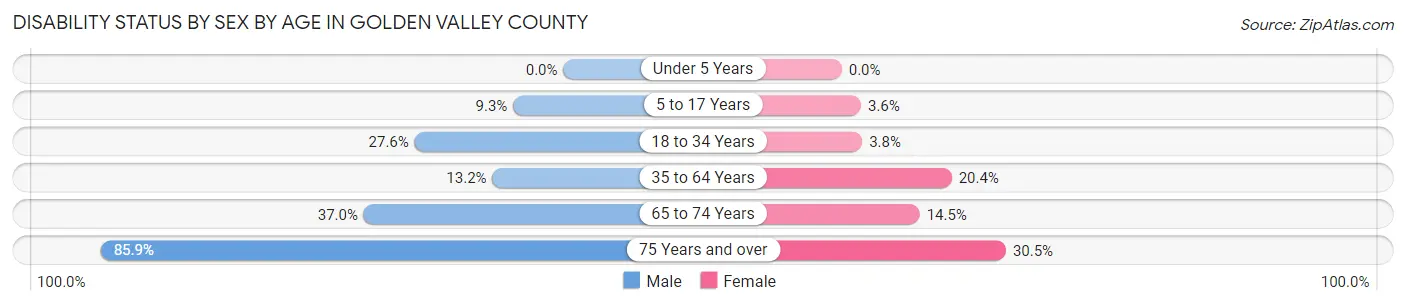
| Age Bracket | Male | Female |
| Under 5 Years | 0 (0.0%) | 0 (0.0%) |
| 5 to 17 Years | 11 (9.3%) | 4 (3.6%) |
| 18 to 34 Years | 37 (27.6%) | 5 (3.8%) |
| 35 to 64 Years | 44 (13.2%) | 72 (20.4%) |
| 65 to 74 Years | 40 (37.0%) | 12 (14.5%) |
| 75 Years and over | 79 (85.9%) | 39 (30.5%) |
Disability Class by Sex by Age in Golden Valley County
Disability Class: Hearing Difficulty
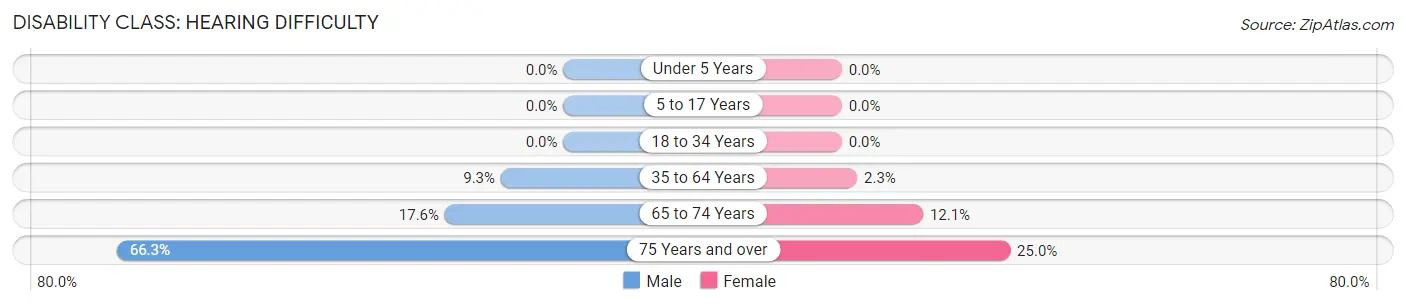
| Age Bracket | Male | Female |
| Under 5 Years | 0 (0.0%) | 0 (0.0%) |
| 5 to 17 Years | 0 (0.0%) | 0 (0.0%) |
| 18 to 34 Years | 0 (0.0%) | 0 (0.0%) |
| 35 to 64 Years | 31 (9.3%) | 8 (2.3%) |
| 65 to 74 Years | 19 (17.6%) | 10 (12.0%) |
| 75 Years and over | 61 (66.3%) | 32 (25.0%) |
Disability Class: Vision Difficulty
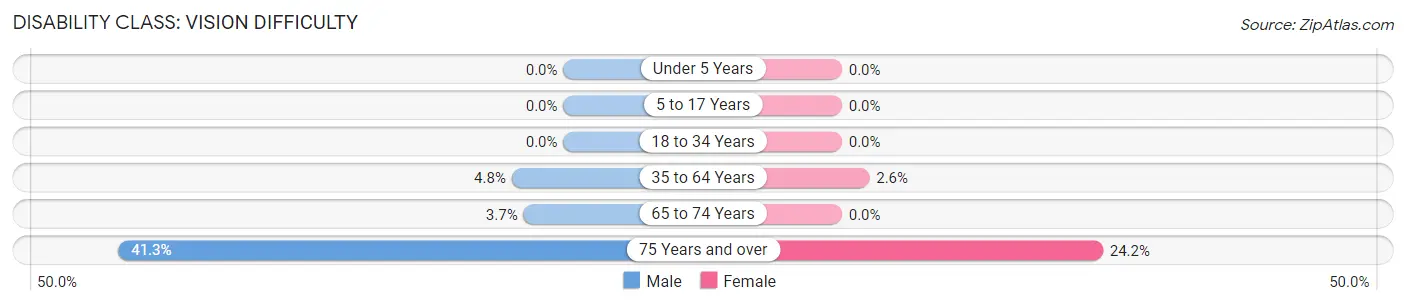
| Age Bracket | Male | Female |
| Under 5 Years | 0 (0.0%) | 0 (0.0%) |
| 5 to 17 Years | 0 (0.0%) | 0 (0.0%) |
| 18 to 34 Years | 0 (0.0%) | 0 (0.0%) |
| 35 to 64 Years | 16 (4.8%) | 9 (2.5%) |
| 65 to 74 Years | 4 (3.7%) | 0 (0.0%) |
| 75 Years and over | 38 (41.3%) | 31 (24.2%) |
Disability Class: Cognitive Difficulty
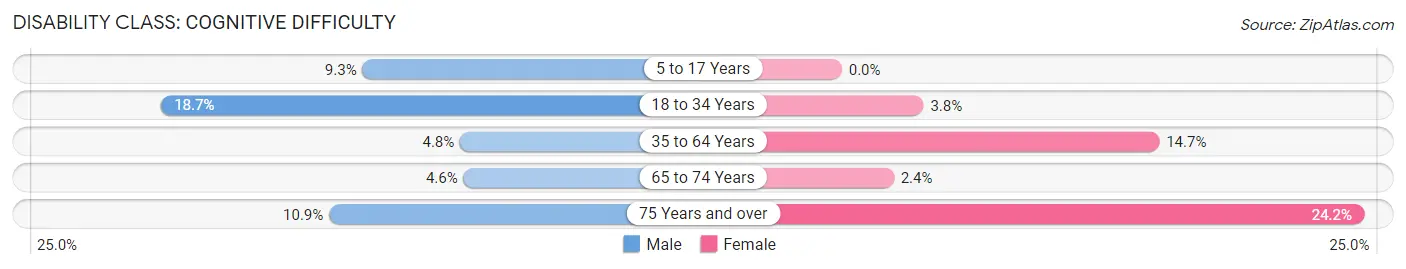
| Age Bracket | Male | Female |
| 5 to 17 Years | 11 (9.3%) | 0 (0.0%) |
| 18 to 34 Years | 25 (18.7%) | 5 (3.8%) |
| 35 to 64 Years | 16 (4.8%) | 52 (14.7%) |
| 65 to 74 Years | 5 (4.6%) | 2 (2.4%) |
| 75 Years and over | 10 (10.9%) | 31 (24.2%) |
Disability Class: Ambulatory Difficulty
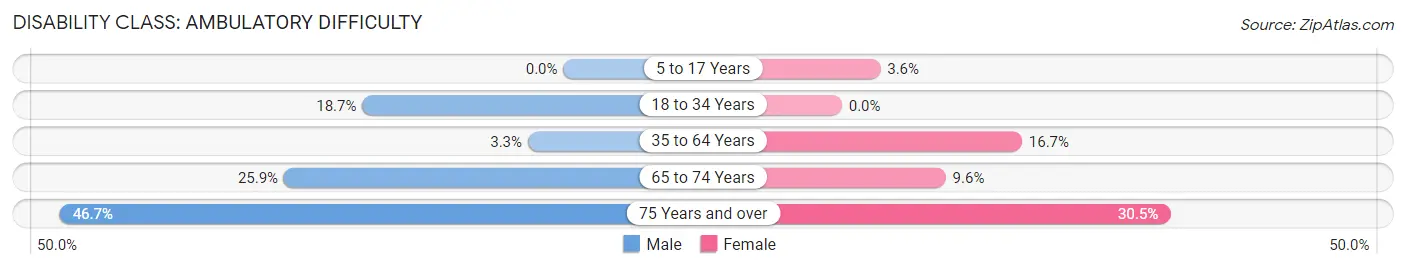
| Age Bracket | Male | Female |
| 5 to 17 Years | 0 (0.0%) | 4 (3.6%) |
| 18 to 34 Years | 25 (18.7%) | 0 (0.0%) |
| 35 to 64 Years | 11 (3.3%) | 59 (16.7%) |
| 65 to 74 Years | 28 (25.9%) | 8 (9.6%) |
| 75 Years and over | 43 (46.7%) | 39 (30.5%) |
Disability Class: Self-Care Difficulty
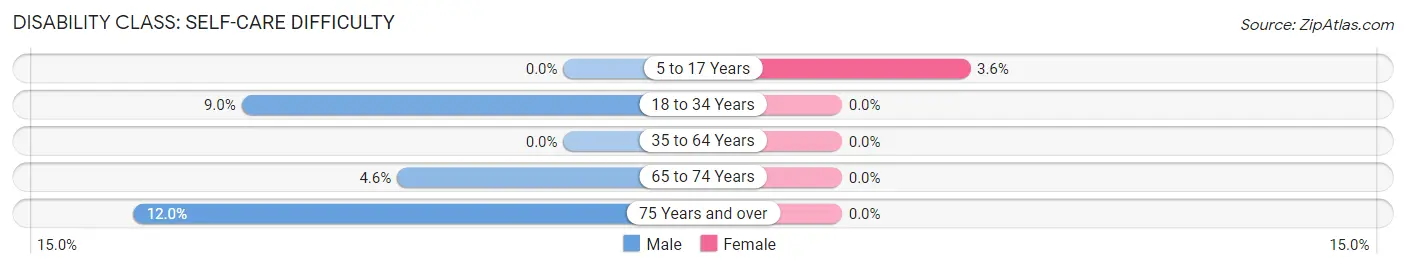
| Age Bracket | Male | Female |
| 5 to 17 Years | 0 (0.0%) | 4 (3.6%) |
| 18 to 34 Years | 12 (9.0%) | 0 (0.0%) |
| 35 to 64 Years | 0 (0.0%) | 0 (0.0%) |
| 65 to 74 Years | 5 (4.6%) | 0 (0.0%) |
| 75 Years and over | 11 (12.0%) | 0 (0.0%) |
Technology Access in Golden Valley County
Computing Device Access in Golden Valley County
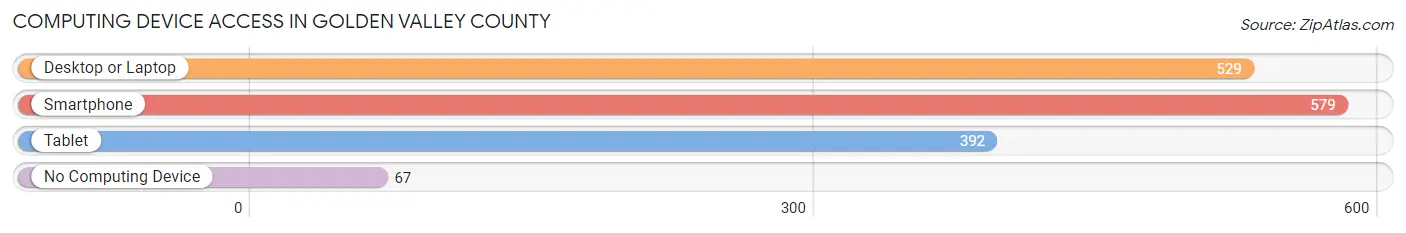
| Device Type | # Households | % Households |
| Desktop or Laptop | 529 | 78.6% |
| Smartphone | 579 | 86.0% |
| Tablet | 392 | 58.3% |
| No Computing Device | 67 | 10.0% |
| Total | 673 | 100.0% |
Internet Access in Golden Valley County
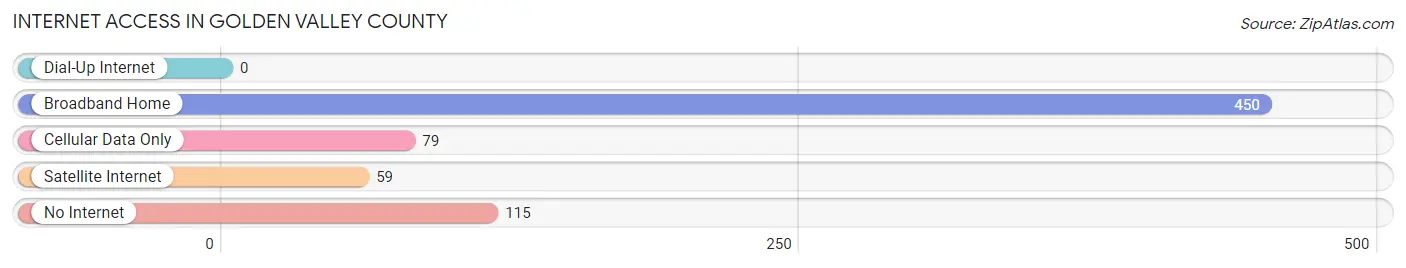
| Internet Type | # Households | % Households |
| Dial-Up Internet | 0 | 0.0% |
| Broadband Home | 450 | 66.9% |
| Cellular Data Only | 79 | 11.7% |
| Satellite Internet | 59 | 8.8% |
| No Internet | 115 | 17.1% |
| Total | 673 | 100.0% |
Golden Valley County Summary
Geography
Golden Valley County is located in the western part of North Dakota, in the heart of the Badlands. It is bordered by Billings County to the north, Stark County to the east, Slope County to the south, and Adams County to the west. The county covers an area of 1,845 square miles, making it the fourth largest county in the state. The terrain is mostly flat, with rolling hills and some rugged badlands in the western part of the county. The county is home to the Little Missouri National Grassland, which covers an area of 1,028 square miles.
The county is home to several rivers, including the Little Missouri River, which flows through the county from north to south. Other rivers include the Knife River, the Cannonball River, and the Heart River. The county also contains several lakes, including Lake Sakakawea, Lake Audubon, and Lake Tschida.
Demographics
As of the 2010 census, the population of Golden Valley County was 2,093, making it the second least populous county in North Dakota. The population density was 1.1 people per square mile. The racial makeup of the county was 97.3% White, 0.4% Native American, 0.2% Asian, 0.1% Black or African American, 0.1% Pacific Islander, 0.7% from other races, and 1.2% from two or more races. Hispanic or Latino of any race were 1.7% of the population.
The median income for a household in the county was $41,944, and the median income for a family was $50,000. The per capita income for the county was $20,945. About 11.2% of families and 14.2% of the population were below the poverty line, including 17.2% of those under age 18 and 8.3% of those age 65 or over.
Economy
The economy of Golden Valley County is largely based on agriculture. The county is home to several large farms, which produce a variety of crops, including wheat, corn, soybeans, and sunflowers. The county is also home to several ranches, which raise cattle, sheep, and horses.
The county is also home to several oil and gas fields, which provide jobs for many of the county's residents. The county is also home to several wind farms, which provide renewable energy to the region.
The county is home to several small businesses, including restaurants, stores, and other services. The county is also home to several tourist attractions, including the Little Missouri National Grassland, the Knife River Indian Villages National Historic Site, and the Theodore Roosevelt National Park.
History
Golden Valley County was established in 1873, and was named after the Golden Valley, a region of the Badlands. The county was originally inhabited by the Mandan, Hidatsa, and Arikara tribes, who lived in the area for centuries before the arrival of European settlers.
The first settlers arrived in the area in the late 1800s, and the county was officially organized in 1883. The county quickly grew, and by the early 1900s, the population had reached over 1,000.
The county continued to grow throughout the 20th century, and by the 2000 census, the population had reached 2,093. The county remains largely rural, and is home to several small towns and communities.
Common Questions
What is Per Capita Income in Golden Valley County?
Per Capita income in Golden Valley County is $35,953.
What is the Median Family Income in Golden Valley County?
Median Family Income in Golden Valley County is $95,625.
What is the Median Household income in Golden Valley County?
Median Household Income in Golden Valley County is $84,750.
What is Income or Wage Gap in Golden Valley County?
Income or Wage Gap in Golden Valley County is 50.0%.
Women in Golden Valley County earn 50.0 cents for every dollar earned by a man.
What is Inequality or Gini Index in Golden Valley County?
Inequality or Gini Index in Golden Valley County is 0.38.
What is the Total Population of Golden Valley County?
Total Population of Golden Valley County is 1,734.
What is the Total Male Population of Golden Valley County?
Total Male Population of Golden Valley County is 859.
What is the Total Female Population of Golden Valley County?
Total Female Population of Golden Valley County is 875.
What is the Ratio of Males per 100 Females in Golden Valley County?
There are 98.17 Males per 100 Females in Golden Valley County.
What is the Ratio of Females per 100 Males in Golden Valley County?
There are 101.86 Females per 100 Males in Golden Valley County.
What is the Median Population Age in Golden Valley County?
Median Population Age in Golden Valley County is 45.7 Years.
What is the Average Family Size in Golden Valley County
Average Family Size in Golden Valley County is 2.9 People.
What is the Average Household Size in Golden Valley County
Average Household Size in Golden Valley County is 2.5 People.
How Large is the Labor Force in Golden Valley County?
There are 856 People in the Labor Forcein in Golden Valley County.
What is the Percentage of People in the Labor Force in Golden Valley County?
60.4% of People are in the Labor Force in Golden Valley County.
What is the Unemployment Rate in Golden Valley County?
Unemployment Rate in Golden Valley County is 5.4%.