Eddy County, ND Map & Demographics
Eddy County Overview
$34,852
PER CAPITA INCOME
$76,964
AVG FAMILY INCOME
$50,375
AVG HOUSEHOLD INCOME
17.7%
WAGE / INCOME GAP [ % ]
82.3¢/ $1
WAGE / INCOME GAP [ $ ]
0.48
INEQUALITY / GINI INDEX
2,345
TOTAL POPULATION
1,225
MALE POPULATION
1,120
FEMALE POPULATION
109.38
MALES / 100 FEMALES
91.43
FEMALES / 100 MALES
46.4
MEDIAN AGE
2.9
AVG FAMILY SIZE
2.1
AVG HOUSEHOLD SIZE
1,136
LABOR FORCE [ PEOPLE ]
58.6%
PERCENT IN LABOR FORCE
2.3%
UNEMPLOYMENT RATE
Eddy County Area Codes
Income in Eddy County
Income Overview in Eddy County
Per Capita Income in Eddy County is $34,852, while median incomes of families and households are $76,964 and $50,375 respectively.
| Characteristic | Number | Measure |
| Per Capita Income | 2,345 | $34,852 |
| Median Family Income | 555 | $76,964 |
| Mean Family Income | 555 | $98,563 |
| Median Household Income | 1,077 | $50,375 |
| Mean Household Income | 1,077 | $73,032 |
| Income Deficit | 555 | $0 |
| Wage / Income Gap (%) | 2,345 | 17.69% |
| Wage / Income Gap ($) | 2,345 | 82.31¢ per $1 |
| Gini / Inequality Index | 2,345 | 0.48 |
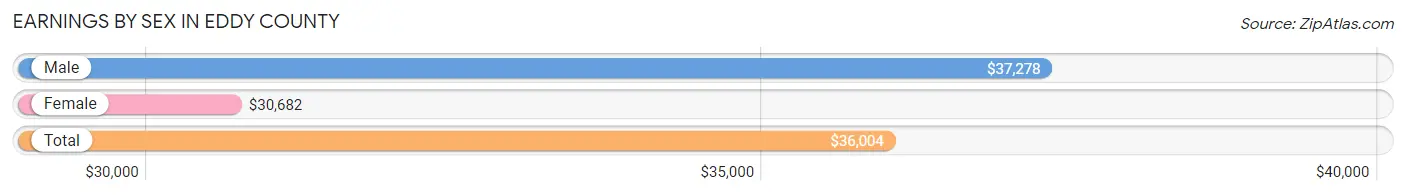
Earnings by Sex in Eddy County
Average Earnings in Eddy County are $36,004, $37,278 for men and $30,682 for women, a difference of 17.7%.
| Sex | Number | Average Earnings |
| Male | 712 (57.2%) | $37,278 |
| Female | 532 (42.8%) | $30,682 |
| Total | 1,244 (100.0%) | $36,004 |
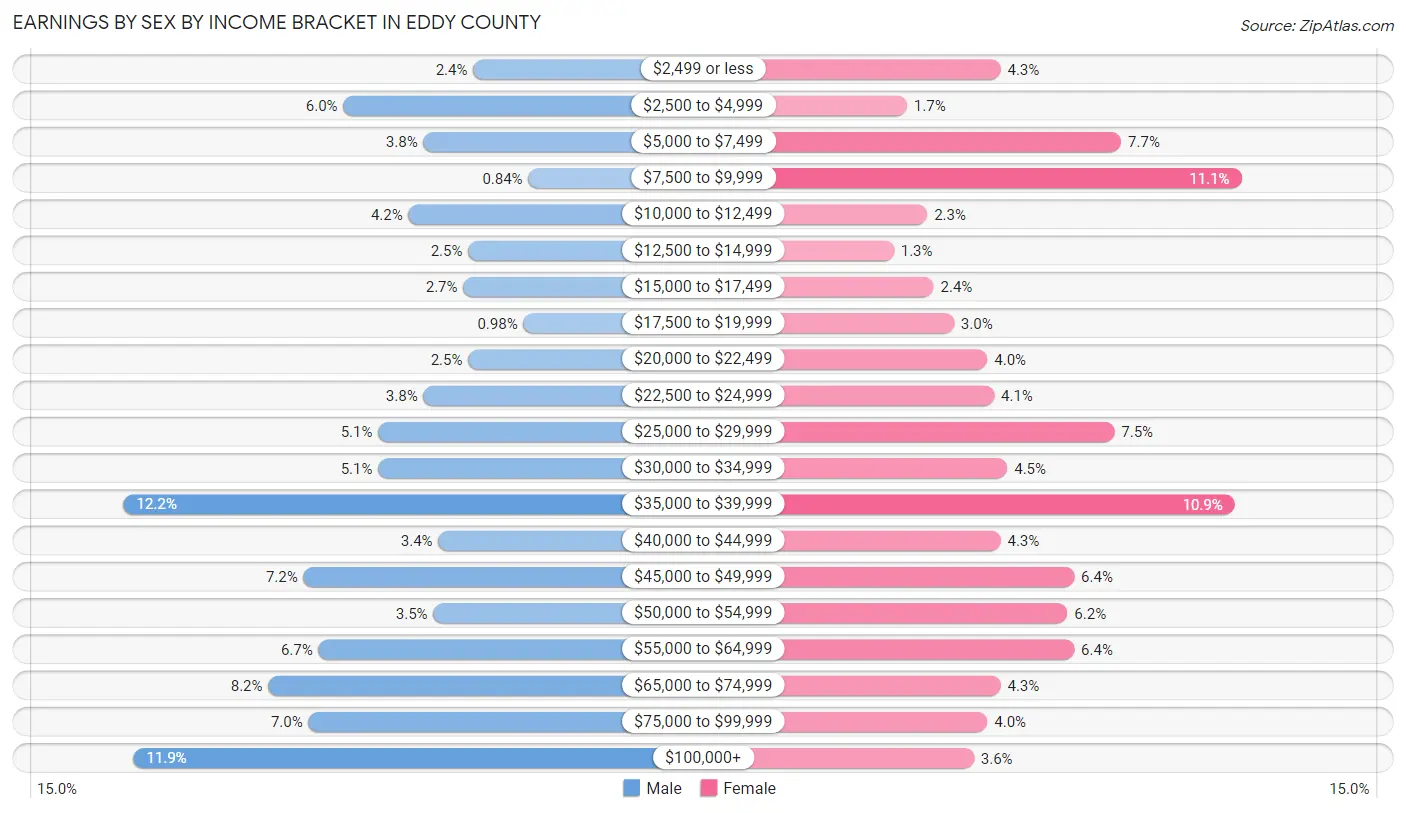
Earnings by Sex by Income Bracket in Eddy County
The most common earnings brackets in Eddy County are $35,000 to $39,999 for men (87 | 12.2%) and $7,500 to $9,999 for women (59 | 11.1%).
| Income | Male | Female |
| $2,499 or less | 17 (2.4%) | 23 (4.3%) |
| $2,500 to $4,999 | 43 (6.0%) | 9 (1.7%) |
| $5,000 to $7,499 | 27 (3.8%) | 41 (7.7%) |
| $7,500 to $9,999 | 6 (0.8%) | 59 (11.1%) |
| $10,000 to $12,499 | 30 (4.2%) | 12 (2.3%) |
| $12,500 to $14,999 | 18 (2.5%) | 7 (1.3%) |
| $15,000 to $17,499 | 19 (2.7%) | 13 (2.4%) |
| $17,500 to $19,999 | 7 (1.0%) | 16 (3.0%) |
| $20,000 to $22,499 | 18 (2.5%) | 21 (4.0%) |
| $22,500 to $24,999 | 27 (3.8%) | 22 (4.1%) |
| $25,000 to $29,999 | 36 (5.1%) | 40 (7.5%) |
| $30,000 to $34,999 | 36 (5.1%) | 24 (4.5%) |
| $35,000 to $39,999 | 87 (12.2%) | 58 (10.9%) |
| $40,000 to $44,999 | 24 (3.4%) | 23 (4.3%) |
| $45,000 to $49,999 | 51 (7.2%) | 34 (6.4%) |
| $50,000 to $54,999 | 25 (3.5%) | 33 (6.2%) |
| $55,000 to $64,999 | 48 (6.7%) | 34 (6.4%) |
| $65,000 to $74,999 | 58 (8.2%) | 23 (4.3%) |
| $75,000 to $99,999 | 50 (7.0%) | 21 (4.0%) |
| $100,000+ | 85 (11.9%) | 19 (3.6%) |
| Total | 712 (100.0%) | 532 (100.0%) |
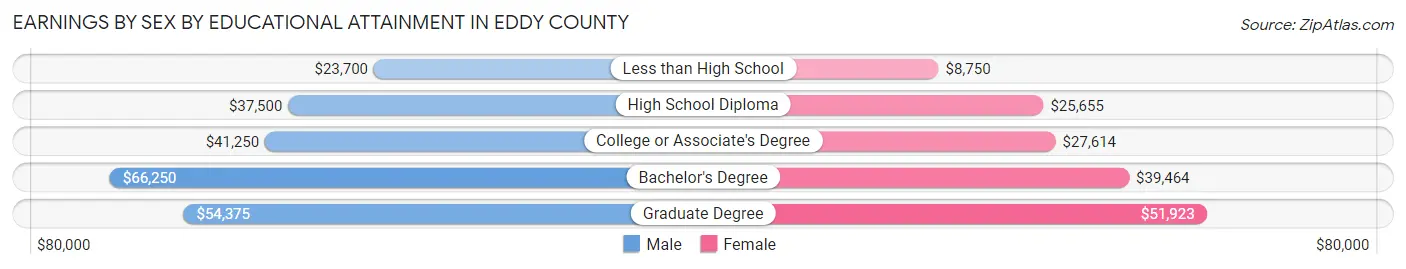
Earnings by Sex by Educational Attainment in Eddy County
Average earnings in Eddy County are $45,000 for men and $33,750 for women, a difference of 25.0%. Men with an educational attainment of bachelor's degree enjoy the highest average annual earnings of $66,250, while those with less than high school education earn the least with $23,700. Women with an educational attainment of graduate degree earn the most with the average annual earnings of $51,923, while those with less than high school education have the smallest earnings of $8,750.
| Educational Attainment | Male Income | Female Income |
| Less than High School | $23,700 | $8,750 |
| High School Diploma | $37,500 | $25,655 |
| College or Associate's Degree | $41,250 | $27,614 |
| Bachelor's Degree | $66,250 | $39,464 |
| Graduate Degree | $54,375 | $51,923 |
| Total | $45,000 | $33,750 |
Family Income in Eddy County
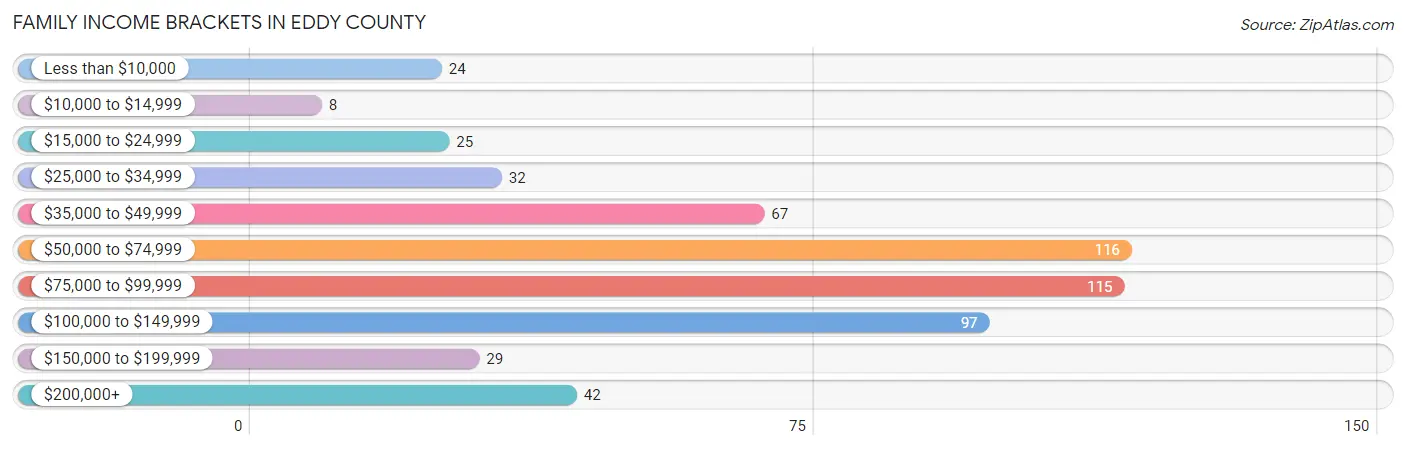
Family Income Brackets in Eddy County
According to the Eddy County family income data, there are 116 families falling into the $50,000 to $74,999 income range, which is the most common income bracket and makes up 20.9% of all families. Conversely, the $10,000 to $14,999 income bracket is the least frequent group with only 8 families (1.4%) belonging to this category.
| Income Bracket | # Families | % Families |
| Less than $10,000 | 24 | 4.3% |
| $10,000 to $14,999 | 8 | 1.4% |
| $15,000 to $24,999 | 25 | 4.5% |
| $25,000 to $34,999 | 32 | 5.8% |
| $35,000 to $49,999 | 67 | 12.1% |
| $50,000 to $74,999 | 116 | 20.9% |
| $75,000 to $99,999 | 115 | 20.7% |
| $100,000 to $149,999 | 97 | 17.5% |
| $150,000 to $199,999 | 29 | 5.2% |
| $200,000+ | 42 | 7.6% |
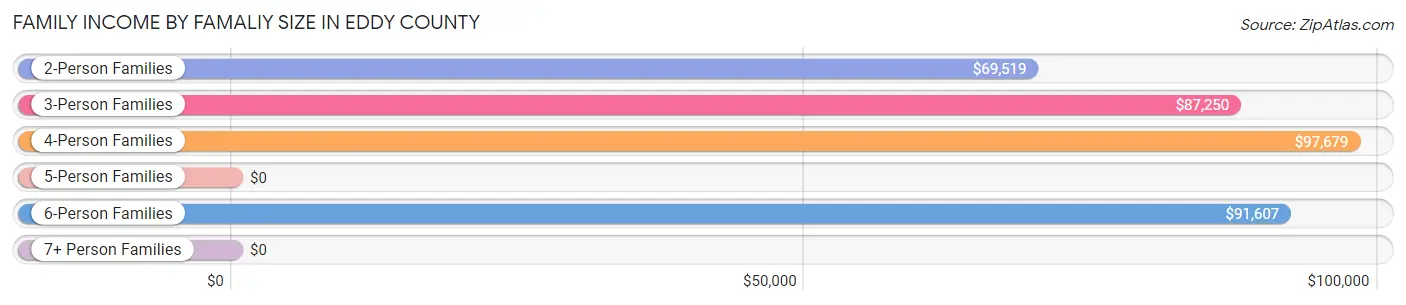
Family Income by Famaliy Size in Eddy County
4-person families (79 | 14.2%) account for the highest median family income in Eddy County with $97,679 per family, while 2-person families (337 | 60.7%) have the highest median income of $34,760 per family member.
| Income Bracket | # Families | Median Income |
| 2-Person Families | 337 (60.7%) | $69,519 |
| 3-Person Families | 86 (15.5%) | $87,250 |
| 4-Person Families | 79 (14.2%) | $97,679 |
| 5-Person Families | 11 (2.0%) | $0 |
| 6-Person Families | 37 (6.7%) | $91,607 |
| 7+ Person Families | 5 (0.9%) | $0 |
| Total | 555 (100.0%) | $76,964 |
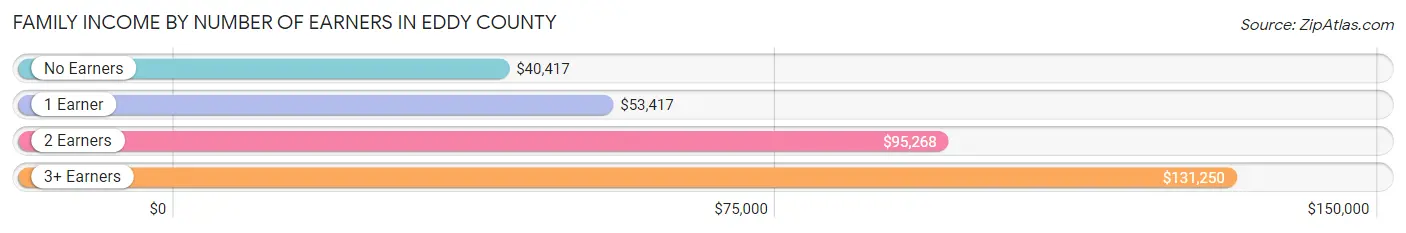
Family Income by Number of Earners in Eddy County
The median family income in Eddy County is $76,964, with families comprising 3+ earners (43) having the highest median family income of $131,250, while families with no earners (94) have the lowest median family income of $40,417, accounting for 7.7% and 16.9% of families, respectively.
| Number of Earners | # Families | Median Income |
| No Earners | 94 (16.9%) | $40,417 |
| 1 Earner | 127 (22.9%) | $53,417 |
| 2 Earners | 291 (52.4%) | $95,268 |
| 3+ Earners | 43 (7.7%) | $131,250 |
| Total | 555 (100.0%) | $76,964 |
Household Income in Eddy County
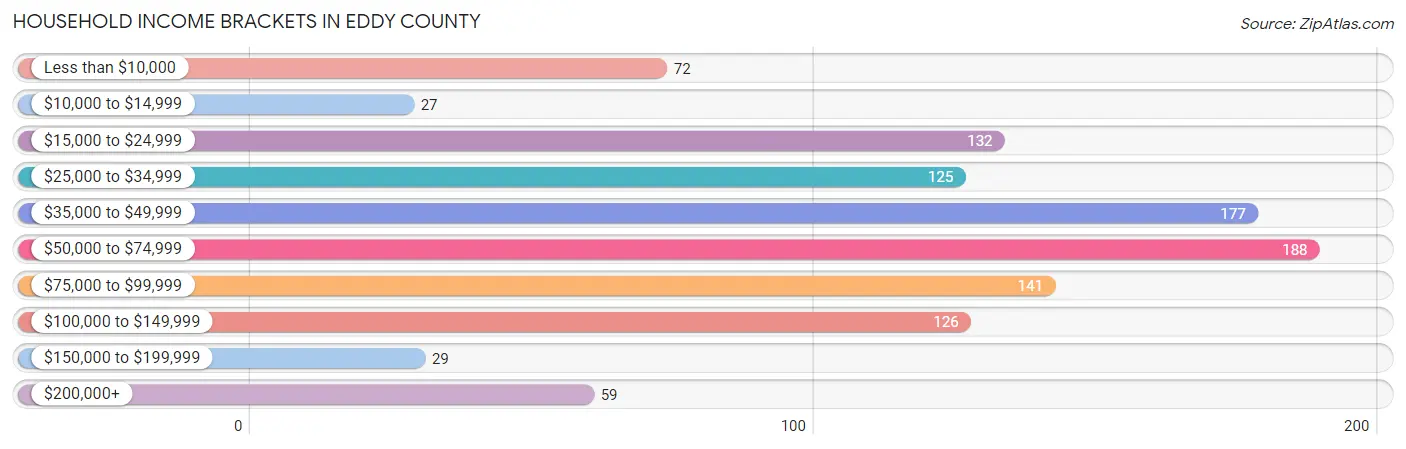
Household Income Brackets in Eddy County
With 188 households falling in the category, the $50,000 to $74,999 income range is the most frequent in Eddy County, accounting for 17.5% of all households. In contrast, only 27 households (2.5%) fall into the $10,000 to $14,999 income bracket, making it the least populous group.
| Income Bracket | # Households | % Households |
| Less than $10,000 | 72 | 6.7% |
| $10,000 to $14,999 | 27 | 2.5% |
| $15,000 to $24,999 | 132 | 12.3% |
| $25,000 to $34,999 | 125 | 11.6% |
| $35,000 to $49,999 | 177 | 16.4% |
| $50,000 to $74,999 | 188 | 17.5% |
| $75,000 to $99,999 | 141 | 13.1% |
| $100,000 to $149,999 | 126 | 11.7% |
| $150,000 to $199,999 | 29 | 2.7% |
| $200,000+ | 59 | 5.5% |
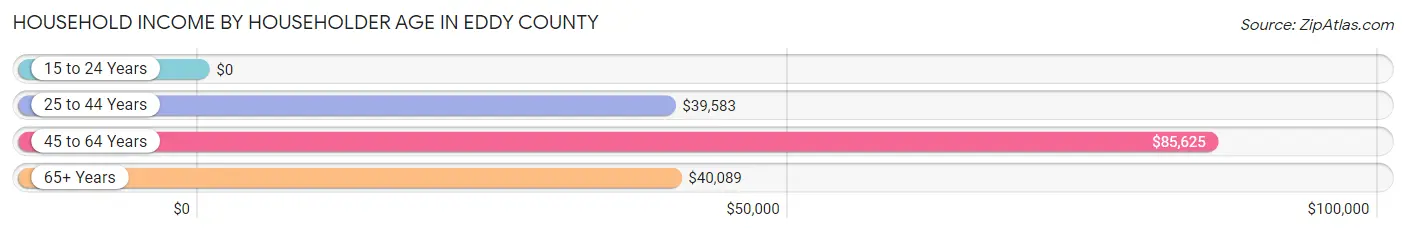
Household Income by Householder Age in Eddy County
The median household income in Eddy County is $50,375, with the highest median household income of $85,625 found in the 45 to 64 years age bracket for the primary householder. A total of 306 households (28.4%) fall into this category. Meanwhile, the 15 to 24 years age bracket for the primary householder has the lowest median household income of $0, with 46 households (4.3%) in this group.
| Income Bracket | # Households | Median Income |
| 15 to 24 Years | 46 (4.3%) | $0 |
| 25 to 44 Years | 302 (28.0%) | $39,583 |
| 45 to 64 Years | 306 (28.4%) | $85,625 |
| 65+ Years | 423 (39.3%) | $40,089 |
| Total | 1,077 (100.0%) | $50,375 |
Poverty in Eddy County
Income Below Poverty by Sex and Age in Eddy County
With 9.0% poverty level for males and 16.0% for females among the residents of Eddy County, 6 to 11 year old males and 18 to 24 year old females are the most vulnerable to poverty, with 15 males (25.9%) and 40 females (59.7%) in their respective age groups living below the poverty level.
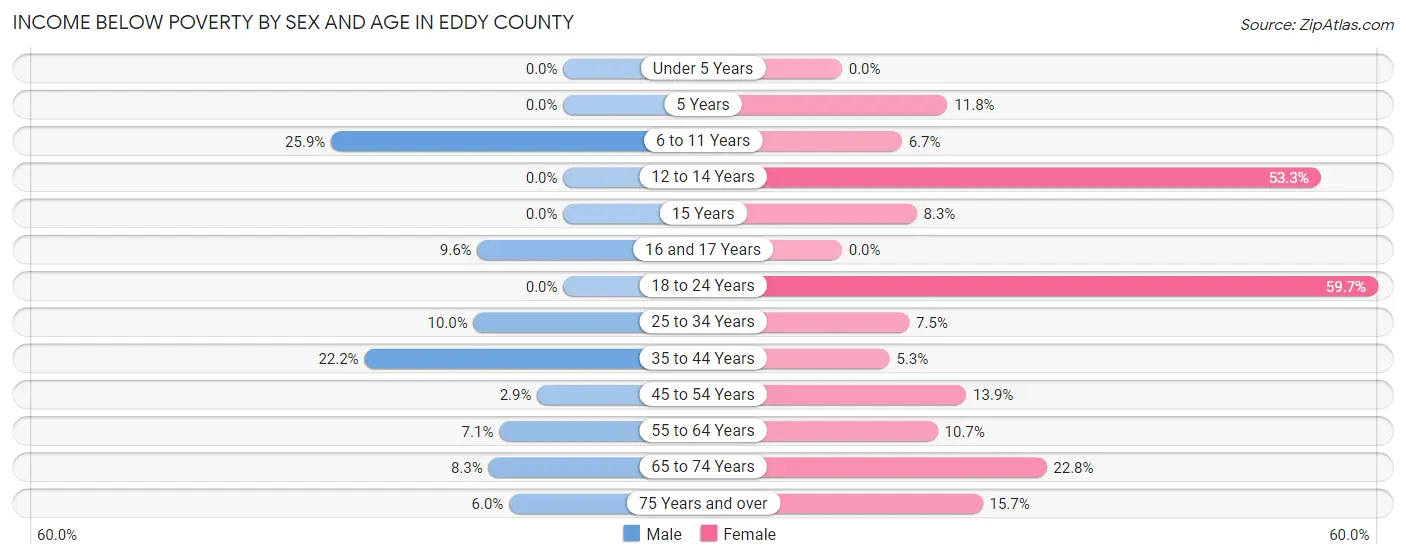
| Age Bracket | Male | Female |
| Under 5 Years | 0 (0.0%) | 0 (0.0%) |
| 5 Years | 0 (0.0%) | 2 (11.8%) |
| 6 to 11 Years | 15 (25.9%) | 5 (6.7%) |
| 12 to 14 Years | 0 (0.0%) | 16 (53.3%) |
| 15 Years | 0 (0.0%) | 1 (8.3%) |
| 16 and 17 Years | 9 (9.6%) | 0 (0.0%) |
| 18 to 24 Years | 0 (0.0%) | 40 (59.7%) |
| 25 to 34 Years | 14 (10.0%) | 9 (7.5%) |
| 35 to 44 Years | 33 (22.2%) | 5 (5.3%) |
| 45 to 54 Years | 4 (2.9%) | 18 (13.9%) |
| 55 to 64 Years | 10 (7.1%) | 16 (10.7%) |
| 65 to 74 Years | 14 (8.3%) | 36 (22.8%) |
| 75 Years and over | 7 (6.0%) | 21 (15.7%) |
| Total | 106 (9.0%) | 169 (16.0%) |
Income Above Poverty by Sex and Age in Eddy County
According to the poverty statistics in Eddy County, males aged under 5 years and females aged under 5 years are the age groups that are most secure financially, with 100.0% of males and 100.0% of females in these age groups living above the poverty line.
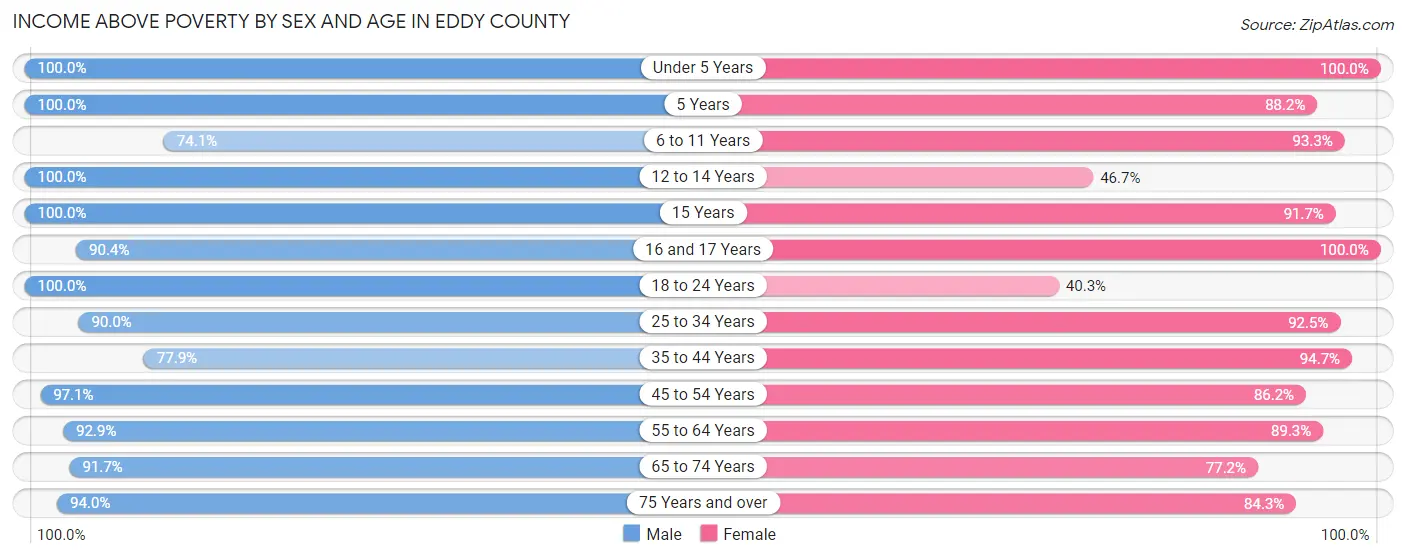
| Age Bracket | Male | Female |
| Under 5 Years | 70 (100.0%) | 66 (100.0%) |
| 5 Years | 5 (100.0%) | 15 (88.2%) |
| 6 to 11 Years | 43 (74.1%) | 70 (93.3%) |
| 12 to 14 Years | 30 (100.0%) | 14 (46.7%) |
| 15 Years | 7 (100.0%) | 11 (91.7%) |
| 16 and 17 Years | 85 (90.4%) | 6 (100.0%) |
| 18 to 24 Years | 57 (100.0%) | 27 (40.3%) |
| 25 to 34 Years | 126 (90.0%) | 111 (92.5%) |
| 35 to 44 Years | 116 (77.8%) | 89 (94.7%) |
| 45 to 54 Years | 134 (97.1%) | 112 (86.2%) |
| 55 to 64 Years | 130 (92.9%) | 134 (89.3%) |
| 65 to 74 Years | 154 (91.7%) | 122 (77.2%) |
| 75 Years and over | 109 (94.0%) | 113 (84.3%) |
| Total | 1,066 (91.0%) | 890 (84.0%) |
Income Below Poverty Among Married-Couple Families in Eddy County
The poverty statistics for married-couple families in Eddy County show that 5.1% or 24 of the total 473 families live below the poverty line. Families with 5 or more children have the highest poverty rate of 100.0%, comprising of 5 families. On the other hand, families with 1 or 2 children have the lowest poverty rate of 0.0%, which includes 0 families.
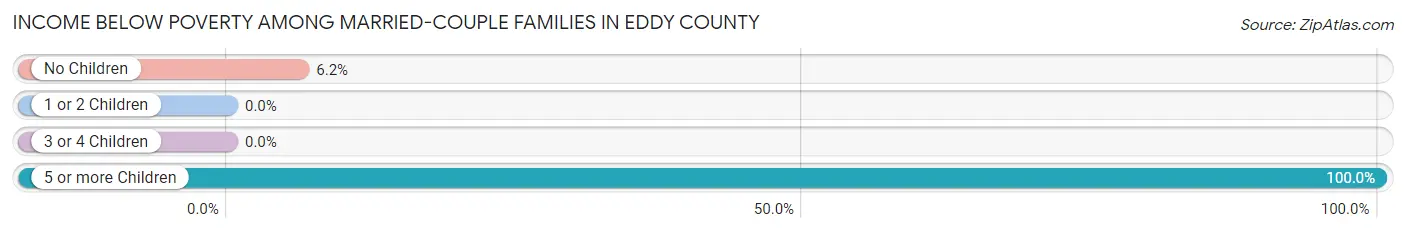
| Children | Above Poverty | Below Poverty |
| No Children | 287 (93.8%) | 19 (6.2%) |
| 1 or 2 Children | 114 (100.0%) | 0 (0.0%) |
| 3 or 4 Children | 48 (100.0%) | 0 (0.0%) |
| 5 or more Children | 0 (0.0%) | 5 (100.0%) |
| Total | 449 (94.9%) | 24 (5.1%) |
Income Below Poverty Among Single-Parent Households in Eddy County
According to the poverty data in Eddy County, 6.2% or 2 single-father households and 52.0% or 26 single-mother households are living below the poverty line. Among single-father households, those with 1 or 2 children have the highest poverty rate, with 2 households (8.0%) experiencing poverty. Likewise, among single-mother households, those with no children have the highest poverty rate, with 14 households (77.8%) falling below the poverty line.
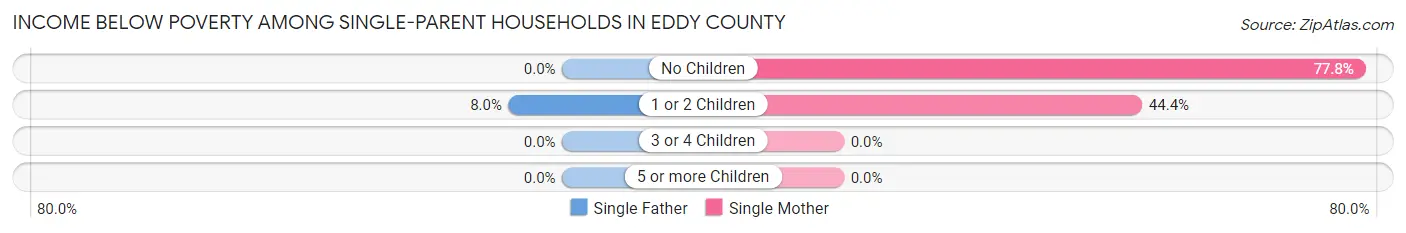
| Children | Single Father | Single Mother |
| No Children | 0 (0.0%) | 14 (77.8%) |
| 1 or 2 Children | 2 (8.0%) | 12 (44.4%) |
| 3 or 4 Children | 0 (0.0%) | 0 (0.0%) |
| 5 or more Children | 0 (0.0%) | 0 (0.0%) |
| Total | 2 (6.2%) | 26 (52.0%) |
Income Below Poverty Among Married-Couple vs Single-Parent Households in Eddy County
The poverty data for Eddy County shows that 24 of the married-couple family households (5.1%) and 28 of the single-parent households (34.2%) are living below the poverty level. Within the married-couple family households, those with 5 or more children have the highest poverty rate, with 5 households (100.0%) falling below the poverty line. Among the single-parent households, those with no children have the highest poverty rate, with 14 household (56.0%) living below poverty.
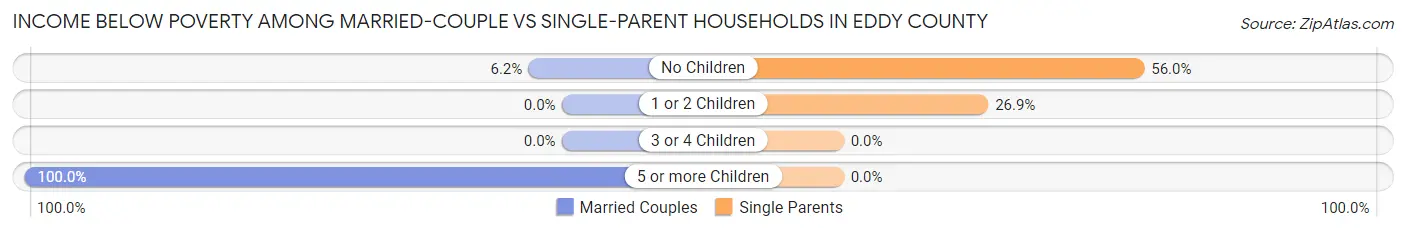
| Children | Married-Couple Families | Single-Parent Households |
| No Children | 19 (6.2%) | 14 (56.0%) |
| 1 or 2 Children | 0 (0.0%) | 14 (26.9%) |
| 3 or 4 Children | 0 (0.0%) | 0 (0.0%) |
| 5 or more Children | 5 (100.0%) | 0 (0.0%) |
| Total | 24 (5.1%) | 28 (34.2%) |
Race in Eddy County
The most populous races in Eddy County are White / Caucasian (2,133 | 91.0%), Two or more Races (106 | 4.5%), and Native / Alaskan (96 | 4.1%).
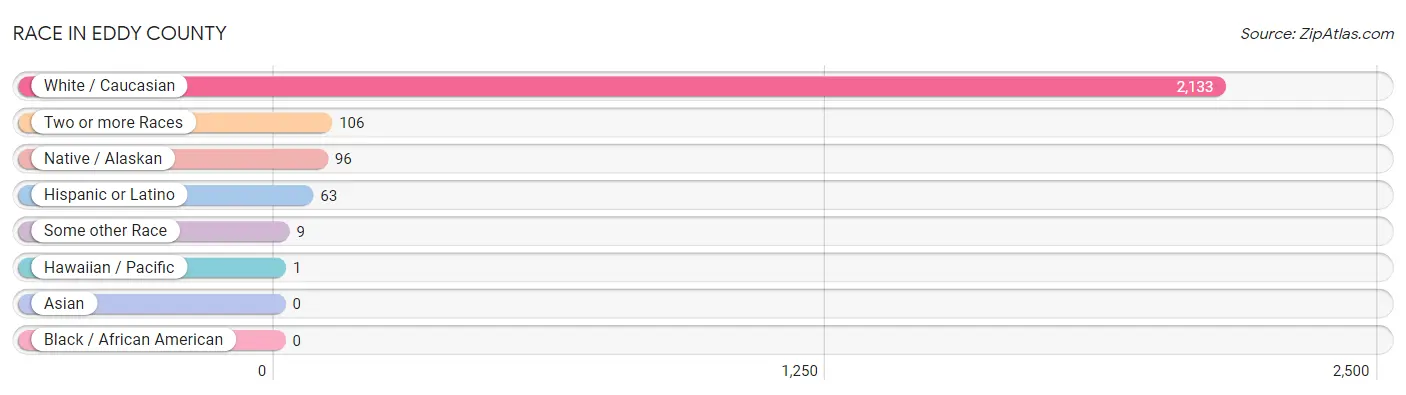
| Race | # Population | % Population |
| Asian | 0 | 0.0% |
| Black / African American | 0 | 0.0% |
| Hawaiian / Pacific | 1 | 0.0% |
| Hispanic or Latino | 63 | 2.7% |
| Native / Alaskan | 96 | 4.1% |
| White / Caucasian | 2,133 | 91.0% |
| Two or more Races | 106 | 4.5% |
| Some other Race | 9 | 0.4% |
| Total | 2,345 | 100.0% |
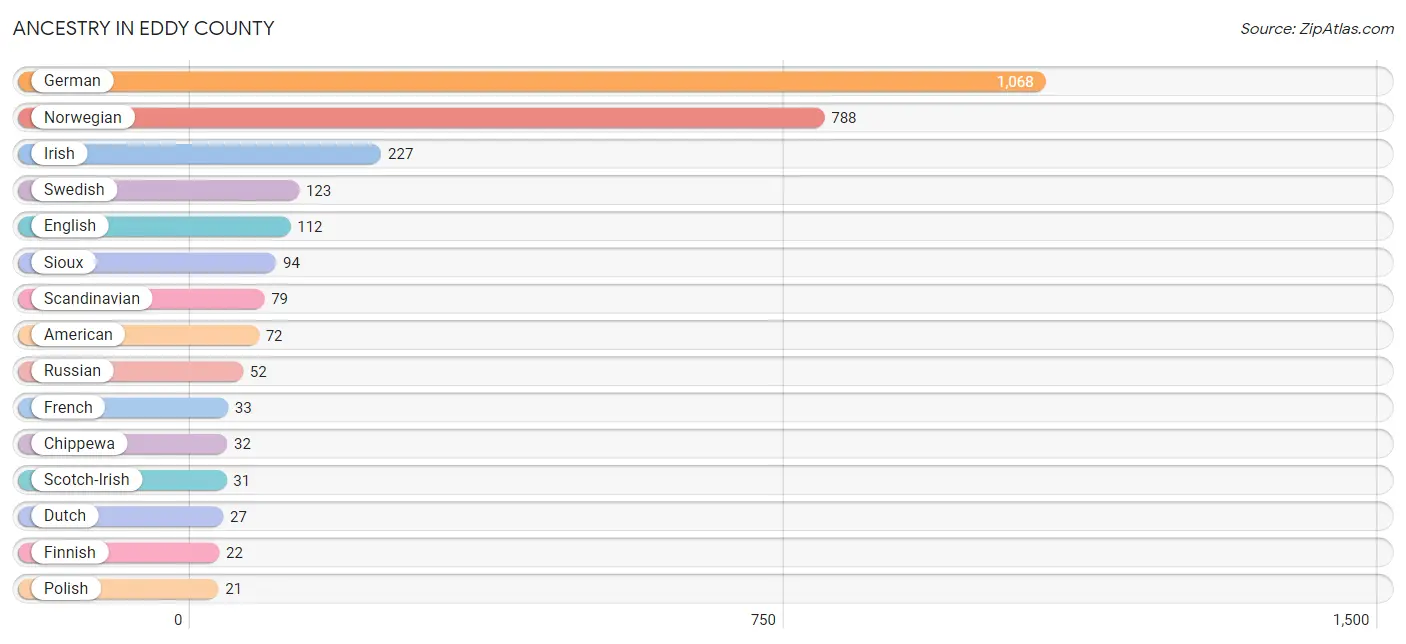
Ancestry in Eddy County
The most populous ancestries reported in Eddy County are German (1,068 | 45.5%), Norwegian (788 | 33.6%), Irish (227 | 9.7%), Swedish (123 | 5.2%), and English (112 | 4.8%), together accounting for 98.9% of all Eddy County residents.
| Ancestry | # Population | % Population |
| American | 72 | 3.1% |
| British | 12 | 0.5% |
| Chippewa | 32 | 1.4% |
| Colombian | 11 | 0.5% |
| Czech | 15 | 0.6% |
| Danish | 5 | 0.2% |
| Dominican | 3 | 0.1% |
| Dutch | 27 | 1.1% |
| Eastern European | 5 | 0.2% |
| English | 112 | 4.8% |
| European | 12 | 0.5% |
| Finnish | 22 | 0.9% |
| French | 33 | 1.4% |
| French American Indian | 2 | 0.1% |
| French Canadian | 1 | 0.0% |
| German | 1,068 | 45.5% |
| German Russian | 9 | 0.4% |
| Guamanian / Chamorro | 2 | 0.1% |
| Hungarian | 5 | 0.2% |
| Irish | 227 | 9.7% |
| Italian | 5 | 0.2% |
| Luxembourger | 2 | 0.1% |
| Mexican | 18 | 0.8% |
| Norwegian | 788 | 33.6% |
| Pennsylvania German | 1 | 0.0% |
| Polish | 21 | 0.9% |
| Portuguese | 9 | 0.4% |
| Romanian | 2 | 0.1% |
| Russian | 52 | 2.2% |
| Scandinavian | 79 | 3.4% |
| Scotch-Irish | 31 | 1.3% |
| Scottish | 21 | 0.9% |
| Sioux | 94 | 4.0% |
| Slovak | 2 | 0.1% |
| South American | 11 | 0.5% |
| Spaniard | 19 | 0.8% |
| Spanish | 12 | 0.5% |
| Swedish | 123 | 5.2% |
| Swiss | 8 | 0.3% |
| Welsh | 12 | 0.5% | View All 40 Rows |
Immigrants in Eddy County
The most numerous immigrant groups reported in Eddy County came from Colombia (11 | 0.5%), Latin America (11 | 0.5%), South America (11 | 0.5%), and Canada (2 | 0.1%), together accounting for 1.5% of all Eddy County residents.
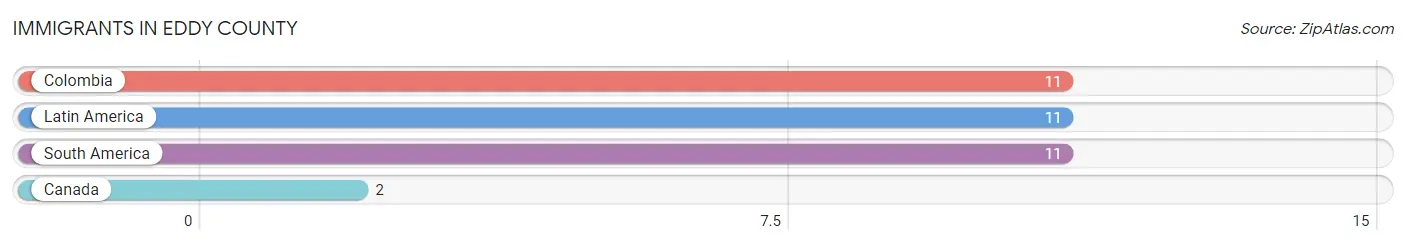
| Immigration Origin | # Population | % Population |
| Canada | 2 | 0.1% |
| Colombia | 11 | 0.5% |
| Latin America | 11 | 0.5% |
| South America | 11 | 0.5% | View All 4 Rows |
Sex and Age in Eddy County
Sex and Age in Eddy County
The most populous age groups in Eddy County are 15 to 19 Years (116 | 9.5%) for men and 5 to 9 Years (83 | 7.4%) for women.
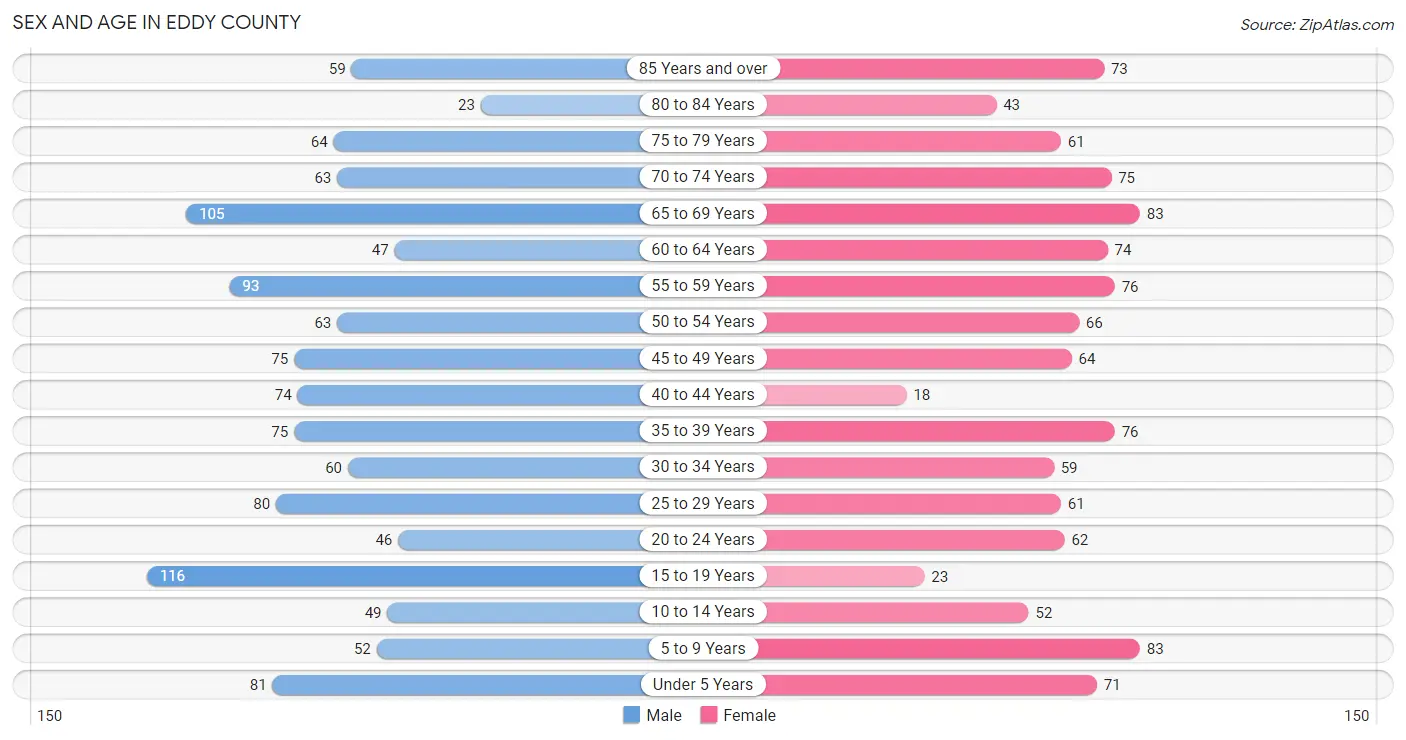
| Age Bracket | Male | Female |
| Under 5 Years | 81 (6.6%) | 71 (6.3%) |
| 5 to 9 Years | 52 (4.2%) | 83 (7.4%) |
| 10 to 14 Years | 49 (4.0%) | 52 (4.6%) |
| 15 to 19 Years | 116 (9.5%) | 23 (2.1%) |
| 20 to 24 Years | 46 (3.8%) | 62 (5.5%) |
| 25 to 29 Years | 80 (6.5%) | 61 (5.4%) |
| 30 to 34 Years | 60 (4.9%) | 59 (5.3%) |
| 35 to 39 Years | 75 (6.1%) | 76 (6.8%) |
| 40 to 44 Years | 74 (6.0%) | 18 (1.6%) |
| 45 to 49 Years | 75 (6.1%) | 64 (5.7%) |
| 50 to 54 Years | 63 (5.1%) | 66 (5.9%) |
| 55 to 59 Years | 93 (7.6%) | 76 (6.8%) |
| 60 to 64 Years | 47 (3.8%) | 74 (6.6%) |
| 65 to 69 Years | 105 (8.6%) | 83 (7.4%) |
| 70 to 74 Years | 63 (5.1%) | 75 (6.7%) |
| 75 to 79 Years | 64 (5.2%) | 61 (5.4%) |
| 80 to 84 Years | 23 (1.9%) | 43 (3.8%) |
| 85 Years and over | 59 (4.8%) | 73 (6.5%) |
| Total | 1,225 (100.0%) | 1,120 (100.0%) |
Families and Households in Eddy County
Median Family Size in Eddy County
The median family size in Eddy County is 2.89 persons per family, with single female/mother families (50 | 9.0%) accounting for the largest median family size of 2.96 persons per family. On the other hand, single male/father families (32 | 5.8%) represent the smallest median family size with 2.81 persons per family.
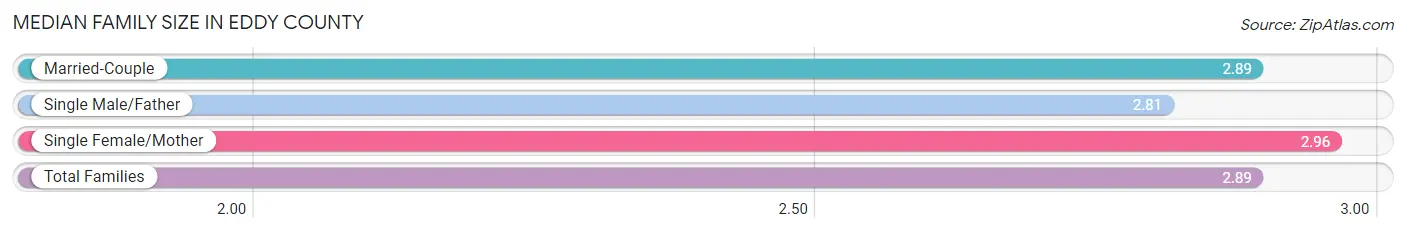
| Family Type | # Families | Family Size |
| Married-Couple | 473 (85.2%) | 2.89 |
| Single Male/Father | 32 (5.8%) | 2.81 |
| Single Female/Mother | 50 (9.0%) | 2.96 |
| Total Families | 555 (100.0%) | 2.89 |
Median Household Size in Eddy County
The median household size in Eddy County is 2.09 persons per household, with single female/mother households (50 | 4.6%) accounting for the largest median household size of 3.24 persons per household. non-family households (522 | 48.5%) represent the smallest median household size with 1.14 persons per household.
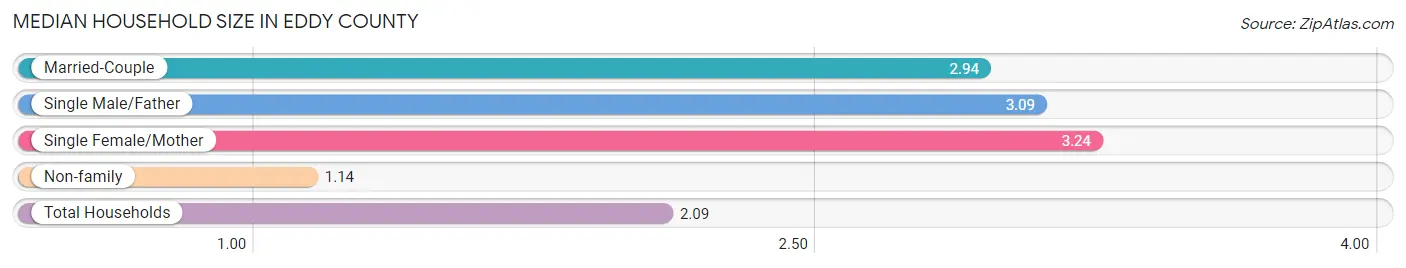
| Household Type | # Households | Household Size |
| Married-Couple | 473 (43.9%) | 2.94 |
| Single Male/Father | 32 (3.0%) | 3.09 |
| Single Female/Mother | 50 (4.6%) | 3.24 |
| Non-family | 522 (48.5%) | 1.14 |
| Total Households | 1,077 (100.0%) | 2.09 |
Household Size by Marriage Status in Eddy County
Out of a total of 1,077 households in Eddy County, 555 (51.5%) are family households, while 522 (48.5%) are nonfamily households. The most numerous type of family households are 2-person households, comprising 333, and the most common type of nonfamily households are 1-person households, comprising 464.
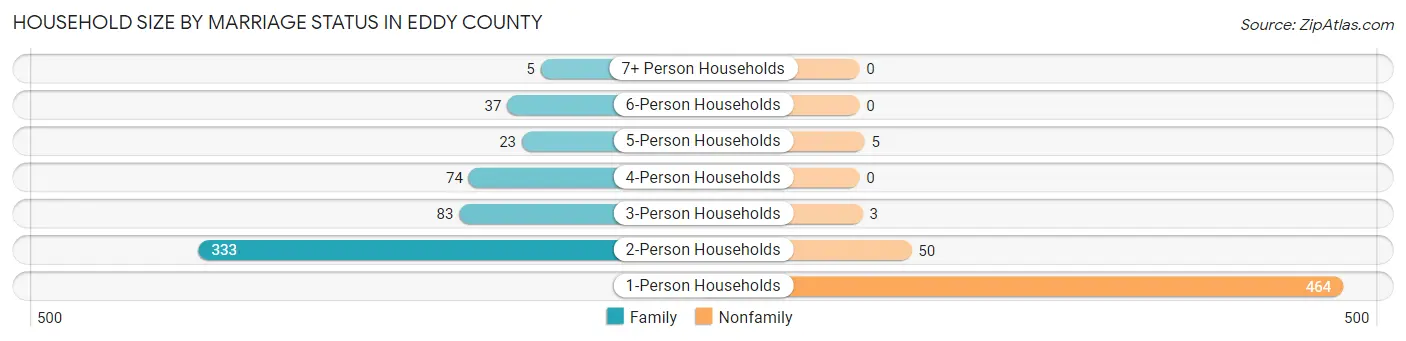
| Household Size | Family Households | Nonfamily Households |
| 1-Person Households | - | 464 (43.1%) |
| 2-Person Households | 333 (30.9%) | 50 (4.6%) |
| 3-Person Households | 83 (7.7%) | 3 (0.3%) |
| 4-Person Households | 74 (6.9%) | 0 (0.0%) |
| 5-Person Households | 23 (2.1%) | 5 (0.5%) |
| 6-Person Households | 37 (3.4%) | 0 (0.0%) |
| 7+ Person Households | 5 (0.5%) | 0 (0.0%) |
| Total | 555 (51.5%) | 522 (48.5%) |
Female Fertility in Eddy County
Fertility by Age in Eddy County
Average fertility rate in Eddy County is 89.0 births per 1,000 women. Women in the age bracket of 20 to 34 years have the highest fertility rate with 148.0 births per 1,000 women. Women in the age bracket of 20 to 34 years acount for 79.4% of all women with births.
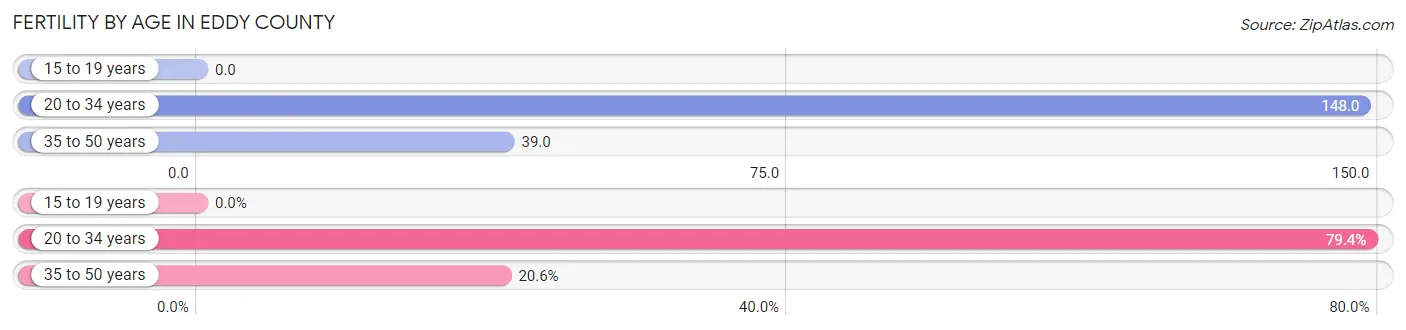
| Age Bracket | Women with Births | Births / 1,000 Women |
| 15 to 19 years | 0 (0.0%) | 0.0 |
| 20 to 34 years | 27 (79.4%) | 148.0 |
| 35 to 50 years | 7 (20.6%) | 39.0 |
| Total | 34 (100.0%) | 89.0 |
Fertility by Age by Marriage Status in Eddy County
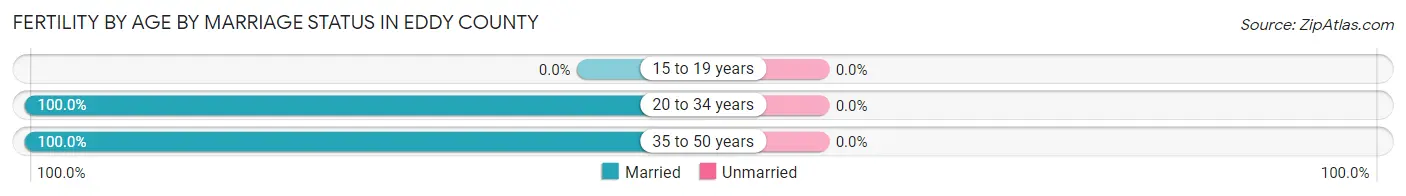
| Age Bracket | Married | Unmarried |
| 15 to 19 years | 0 (0.0%) | 0 (0.0%) |
| 20 to 34 years | 27 (100.0%) | 0 (0.0%) |
| 35 to 50 years | 7 (100.0%) | 0 (0.0%) |
| Total | 34 (100.0%) | 0 (0.0%) |
Fertility by Education in Eddy County
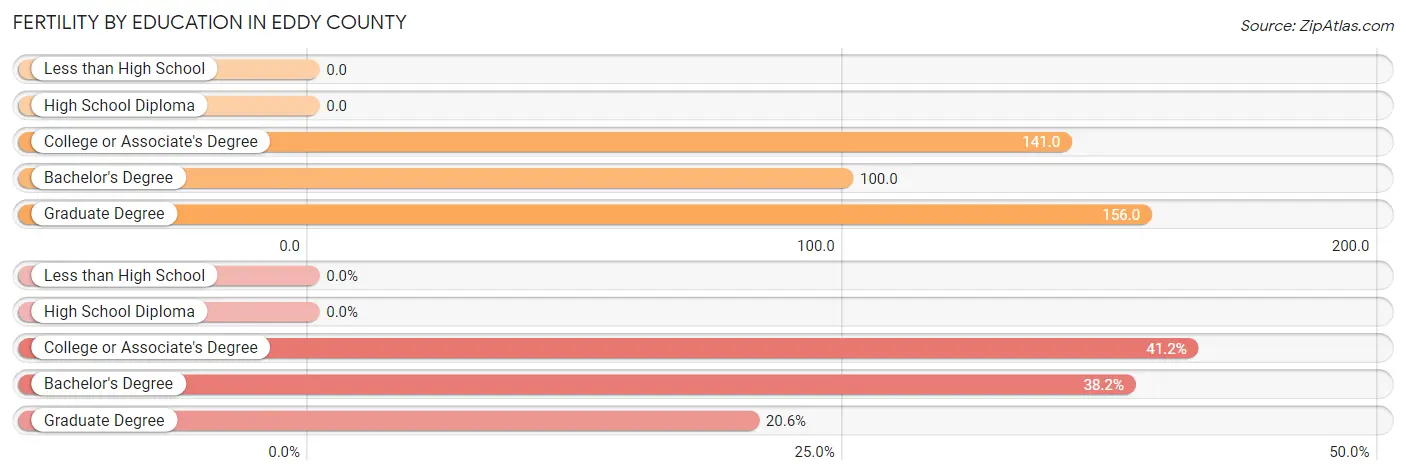
| Educational Attainment | Women with Births | Births / 1,000 Women |
| Less than High School | 0 (0.0%) | 0.0 |
| High School Diploma | 0 (0.0%) | 0.0 |
| College or Associate's Degree | 14 (41.2%) | 141.0 |
| Bachelor's Degree | 13 (38.2%) | 100.0 |
| Graduate Degree | 7 (20.6%) | 156.0 |
| Total | 34 (100.0%) | 89.0 |
Fertility by Education by Marriage Status in Eddy County
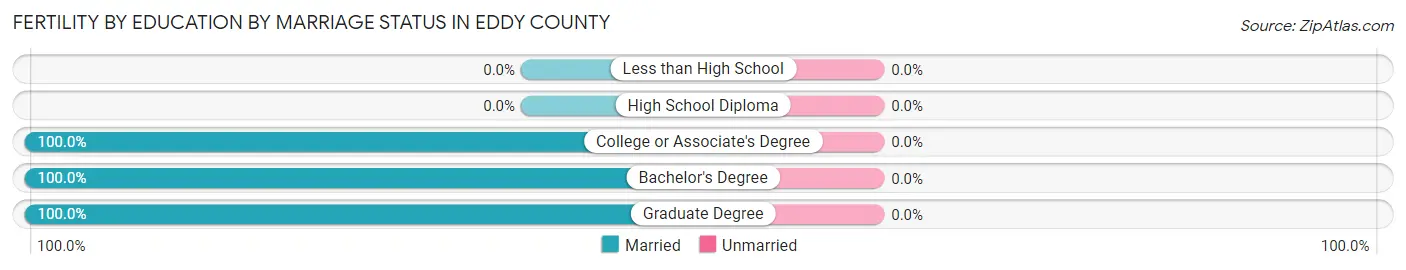
| Educational Attainment | Married | Unmarried |
| Less than High School | 0 (0.0%) | 0 (0.0%) |
| High School Diploma | 0 (0.0%) | 0 (0.0%) |
| College or Associate's Degree | 14 (100.0%) | 0 (0.0%) |
| Bachelor's Degree | 13 (100.0%) | 0 (0.0%) |
| Graduate Degree | 7 (100.0%) | 0 (0.0%) |
| Total | 34 (100.0%) | 0 (0.0%) |
Employment Characteristics in Eddy County
Employment by Class of Employer in Eddy County
Among the 1,098 employed individuals in Eddy County, private company employees (473 | 43.1%), self-employed (not incorporated) (193 | 17.6%), and local government employees (154 | 14.0%) make up the most common classes of employment.
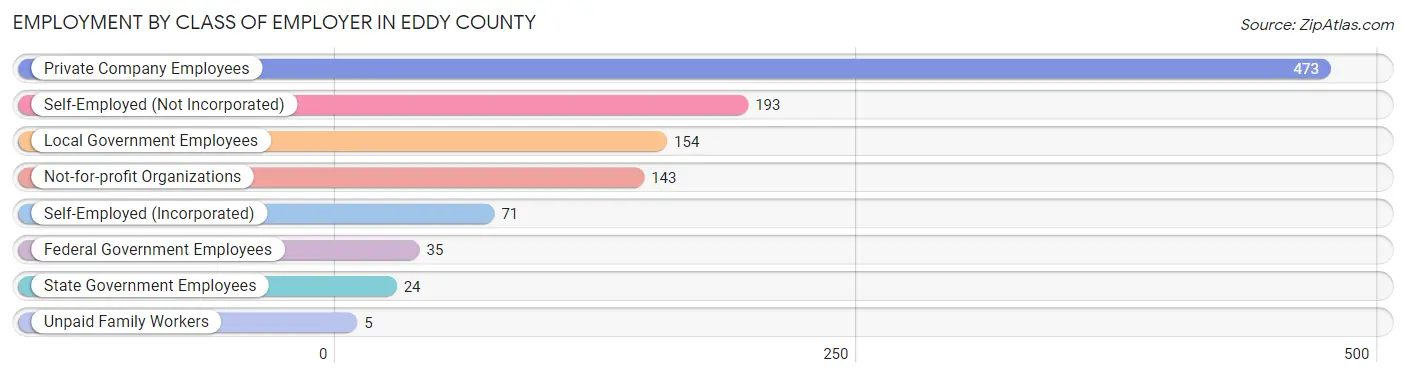
| Employer Class | # Employees | % Employees |
| Private Company Employees | 473 | 43.1% |
| Self-Employed (Incorporated) | 71 | 6.5% |
| Self-Employed (Not Incorporated) | 193 | 17.6% |
| Not-for-profit Organizations | 143 | 13.0% |
| Local Government Employees | 154 | 14.0% |
| State Government Employees | 24 | 2.2% |
| Federal Government Employees | 35 | 3.2% |
| Unpaid Family Workers | 5 | 0.5% |
| Total | 1,098 | 100.0% |
Employment Status by Age in Eddy County
According to the labor force statistics for Eddy County, out of the total population over 16 years of age (1,938), 58.6% or 1,136 individuals are in the labor force, with 2.3% or 26 of them unemployed. The age group with the highest labor force participation rate is 25 to 29 years, with 94.3% or 133 individuals in the labor force. Within the labor force, the 55 to 59 years age range has the highest percentage of unemployed individuals, with 7.7% or 11 of them being unemployed.
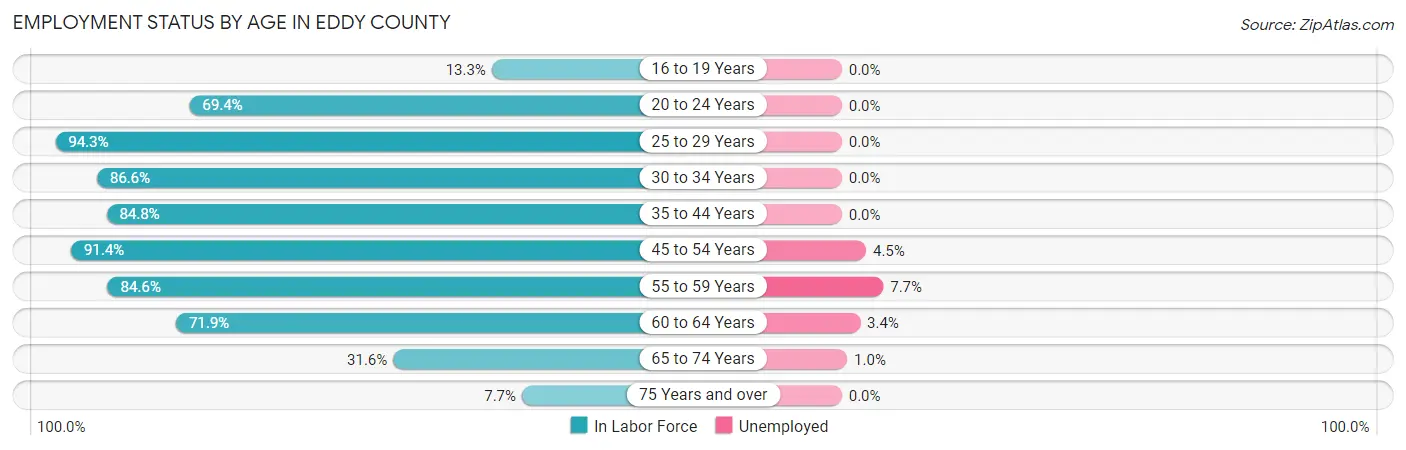
| Age Bracket | In Labor Force | Unemployed |
| 16 to 19 Years | 16 (13.3%) | 0 (0.0%) |
| 20 to 24 Years | 75 (69.4%) | 0 (0.0%) |
| 25 to 29 Years | 133 (94.3%) | 0 (0.0%) |
| 30 to 34 Years | 103 (86.6%) | 0 (0.0%) |
| 35 to 44 Years | 206 (84.8%) | 0 (0.0%) |
| 45 to 54 Years | 245 (91.4%) | 11 (4.5%) |
| 55 to 59 Years | 143 (84.6%) | 11 (7.7%) |
| 60 to 64 Years | 87 (71.9%) | 3 (3.4%) |
| 65 to 74 Years | 103 (31.6%) | 1 (1.0%) |
| 75 Years and over | 25 (7.7%) | 0 (0.0%) |
| Total | 1,136 (58.6%) | 26 (2.3%) |
Employment Status by Educational Attainment in Eddy County
According to labor force statistics for Eddy County, 86.4% of individuals (917) out of the total population between 25 and 64 years of age (1,061) are in the labor force, with 2.7% or 25 of them being unemployed. The group with the highest labor force participation rate are those with the educational attainment of bachelor's degree or higher, with 98.7% or 295 individuals in the labor force. Within the labor force, individuals with bachelor's degree or higher education have the highest percentage of unemployment, with 3.7% or 11 of them being unemployed.
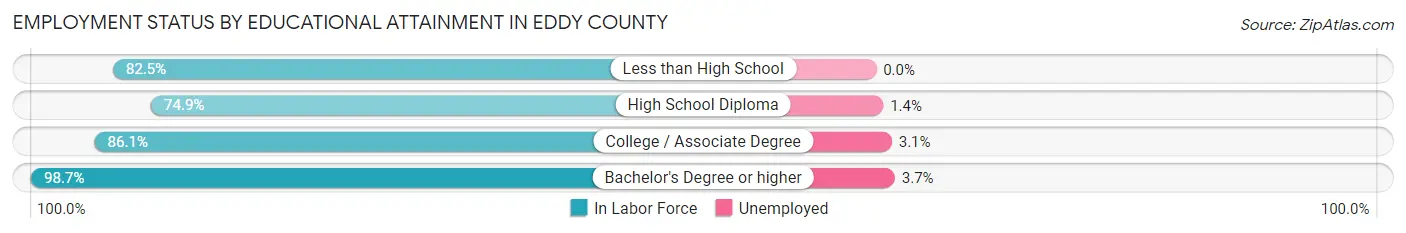
| Educational Attainment | In Labor Force | Unemployed |
| Less than High School | 47 (82.5%) | 0 (0.0%) |
| High School Diploma | 215 (74.9%) | 4 (1.4%) |
| College / Associate Degree | 360 (86.1%) | 13 (3.1%) |
| Bachelor's Degree or higher | 295 (98.7%) | 11 (3.7%) |
| Total | 917 (86.4%) | 29 (2.7%) |
Employment Occupations by Sex in Eddy County
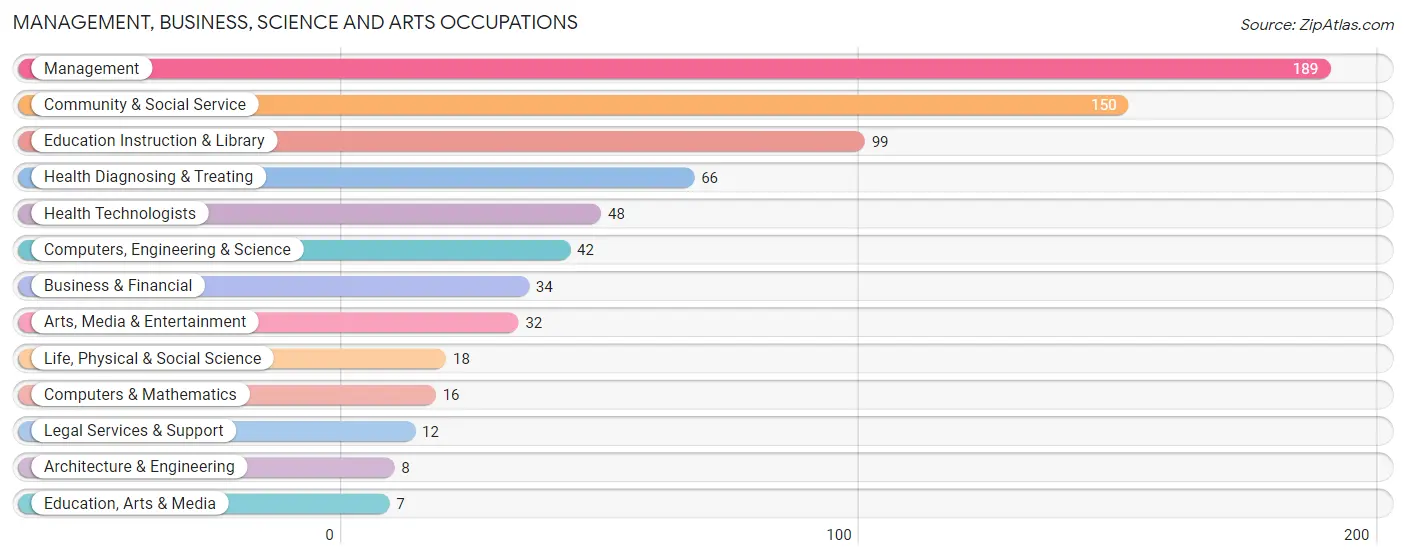
Management, Business, Science and Arts Occupations
The most common Management, Business, Science and Arts occupations in Eddy County are Management (189 | 17.1%), Community & Social Service (150 | 13.6%), Education Instruction & Library (99 | 9.0%), Health Diagnosing & Treating (66 | 6.0%), and Health Technologists (48 | 4.3%).
Management, Business, Science and Arts Occupations by Sex
Within the Management, Business, Science and Arts occupations in Eddy County, the most male-oriented occupations are Computers & Mathematics (100.0%), Life, Physical & Social Science (100.0%), and Education, Arts & Media (100.0%), while the most female-oriented occupations are Education Instruction & Library (95.0%), Arts, Media & Entertainment (90.6%), and Health Diagnosing & Treating (89.4%).
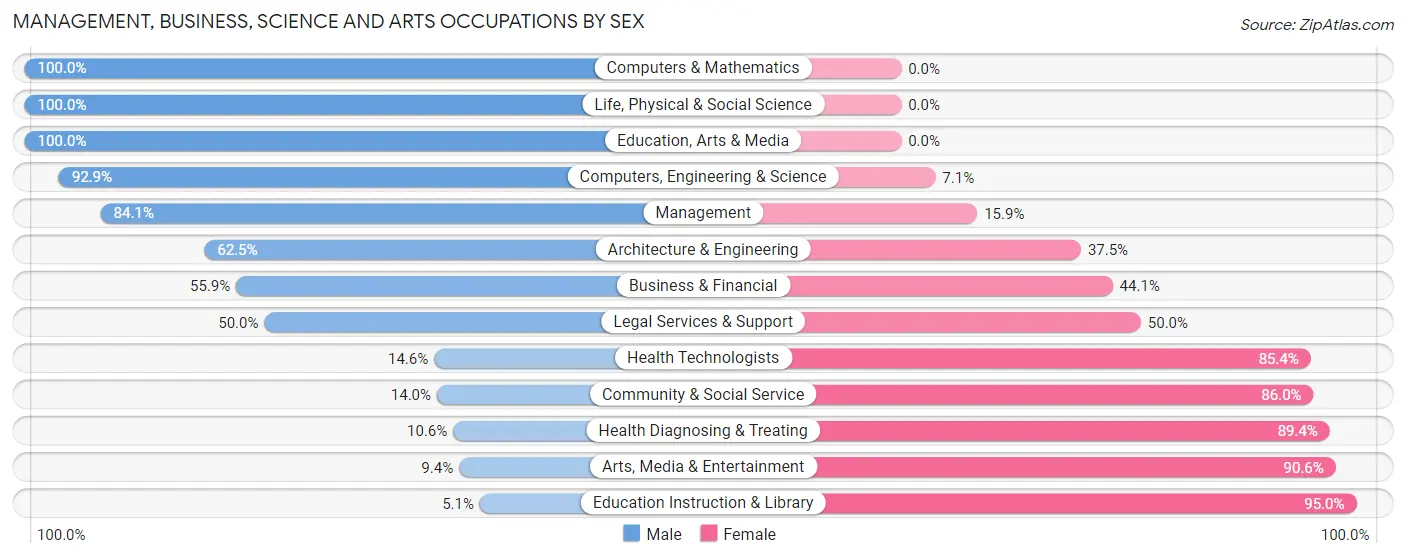
| Occupation | Male | Female |
| Management | 159 (84.1%) | 30 (15.9%) |
| Business & Financial | 19 (55.9%) | 15 (44.1%) |
| Computers, Engineering & Science | 39 (92.9%) | 3 (7.1%) |
| Computers & Mathematics | 16 (100.0%) | 0 (0.0%) |
| Architecture & Engineering | 5 (62.5%) | 3 (37.5%) |
| Life, Physical & Social Science | 18 (100.0%) | 0 (0.0%) |
| Community & Social Service | 21 (14.0%) | 129 (86.0%) |
| Education, Arts & Media | 7 (100.0%) | 0 (0.0%) |
| Legal Services & Support | 6 (50.0%) | 6 (50.0%) |
| Education Instruction & Library | 5 (5.1%) | 94 (95.0%) |
| Arts, Media & Entertainment | 3 (9.4%) | 29 (90.6%) |
| Health Diagnosing & Treating | 7 (10.6%) | 59 (89.4%) |
| Health Technologists | 7 (14.6%) | 41 (85.4%) |
| Total (Category) | 245 (50.9%) | 236 (49.1%) |
| Total (Overall) | 633 (57.3%) | 472 (42.7%) |
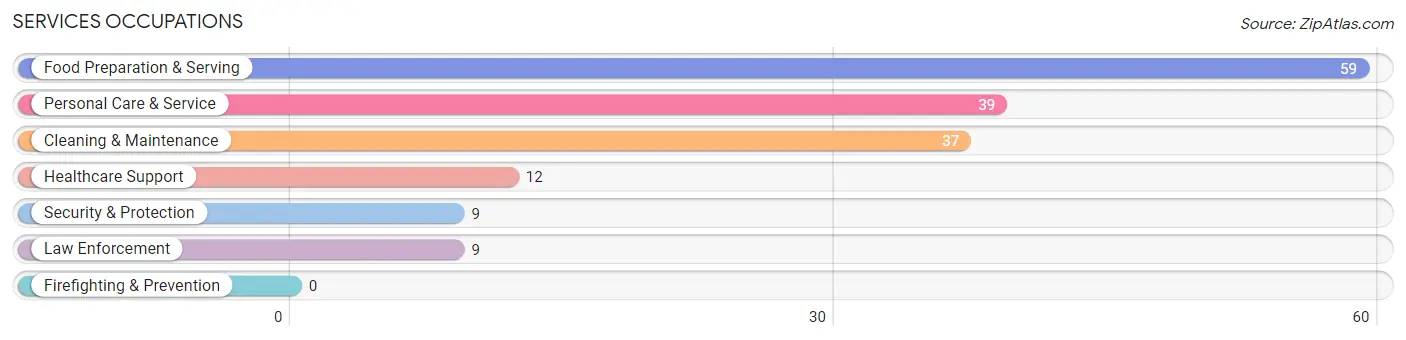
Services Occupations
The most common Services occupations in Eddy County are Food Preparation & Serving (59 | 5.3%), Personal Care & Service (39 | 3.5%), Cleaning & Maintenance (37 | 3.4%), Healthcare Support (12 | 1.1%), and Security & Protection (9 | 0.8%).
Services Occupations by Sex
Within the Services occupations in Eddy County, the most male-oriented occupations are Security & Protection (100.0%), Law Enforcement (100.0%), and Cleaning & Maintenance (54.0%), while the most female-oriented occupations are Healthcare Support (100.0%), Personal Care & Service (76.9%), and Food Preparation & Serving (57.6%).
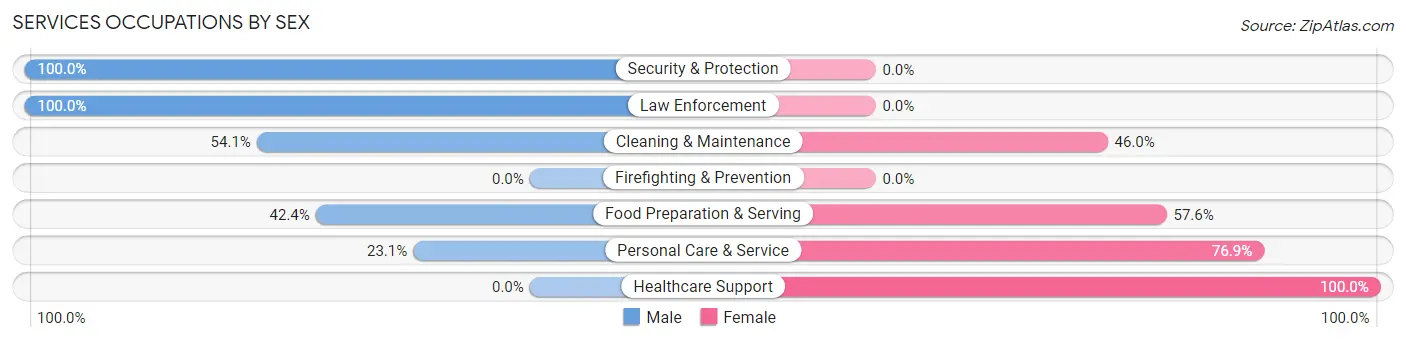
| Occupation | Male | Female |
| Healthcare Support | 0 (0.0%) | 12 (100.0%) |
| Security & Protection | 9 (100.0%) | 0 (0.0%) |
| Firefighting & Prevention | 0 (0.0%) | 0 (0.0%) |
| Law Enforcement | 9 (100.0%) | 0 (0.0%) |
| Food Preparation & Serving | 25 (42.4%) | 34 (57.6%) |
| Cleaning & Maintenance | 20 (54.0%) | 17 (46.0%) |
| Personal Care & Service | 9 (23.1%) | 30 (76.9%) |
| Total (Category) | 63 (40.4%) | 93 (59.6%) |
| Total (Overall) | 633 (57.3%) | 472 (42.7%) |
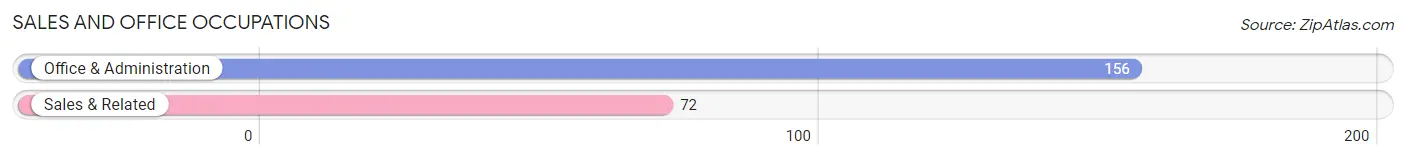
Sales and Office Occupations
The most common Sales and Office occupations in Eddy County are Office & Administration (156 | 14.1%), and Sales & Related (72 | 6.5%).
Sales and Office Occupations by Sex
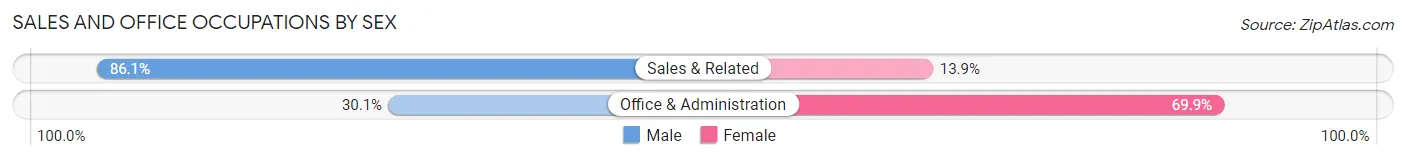
| Occupation | Male | Female |
| Sales & Related | 62 (86.1%) | 10 (13.9%) |
| Office & Administration | 47 (30.1%) | 109 (69.9%) |
| Total (Category) | 109 (47.8%) | 119 (52.2%) |
| Total (Overall) | 633 (57.3%) | 472 (42.7%) |
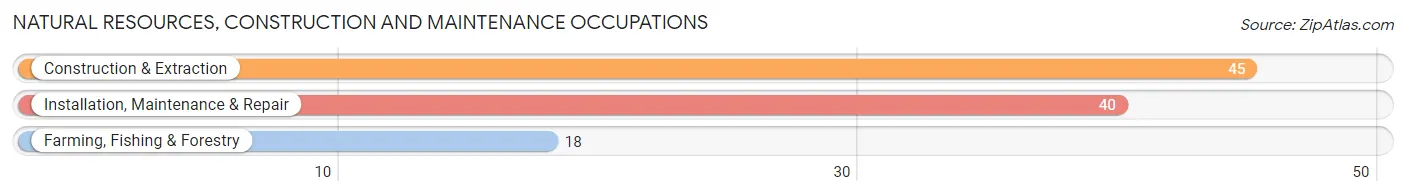
Natural Resources, Construction and Maintenance Occupations
The most common Natural Resources, Construction and Maintenance occupations in Eddy County are Construction & Extraction (45 | 4.1%), Installation, Maintenance & Repair (40 | 3.6%), and Farming, Fishing & Forestry (18 | 1.6%).
Natural Resources, Construction and Maintenance Occupations by Sex
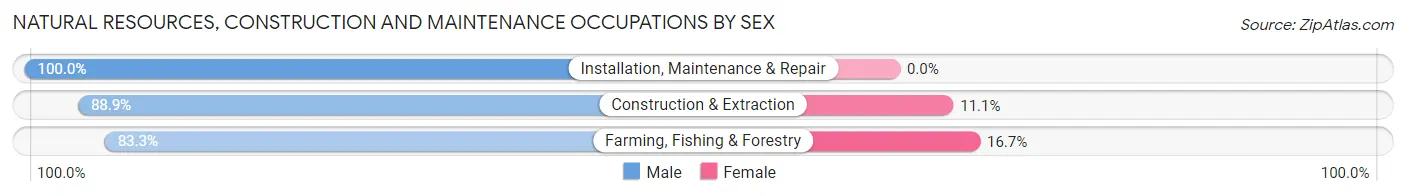
| Occupation | Male | Female |
| Farming, Fishing & Forestry | 15 (83.3%) | 3 (16.7%) |
| Construction & Extraction | 40 (88.9%) | 5 (11.1%) |
| Installation, Maintenance & Repair | 40 (100.0%) | 0 (0.0%) |
| Total (Category) | 95 (92.2%) | 8 (7.8%) |
| Total (Overall) | 633 (57.3%) | 472 (42.7%) |
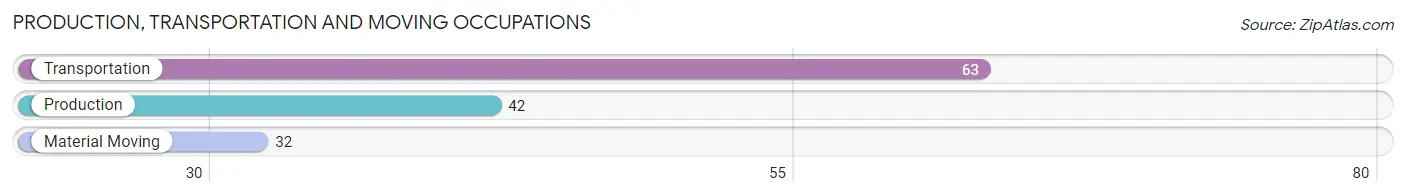
Production, Transportation and Moving Occupations
The most common Production, Transportation and Moving occupations in Eddy County are Transportation (63 | 5.7%), Production (42 | 3.8%), and Material Moving (32 | 2.9%).
Production, Transportation and Moving Occupations by Sex
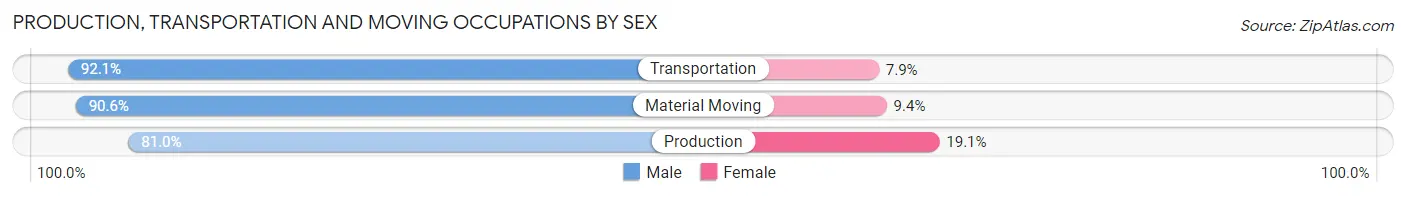
| Occupation | Male | Female |
| Production | 34 (80.9%) | 8 (19.1%) |
| Transportation | 58 (92.1%) | 5 (7.9%) |
| Material Moving | 29 (90.6%) | 3 (9.4%) |
| Total (Category) | 121 (88.3%) | 16 (11.7%) |
| Total (Overall) | 633 (57.3%) | 472 (42.7%) |
Employment Industries by Sex in Eddy County
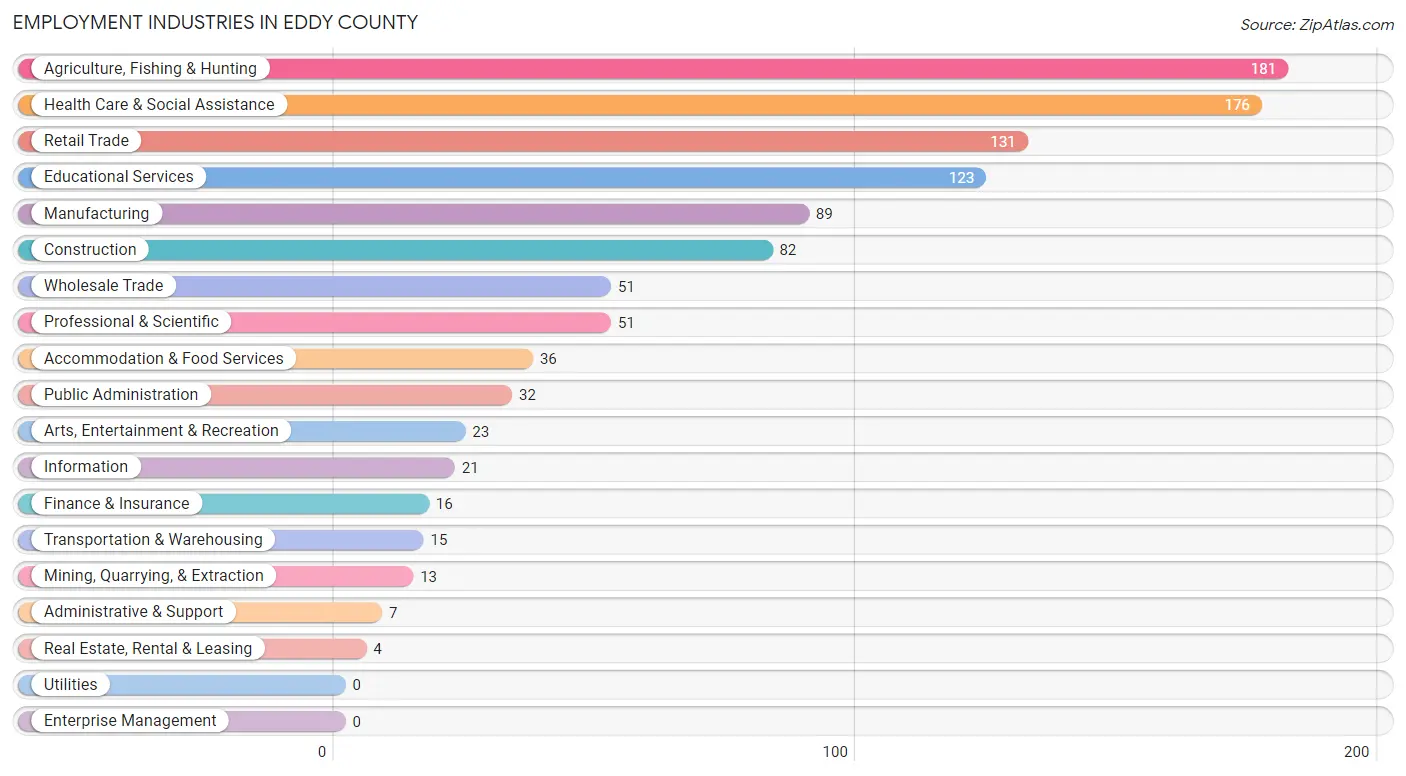
Employment Industries in Eddy County
The major employment industries in Eddy County include Agriculture, Fishing & Hunting (181 | 16.4%), Health Care & Social Assistance (176 | 15.9%), Retail Trade (131 | 11.9%), Educational Services (123 | 11.1%), and Manufacturing (89 | 8.1%).
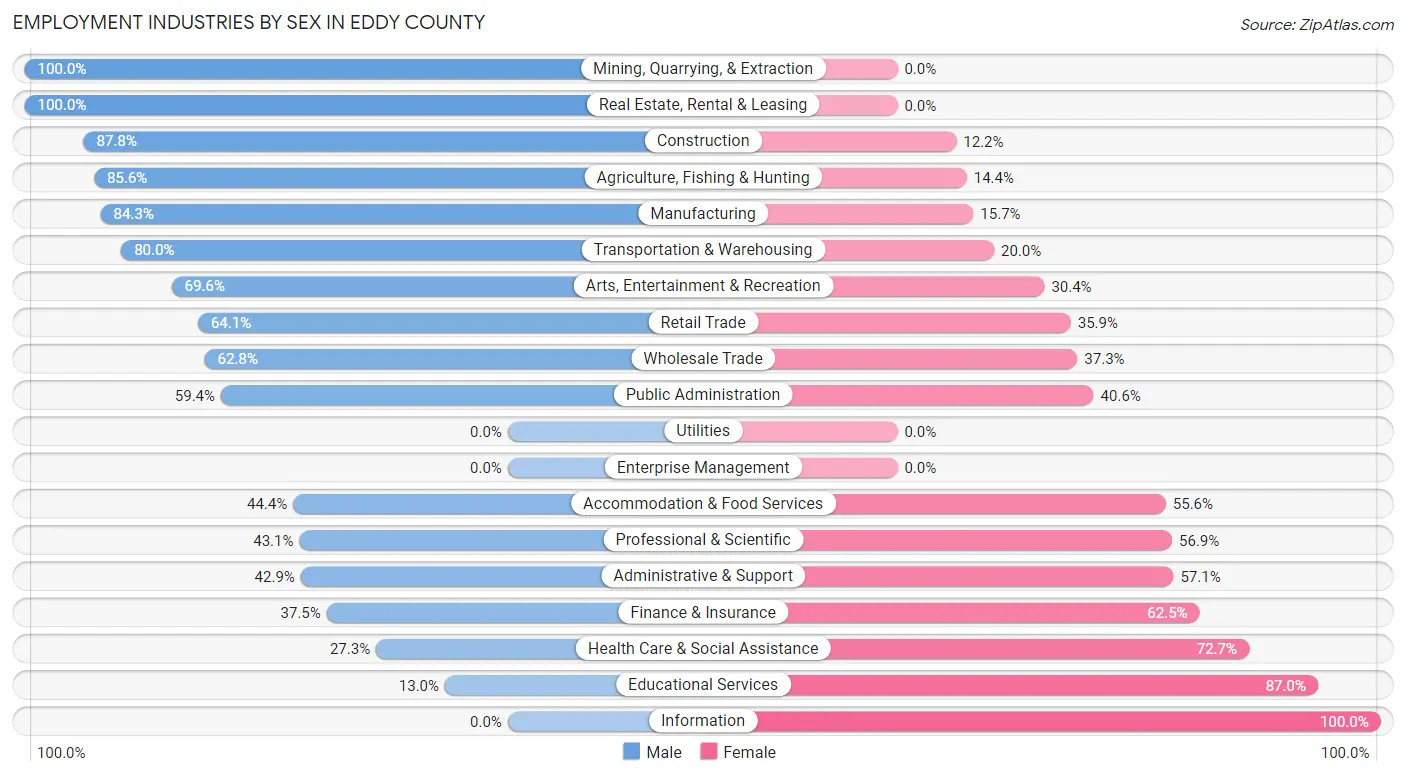
Employment Industries by Sex in Eddy County
The Eddy County industries that see more men than women are Mining, Quarrying, & Extraction (100.0%), Real Estate, Rental & Leasing (100.0%), and Construction (87.8%), whereas the industries that tend to have a higher number of women are Information (100.0%), Educational Services (87.0%), and Health Care & Social Assistance (72.7%).
| Industry | Male | Female |
| Agriculture, Fishing & Hunting | 155 (85.6%) | 26 (14.4%) |
| Mining, Quarrying, & Extraction | 13 (100.0%) | 0 (0.0%) |
| Construction | 72 (87.8%) | 10 (12.2%) |
| Manufacturing | 75 (84.3%) | 14 (15.7%) |
| Wholesale Trade | 32 (62.7%) | 19 (37.2%) |
| Retail Trade | 84 (64.1%) | 47 (35.9%) |
| Transportation & Warehousing | 12 (80.0%) | 3 (20.0%) |
| Utilities | 0 (0.0%) | 0 (0.0%) |
| Information | 0 (0.0%) | 21 (100.0%) |
| Finance & Insurance | 6 (37.5%) | 10 (62.5%) |
| Real Estate, Rental & Leasing | 4 (100.0%) | 0 (0.0%) |
| Professional & Scientific | 22 (43.1%) | 29 (56.9%) |
| Enterprise Management | 0 (0.0%) | 0 (0.0%) |
| Administrative & Support | 3 (42.9%) | 4 (57.1%) |
| Educational Services | 16 (13.0%) | 107 (87.0%) |
| Health Care & Social Assistance | 48 (27.3%) | 128 (72.7%) |
| Arts, Entertainment & Recreation | 16 (69.6%) | 7 (30.4%) |
| Accommodation & Food Services | 16 (44.4%) | 20 (55.6%) |
| Public Administration | 19 (59.4%) | 13 (40.6%) |
| Total | 633 (57.3%) | 472 (42.7%) |
Education in Eddy County
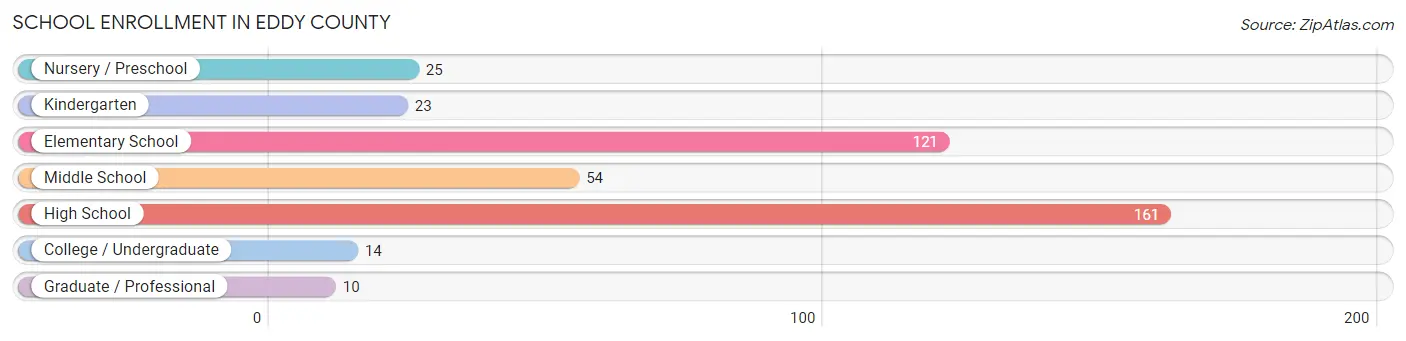
School Enrollment in Eddy County
The most common levels of schooling among the 408 students in Eddy County are high school (161 | 39.5%), elementary school (121 | 29.7%), and middle school (54 | 13.2%).
| School Level | # Students | % Students |
| Nursery / Preschool | 25 | 6.1% |
| Kindergarten | 23 | 5.6% |
| Elementary School | 121 | 29.7% |
| Middle School | 54 | 13.2% |
| High School | 161 | 39.5% |
| College / Undergraduate | 14 | 3.4% |
| Graduate / Professional | 10 | 2.5% |
| Total | 408 | 100.0% |
School Enrollment by Age by Funding Source in Eddy County
Out of a total of 408 students who are enrolled in schools in Eddy County, 31 (7.6%) attend a private institution, while the remaining 377 (92.4%) are enrolled in public schools. The age group of 20 to 24 year olds has the highest likelihood of being enrolled in private schools, with 4 (100.0% in the age bracket) enrolled. Conversely, the age group of 3 to 4 year olds has the lowest likelihood of being enrolled in a private school, with 5 (100.0% in the age bracket) attending a public institution.
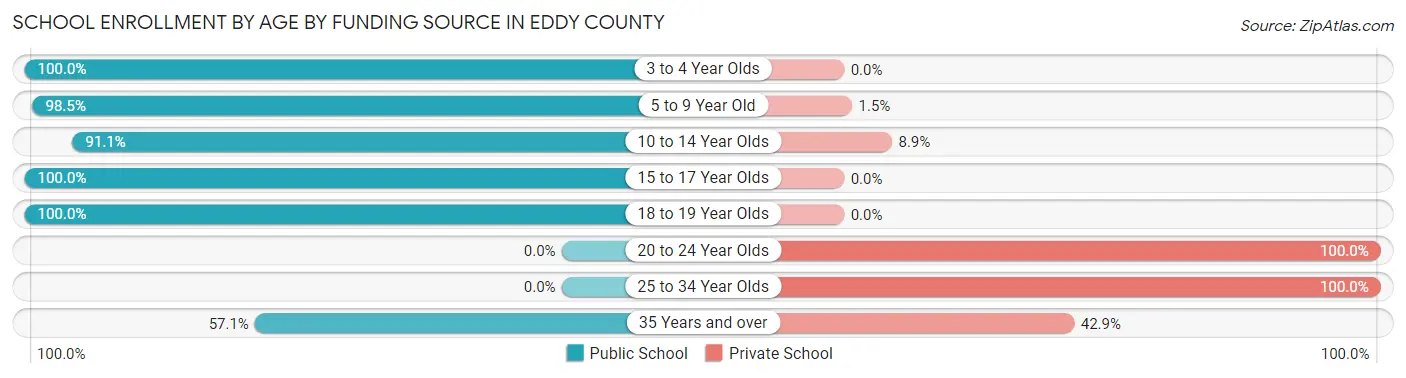
| Age Bracket | Public School | Private School |
| 3 to 4 Year Olds | 5 (100.0%) | 0 (0.0%) |
| 5 to 9 Year Old | 133 (98.5%) | 2 (1.5%) |
| 10 to 14 Year Olds | 92 (91.1%) | 9 (8.9%) |
| 15 to 17 Year Olds | 119 (100.0%) | 0 (0.0%) |
| 18 to 19 Year Olds | 20 (100.0%) | 0 (0.0%) |
| 20 to 24 Year Olds | 0 (0.0%) | 4 (100.0%) |
| 25 to 34 Year Olds | 0 (0.0%) | 10 (100.0%) |
| 35 Years and over | 8 (57.1%) | 6 (42.9%) |
| Total | 377 (92.4%) | 31 (7.6%) |
Educational Attainment by Field of Study in Eddy County
Education (139 | 26.1%), business (76 | 14.3%), bio, nature & agricultural (73 | 13.7%), science & technology (66 | 12.4%), and social sciences (38 | 7.1%) are the most common fields of study among 532 individuals in Eddy County who have obtained a bachelor's degree or higher.
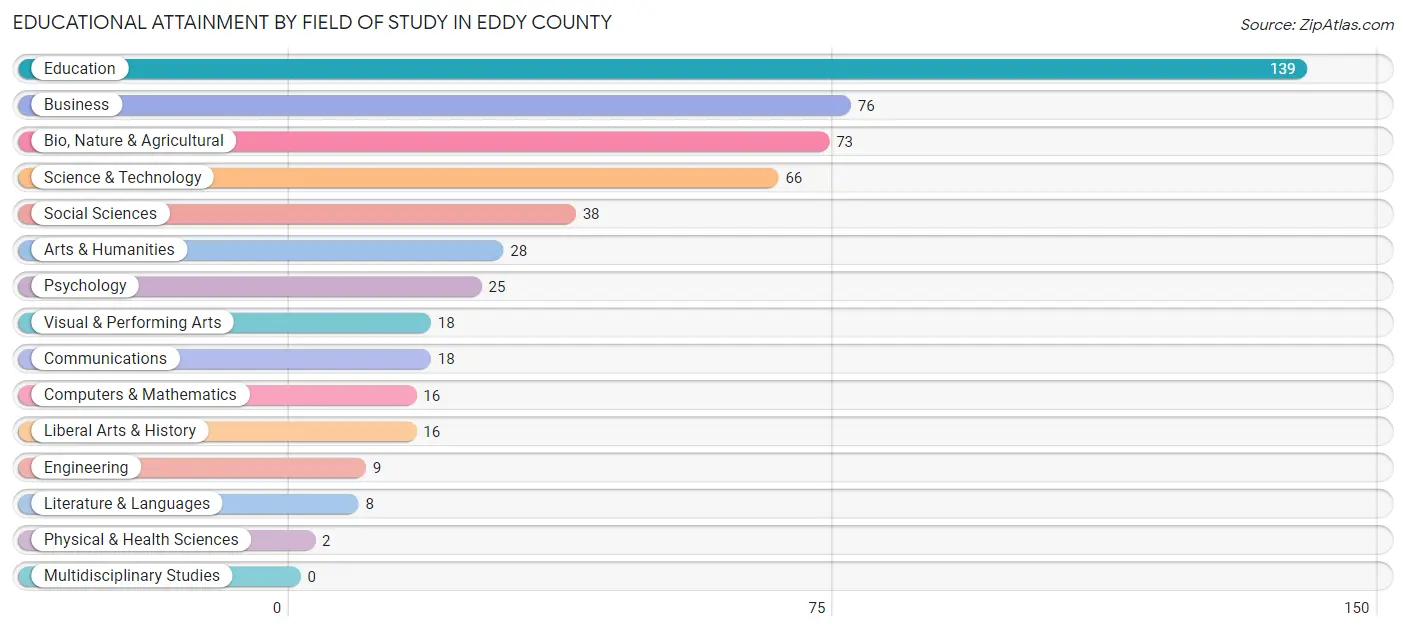
| Field of Study | # Graduates | % Graduates |
| Computers & Mathematics | 16 | 3.0% |
| Bio, Nature & Agricultural | 73 | 13.7% |
| Physical & Health Sciences | 2 | 0.4% |
| Psychology | 25 | 4.7% |
| Social Sciences | 38 | 7.1% |
| Engineering | 9 | 1.7% |
| Multidisciplinary Studies | 0 | 0.0% |
| Science & Technology | 66 | 12.4% |
| Business | 76 | 14.3% |
| Education | 139 | 26.1% |
| Literature & Languages | 8 | 1.5% |
| Liberal Arts & History | 16 | 3.0% |
| Visual & Performing Arts | 18 | 3.4% |
| Communications | 18 | 3.4% |
| Arts & Humanities | 28 | 5.3% |
| Total | 532 | 100.0% |
Transportation & Commute in Eddy County
Vehicle Availability by Sex in Eddy County
The most prevalent vehicle ownership categories in Eddy County are males with 2 vehicles (183, accounting for 29.1%) and females with 2 vehicles (104, making up 39.2%).
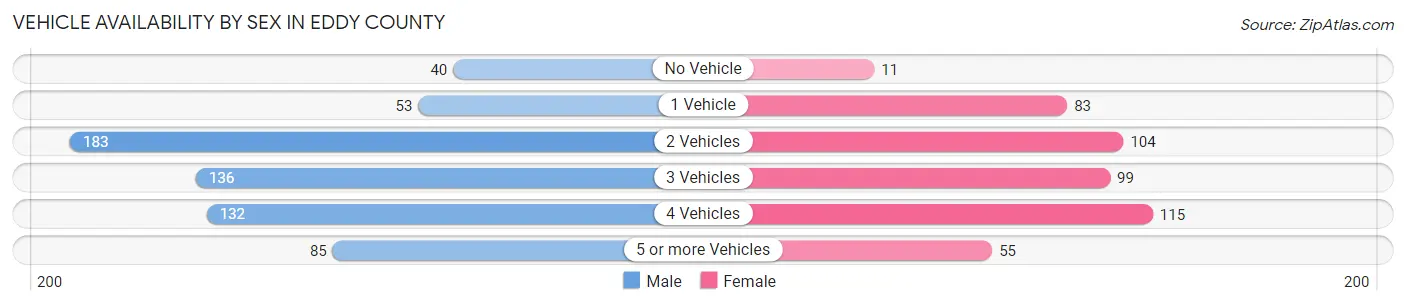
| Vehicles Available | Male | Female |
| No Vehicle | 40 (6.4%) | 11 (2.4%) |
| 1 Vehicle | 53 (8.4%) | 83 (17.8%) |
| 2 Vehicles | 183 (29.1%) | 104 (22.3%) |
| 3 Vehicles | 136 (21.6%) | 99 (21.2%) |
| 4 Vehicles | 132 (21.0%) | 115 (24.6%) |
| 5 or more Vehicles | 85 (13.5%) | 55 (11.8%) |
| Total | 629 (100.0%) | 467 (100.0%) |
Commute Time in Eddy County
The most frequently occuring commute durations in Eddy County are less than 5 minutes (271 commuters, 26.3%), 5 to 9 minutes (206 commuters, 20.0%), and 10 to 14 minutes (161 commuters, 15.6%).
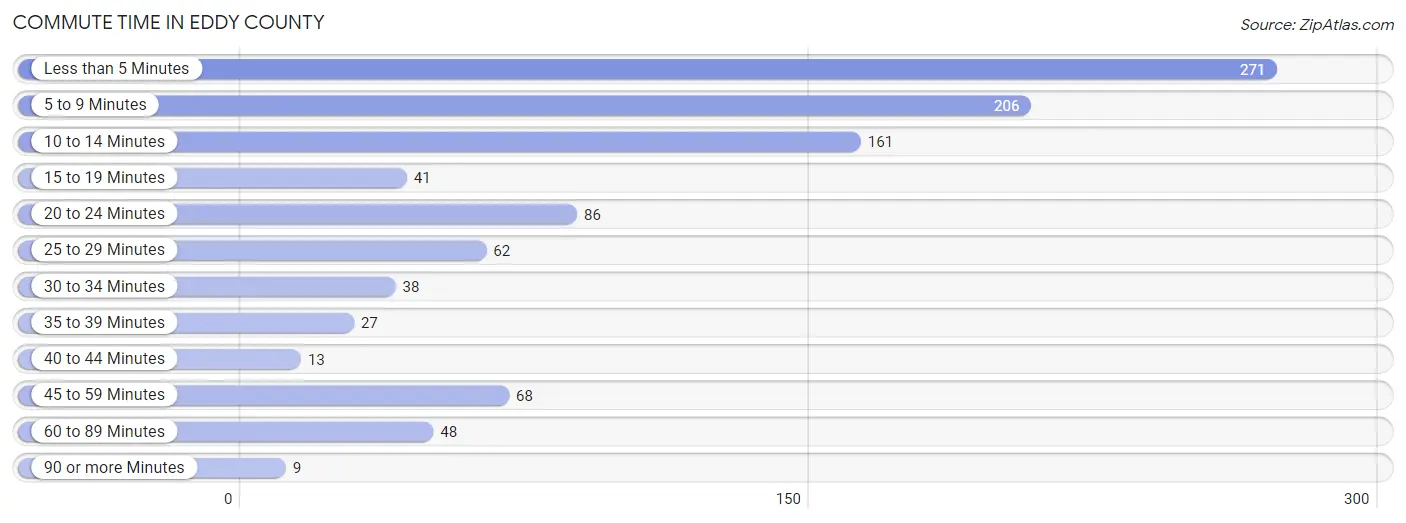
| Commute Time | # Commuters | % Commuters |
| Less than 5 Minutes | 271 | 26.3% |
| 5 to 9 Minutes | 206 | 20.0% |
| 10 to 14 Minutes | 161 | 15.6% |
| 15 to 19 Minutes | 41 | 4.0% |
| 20 to 24 Minutes | 86 | 8.4% |
| 25 to 29 Minutes | 62 | 6.0% |
| 30 to 34 Minutes | 38 | 3.7% |
| 35 to 39 Minutes | 27 | 2.6% |
| 40 to 44 Minutes | 13 | 1.3% |
| 45 to 59 Minutes | 68 | 6.6% |
| 60 to 89 Minutes | 48 | 4.7% |
| 90 or more Minutes | 9 | 0.9% |
Commute Time by Sex in Eddy County
The most common commute times in Eddy County are less than 5 minutes (138 commuters, 23.6%) for males and less than 5 minutes (133 commuters, 29.9%) for females.
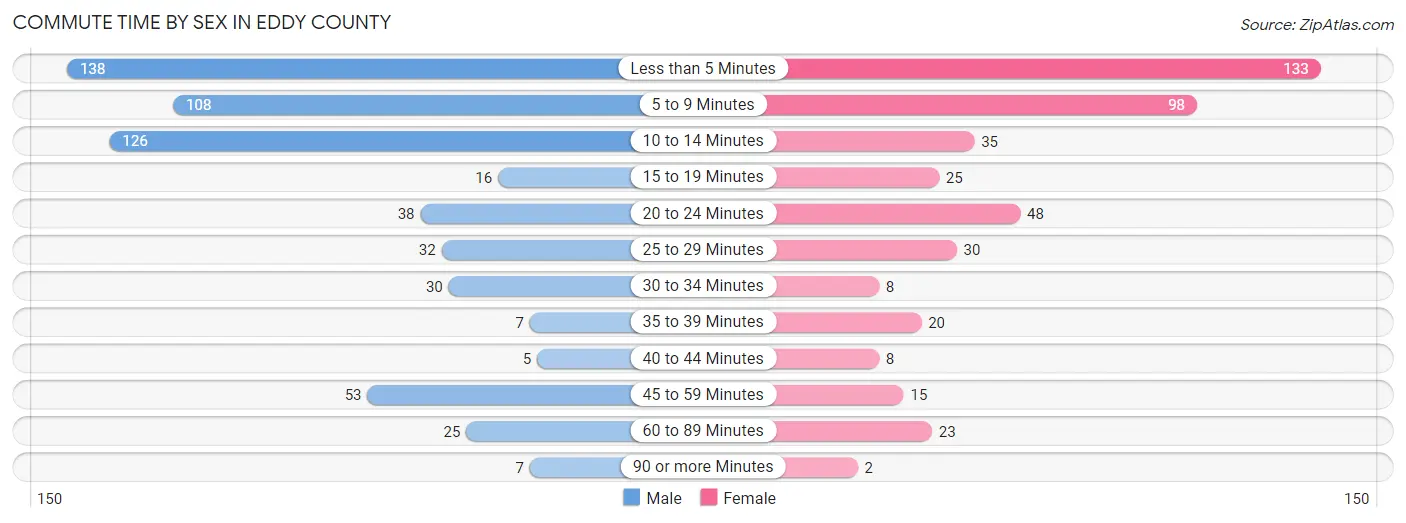
| Commute Time | Male | Female |
| Less than 5 Minutes | 138 (23.6%) | 133 (29.9%) |
| 5 to 9 Minutes | 108 (18.5%) | 98 (22.0%) |
| 10 to 14 Minutes | 126 (21.5%) | 35 (7.9%) |
| 15 to 19 Minutes | 16 (2.7%) | 25 (5.6%) |
| 20 to 24 Minutes | 38 (6.5%) | 48 (10.8%) |
| 25 to 29 Minutes | 32 (5.5%) | 30 (6.7%) |
| 30 to 34 Minutes | 30 (5.1%) | 8 (1.8%) |
| 35 to 39 Minutes | 7 (1.2%) | 20 (4.5%) |
| 40 to 44 Minutes | 5 (0.9%) | 8 (1.8%) |
| 45 to 59 Minutes | 53 (9.1%) | 15 (3.4%) |
| 60 to 89 Minutes | 25 (4.3%) | 23 (5.2%) |
| 90 or more Minutes | 7 (1.2%) | 2 (0.4%) |
Time of Departure to Work by Sex in Eddy County
The most frequent times of departure to work in Eddy County are 7:00 AM to 7:29 AM (112, 19.2%) for males and 7:30 AM to 7:59 AM (124, 27.9%) for females.
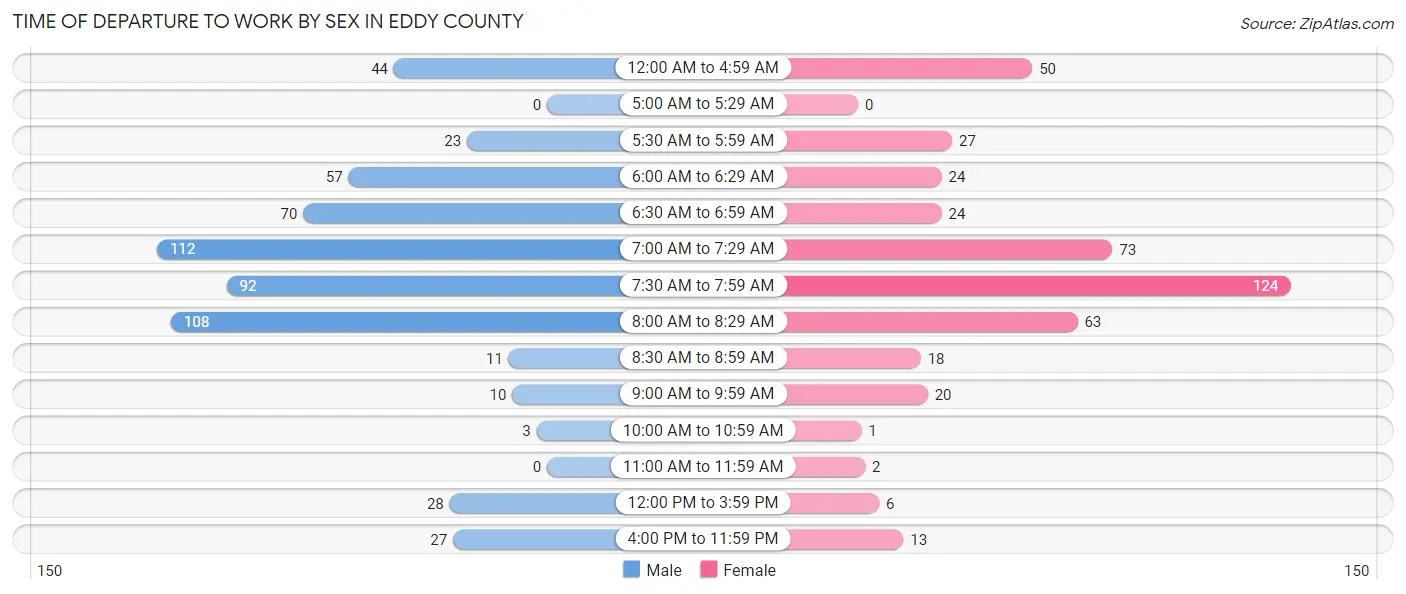
| Time of Departure | Male | Female |
| 12:00 AM to 4:59 AM | 44 (7.5%) | 50 (11.2%) |
| 5:00 AM to 5:29 AM | 0 (0.0%) | 0 (0.0%) |
| 5:30 AM to 5:59 AM | 23 (3.9%) | 27 (6.1%) |
| 6:00 AM to 6:29 AM | 57 (9.7%) | 24 (5.4%) |
| 6:30 AM to 6:59 AM | 70 (12.0%) | 24 (5.4%) |
| 7:00 AM to 7:29 AM | 112 (19.2%) | 73 (16.4%) |
| 7:30 AM to 7:59 AM | 92 (15.7%) | 124 (27.9%) |
| 8:00 AM to 8:29 AM | 108 (18.5%) | 63 (14.2%) |
| 8:30 AM to 8:59 AM | 11 (1.9%) | 18 (4.0%) |
| 9:00 AM to 9:59 AM | 10 (1.7%) | 20 (4.5%) |
| 10:00 AM to 10:59 AM | 3 (0.5%) | 1 (0.2%) |
| 11:00 AM to 11:59 AM | 0 (0.0%) | 2 (0.4%) |
| 12:00 PM to 3:59 PM | 28 (4.8%) | 6 (1.3%) |
| 4:00 PM to 11:59 PM | 27 (4.6%) | 13 (2.9%) |
| Total | 585 (100.0%) | 445 (100.0%) |
Housing Occupancy in Eddy County
Occupancy by Ownership in Eddy County
Of the total 1,077 dwellings in Eddy County, owner-occupied units account for 748 (69.5%), while renter-occupied units make up 329 (30.5%).
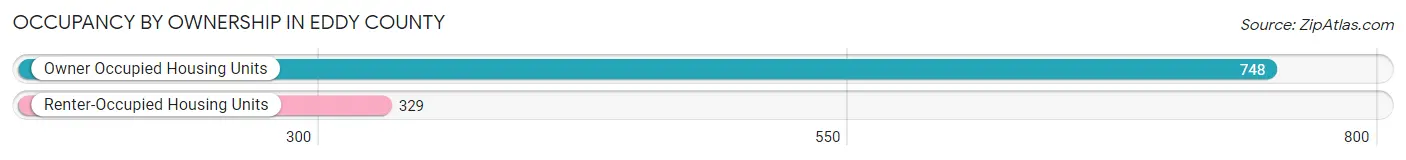
| Occupancy | # Housing Units | % Housing Units |
| Owner Occupied Housing Units | 748 | 69.5% |
| Renter-Occupied Housing Units | 329 | 30.5% |
| Total Occupied Housing Units | 1,077 | 100.0% |
Occupancy by Household Size in Eddy County
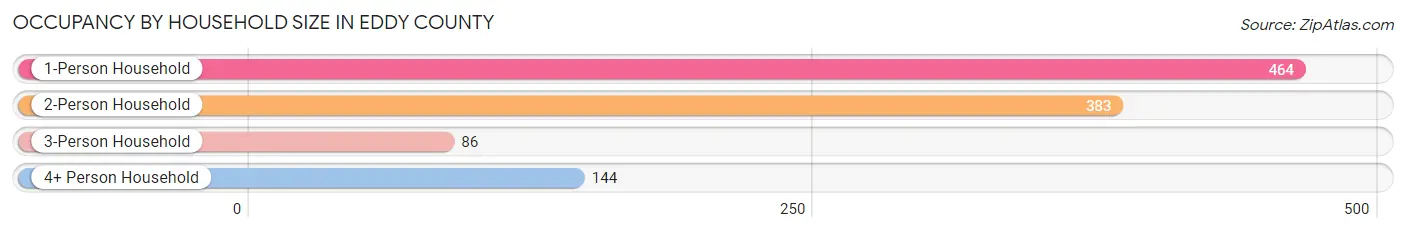
| Household Size | # Housing Units | % Housing Units |
| 1-Person Household | 464 | 43.1% |
| 2-Person Household | 383 | 35.6% |
| 3-Person Household | 86 | 8.0% |
| 4+ Person Household | 144 | 13.4% |
| Total Housing Units | 1,077 | 100.0% |
Occupancy by Ownership by Household Size in Eddy County
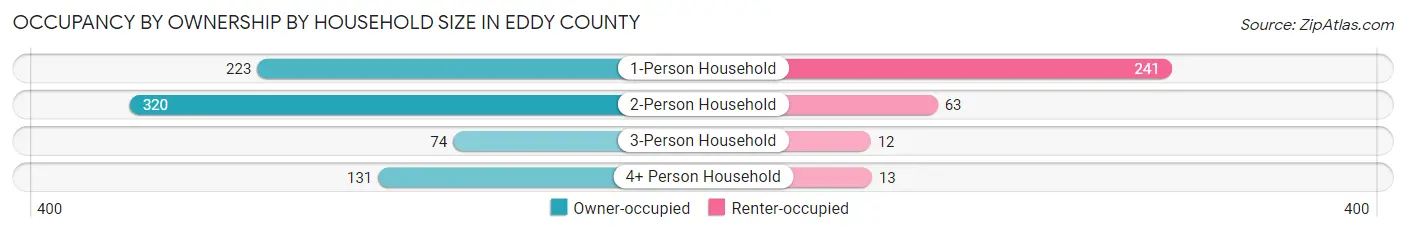
| Household Size | Owner-occupied | Renter-occupied |
| 1-Person Household | 223 (48.1%) | 241 (51.9%) |
| 2-Person Household | 320 (83.6%) | 63 (16.5%) |
| 3-Person Household | 74 (86.1%) | 12 (14.0%) |
| 4+ Person Household | 131 (91.0%) | 13 (9.0%) |
| Total Housing Units | 748 (69.5%) | 329 (30.5%) |
Occupancy by Educational Attainment in Eddy County
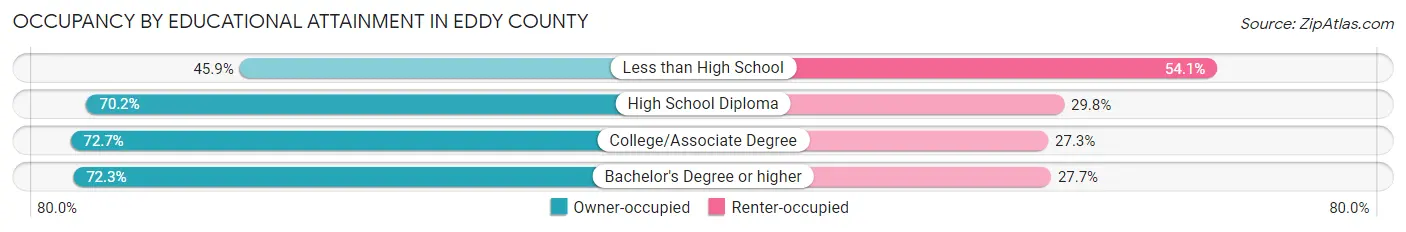
| Household Size | Owner-occupied | Renter-occupied |
| Less than High School | 45 (45.9%) | 53 (54.1%) |
| High School Diploma | 212 (70.2%) | 90 (29.8%) |
| College/Associate Degree | 272 (72.7%) | 102 (27.3%) |
| Bachelor's Degree or higher | 219 (72.3%) | 84 (27.7%) |
Occupancy by Age of Householder in Eddy County
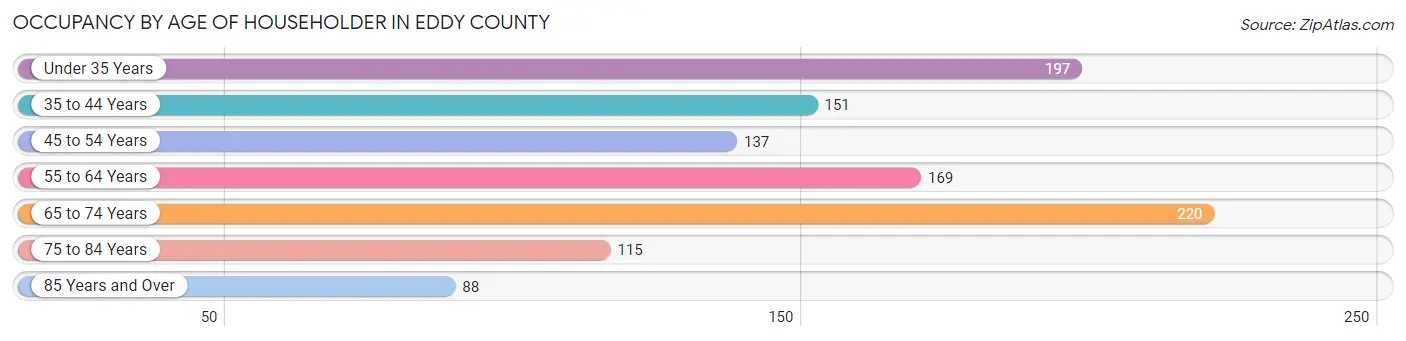
| Age Bracket | # Households | % Households |
| Under 35 Years | 197 | 18.3% |
| 35 to 44 Years | 151 | 14.0% |
| 45 to 54 Years | 137 | 12.7% |
| 55 to 64 Years | 169 | 15.7% |
| 65 to 74 Years | 220 | 20.4% |
| 75 to 84 Years | 115 | 10.7% |
| 85 Years and Over | 88 | 8.2% |
| Total | 1,077 | 100.0% |
Housing Finances in Eddy County
Median Income by Occupancy in Eddy County
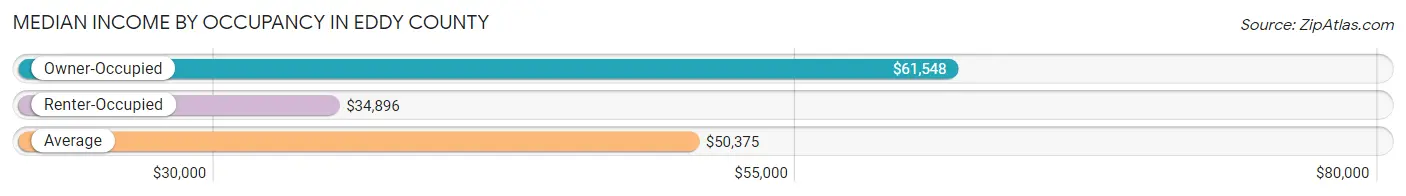
| Occupancy Type | # Households | Median Income |
| Owner-Occupied | 748 (69.5%) | $61,548 |
| Renter-Occupied | 329 (30.5%) | $34,896 |
| Average | 1,077 (100.0%) | $50,375 |
Occupancy by Householder Income Bracket in Eddy County
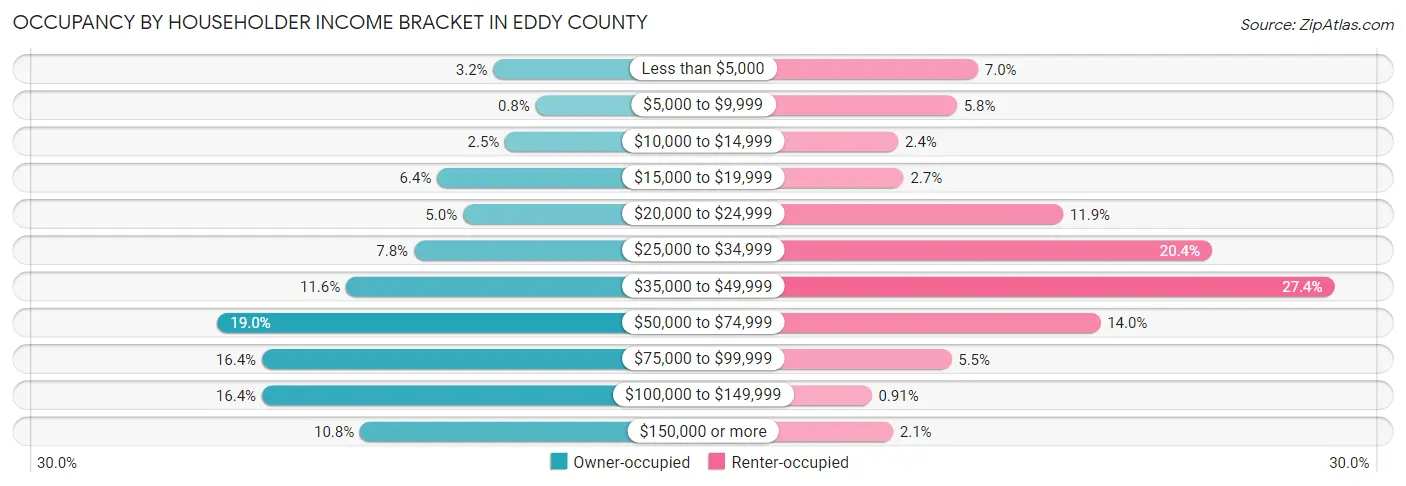
| Income Bracket | Owner-occupied | Renter-occupied |
| Less than $5,000 | 24 (3.2%) | 23 (7.0%) |
| $5,000 to $9,999 | 6 (0.8%) | 19 (5.8%) |
| $10,000 to $14,999 | 19 (2.5%) | 8 (2.4%) |
| $15,000 to $19,999 | 48 (6.4%) | 9 (2.7%) |
| $20,000 to $24,999 | 37 (5.0%) | 39 (11.8%) |
| $25,000 to $34,999 | 58 (7.7%) | 67 (20.4%) |
| $35,000 to $49,999 | 87 (11.6%) | 90 (27.4%) |
| $50,000 to $74,999 | 142 (19.0%) | 46 (14.0%) |
| $75,000 to $99,999 | 123 (16.4%) | 18 (5.5%) |
| $100,000 to $149,999 | 123 (16.4%) | 3 (0.9%) |
| $150,000 or more | 81 (10.8%) | 7 (2.1%) |
| Total | 748 (100.0%) | 329 (100.0%) |
Monthly Housing Cost Tiers in Eddy County
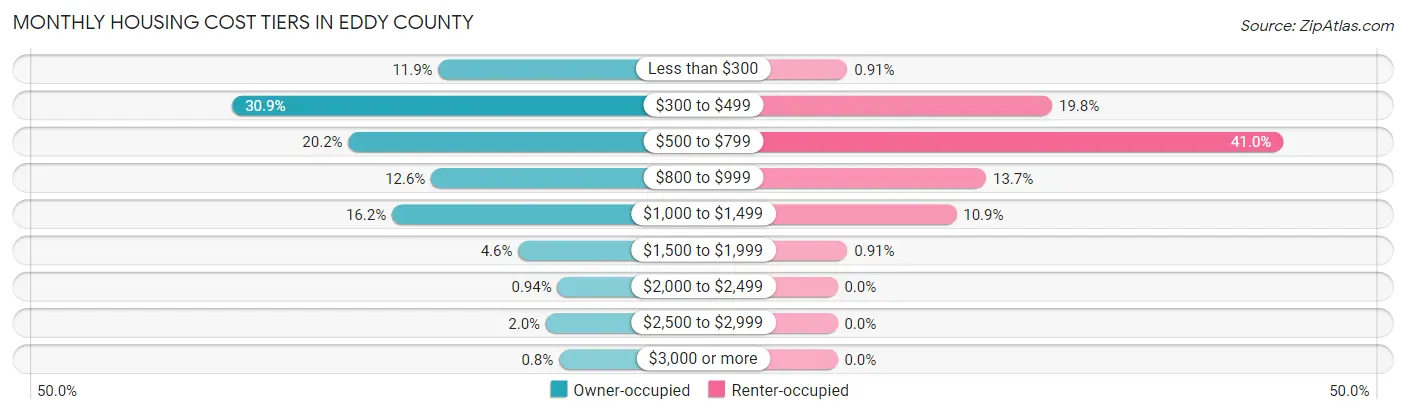
| Monthly Cost | Owner-occupied | Renter-occupied |
| Less than $300 | 89 (11.9%) | 3 (0.9%) |
| $300 to $499 | 231 (30.9%) | 65 (19.8%) |
| $500 to $799 | 151 (20.2%) | 135 (41.0%) |
| $800 to $999 | 94 (12.6%) | 45 (13.7%) |
| $1,000 to $1,499 | 121 (16.2%) | 36 (10.9%) |
| $1,500 to $1,999 | 34 (4.5%) | 3 (0.9%) |
| $2,000 to $2,499 | 7 (0.9%) | 0 (0.0%) |
| $2,500 to $2,999 | 15 (2.0%) | 0 (0.0%) |
| $3,000 or more | 6 (0.8%) | 0 (0.0%) |
| Total | 748 (100.0%) | 329 (100.0%) |
Physical Housing Characteristics in Eddy County
Housing Structures in Eddy County
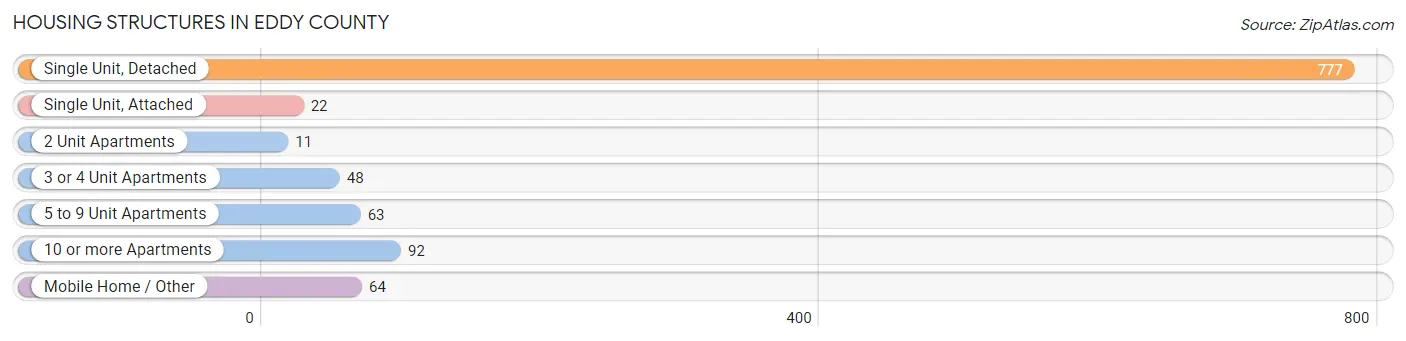
| Structure Type | # Housing Units | % Housing Units |
| Single Unit, Detached | 777 | 72.1% |
| Single Unit, Attached | 22 | 2.0% |
| 2 Unit Apartments | 11 | 1.0% |
| 3 or 4 Unit Apartments | 48 | 4.5% |
| 5 to 9 Unit Apartments | 63 | 5.9% |
| 10 or more Apartments | 92 | 8.5% |
| Mobile Home / Other | 64 | 5.9% |
| Total | 1,077 | 100.0% |
Housing Structures by Occupancy in Eddy County
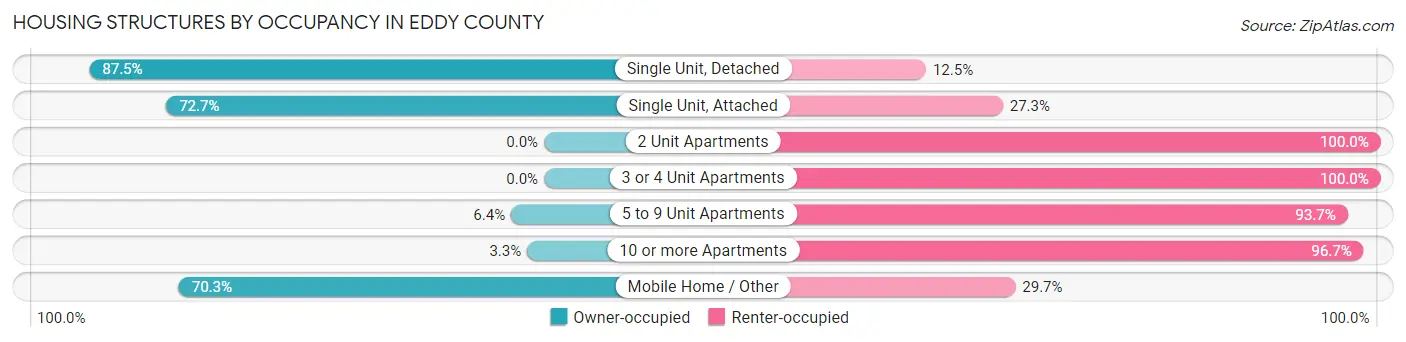
| Structure Type | Owner-occupied | Renter-occupied |
| Single Unit, Detached | 680 (87.5%) | 97 (12.5%) |
| Single Unit, Attached | 16 (72.7%) | 6 (27.3%) |
| 2 Unit Apartments | 0 (0.0%) | 11 (100.0%) |
| 3 or 4 Unit Apartments | 0 (0.0%) | 48 (100.0%) |
| 5 to 9 Unit Apartments | 4 (6.4%) | 59 (93.6%) |
| 10 or more Apartments | 3 (3.3%) | 89 (96.7%) |
| Mobile Home / Other | 45 (70.3%) | 19 (29.7%) |
| Total | 748 (69.5%) | 329 (30.5%) |
Housing Structures by Number of Rooms in Eddy County
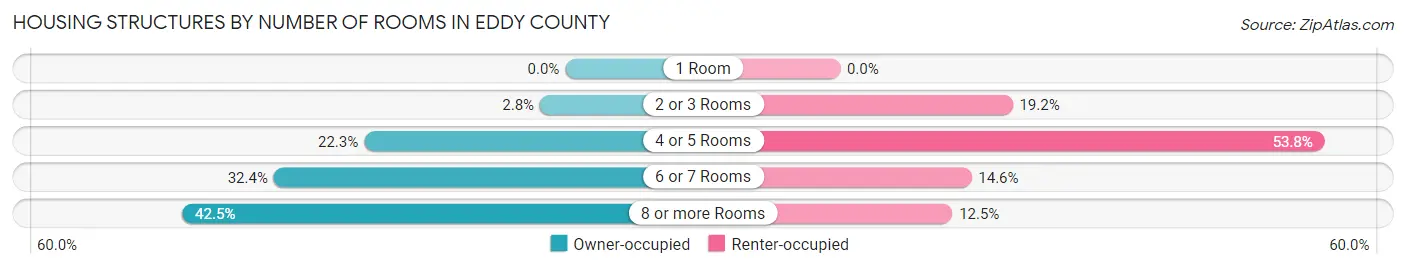
| Number of Rooms | Owner-occupied | Renter-occupied |
| 1 Room | 0 (0.0%) | 0 (0.0%) |
| 2 or 3 Rooms | 21 (2.8%) | 63 (19.2%) |
| 4 or 5 Rooms | 167 (22.3%) | 177 (53.8%) |
| 6 or 7 Rooms | 242 (32.4%) | 48 (14.6%) |
| 8 or more Rooms | 318 (42.5%) | 41 (12.5%) |
| Total | 748 (100.0%) | 329 (100.0%) |
Housing Structure by Heating Type in Eddy County
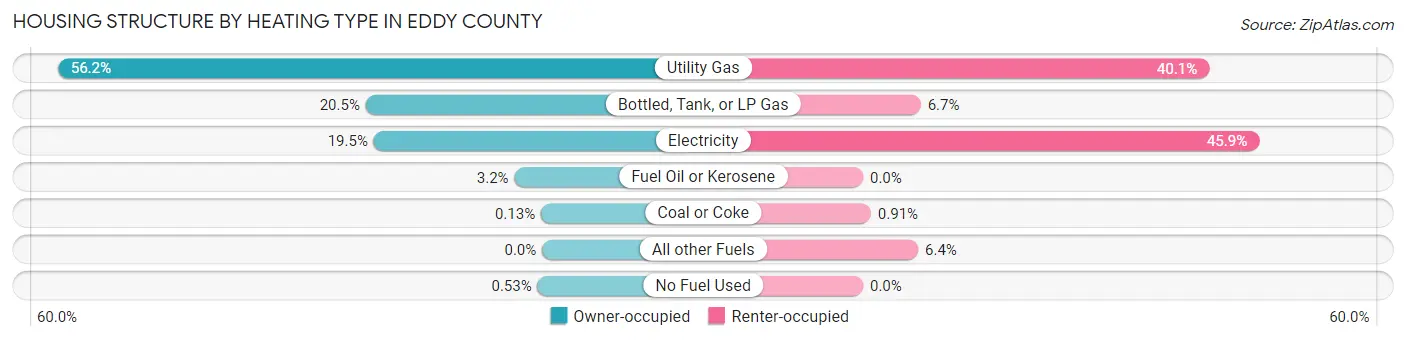
| Heating Type | Owner-occupied | Renter-occupied |
| Utility Gas | 420 (56.1%) | 132 (40.1%) |
| Bottled, Tank, or LP Gas | 153 (20.4%) | 22 (6.7%) |
| Electricity | 146 (19.5%) | 151 (45.9%) |
| Fuel Oil or Kerosene | 24 (3.2%) | 0 (0.0%) |
| Coal or Coke | 1 (0.1%) | 3 (0.9%) |
| All other Fuels | 0 (0.0%) | 21 (6.4%) |
| No Fuel Used | 4 (0.5%) | 0 (0.0%) |
| Total | 748 (100.0%) | 329 (100.0%) |
Household Vehicle Usage in Eddy County
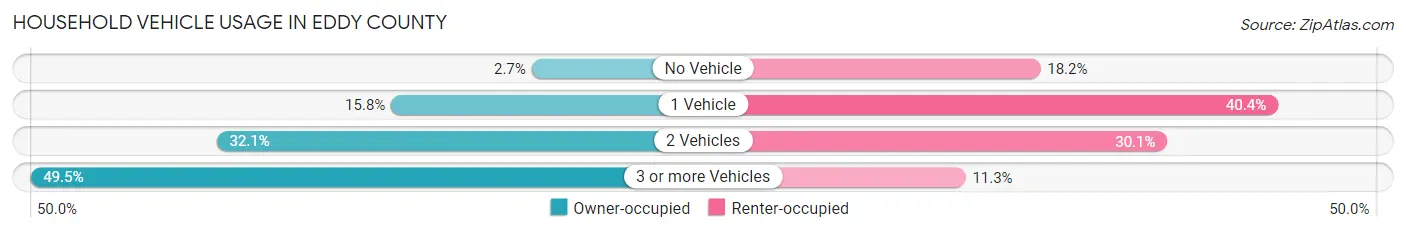
| Vehicles per Household | Owner-occupied | Renter-occupied |
| No Vehicle | 20 (2.7%) | 60 (18.2%) |
| 1 Vehicle | 118 (15.8%) | 133 (40.4%) |
| 2 Vehicles | 240 (32.1%) | 99 (30.1%) |
| 3 or more Vehicles | 370 (49.5%) | 37 (11.3%) |
| Total | 748 (100.0%) | 329 (100.0%) |
Real Estate & Mortgages in Eddy County
Real Estate and Mortgage Overview in Eddy County
| Characteristic | Without Mortgage | With Mortgage |
| Housing Units | 478 | 270 |
| Median Property Value | $110,900 | $99,500 |
| Median Household Income | $54,537 | $30 |
| Monthly Housing Costs | $446 | $6 |
| Real Estate Taxes | $862 | $21 |
Property Value by Mortgage Status in Eddy County
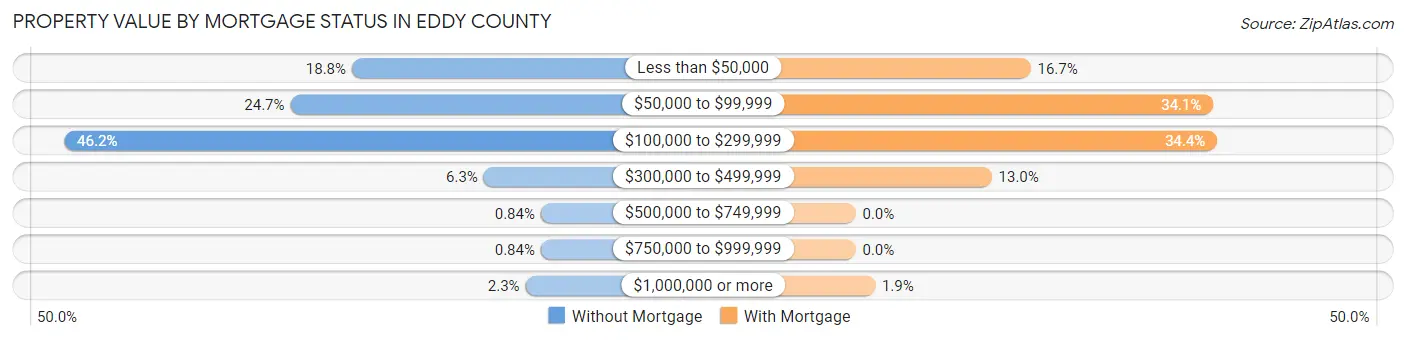
| Property Value | Without Mortgage | With Mortgage |
| Less than $50,000 | 90 (18.8%) | 45 (16.7%) |
| $50,000 to $99,999 | 118 (24.7%) | 92 (34.1%) |
| $100,000 to $299,999 | 221 (46.2%) | 93 (34.4%) |
| $300,000 to $499,999 | 30 (6.3%) | 35 (13.0%) |
| $500,000 to $749,999 | 4 (0.8%) | 0 (0.0%) |
| $750,000 to $999,999 | 4 (0.8%) | 0 (0.0%) |
| $1,000,000 or more | 11 (2.3%) | 5 (1.8%) |
| Total | 478 (100.0%) | 270 (100.0%) |
Household Income by Mortgage Status in Eddy County
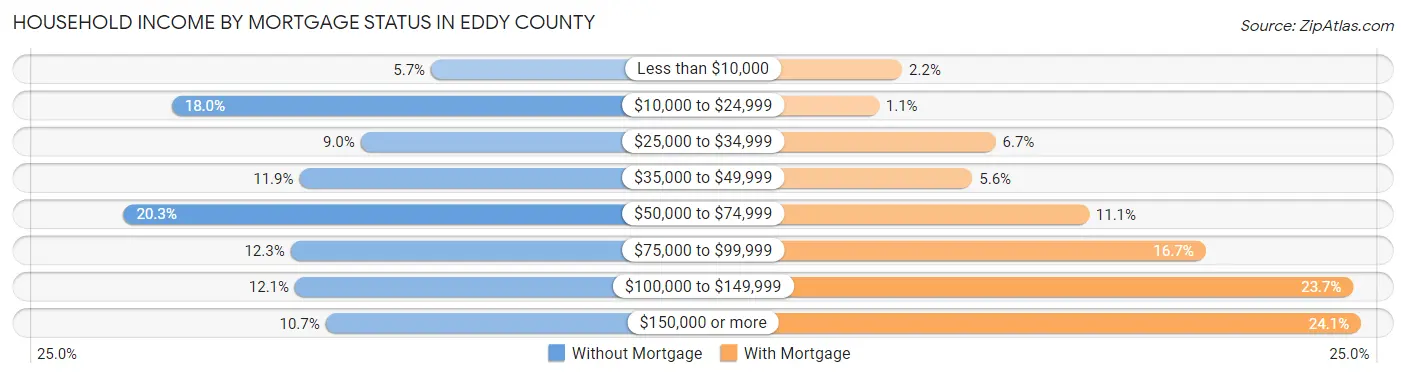
| Household Income | Without Mortgage | With Mortgage |
| Less than $10,000 | 27 (5.7%) | 6 (2.2%) |
| $10,000 to $24,999 | 86 (18.0%) | 3 (1.1%) |
| $25,000 to $34,999 | 43 (9.0%) | 18 (6.7%) |
| $35,000 to $49,999 | 57 (11.9%) | 15 (5.6%) |
| $50,000 to $74,999 | 97 (20.3%) | 30 (11.1%) |
| $75,000 to $99,999 | 59 (12.3%) | 45 (16.7%) |
| $100,000 to $149,999 | 58 (12.1%) | 64 (23.7%) |
| $150,000 or more | 51 (10.7%) | 65 (24.1%) |
| Total | 478 (100.0%) | 270 (100.0%) |
Property Value to Household Income Ratio in Eddy County
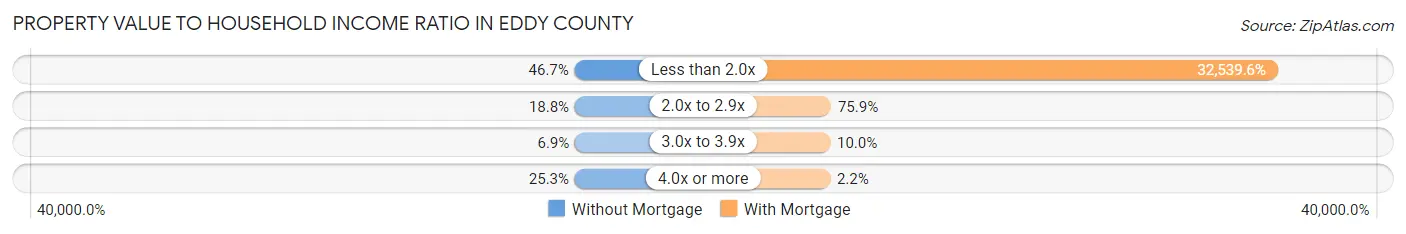
| Value-to-Income Ratio | Without Mortgage | With Mortgage |
| Less than 2.0x | 223 (46.7%) | 87,857 (32,539.6%) |
| 2.0x to 2.9x | 90 (18.8%) | 205 (75.9%) |
| 3.0x to 3.9x | 33 (6.9%) | 27 (10.0%) |
| 4.0x or more | 121 (25.3%) | 6 (2.2%) |
| Total | 478 (100.0%) | 270 (100.0%) |
Real Estate Taxes by Mortgage Status in Eddy County
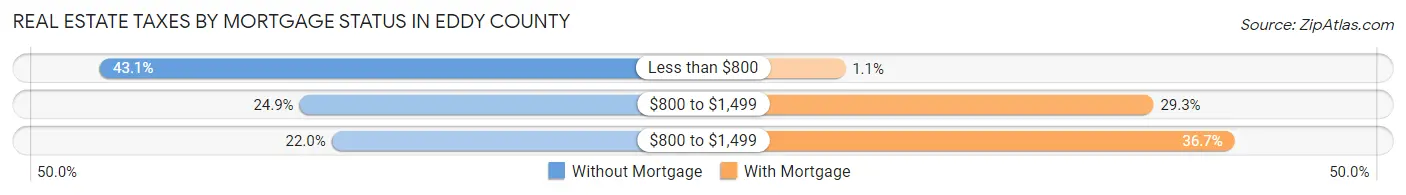
| Property Taxes | Without Mortgage | With Mortgage |
| Less than $800 | 206 (43.1%) | 3 (1.1%) |
| $800 to $1,499 | 119 (24.9%) | 79 (29.3%) |
| $800 to $1,499 | 105 (22.0%) | 99 (36.7%) |
| Total | 478 (100.0%) | 270 (100.0%) |
Health & Disability in Eddy County
Health Insurance Coverage by Age in Eddy County
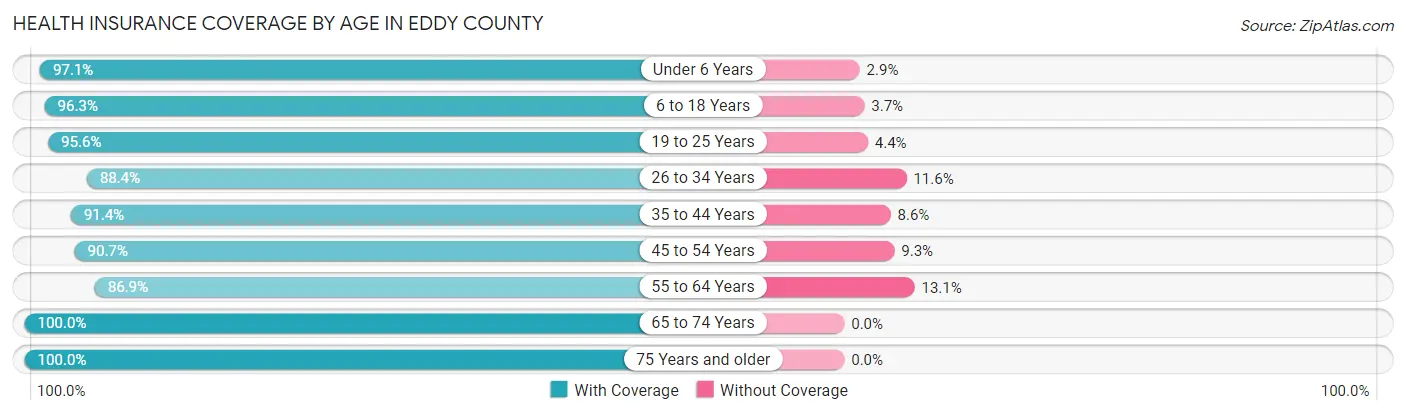
| Age Bracket | With Coverage | Without Coverage |
| Under 6 Years | 169 (97.1%) | 5 (2.9%) |
| 6 to 18 Years | 335 (96.3%) | 13 (3.7%) |
| 19 to 25 Years | 109 (95.6%) | 5 (4.4%) |
| 26 to 34 Years | 221 (88.4%) | 29 (11.6%) |
| 35 to 44 Years | 222 (91.4%) | 21 (8.6%) |
| 45 to 54 Years | 243 (90.7%) | 25 (9.3%) |
| 55 to 64 Years | 252 (86.9%) | 38 (13.1%) |
| 65 to 74 Years | 326 (100.0%) | 0 (0.0%) |
| 75 Years and older | 250 (100.0%) | 0 (0.0%) |
| Total | 2,127 (94.0%) | 136 (6.0%) |
Health Insurance Coverage by Citizenship Status in Eddy County
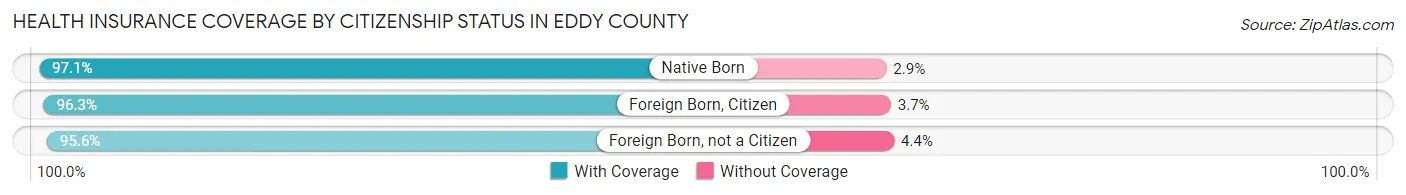
| Citizenship Status | With Coverage | Without Coverage |
| Native Born | 169 (97.1%) | 5 (2.9%) |
| Foreign Born, Citizen | 335 (96.3%) | 13 (3.7%) |
| Foreign Born, not a Citizen | 109 (95.6%) | 5 (4.4%) |
Health Insurance Coverage by Household Income in Eddy County
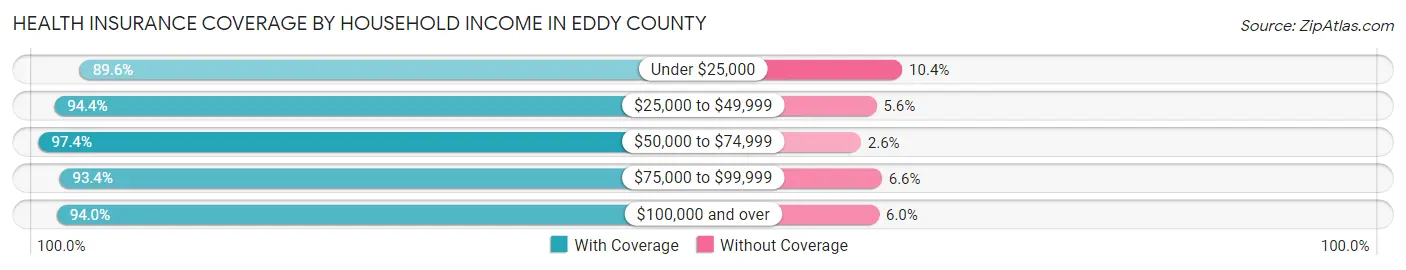
| Household Income | With Coverage | Without Coverage |
| Under $25,000 | 294 (89.6%) | 34 (10.4%) |
| $25,000 to $49,999 | 542 (94.4%) | 32 (5.6%) |
| $50,000 to $74,999 | 370 (97.4%) | 10 (2.6%) |
| $75,000 to $99,999 | 342 (93.4%) | 24 (6.6%) |
| $100,000 and over | 560 (94.0%) | 36 (6.0%) |
Public vs Private Health Insurance Coverage by Age in Eddy County
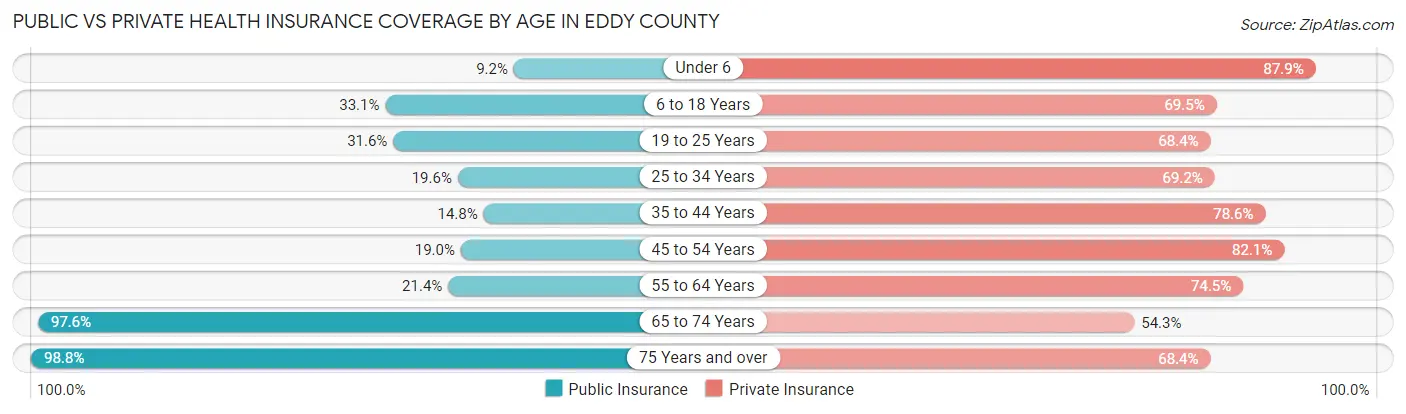
| Age Bracket | Public Insurance | Private Insurance |
| Under 6 | 16 (9.2%) | 153 (87.9%) |
| 6 to 18 Years | 115 (33.1%) | 242 (69.5%) |
| 19 to 25 Years | 36 (31.6%) | 78 (68.4%) |
| 25 to 34 Years | 49 (19.6%) | 173 (69.2%) |
| 35 to 44 Years | 36 (14.8%) | 191 (78.6%) |
| 45 to 54 Years | 51 (19.0%) | 220 (82.1%) |
| 55 to 64 Years | 62 (21.4%) | 216 (74.5%) |
| 65 to 74 Years | 318 (97.6%) | 177 (54.3%) |
| 75 Years and over | 247 (98.8%) | 171 (68.4%) |
| Total | 930 (41.1%) | 1,621 (71.6%) |
Disability Status by Sex by Age in Eddy County
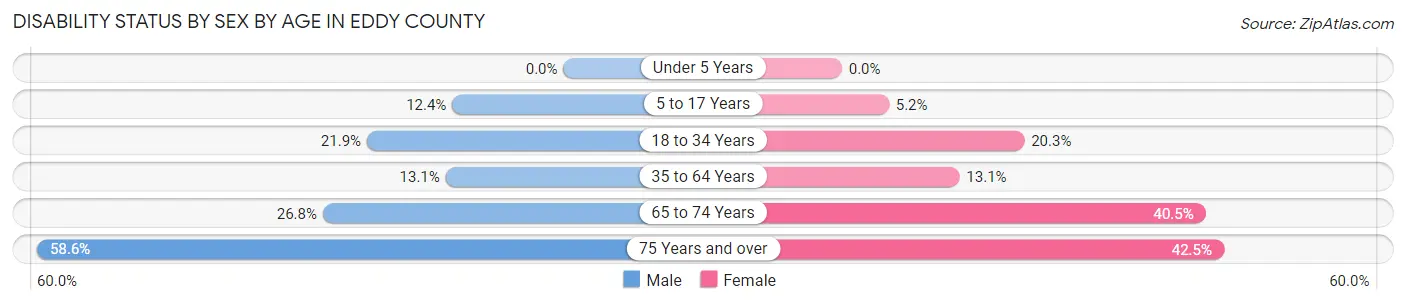
| Age Bracket | Male | Female |
| Under 5 Years | 0 (0.0%) | 0 (0.0%) |
| 5 to 17 Years | 25 (12.4%) | 8 (5.2%) |
| 18 to 34 Years | 42 (21.9%) | 38 (20.3%) |
| 35 to 64 Years | 56 (13.1%) | 49 (13.1%) |
| 65 to 74 Years | 45 (26.8%) | 64 (40.5%) |
| 75 Years and over | 68 (58.6%) | 57 (42.5%) |
Disability Class by Sex by Age in Eddy County
Disability Class: Hearing Difficulty
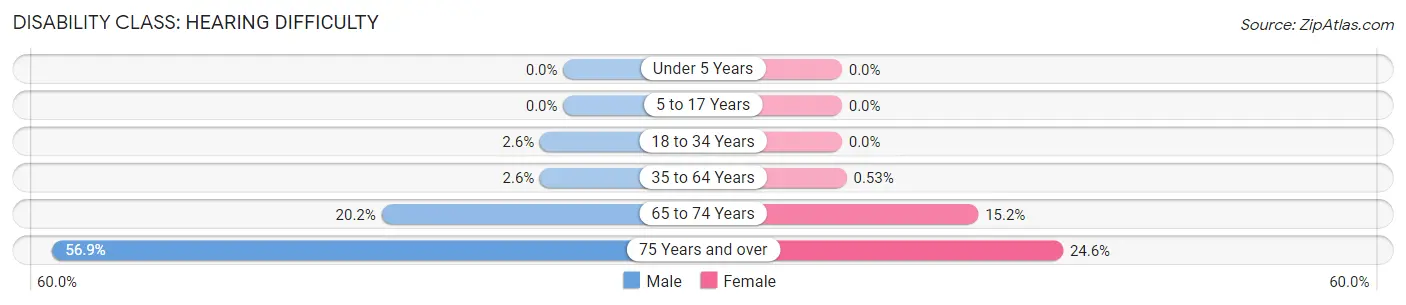
| Age Bracket | Male | Female |
| Under 5 Years | 0 (0.0%) | 0 (0.0%) |
| 5 to 17 Years | 0 (0.0%) | 0 (0.0%) |
| 18 to 34 Years | 5 (2.6%) | 0 (0.0%) |
| 35 to 64 Years | 11 (2.6%) | 2 (0.5%) |
| 65 to 74 Years | 34 (20.2%) | 24 (15.2%) |
| 75 Years and over | 66 (56.9%) | 33 (24.6%) |
Disability Class: Vision Difficulty
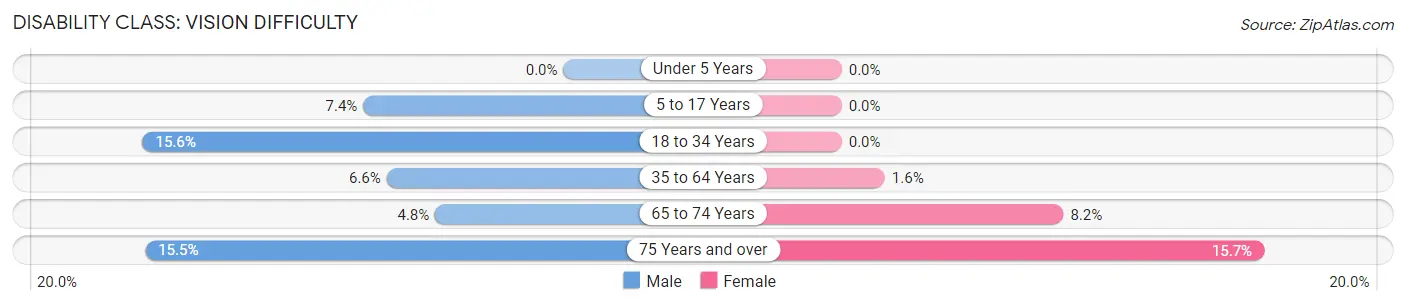
| Age Bracket | Male | Female |
| Under 5 Years | 0 (0.0%) | 0 (0.0%) |
| 5 to 17 Years | 15 (7.4%) | 0 (0.0%) |
| 18 to 34 Years | 30 (15.6%) | 0 (0.0%) |
| 35 to 64 Years | 28 (6.6%) | 6 (1.6%) |
| 65 to 74 Years | 8 (4.8%) | 13 (8.2%) |
| 75 Years and over | 18 (15.5%) | 21 (15.7%) |
Disability Class: Cognitive Difficulty
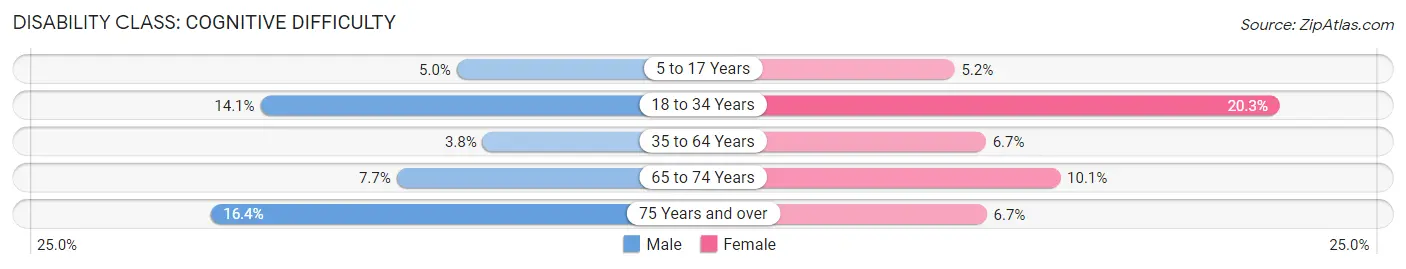
| Age Bracket | Male | Female |
| 5 to 17 Years | 10 (5.0%) | 8 (5.2%) |
| 18 to 34 Years | 27 (14.1%) | 38 (20.3%) |
| 35 to 64 Years | 16 (3.7%) | 25 (6.7%) |
| 65 to 74 Years | 13 (7.7%) | 16 (10.1%) |
| 75 Years and over | 19 (16.4%) | 9 (6.7%) |
Disability Class: Ambulatory Difficulty
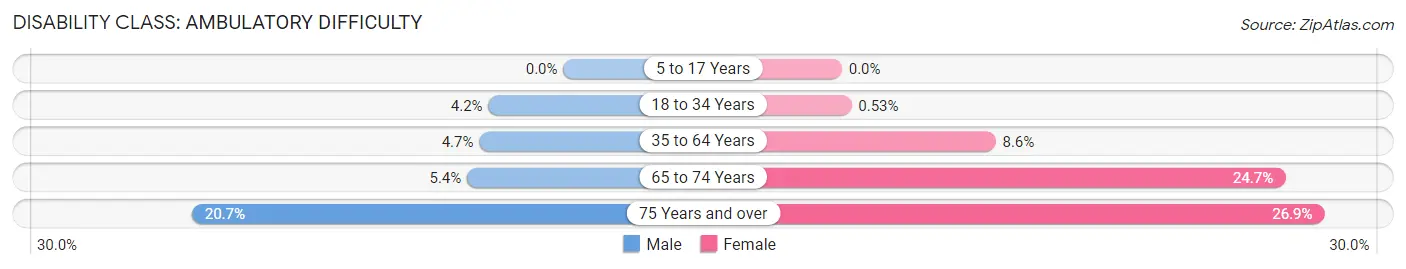
| Age Bracket | Male | Female |
| 5 to 17 Years | 0 (0.0%) | 0 (0.0%) |
| 18 to 34 Years | 8 (4.2%) | 1 (0.5%) |
| 35 to 64 Years | 20 (4.7%) | 32 (8.6%) |
| 65 to 74 Years | 9 (5.4%) | 39 (24.7%) |
| 75 Years and over | 24 (20.7%) | 36 (26.9%) |
Disability Class: Self-Care Difficulty
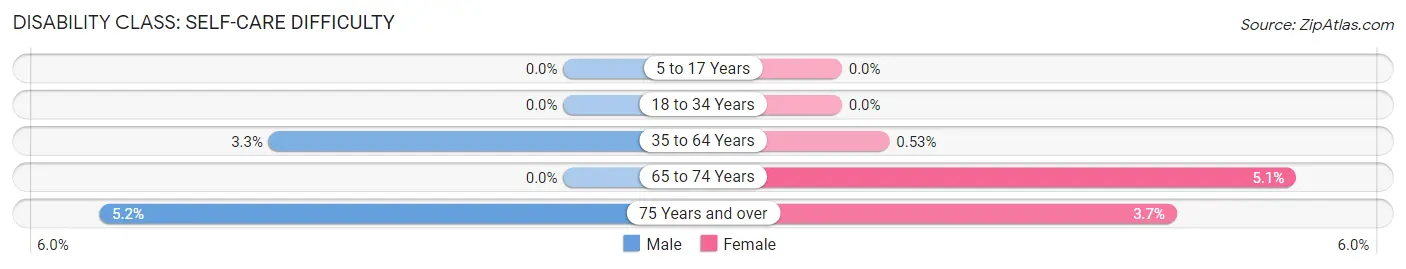
| Age Bracket | Male | Female |
| 5 to 17 Years | 0 (0.0%) | 0 (0.0%) |
| 18 to 34 Years | 0 (0.0%) | 0 (0.0%) |
| 35 to 64 Years | 14 (3.3%) | 2 (0.5%) |
| 65 to 74 Years | 0 (0.0%) | 8 (5.1%) |
| 75 Years and over | 6 (5.2%) | 5 (3.7%) |
Technology Access in Eddy County
Computing Device Access in Eddy County
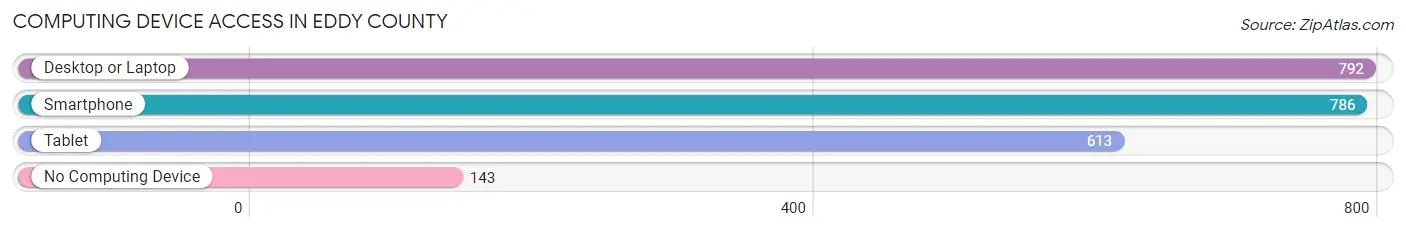
| Device Type | # Households | % Households |
| Desktop or Laptop | 792 | 73.5% |
| Smartphone | 786 | 73.0% |
| Tablet | 613 | 56.9% |
| No Computing Device | 143 | 13.3% |
| Total | 1,077 | 100.0% |
Internet Access in Eddy County
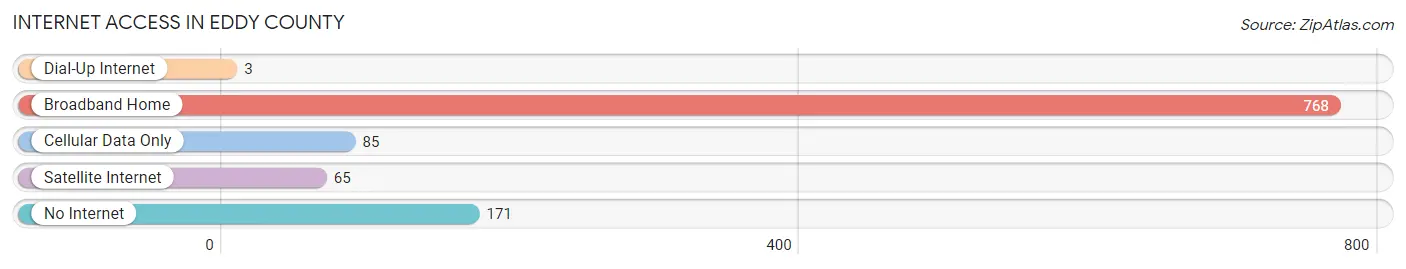
| Internet Type | # Households | % Households |
| Dial-Up Internet | 3 | 0.3% |
| Broadband Home | 768 | 71.3% |
| Cellular Data Only | 85 | 7.9% |
| Satellite Internet | 65 | 6.0% |
| No Internet | 171 | 15.9% |
| Total | 1,077 | 100.0% |
Eddy County Summary
Eddy County is located in the northeastern corner of North Dakota, and is bordered by the Canadian provinces of Saskatchewan and Manitoba. It is the second-largest county in the state, with an area of 2,845 square miles. The county seat is New Rockford, and the largest city is Sheyenne.
History
Eddy County was established in 1883, and was named after William A. Eddy, a prominent early settler. The county was originally part of the Dakota Territory, and was part of the original land grant given to the Northern Pacific Railroad in 1864. The first settlers arrived in the area in the 1870s, and the county was officially organized in 1883.
The county experienced rapid growth in the late 19th and early 20th centuries, as settlers moved into the area to take advantage of the fertile soil and abundant natural resources. The county was home to several large farms, and the population grew steadily throughout the early 20th century.
Geography
Eddy County is located in the northeastern corner of North Dakota, and is bordered by the Canadian provinces of Saskatchewan and Manitoba. It is the second-largest county in the state, with an area of 2,845 square miles. The county is mostly flat, with rolling hills in the western part of the county. The Sheyenne River runs through the county, and there are several small lakes and ponds scattered throughout the area.
The climate in Eddy County is generally temperate, with cold winters and warm summers. The average annual temperature is around 45°F, and the average annual precipitation is around 20 inches.
Economy
Eddy County’s economy is largely based on agriculture, with wheat, corn, and soybeans being the main crops. The county is also home to several large cattle ranches, and there are several large dairy farms in the area.
The county is also home to several manufacturing companies, including a large wind turbine manufacturing plant. The county is also home to several oil and gas production companies, and there are several large oil and gas fields in the area.
Demographics
As of the 2010 census, Eddy County had a population of 2,845 people. The population is largely white (94.3%), with small percentages of Native American (2.2%), African American (1.2%), and Asian (0.7%) populations. The median household income is $45,000, and the median home value is $125,000.
The county is home to several small towns, including New Rockford (the county seat), Sheyenne, and McHenry. The county is also home to several small unincorporated communities, including Edmore, Endeavor, and Fairdale.
Common Questions
What is Per Capita Income in Eddy County?
Per Capita income in Eddy County is $34,852.
What is the Median Family Income in Eddy County?
Median Family Income in Eddy County is $76,964.
What is the Median Household income in Eddy County?
Median Household Income in Eddy County is $50,375.
What is Income or Wage Gap in Eddy County?
Income or Wage Gap in Eddy County is 17.7%.
Women in Eddy County earn 82.3 cents for every dollar earned by a man.
What is Inequality or Gini Index in Eddy County?
Inequality or Gini Index in Eddy County is 0.48.
What is the Total Population of Eddy County?
Total Population of Eddy County is 2,345.
What is the Total Male Population of Eddy County?
Total Male Population of Eddy County is 1,225.
What is the Total Female Population of Eddy County?
Total Female Population of Eddy County is 1,120.
What is the Ratio of Males per 100 Females in Eddy County?
There are 109.38 Males per 100 Females in Eddy County.
What is the Ratio of Females per 100 Males in Eddy County?
There are 91.43 Females per 100 Males in Eddy County.
What is the Median Population Age in Eddy County?
Median Population Age in Eddy County is 46.4 Years.
What is the Average Family Size in Eddy County
Average Family Size in Eddy County is 2.9 People.
What is the Average Household Size in Eddy County
Average Household Size in Eddy County is 2.1 People.
How Large is the Labor Force in Eddy County?
There are 1,136 People in the Labor Forcein in Eddy County.
What is the Percentage of People in the Labor Force in Eddy County?
58.6% of People are in the Labor Force in Eddy County.
What is the Unemployment Rate in Eddy County?
Unemployment Rate in Eddy County is 2.3%.