Billings County, ND Map & Demographics
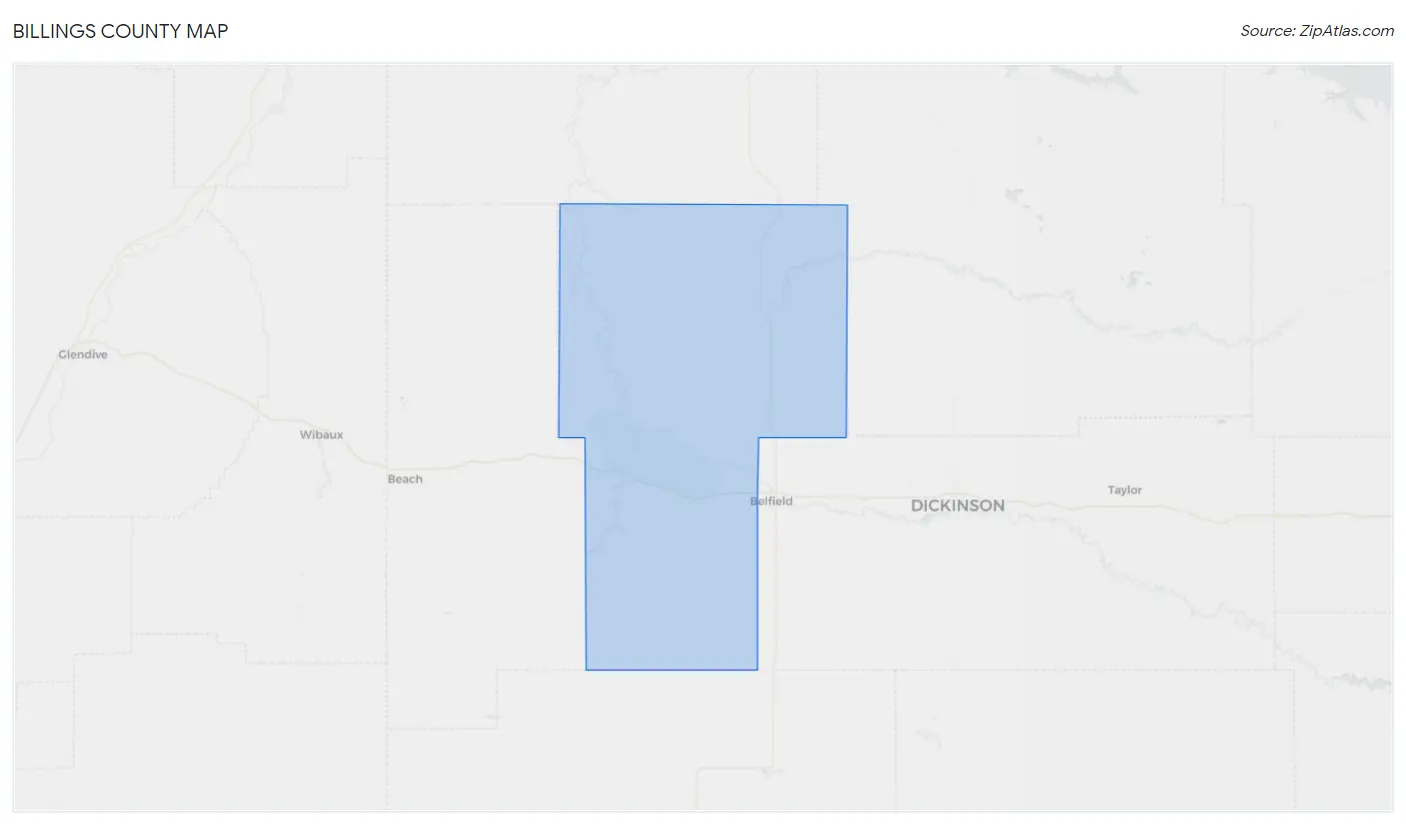
Billings County Map
Billings County Overview
$36,923
PER CAPITA INCOME
$104,688
AVG FAMILY INCOME
$74,000
AVG HOUSEHOLD INCOME
34.6%
WAGE / INCOME GAP [ % ]
65.4¢/ $1
WAGE / INCOME GAP [ $ ]
$3,653
FAMILY INCOME DEFICIT
0.38
INEQUALITY / GINI INDEX
839
TOTAL POPULATION
456
MALE POPULATION
383
FEMALE POPULATION
119.06
MALES / 100 FEMALES
83.99
FEMALES / 100 MALES
40.6
MEDIAN AGE
2.8
AVG FAMILY SIZE
2.5
AVG HOUSEHOLD SIZE
431
LABOR FORCE [ PEOPLE ]
63.3%
PERCENT IN LABOR FORCE
2.1%
UNEMPLOYMENT RATE
Billings County Area Codes
Income in Billings County
Income Overview in Billings County
Per Capita Income in Billings County is $36,923, while median incomes of families and households are $104,688 and $74,000 respectively.
| Characteristic | Number | Measure |
| Per Capita Income | 839 | $36,923 |
| Median Family Income | 229 | $104,688 |
| Mean Family Income | 229 | $103,371 |
| Median Household Income | 320 | $74,000 |
| Mean Household Income | 320 | $92,045 |
| Income Deficit | 229 | $3,653 |
| Wage / Income Gap (%) | 839 | 34.63% |
| Wage / Income Gap ($) | 839 | 65.37¢ per $1 |
| Gini / Inequality Index | 839 | 0.38 |
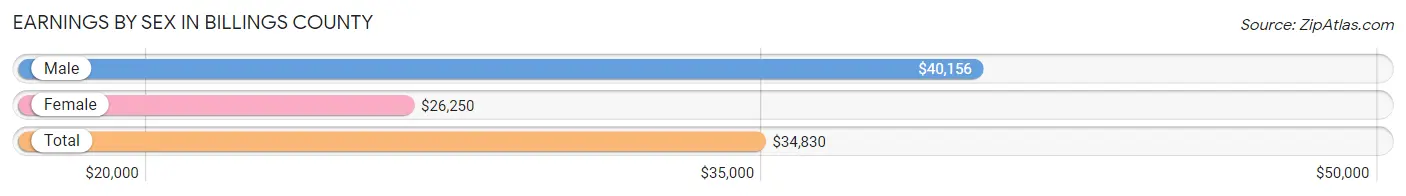
Earnings by Sex in Billings County
Average Earnings in Billings County are $34,830, $40,156 for men and $26,250 for women, a difference of 34.6%.
| Sex | Number | Average Earnings |
| Male | 309 (60.7%) | $40,156 |
| Female | 200 (39.3%) | $26,250 |
| Total | 509 (100.0%) | $34,830 |
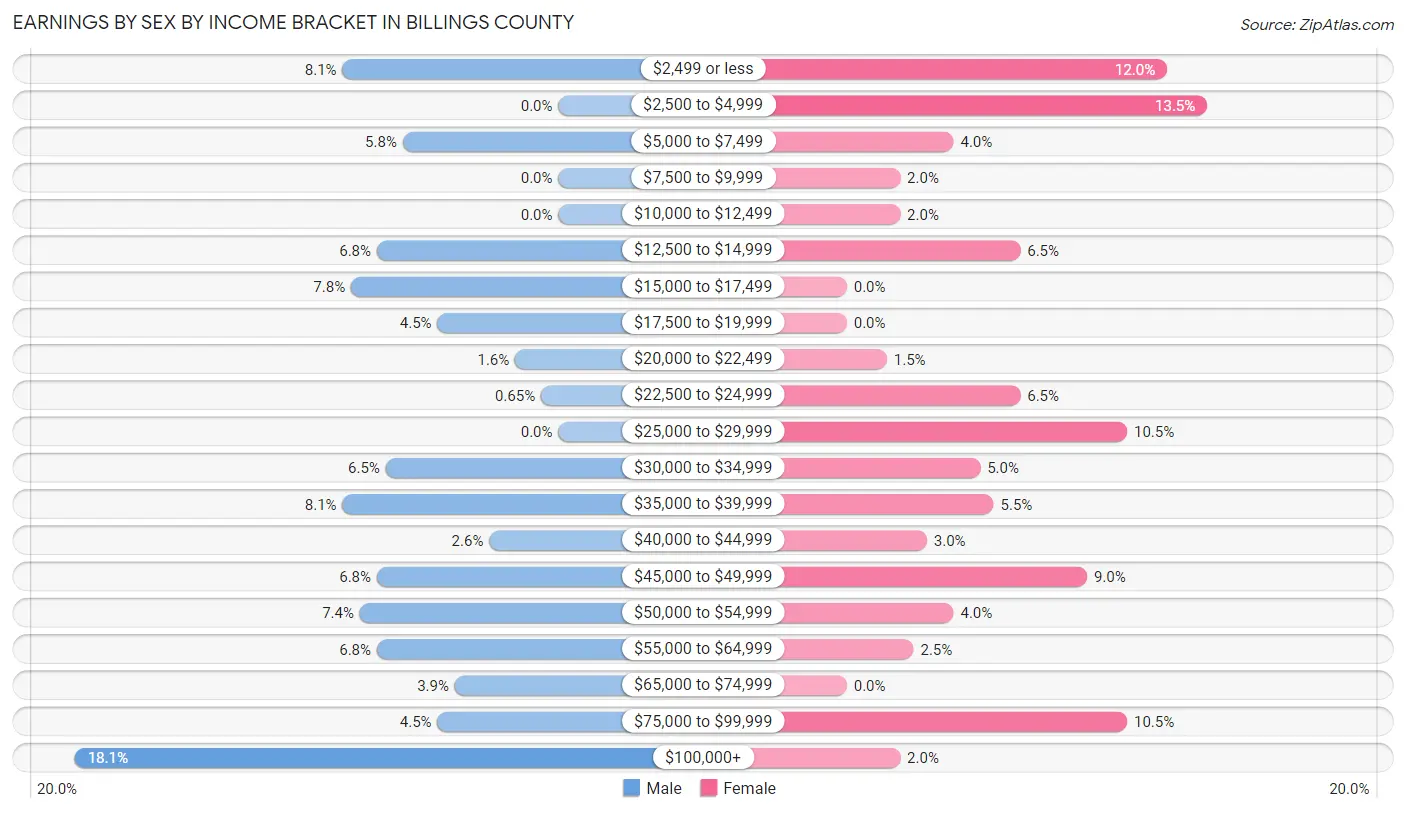
Earnings by Sex by Income Bracket in Billings County
The most common earnings brackets in Billings County are $100,000+ for men (56 | 18.1%) and $2,500 to $4,999 for women (27 | 13.5%).
| Income | Male | Female |
| $2,499 or less | 25 (8.1%) | 24 (12.0%) |
| $2,500 to $4,999 | 0 (0.0%) | 27 (13.5%) |
| $5,000 to $7,499 | 18 (5.8%) | 8 (4.0%) |
| $7,500 to $9,999 | 0 (0.0%) | 4 (2.0%) |
| $10,000 to $12,499 | 0 (0.0%) | 4 (2.0%) |
| $12,500 to $14,999 | 21 (6.8%) | 13 (6.5%) |
| $15,000 to $17,499 | 24 (7.8%) | 0 (0.0%) |
| $17,500 to $19,999 | 14 (4.5%) | 0 (0.0%) |
| $20,000 to $22,499 | 5 (1.6%) | 3 (1.5%) |
| $22,500 to $24,999 | 2 (0.6%) | 13 (6.5%) |
| $25,000 to $29,999 | 0 (0.0%) | 21 (10.5%) |
| $30,000 to $34,999 | 20 (6.5%) | 10 (5.0%) |
| $35,000 to $39,999 | 25 (8.1%) | 11 (5.5%) |
| $40,000 to $44,999 | 8 (2.6%) | 6 (3.0%) |
| $45,000 to $49,999 | 21 (6.8%) | 18 (9.0%) |
| $50,000 to $54,999 | 23 (7.4%) | 8 (4.0%) |
| $55,000 to $64,999 | 21 (6.8%) | 5 (2.5%) |
| $65,000 to $74,999 | 12 (3.9%) | 0 (0.0%) |
| $75,000 to $99,999 | 14 (4.5%) | 21 (10.5%) |
| $100,000+ | 56 (18.1%) | 4 (2.0%) |
| Total | 309 (100.0%) | 200 (100.0%) |
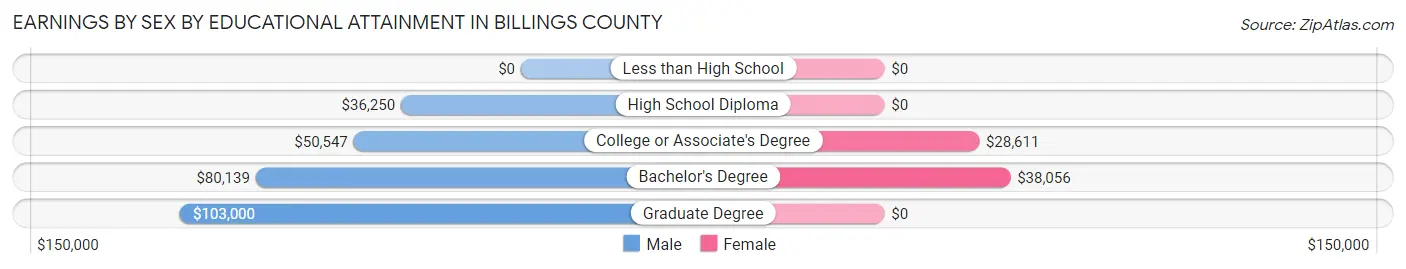
Earnings by Sex by Educational Attainment in Billings County
Average earnings in Billings County are $48,594 for men and $28,654 for women, a difference of 41.0%. Men with an educational attainment of graduate degree enjoy the highest average annual earnings of $103,000, while those with high school diploma education earn the least with $36,250. Women with an educational attainment of bachelor's degree earn the most with the average annual earnings of $38,056, while those with college or associate's degree education have the smallest earnings of $28,611.
| Educational Attainment | Male Income | Female Income |
| Less than High School | - | - |
| High School Diploma | $36,250 | $0 |
| College or Associate's Degree | $50,547 | $28,611 |
| Bachelor's Degree | $80,139 | $38,056 |
| Graduate Degree | $103,000 | $0 |
| Total | $48,594 | $28,654 |
Family Income in Billings County
Family Income Brackets in Billings County
According to the Billings County family income data, there are 80 families falling into the $100,000 to $149,999 income range, which is the most common income bracket and makes up 34.9% of all families. Conversely, the less than $10,000 income bracket is the least frequent group with only 2 families (0.9%) belonging to this category.
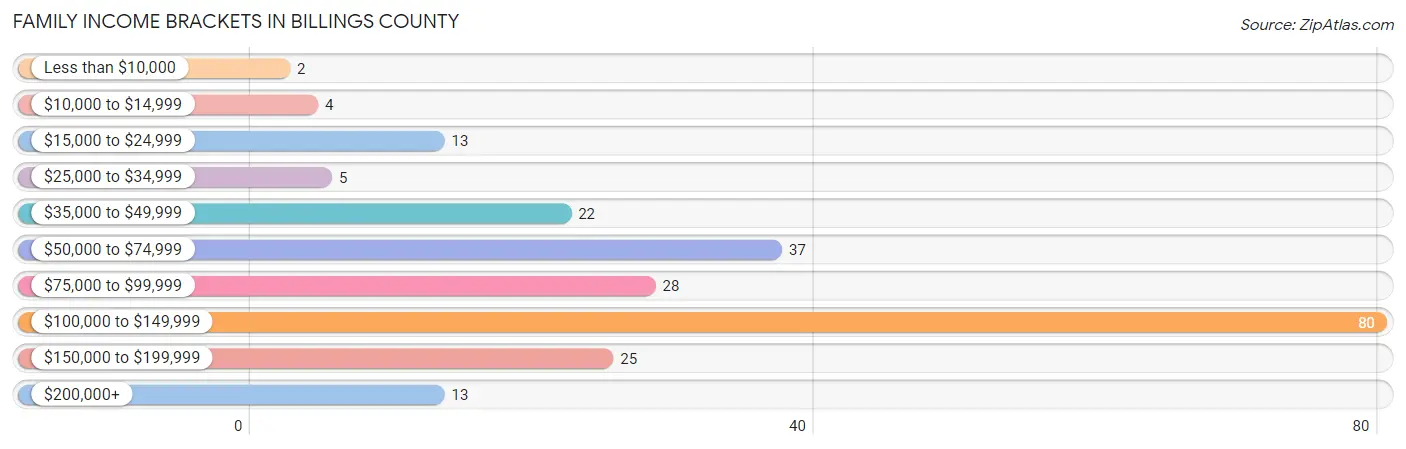
| Income Bracket | # Families | % Families |
| Less than $10,000 | 2 | 0.9% |
| $10,000 to $14,999 | 4 | 1.7% |
| $15,000 to $24,999 | 13 | 5.7% |
| $25,000 to $34,999 | 5 | 2.2% |
| $35,000 to $49,999 | 22 | 9.6% |
| $50,000 to $74,999 | 37 | 16.2% |
| $75,000 to $99,999 | 28 | 12.2% |
| $100,000 to $149,999 | 80 | 34.9% |
| $150,000 to $199,999 | 25 | 10.9% |
| $200,000+ | 13 | 5.7% |
Family Income by Famaliy Size in Billings County
5-person families (12 | 5.2%) account for the highest median family income in Billings County with $113,333 per family, while 2-person families (168 | 73.4%) have the highest median income of $53,750 per family member.
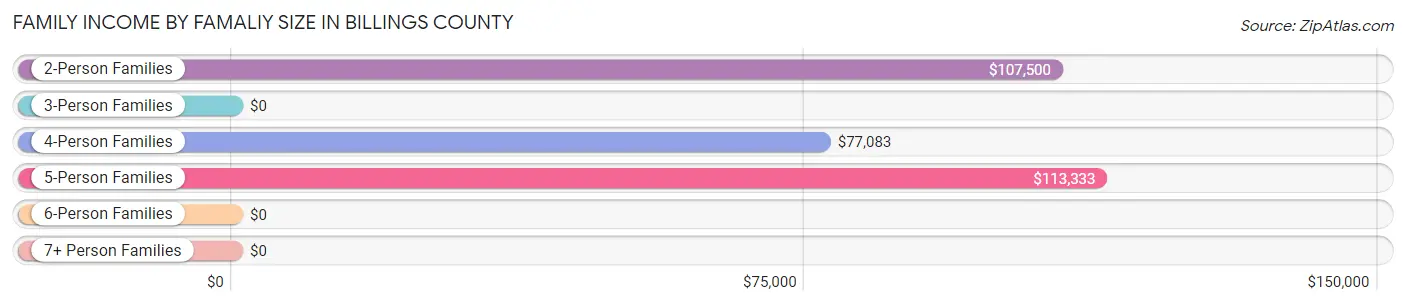
| Income Bracket | # Families | Median Income |
| 2-Person Families | 168 (73.4%) | $107,500 |
| 3-Person Families | 15 (6.6%) | $0 |
| 4-Person Families | 20 (8.7%) | $77,083 |
| 5-Person Families | 12 (5.2%) | $113,333 |
| 6-Person Families | 12 (5.2%) | $0 |
| 7+ Person Families | 2 (0.9%) | $0 |
| Total | 229 (100.0%) | $104,688 |
Family Income by Number of Earners in Billings County
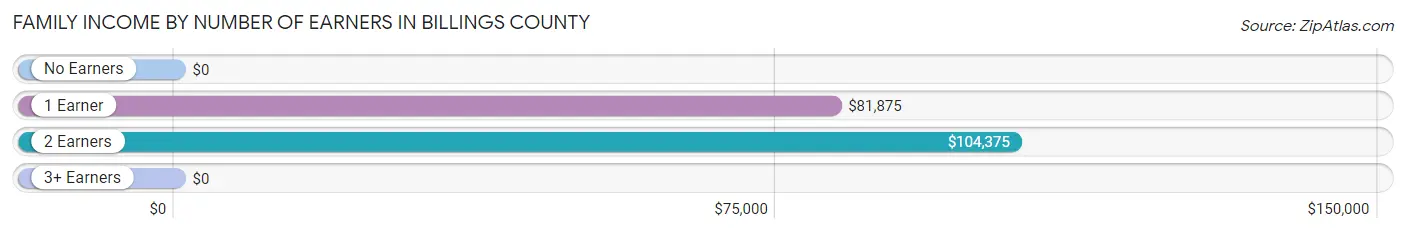
| Number of Earners | # Families | Median Income |
| No Earners | 37 (16.2%) | $0 |
| 1 Earner | 55 (24.0%) | $81,875 |
| 2 Earners | 128 (55.9%) | $104,375 |
| 3+ Earners | 9 (3.9%) | $0 |
| Total | 229 (100.0%) | $104,688 |
Household Income in Billings County
Household Income Brackets in Billings County
With 77 households falling in the category, the $100,000 to $149,999 income range is the most frequent in Billings County, accounting for 24.1% of all households. In contrast, only 7 households (2.2%) fall into the $10,000 to $14,999 income bracket, making it the least populous group.
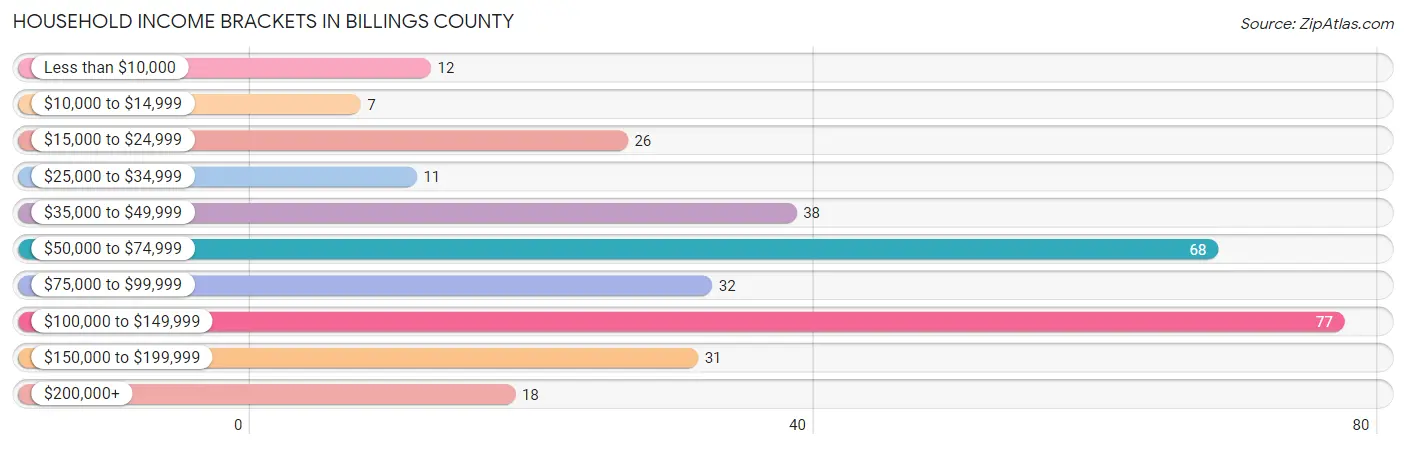
| Income Bracket | # Households | % Households |
| Less than $10,000 | 12 | 3.8% |
| $10,000 to $14,999 | 7 | 2.2% |
| $15,000 to $24,999 | 26 | 8.1% |
| $25,000 to $34,999 | 11 | 3.4% |
| $35,000 to $49,999 | 38 | 11.9% |
| $50,000 to $74,999 | 68 | 21.3% |
| $75,000 to $99,999 | 32 | 10.0% |
| $100,000 to $149,999 | 77 | 24.1% |
| $150,000 to $199,999 | 31 | 9.7% |
| $200,000+ | 18 | 5.6% |
Household Income by Householder Age in Billings County
The median household income in Billings County is $74,000, with the highest median household income of $108,750 found in the 25 to 44 years age bracket for the primary householder. A total of 96 households (30.0%) fall into this category. Meanwhile, the 15 to 24 years age bracket for the primary householder has the lowest median household income of $14,821, with 15 households (4.7%) in this group.
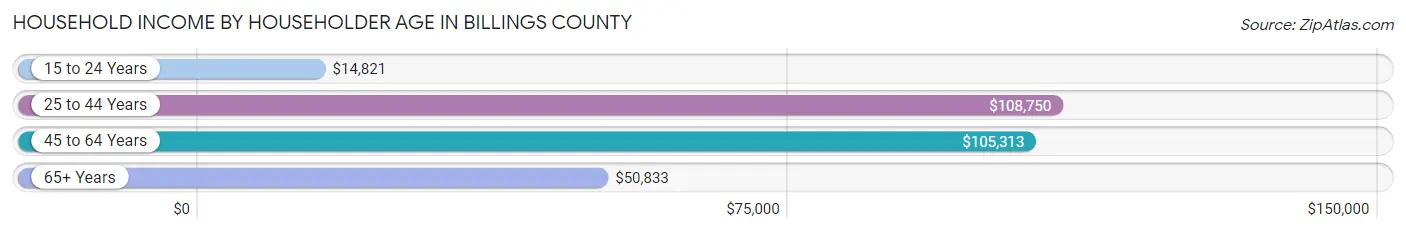
| Income Bracket | # Households | Median Income |
| 15 to 24 Years | 15 (4.7%) | $14,821 |
| 25 to 44 Years | 96 (30.0%) | $108,750 |
| 45 to 64 Years | 87 (27.2%) | $105,313 |
| 65+ Years | 122 (38.1%) | $50,833 |
| Total | 320 (100.0%) | $74,000 |
Poverty in Billings County
Income Below Poverty by Sex and Age in Billings County
With 10.8% poverty level for males and 11.5% for females among the residents of Billings County, 55 to 64 year old males and 18 to 24 year old females are the most vulnerable to poverty, with 19 males (32.8%) and 10 females (50.0%) in their respective age groups living below the poverty level.
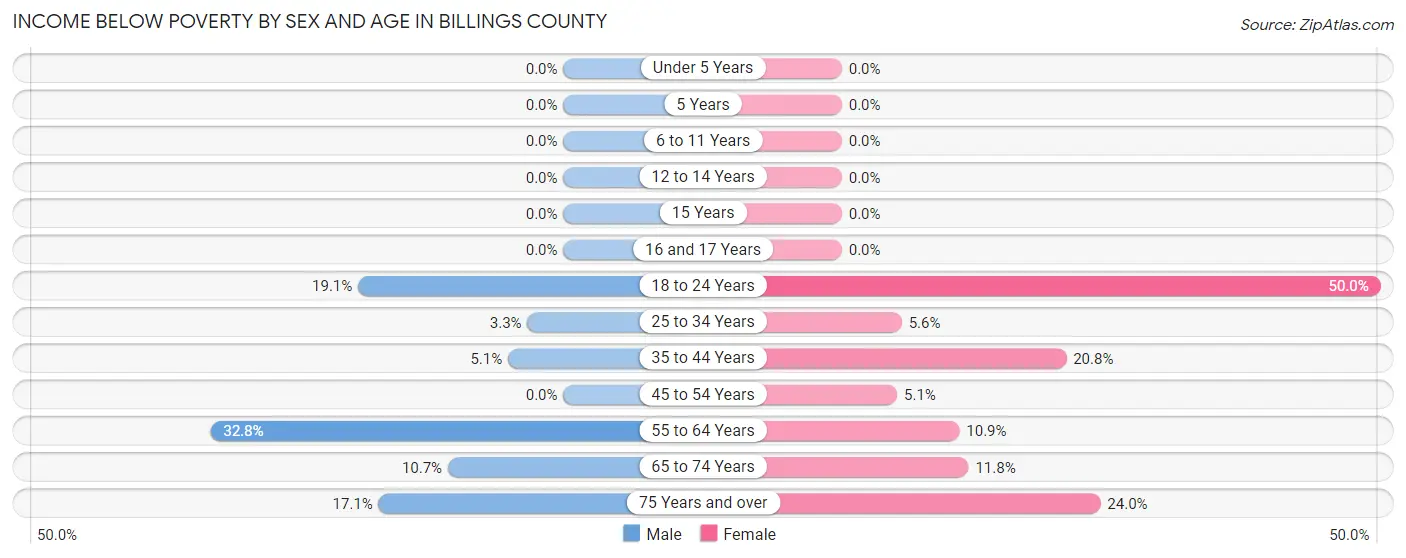
| Age Bracket | Male | Female |
| Under 5 Years | 0 (0.0%) | 0 (0.0%) |
| 5 Years | 0 (0.0%) | 0 (0.0%) |
| 6 to 11 Years | 0 (0.0%) | 0 (0.0%) |
| 12 to 14 Years | 0 (0.0%) | 0 (0.0%) |
| 15 Years | 0 (0.0%) | 0 (0.0%) |
| 16 and 17 Years | 0 (0.0%) | 0 (0.0%) |
| 18 to 24 Years | 8 (19.1%) | 10 (50.0%) |
| 25 to 34 Years | 2 (3.3%) | 2 (5.6%) |
| 35 to 44 Years | 4 (5.1%) | 10 (20.8%) |
| 45 to 54 Years | 0 (0.0%) | 2 (5.1%) |
| 55 to 64 Years | 19 (32.8%) | 6 (10.9%) |
| 65 to 74 Years | 9 (10.7%) | 8 (11.8%) |
| 75 Years and over | 6 (17.1%) | 6 (24.0%) |
| Total | 48 (10.8%) | 44 (11.5%) |
Income Above Poverty by Sex and Age in Billings County
According to the poverty statistics in Billings County, males aged under 5 years and females aged under 5 years are the age groups that are most secure financially, with 100.0% of males and 100.0% of females in these age groups living above the poverty line.
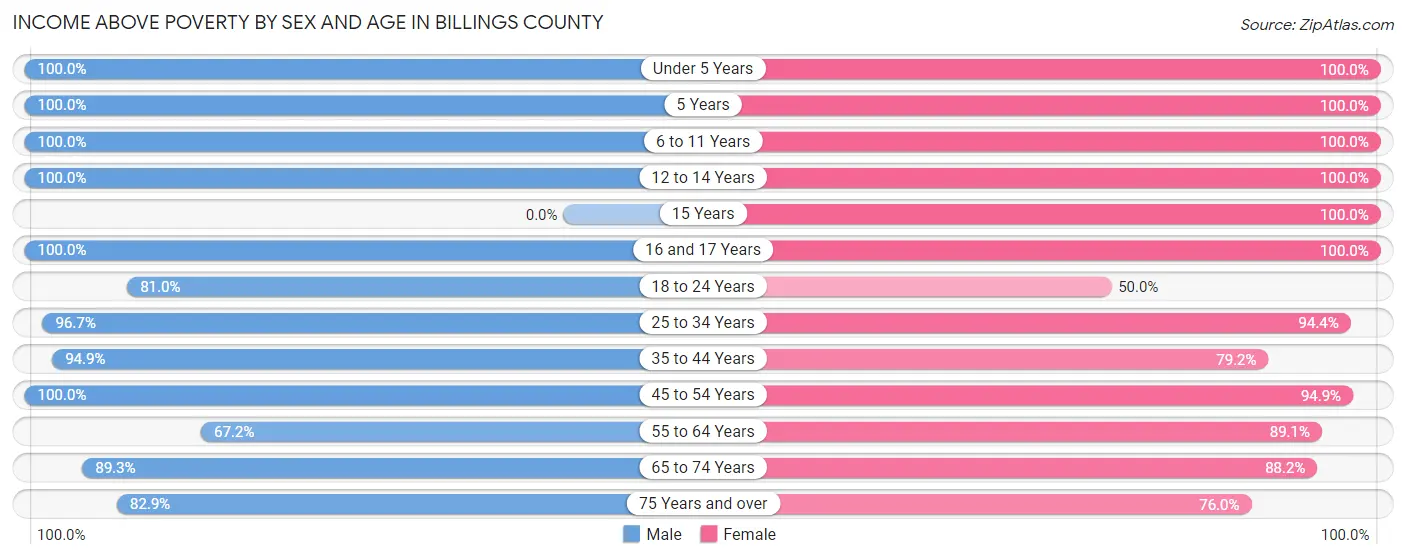
| Age Bracket | Male | Female |
| Under 5 Years | 26 (100.0%) | 31 (100.0%) |
| 5 Years | 8 (100.0%) | 3 (100.0%) |
| 6 to 11 Years | 16 (100.0%) | 25 (100.0%) |
| 12 to 14 Years | 10 (100.0%) | 26 (100.0%) |
| 15 Years | 0 (0.0%) | 2 (100.0%) |
| 16 and 17 Years | 6 (100.0%) | 5 (100.0%) |
| 18 to 24 Years | 34 (80.9%) | 10 (50.0%) |
| 25 to 34 Years | 58 (96.7%) | 34 (94.4%) |
| 35 to 44 Years | 74 (94.9%) | 38 (79.2%) |
| 45 to 54 Years | 22 (100.0%) | 37 (94.9%) |
| 55 to 64 Years | 39 (67.2%) | 49 (89.1%) |
| 65 to 74 Years | 75 (89.3%) | 60 (88.2%) |
| 75 Years and over | 29 (82.9%) | 19 (76.0%) |
| Total | 397 (89.2%) | 339 (88.5%) |
Income Below Poverty Among Married-Couple Families in Billings County
The poverty statistics for married-couple families in Billings County show that 9.2% or 19 of the total 206 families live below the poverty line. Families with no children have the highest poverty rate of 12.3%, comprising of 19 families. On the other hand, families with 1 or 2 children have the lowest poverty rate of 0.0%, which includes 0 families.
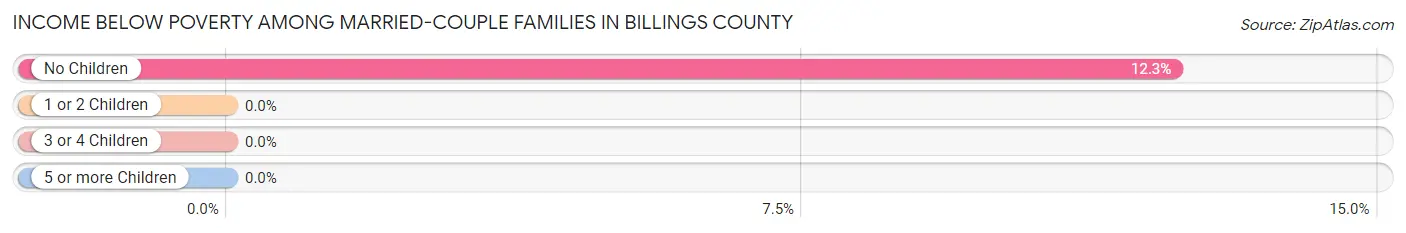
| Children | Above Poverty | Below Poverty |
| No Children | 135 (87.7%) | 19 (12.3%) |
| 1 or 2 Children | 29 (100.0%) | 0 (0.0%) |
| 3 or 4 Children | 21 (100.0%) | 0 (0.0%) |
| 5 or more Children | 2 (100.0%) | 0 (0.0%) |
| Total | 187 (90.8%) | 19 (9.2%) |
Income Below Poverty Among Single-Parent Households in Billings County
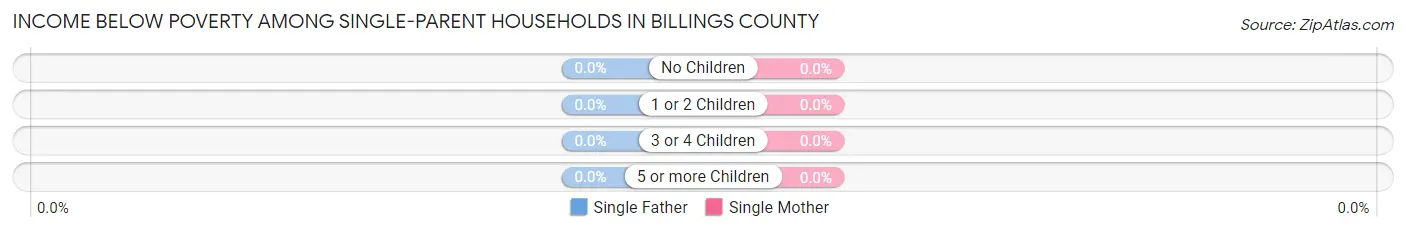
| Children | Single Father | Single Mother |
| No Children | 0 (0.0%) | 0 (0.0%) |
| 1 or 2 Children | 0 (0.0%) | 0 (0.0%) |
| 3 or 4 Children | 0 (0.0%) | 0 (0.0%) |
| 5 or more Children | 0 (0.0%) | 0 (0.0%) |
| Total | 0 (0.0%) | 0 (0.0%) |
Income Below Poverty Among Married-Couple vs Single-Parent Households in Billings County
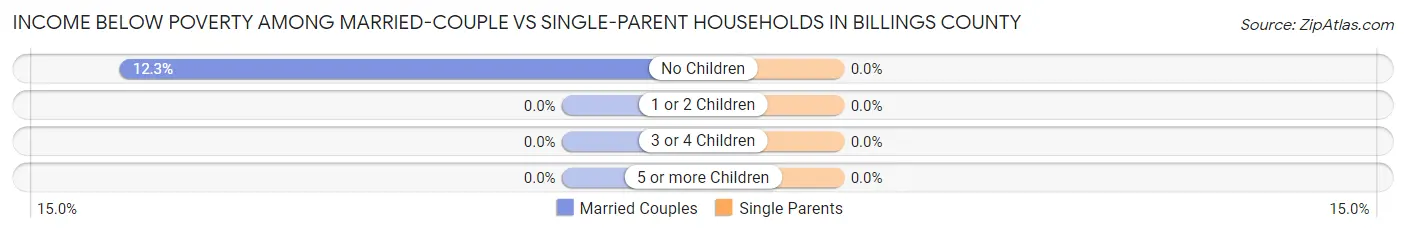
| Children | Married-Couple Families | Single-Parent Households |
| No Children | 19 (12.3%) | 0 (0.0%) |
| 1 or 2 Children | 0 (0.0%) | 0 (0.0%) |
| 3 or 4 Children | 0 (0.0%) | 0 (0.0%) |
| 5 or more Children | 0 (0.0%) | 0 (0.0%) |
| Total | 19 (9.2%) | 0 (0.0%) |
Race in Billings County
The most populous races in Billings County are White / Caucasian (827 | 98.6%), Hispanic or Latino (12 | 1.4%), and Two or more Races (12 | 1.4%).
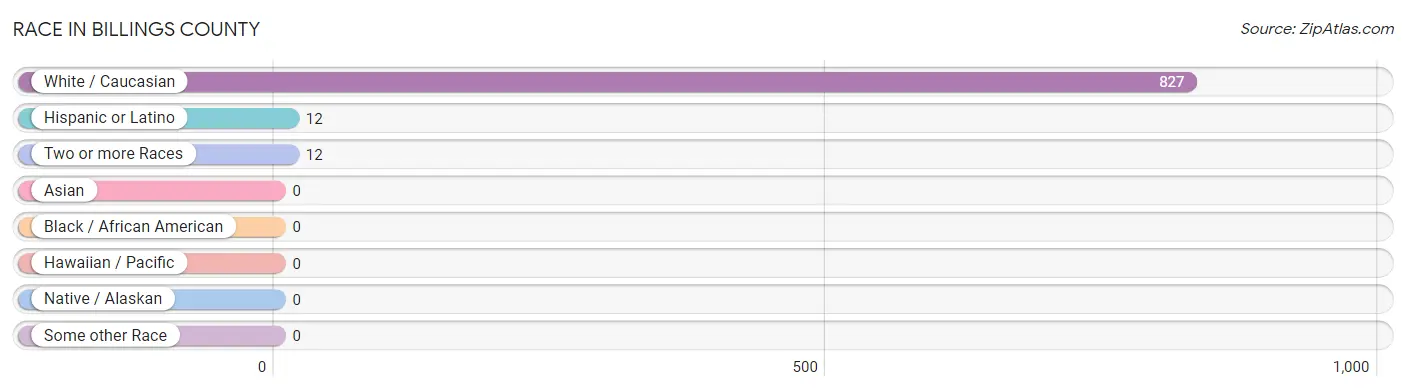
| Race | # Population | % Population |
| Asian | 0 | 0.0% |
| Black / African American | 0 | 0.0% |
| Hawaiian / Pacific | 0 | 0.0% |
| Hispanic or Latino | 12 | 1.4% |
| Native / Alaskan | 0 | 0.0% |
| White / Caucasian | 827 | 98.6% |
| Two or more Races | 12 | 1.4% |
| Some other Race | 0 | 0.0% |
| Total | 839 | 100.0% |
Ancestry in Billings County
The most populous ancestries reported in Billings County are German (325 | 38.7%), Norwegian (130 | 15.5%), Ukrainian (81 | 9.7%), Irish (66 | 7.9%), and English (60 | 7.1%), together accounting for 78.9% of all Billings County residents.
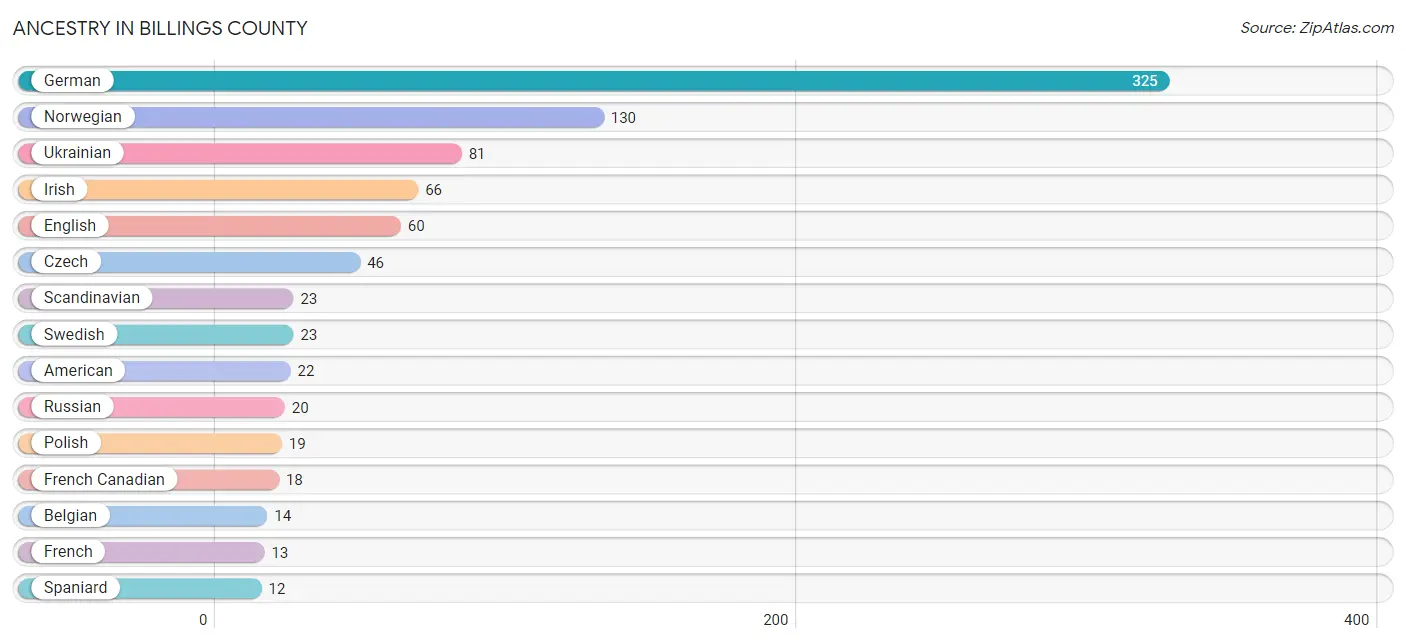
| Ancestry | # Population | % Population |
| American | 22 | 2.6% |
| Belgian | 14 | 1.7% |
| Czech | 46 | 5.5% |
| Dutch | 9 | 1.1% |
| English | 60 | 7.1% |
| European | 9 | 1.1% |
| French | 13 | 1.5% |
| French Canadian | 18 | 2.1% |
| German | 325 | 38.7% |
| German Russian | 3 | 0.4% |
| Icelander | 4 | 0.5% |
| Irish | 66 | 7.9% |
| Italian | 9 | 1.1% |
| Luxembourger | 3 | 0.4% |
| Norwegian | 130 | 15.5% |
| Polish | 19 | 2.3% |
| Russian | 20 | 2.4% |
| Scandinavian | 23 | 2.7% |
| Scottish | 7 | 0.8% |
| Spaniard | 12 | 1.4% |
| Swedish | 23 | 2.7% |
| Ukrainian | 81 | 9.7% |
| Welsh | 4 | 0.5% | View All 23 Rows |
Immigrants in Billings County
The most numerous immigrant groups reported in Billings County came from Central America (12 | 1.4%), Latin America (12 | 1.4%), Mexico (12 | 1.4%), Africa (5 | 0.6%), and South Africa (5 | 0.6%), together accounting for 5.5% of all Billings County residents.
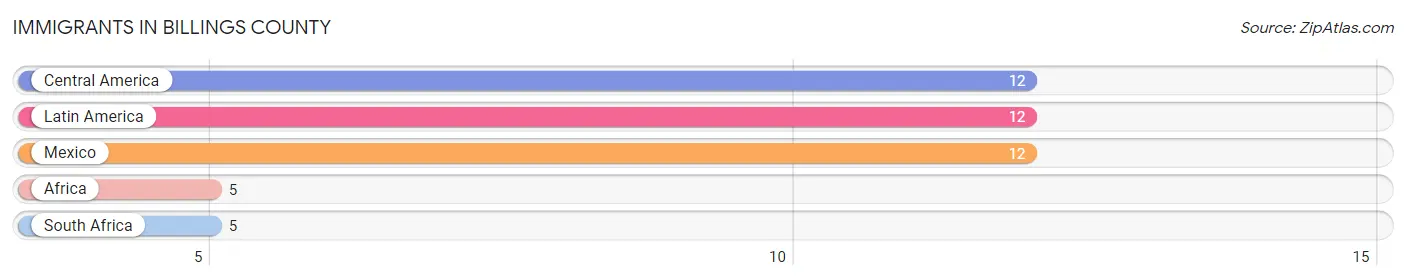
| Immigration Origin | # Population | % Population |
| Africa | 5 | 0.6% |
| Central America | 12 | 1.4% |
| Latin America | 12 | 1.4% |
| Mexico | 12 | 1.4% |
| South Africa | 5 | 0.6% | View All 5 Rows |
Sex and Age in Billings County
Sex and Age in Billings County
The most populous age groups in Billings County are 65 to 69 Years (63 | 13.8%) for men and 70 to 74 Years (55 | 14.4%) for women.
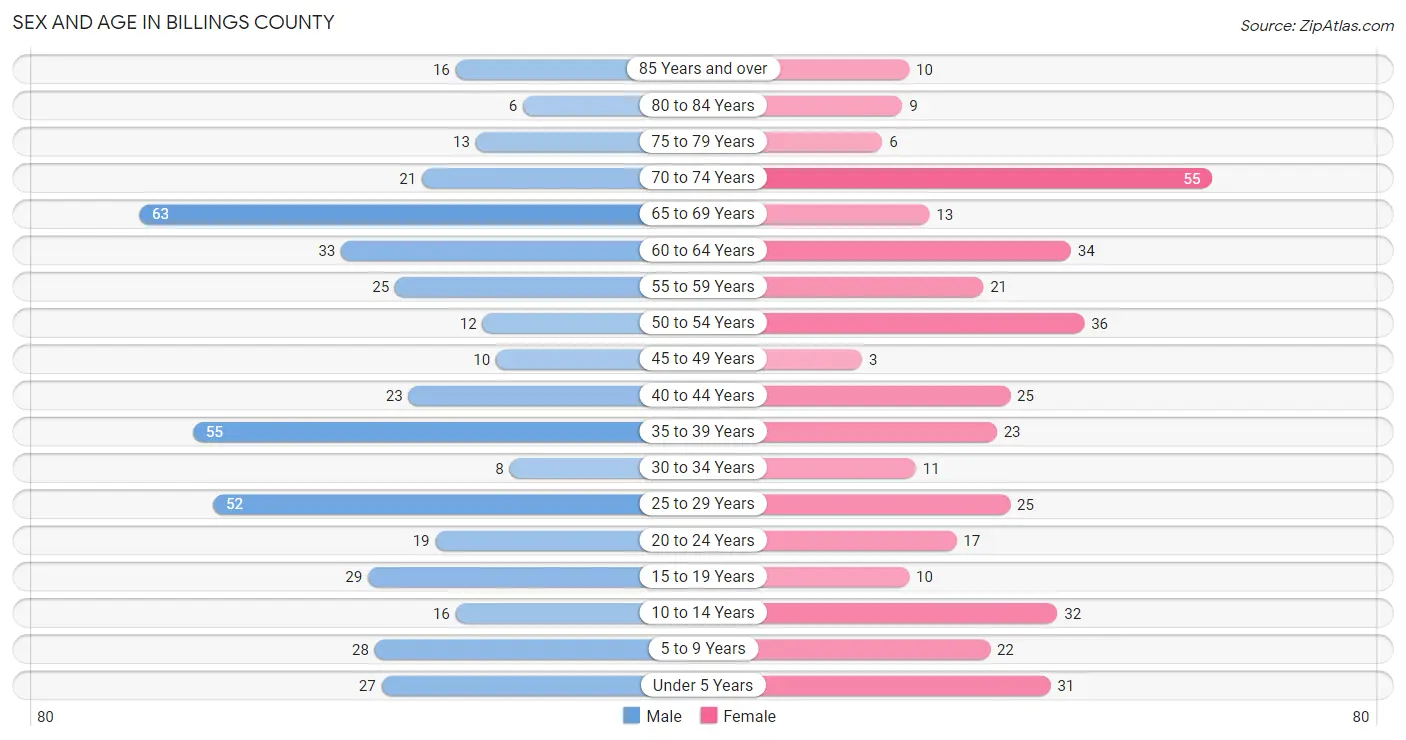
| Age Bracket | Male | Female |
| Under 5 Years | 27 (5.9%) | 31 (8.1%) |
| 5 to 9 Years | 28 (6.1%) | 22 (5.7%) |
| 10 to 14 Years | 16 (3.5%) | 32 (8.4%) |
| 15 to 19 Years | 29 (6.4%) | 10 (2.6%) |
| 20 to 24 Years | 19 (4.2%) | 17 (4.4%) |
| 25 to 29 Years | 52 (11.4%) | 25 (6.5%) |
| 30 to 34 Years | 8 (1.8%) | 11 (2.9%) |
| 35 to 39 Years | 55 (12.1%) | 23 (6.0%) |
| 40 to 44 Years | 23 (5.0%) | 25 (6.5%) |
| 45 to 49 Years | 10 (2.2%) | 3 (0.8%) |
| 50 to 54 Years | 12 (2.6%) | 36 (9.4%) |
| 55 to 59 Years | 25 (5.5%) | 21 (5.5%) |
| 60 to 64 Years | 33 (7.2%) | 34 (8.9%) |
| 65 to 69 Years | 63 (13.8%) | 13 (3.4%) |
| 70 to 74 Years | 21 (4.6%) | 55 (14.4%) |
| 75 to 79 Years | 13 (2.9%) | 6 (1.6%) |
| 80 to 84 Years | 6 (1.3%) | 9 (2.4%) |
| 85 Years and over | 16 (3.5%) | 10 (2.6%) |
| Total | 456 (100.0%) | 383 (100.0%) |
Families and Households in Billings County
Median Family Size in Billings County
The median family size in Billings County is 2.80 persons per family, with married-couple families (206 | 90.0%) accounting for the largest median family size of 2.84 persons per family. On the other hand, single male/father families (8 | 3.5%) represent the smallest median family size with 1.75 persons per family.
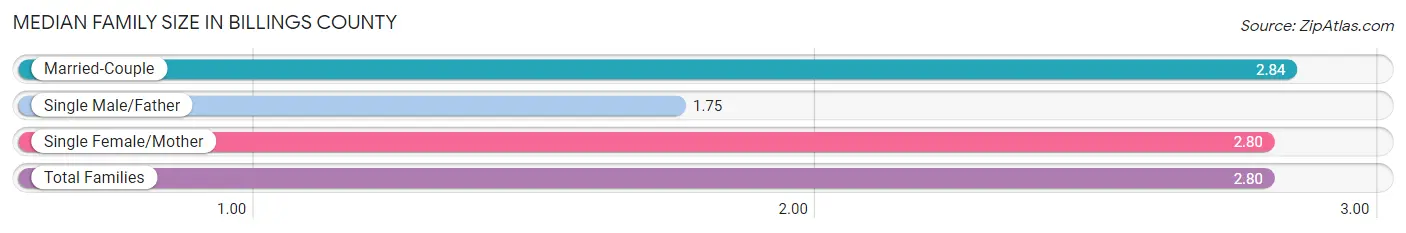
| Family Type | # Families | Family Size |
| Married-Couple | 206 (90.0%) | 2.84 |
| Single Male/Father | 8 (3.5%) | 1.75 |
| Single Female/Mother | 15 (6.6%) | 2.80 |
| Total Families | 229 (100.0%) | 2.80 |
Median Household Size in Billings County
The median household size in Billings County is 2.54 persons per household, with married-couple households (206 | 64.4%) accounting for the largest median household size of 3.07 persons per household. non-family households (91 | 28.4%) represent the smallest median household size with 1.30 persons per household.
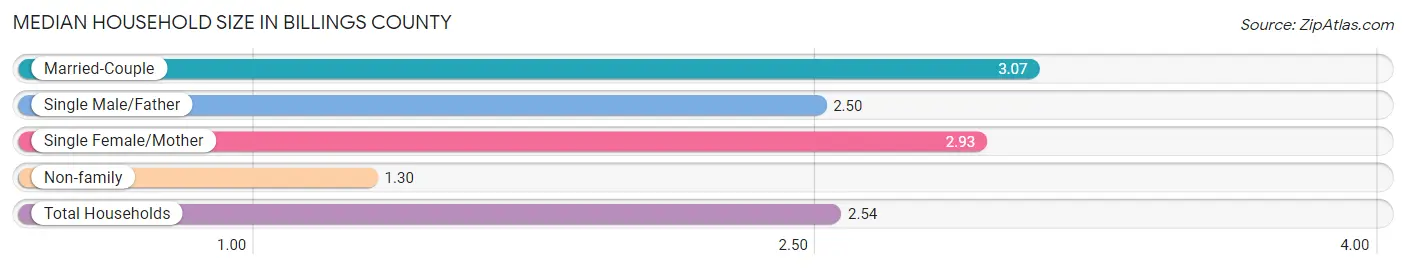
| Household Type | # Households | Household Size |
| Married-Couple | 206 (64.4%) | 3.07 |
| Single Male/Father | 8 (2.5%) | 2.50 |
| Single Female/Mother | 15 (4.7%) | 2.93 |
| Non-family | 91 (28.4%) | 1.30 |
| Total Households | 320 (100.0%) | 2.54 |
Household Size by Marriage Status in Billings County
Out of a total of 320 households in Billings County, 229 (71.6%) are family households, while 91 (28.4%) are nonfamily households. The most numerous type of family households are 2-person households, comprising 149, and the most common type of nonfamily households are 1-person households, comprising 68.
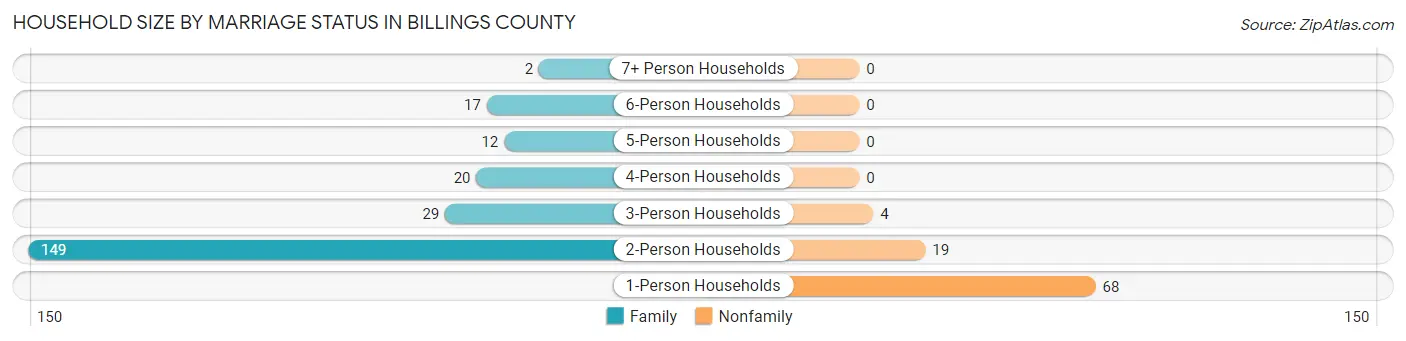
| Household Size | Family Households | Nonfamily Households |
| 1-Person Households | - | 68 (21.2%) |
| 2-Person Households | 149 (46.6%) | 19 (5.9%) |
| 3-Person Households | 29 (9.1%) | 4 (1.3%) |
| 4-Person Households | 20 (6.2%) | 0 (0.0%) |
| 5-Person Households | 12 (3.7%) | 0 (0.0%) |
| 6-Person Households | 17 (5.3%) | 0 (0.0%) |
| 7+ Person Households | 2 (0.6%) | 0 (0.0%) |
| Total | 229 (71.6%) | 91 (28.4%) |
Female Fertility in Billings County
Fertility by Age in Billings County
Average fertility rate in Billings County is 169.0 births per 1,000 women. Women in the age bracket of 20 to 34 years have the highest fertility rate with 340.0 births per 1,000 women. Women in the age bracket of 20 to 34 years acount for 90.0% of all women with births.
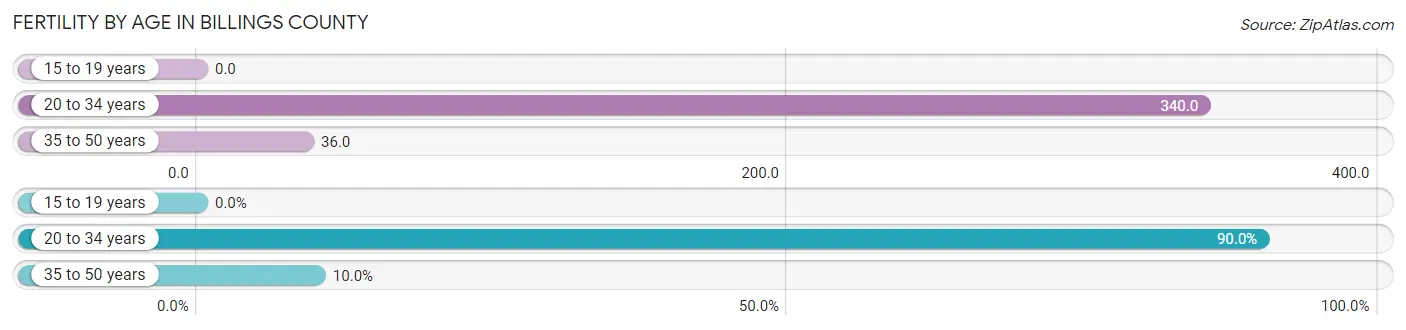
| Age Bracket | Women with Births | Births / 1,000 Women |
| 15 to 19 years | 0 (0.0%) | 0.0 |
| 20 to 34 years | 18 (90.0%) | 340.0 |
| 35 to 50 years | 2 (10.0%) | 36.0 |
| Total | 20 (100.0%) | 169.0 |
Fertility by Age by Marriage Status in Billings County
70.0% of women with births (20) in Billings County are married. The highest percentage of unmarried women with births falls into 20 to 34 years age bracket with 33.3% of them unmarried at the time of birth, while the lowest percentage of unmarried women with births belong to 35 to 50 years age bracket with 0.0% of them unmarried.
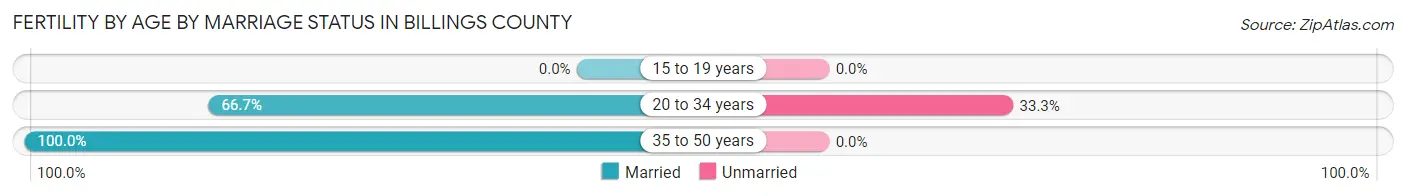
| Age Bracket | Married | Unmarried |
| 15 to 19 years | 0 (0.0%) | 0 (0.0%) |
| 20 to 34 years | 12 (66.7%) | 6 (33.3%) |
| 35 to 50 years | 2 (100.0%) | 0 (0.0%) |
| Total | 14 (70.0%) | 6 (30.0%) |
Fertility by Education in Billings County
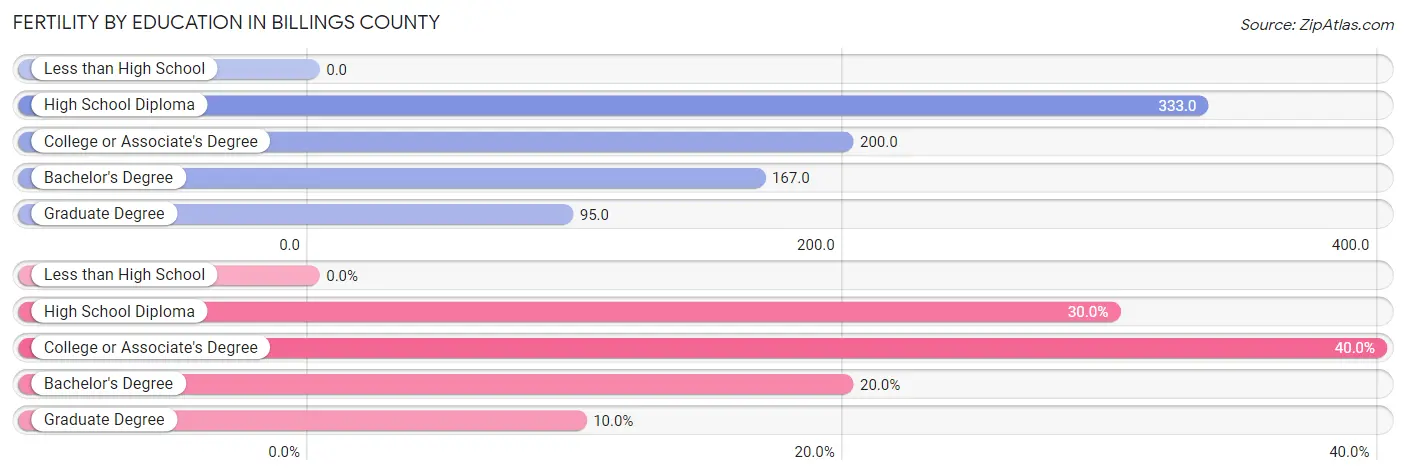
| Educational Attainment | Women with Births | Births / 1,000 Women |
| Less than High School | 0 (0.0%) | 0.0 |
| High School Diploma | 6 (30.0%) | 333.0 |
| College or Associate's Degree | 8 (40.0%) | 200.0 |
| Bachelor's Degree | 4 (20.0%) | 167.0 |
| Graduate Degree | 2 (10.0%) | 95.0 |
| Total | 20 (100.0%) | 169.0 |
Fertility by Education by Marriage Status in Billings County
30.0% of women with births in Billings County are unmarried. Women with the educational attainment of college or associate's degree are most likely to be married with 100.0% of them married at childbirth, while women with the educational attainment of high school diploma are least likely to be married with 100.0% of them unmarried at childbirth.
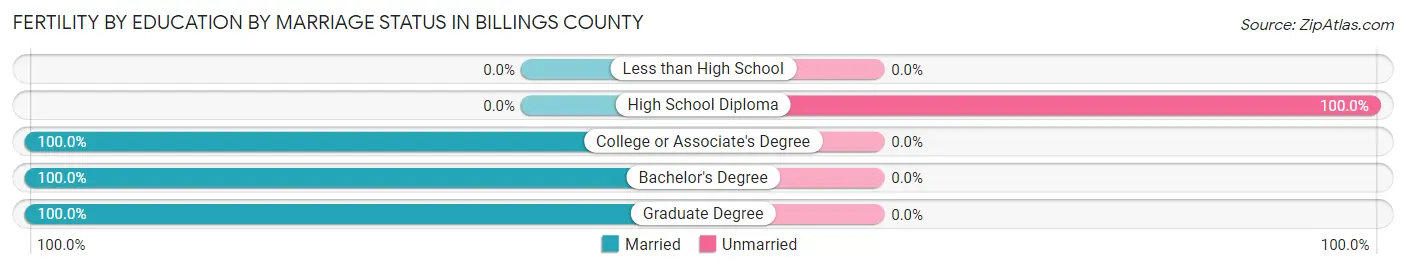
| Educational Attainment | Married | Unmarried |
| Less than High School | 0 (0.0%) | 0 (0.0%) |
| High School Diploma | 0 (0.0%) | 6 (100.0%) |
| College or Associate's Degree | 8 (100.0%) | 0 (0.0%) |
| Bachelor's Degree | 4 (100.0%) | 0 (0.0%) |
| Graduate Degree | 2 (100.0%) | 0 (0.0%) |
| Total | 14 (70.0%) | 6 (30.0%) |
Employment Characteristics in Billings County
Employment by Class of Employer in Billings County
Among the 418 employed individuals in Billings County, private company employees (171 | 40.9%), self-employed (not incorporated) (87 | 20.8%), and not-for-profit organizations (57 | 13.6%) make up the most common classes of employment.
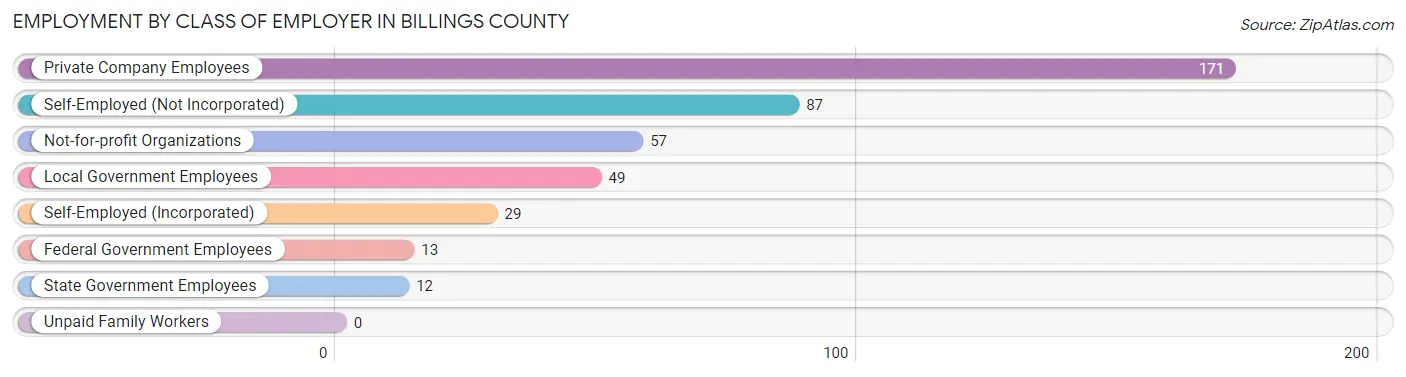
| Employer Class | # Employees | % Employees |
| Private Company Employees | 171 | 40.9% |
| Self-Employed (Incorporated) | 29 | 6.9% |
| Self-Employed (Not Incorporated) | 87 | 20.8% |
| Not-for-profit Organizations | 57 | 13.6% |
| Local Government Employees | 49 | 11.7% |
| State Government Employees | 12 | 2.9% |
| Federal Government Employees | 13 | 3.1% |
| Unpaid Family Workers | 0 | 0.0% |
| Total | 418 | 100.0% |
Employment Status by Age in Billings County
According to the labor force statistics for Billings County, out of the total population over 16 years of age (681), 63.3% or 431 individuals are in the labor force, with 2.1% or 9 of them unemployed. The age group with the highest labor force participation rate is 16 to 19 years, with 97.3% or 36 individuals in the labor force. Within the labor force, the 30 to 34 years age range has the highest percentage of unemployed individuals, with 29.4% or 5 of them being unemployed.
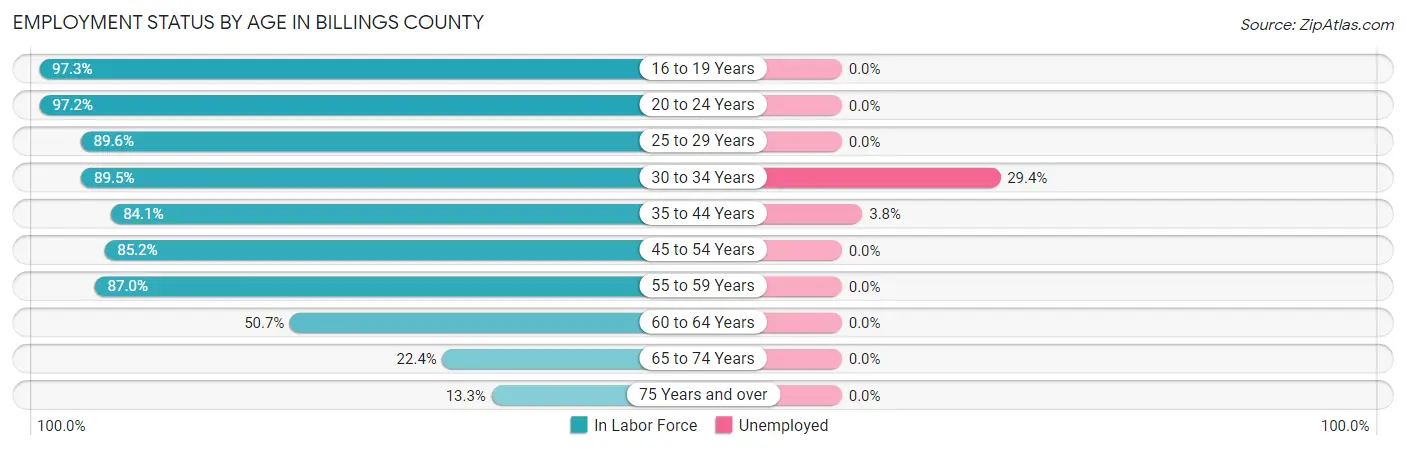
| Age Bracket | In Labor Force | Unemployed |
| 16 to 19 Years | 36 (97.3%) | 0 (0.0%) |
| 20 to 24 Years | 35 (97.2%) | 0 (0.0%) |
| 25 to 29 Years | 69 (89.6%) | 0 (0.0%) |
| 30 to 34 Years | 17 (89.5%) | 5 (29.4%) |
| 35 to 44 Years | 106 (84.1%) | 4 (3.8%) |
| 45 to 54 Years | 52 (85.2%) | 0 (0.0%) |
| 55 to 59 Years | 40 (87.0%) | 0 (0.0%) |
| 60 to 64 Years | 34 (50.7%) | 0 (0.0%) |
| 65 to 74 Years | 34 (22.4%) | 0 (0.0%) |
| 75 Years and over | 8 (13.3%) | 0 (0.0%) |
| Total | 431 (63.3%) | 9 (2.1%) |
Employment Status by Educational Attainment in Billings County
According to labor force statistics for Billings County, 80.3% of individuals (318) out of the total population between 25 and 64 years of age (396) are in the labor force, with 2.8% or 9 of them being unemployed. The group with the highest labor force participation rate are those with the educational attainment of bachelor's degree or higher, with 88.4% or 122 individuals in the labor force. Within the labor force, individuals with high school diploma education have the highest percentage of unemployment, with 4.2% or 4 of them being unemployed.
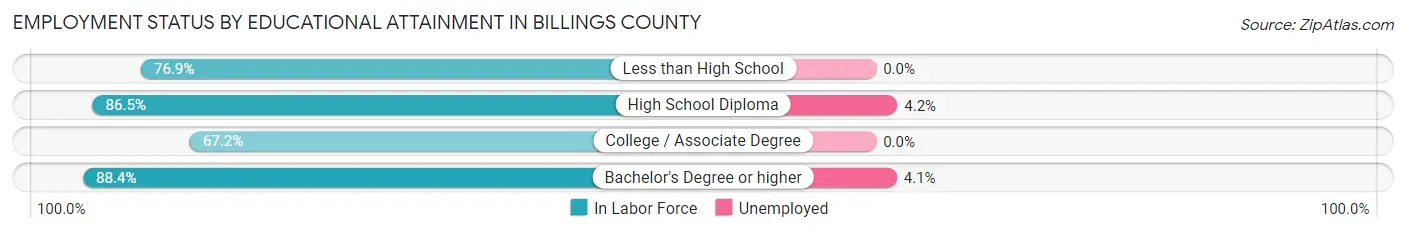
| Educational Attainment | In Labor Force | Unemployed |
| Less than High School | 10 (76.9%) | 0 (0.0%) |
| High School Diploma | 96 (86.5%) | 5 (4.2%) |
| College / Associate Degree | 90 (67.2%) | 0 (0.0%) |
| Bachelor's Degree or higher | 122 (88.4%) | 6 (4.1%) |
| Total | 318 (80.3%) | 11 (2.8%) |
Employment Occupations by Sex in Billings County
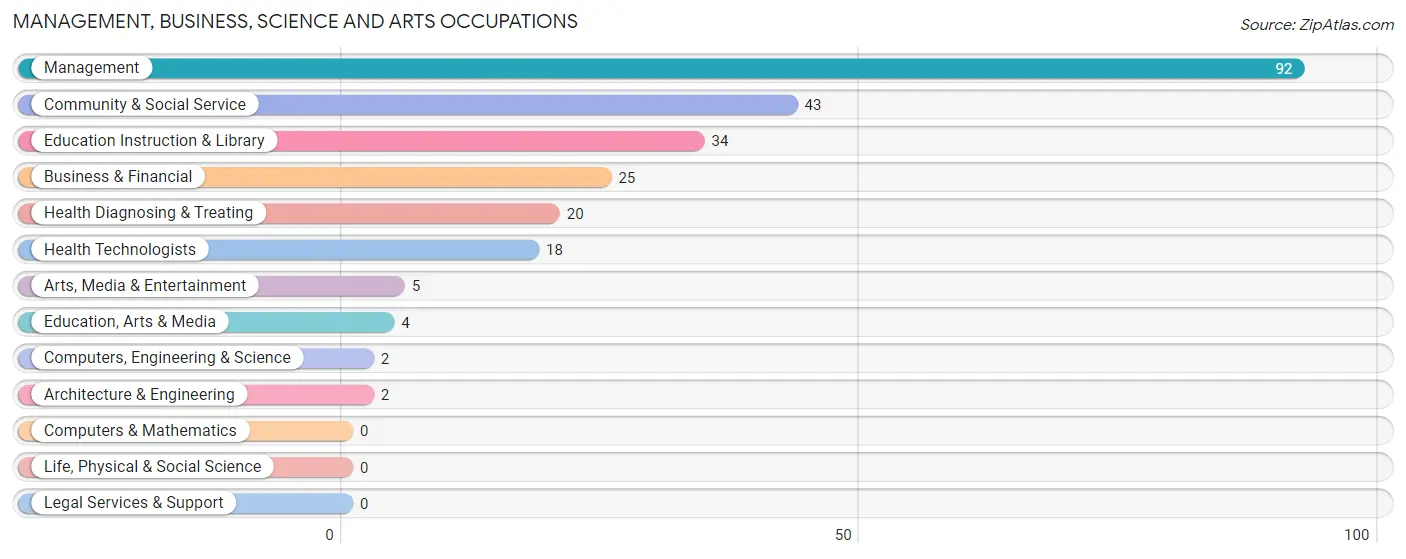
Management, Business, Science and Arts Occupations
The most common Management, Business, Science and Arts occupations in Billings County are Management (92 | 21.8%), Community & Social Service (43 | 10.2%), Education Instruction & Library (34 | 8.1%), Business & Financial (25 | 5.9%), and Health Diagnosing & Treating (20 | 4.7%).
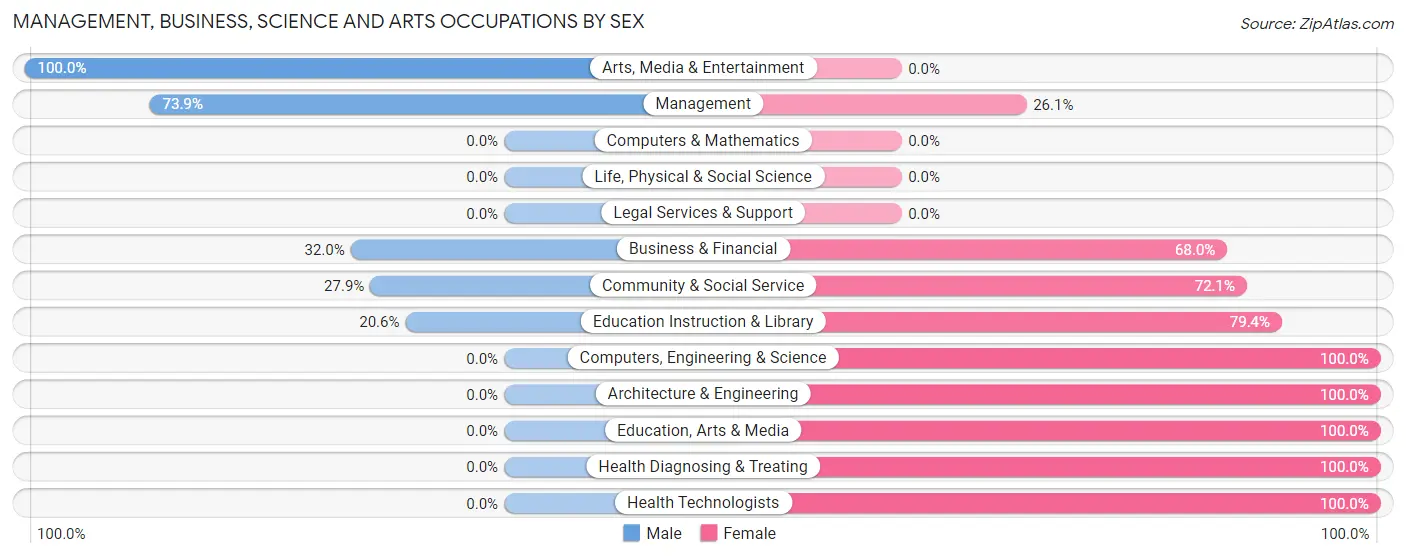
Management, Business, Science and Arts Occupations by Sex
Within the Management, Business, Science and Arts occupations in Billings County, the most male-oriented occupations are Arts, Media & Entertainment (100.0%), Management (73.9%), and Business & Financial (32.0%), while the most female-oriented occupations are Computers, Engineering & Science (100.0%), Architecture & Engineering (100.0%), and Education, Arts & Media (100.0%).
| Occupation | Male | Female |
| Management | 68 (73.9%) | 24 (26.1%) |
| Business & Financial | 8 (32.0%) | 17 (68.0%) |
| Computers, Engineering & Science | 0 (0.0%) | 2 (100.0%) |
| Computers & Mathematics | 0 (0.0%) | 0 (0.0%) |
| Architecture & Engineering | 0 (0.0%) | 2 (100.0%) |
| Life, Physical & Social Science | 0 (0.0%) | 0 (0.0%) |
| Community & Social Service | 12 (27.9%) | 31 (72.1%) |
| Education, Arts & Media | 0 (0.0%) | 4 (100.0%) |
| Legal Services & Support | 0 (0.0%) | 0 (0.0%) |
| Education Instruction & Library | 7 (20.6%) | 27 (79.4%) |
| Arts, Media & Entertainment | 5 (100.0%) | 0 (0.0%) |
| Health Diagnosing & Treating | 0 (0.0%) | 20 (100.0%) |
| Health Technologists | 0 (0.0%) | 18 (100.0%) |
| Total (Category) | 88 (48.3%) | 94 (51.6%) |
| Total (Overall) | 248 (58.8%) | 174 (41.2%) |
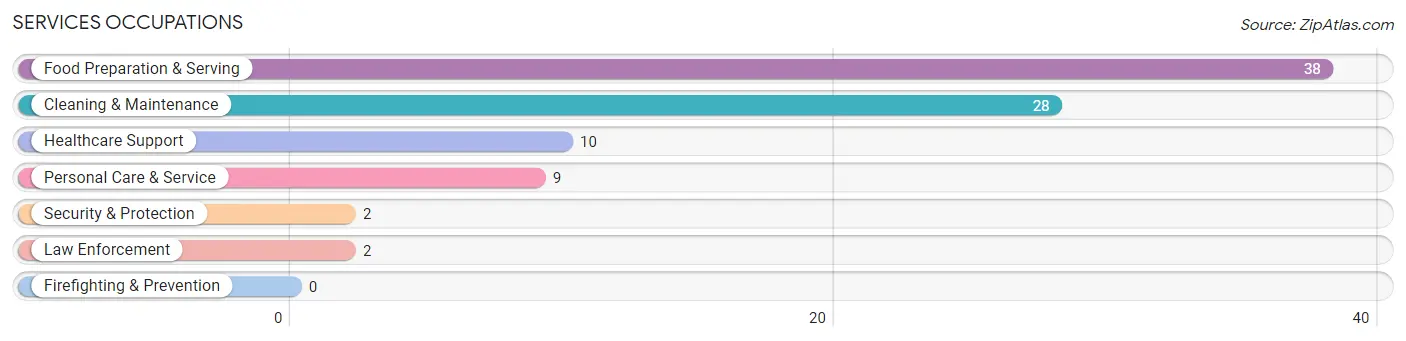
Services Occupations
The most common Services occupations in Billings County are Food Preparation & Serving (38 | 9.0%), Cleaning & Maintenance (28 | 6.6%), Healthcare Support (10 | 2.4%), Personal Care & Service (9 | 2.1%), and Security & Protection (2 | 0.5%).
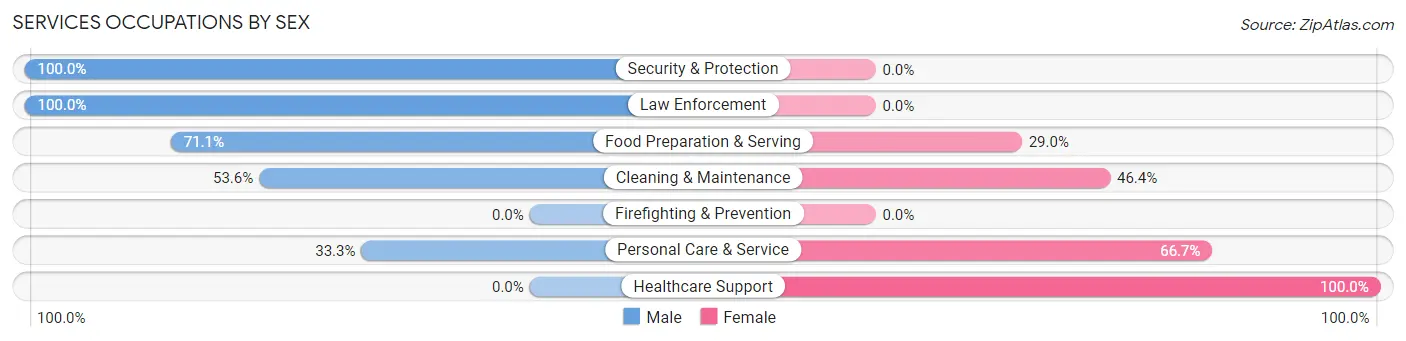
Services Occupations by Sex
Within the Services occupations in Billings County, the most male-oriented occupations are Security & Protection (100.0%), Law Enforcement (100.0%), and Food Preparation & Serving (71.1%), while the most female-oriented occupations are Healthcare Support (100.0%), Personal Care & Service (66.7%), and Cleaning & Maintenance (46.4%).
| Occupation | Male | Female |
| Healthcare Support | 0 (0.0%) | 10 (100.0%) |
| Security & Protection | 2 (100.0%) | 0 (0.0%) |
| Firefighting & Prevention | 0 (0.0%) | 0 (0.0%) |
| Law Enforcement | 2 (100.0%) | 0 (0.0%) |
| Food Preparation & Serving | 27 (71.1%) | 11 (28.9%) |
| Cleaning & Maintenance | 15 (53.6%) | 13 (46.4%) |
| Personal Care & Service | 3 (33.3%) | 6 (66.7%) |
| Total (Category) | 47 (54.0%) | 40 (46.0%) |
| Total (Overall) | 248 (58.8%) | 174 (41.2%) |
Sales and Office Occupations
The most common Sales and Office occupations in Billings County are Office & Administration (30 | 7.1%), and Sales & Related (22 | 5.2%).
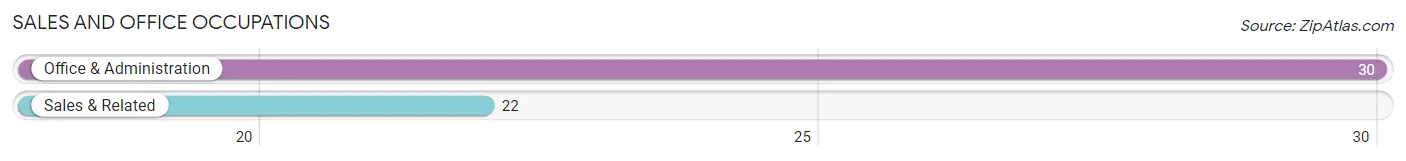
Sales and Office Occupations by Sex
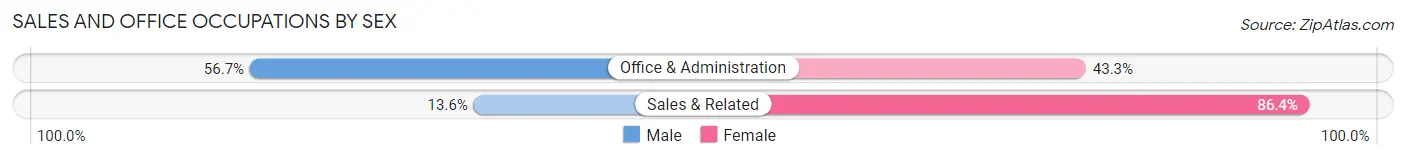
| Occupation | Male | Female |
| Sales & Related | 3 (13.6%) | 19 (86.4%) |
| Office & Administration | 17 (56.7%) | 13 (43.3%) |
| Total (Category) | 20 (38.5%) | 32 (61.5%) |
| Total (Overall) | 248 (58.8%) | 174 (41.2%) |
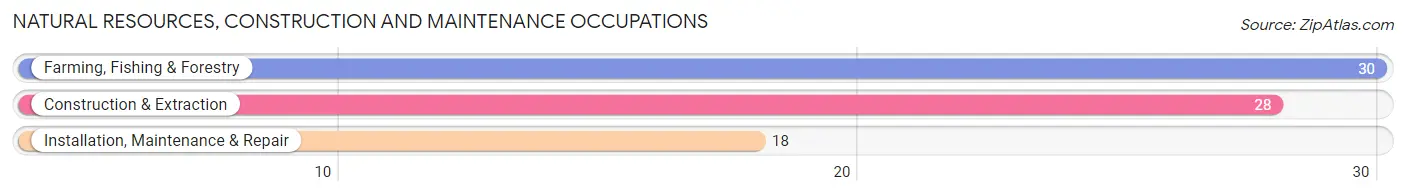
Natural Resources, Construction and Maintenance Occupations
The most common Natural Resources, Construction and Maintenance occupations in Billings County are Farming, Fishing & Forestry (30 | 7.1%), Construction & Extraction (28 | 6.6%), and Installation, Maintenance & Repair (18 | 4.3%).
Natural Resources, Construction and Maintenance Occupations by Sex
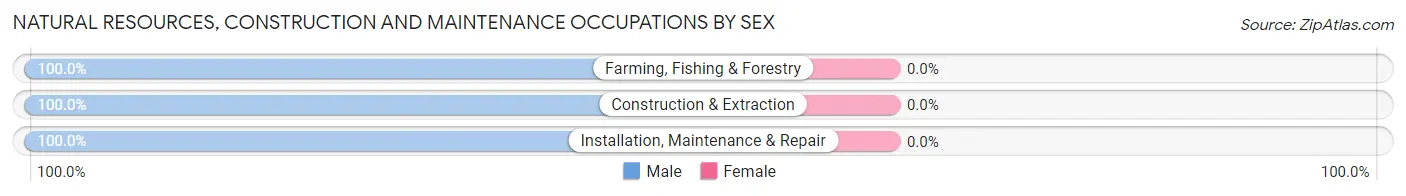
| Occupation | Male | Female |
| Farming, Fishing & Forestry | 30 (100.0%) | 0 (0.0%) |
| Construction & Extraction | 28 (100.0%) | 0 (0.0%) |
| Installation, Maintenance & Repair | 18 (100.0%) | 0 (0.0%) |
| Total (Category) | 76 (100.0%) | 0 (0.0%) |
| Total (Overall) | 248 (58.8%) | 174 (41.2%) |
Production, Transportation and Moving Occupations
The most common Production, Transportation and Moving occupations in Billings County are Production (19 | 4.5%), and Transportation (6 | 1.4%).
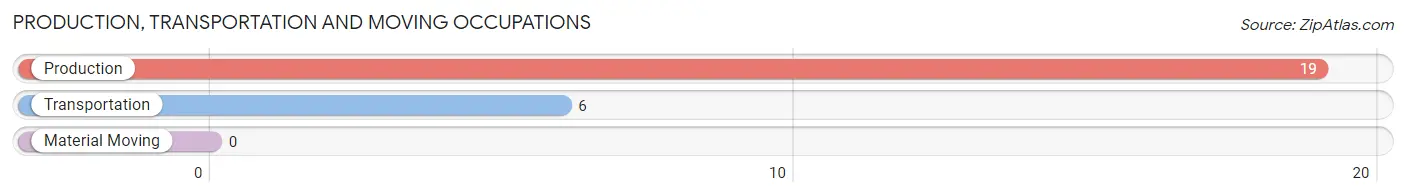
Production, Transportation and Moving Occupations by Sex
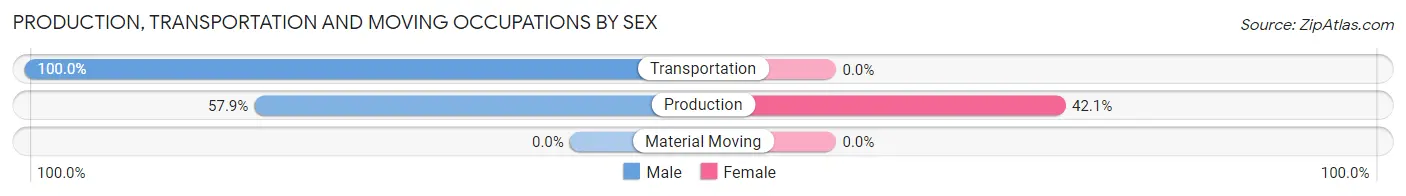
| Occupation | Male | Female |
| Production | 11 (57.9%) | 8 (42.1%) |
| Transportation | 6 (100.0%) | 0 (0.0%) |
| Material Moving | 0 (0.0%) | 0 (0.0%) |
| Total (Category) | 17 (68.0%) | 8 (32.0%) |
| Total (Overall) | 248 (58.8%) | 174 (41.2%) |
Employment Industries by Sex in Billings County
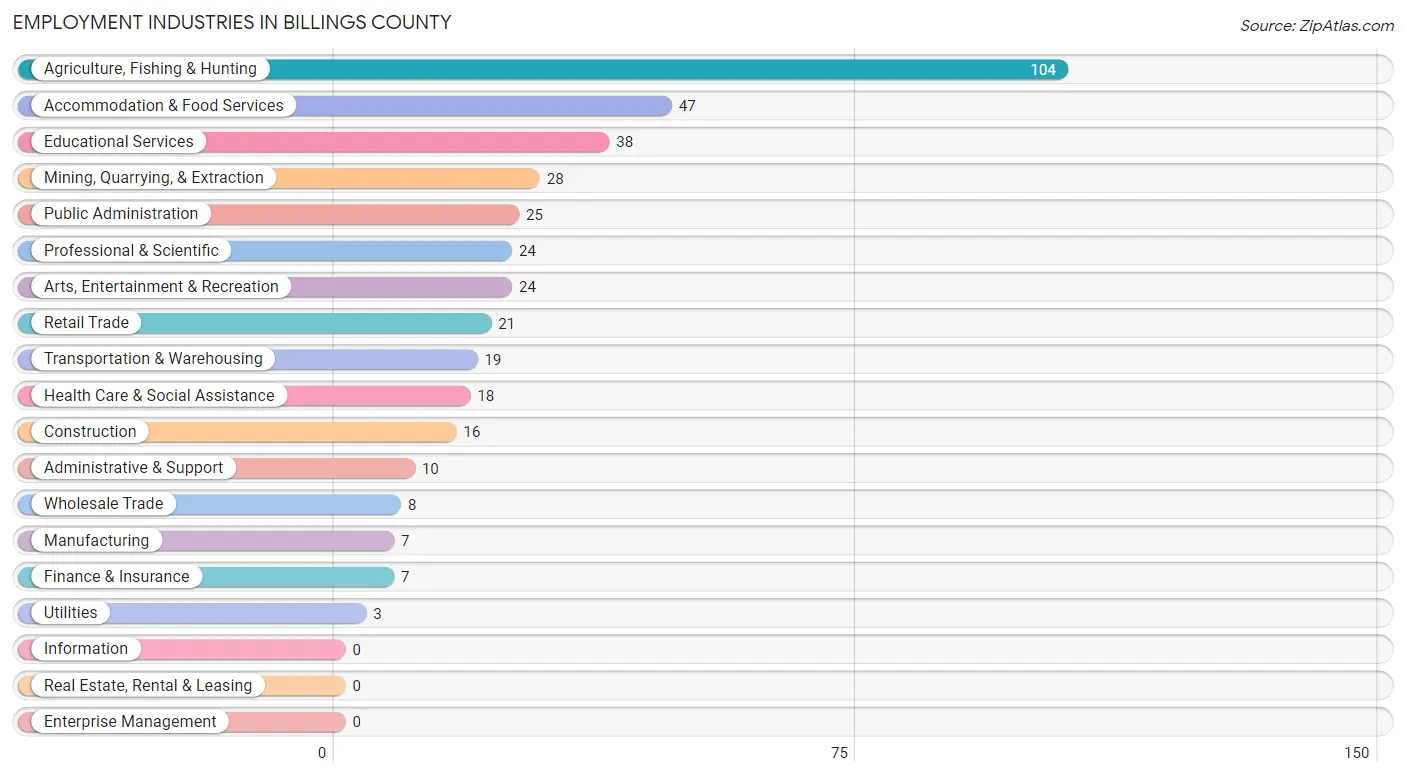
Employment Industries in Billings County
The major employment industries in Billings County include Agriculture, Fishing & Hunting (104 | 24.6%), Accommodation & Food Services (47 | 11.1%), Educational Services (38 | 9.0%), Mining, Quarrying, & Extraction (28 | 6.6%), and Public Administration (25 | 5.9%).
Employment Industries by Sex in Billings County
The Billings County industries that see more men than women are Wholesale Trade (100.0%), Utilities (100.0%), and Mining, Quarrying, & Extraction (92.9%), whereas the industries that tend to have a higher number of women are Manufacturing (100.0%), Retail Trade (100.0%), and Professional & Scientific (100.0%).
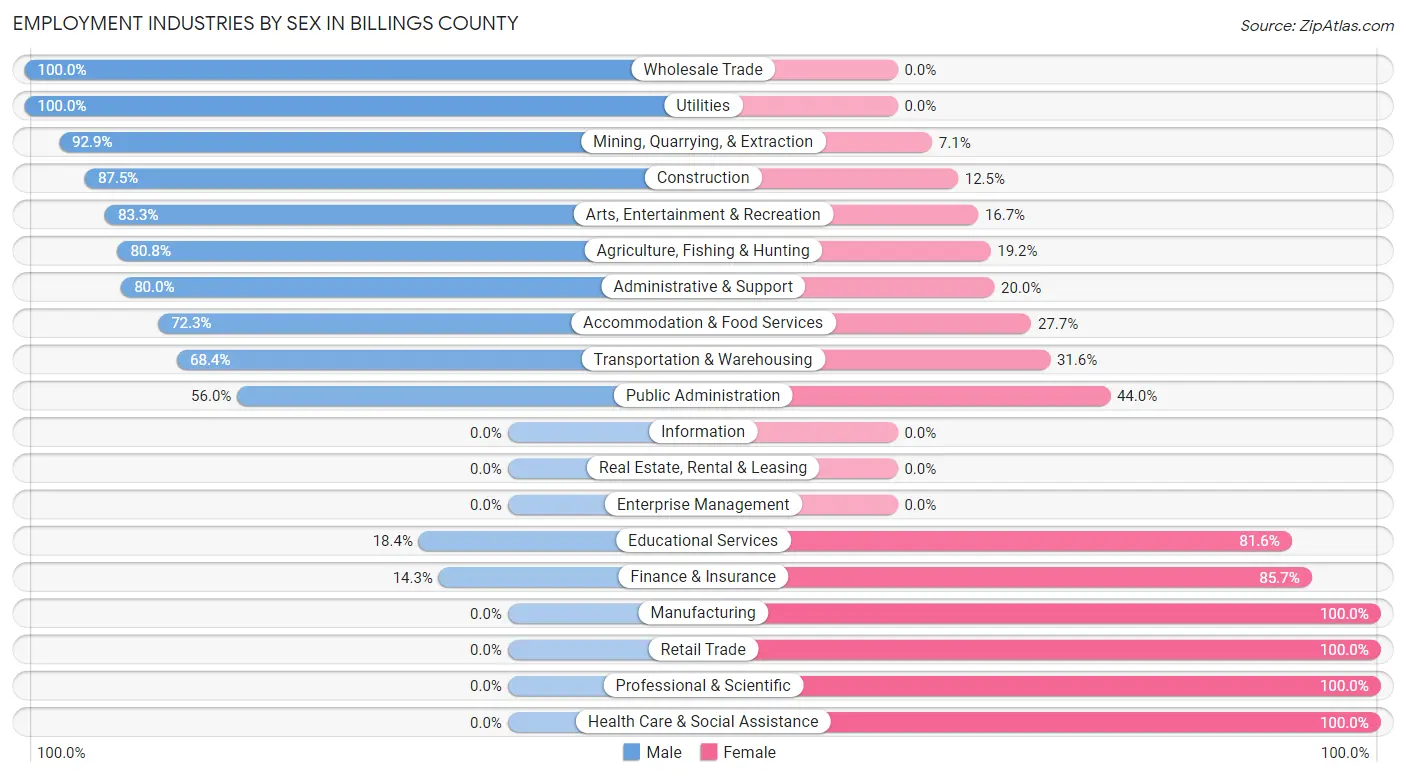
| Industry | Male | Female |
| Agriculture, Fishing & Hunting | 84 (80.8%) | 20 (19.2%) |
| Mining, Quarrying, & Extraction | 26 (92.9%) | 2 (7.1%) |
| Construction | 14 (87.5%) | 2 (12.5%) |
| Manufacturing | 0 (0.0%) | 7 (100.0%) |
| Wholesale Trade | 8 (100.0%) | 0 (0.0%) |
| Retail Trade | 0 (0.0%) | 21 (100.0%) |
| Transportation & Warehousing | 13 (68.4%) | 6 (31.6%) |
| Utilities | 3 (100.0%) | 0 (0.0%) |
| Information | 0 (0.0%) | 0 (0.0%) |
| Finance & Insurance | 1 (14.3%) | 6 (85.7%) |
| Real Estate, Rental & Leasing | 0 (0.0%) | 0 (0.0%) |
| Professional & Scientific | 0 (0.0%) | 24 (100.0%) |
| Enterprise Management | 0 (0.0%) | 0 (0.0%) |
| Administrative & Support | 8 (80.0%) | 2 (20.0%) |
| Educational Services | 7 (18.4%) | 31 (81.6%) |
| Health Care & Social Assistance | 0 (0.0%) | 18 (100.0%) |
| Arts, Entertainment & Recreation | 20 (83.3%) | 4 (16.7%) |
| Accommodation & Food Services | 34 (72.3%) | 13 (27.7%) |
| Public Administration | 14 (56.0%) | 11 (44.0%) |
| Total | 248 (58.8%) | 174 (41.2%) |
Education in Billings County
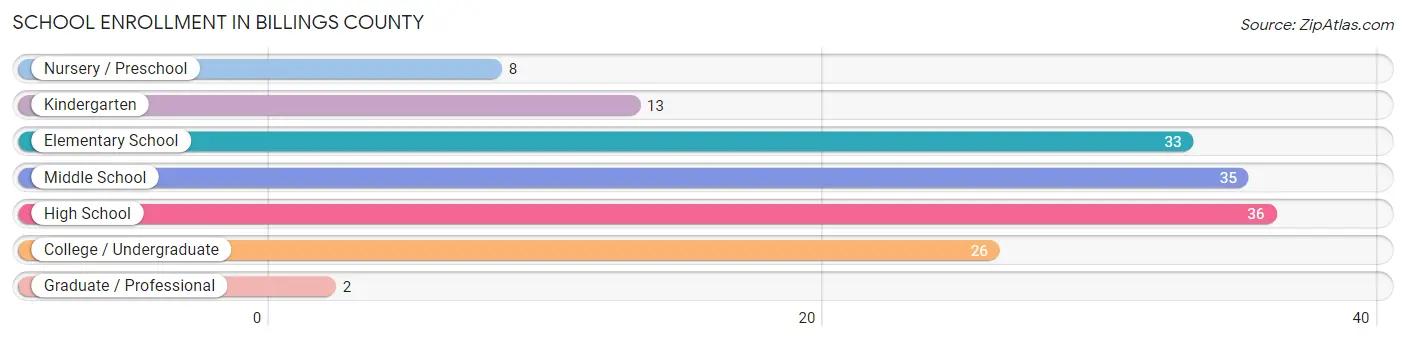
School Enrollment in Billings County
The most common levels of schooling among the 153 students in Billings County are high school (36 | 23.5%), middle school (35 | 22.9%), and elementary school (33 | 21.6%).
| School Level | # Students | % Students |
| Nursery / Preschool | 8 | 5.2% |
| Kindergarten | 13 | 8.5% |
| Elementary School | 33 | 21.6% |
| Middle School | 35 | 22.9% |
| High School | 36 | 23.5% |
| College / Undergraduate | 26 | 17.0% |
| Graduate / Professional | 2 | 1.3% |
| Total | 153 | 100.0% |
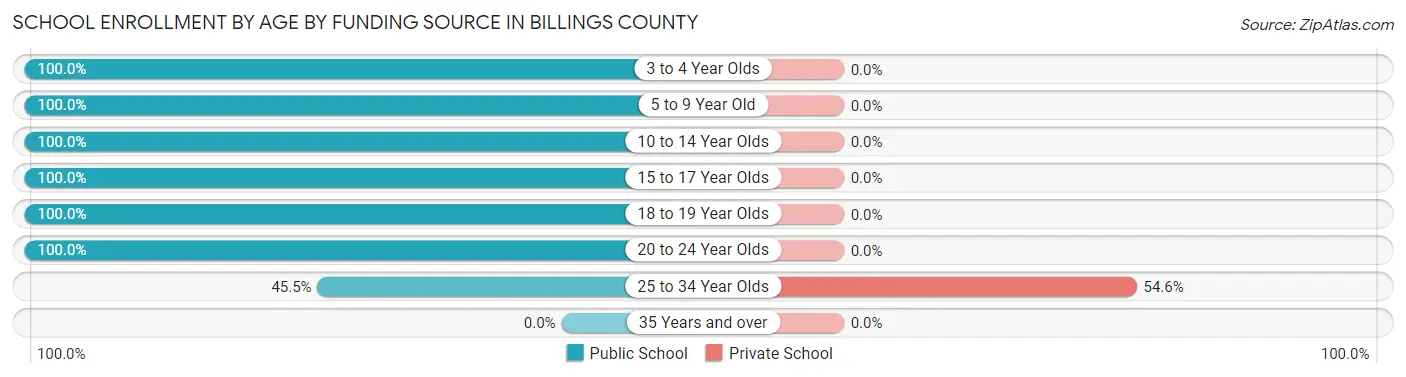
School Enrollment by Age by Funding Source in Billings County
Out of a total of 153 students who are enrolled in schools in Billings County, 12 (7.8%) attend a private institution, while the remaining 141 (92.2%) are enrolled in public schools. The age group of 25 to 34 year olds has the highest likelihood of being enrolled in private schools, with 12 (54.5% in the age bracket) enrolled. Conversely, the age group of 3 to 4 year olds has the lowest likelihood of being enrolled in a private school, with 3 (100.0% in the age bracket) attending a public institution.
| Age Bracket | Public School | Private School |
| 3 to 4 Year Olds | 3 (100.0%) | 0 (0.0%) |
| 5 to 9 Year Old | 47 (100.0%) | 0 (0.0%) |
| 10 to 14 Year Olds | 43 (100.0%) | 0 (0.0%) |
| 15 to 17 Year Olds | 13 (100.0%) | 0 (0.0%) |
| 18 to 19 Year Olds | 19 (100.0%) | 0 (0.0%) |
| 20 to 24 Year Olds | 6 (100.0%) | 0 (0.0%) |
| 25 to 34 Year Olds | 10 (45.5%) | 12 (54.5%) |
| 35 Years and over | 0 (0.0%) | 0 (0.0%) |
| Total | 141 (92.2%) | 12 (7.8%) |
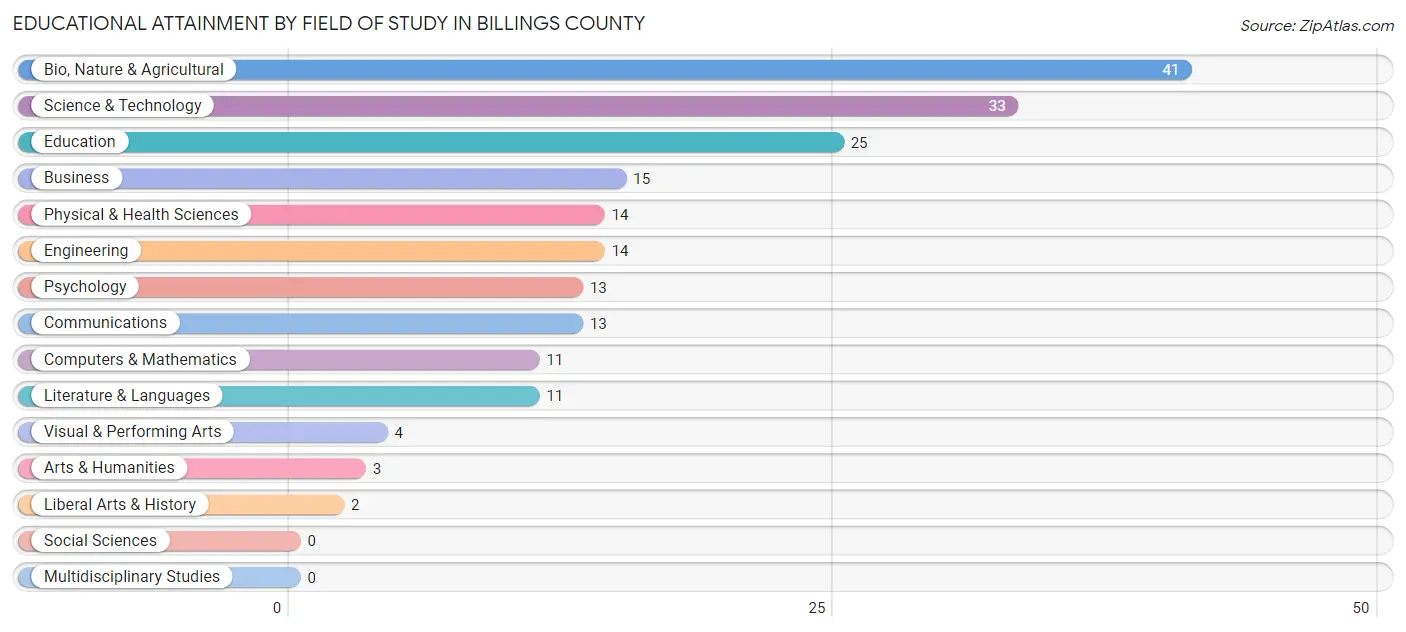
Educational Attainment by Field of Study in Billings County
Bio, nature & agricultural (41 | 20.6%), science & technology (33 | 16.6%), education (25 | 12.6%), business (15 | 7.5%), and physical & health sciences (14 | 7.0%) are the most common fields of study among 199 individuals in Billings County who have obtained a bachelor's degree or higher.
| Field of Study | # Graduates | % Graduates |
| Computers & Mathematics | 11 | 5.5% |
| Bio, Nature & Agricultural | 41 | 20.6% |
| Physical & Health Sciences | 14 | 7.0% |
| Psychology | 13 | 6.5% |
| Social Sciences | 0 | 0.0% |
| Engineering | 14 | 7.0% |
| Multidisciplinary Studies | 0 | 0.0% |
| Science & Technology | 33 | 16.6% |
| Business | 15 | 7.5% |
| Education | 25 | 12.6% |
| Literature & Languages | 11 | 5.5% |
| Liberal Arts & History | 2 | 1.0% |
| Visual & Performing Arts | 4 | 2.0% |
| Communications | 13 | 6.5% |
| Arts & Humanities | 3 | 1.5% |
| Total | 199 | 100.0% |
Transportation & Commute in Billings County
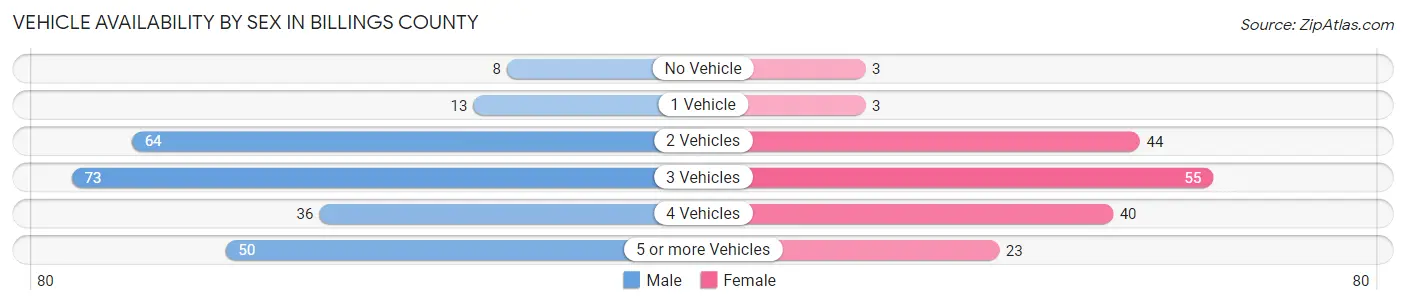
Vehicle Availability by Sex in Billings County
The most prevalent vehicle ownership categories in Billings County are males with 3 vehicles (73, accounting for 29.9%) and females with 3 vehicles (55, making up 43.4%).
| Vehicles Available | Male | Female |
| No Vehicle | 8 (3.3%) | 3 (1.8%) |
| 1 Vehicle | 13 (5.3%) | 3 (1.8%) |
| 2 Vehicles | 64 (26.2%) | 44 (26.2%) |
| 3 Vehicles | 73 (29.9%) | 55 (32.7%) |
| 4 Vehicles | 36 (14.7%) | 40 (23.8%) |
| 5 or more Vehicles | 50 (20.5%) | 23 (13.7%) |
| Total | 244 (100.0%) | 168 (100.0%) |
Commute Time in Billings County
The most frequently occuring commute durations in Billings County are less than 5 minutes (82 commuters, 22.8%), 30 to 34 minutes (59 commuters, 16.4%), and 20 to 24 minutes (54 commuters, 15.0%).
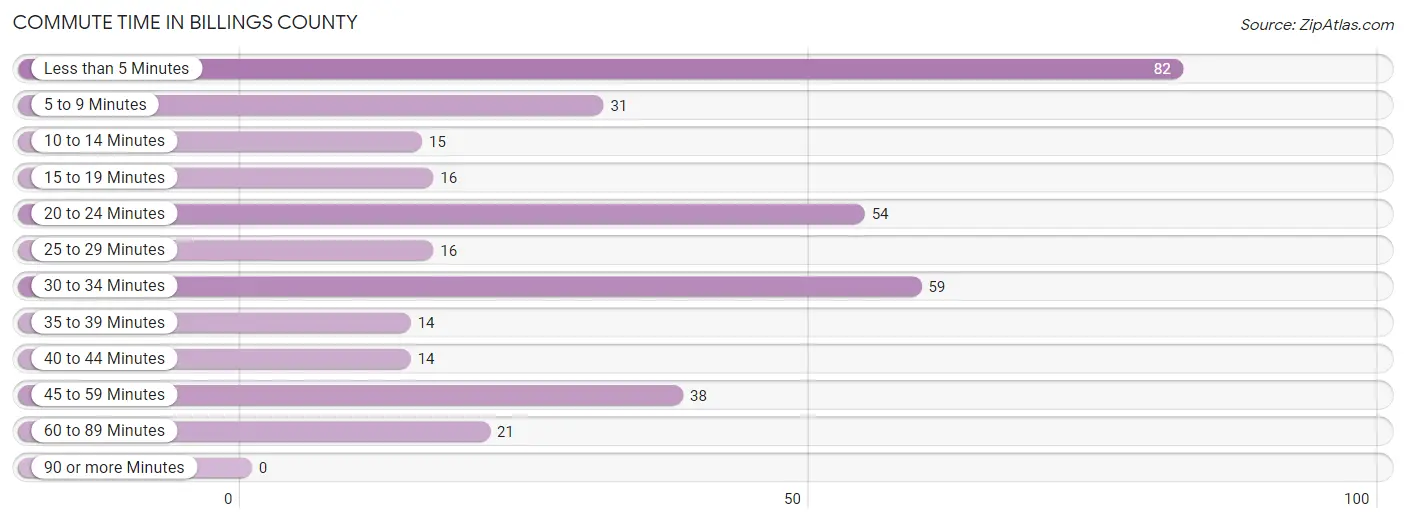
| Commute Time | # Commuters | % Commuters |
| Less than 5 Minutes | 82 | 22.8% |
| 5 to 9 Minutes | 31 | 8.6% |
| 10 to 14 Minutes | 15 | 4.2% |
| 15 to 19 Minutes | 16 | 4.4% |
| 20 to 24 Minutes | 54 | 15.0% |
| 25 to 29 Minutes | 16 | 4.4% |
| 30 to 34 Minutes | 59 | 16.4% |
| 35 to 39 Minutes | 14 | 3.9% |
| 40 to 44 Minutes | 14 | 3.9% |
| 45 to 59 Minutes | 38 | 10.6% |
| 60 to 89 Minutes | 21 | 5.8% |
| 90 or more Minutes | 0 | 0.0% |
Commute Time by Sex in Billings County
The most common commute times in Billings County are less than 5 minutes (69 commuters, 33.0%) for males and 30 to 34 minutes (29 commuters, 19.2%) for females.
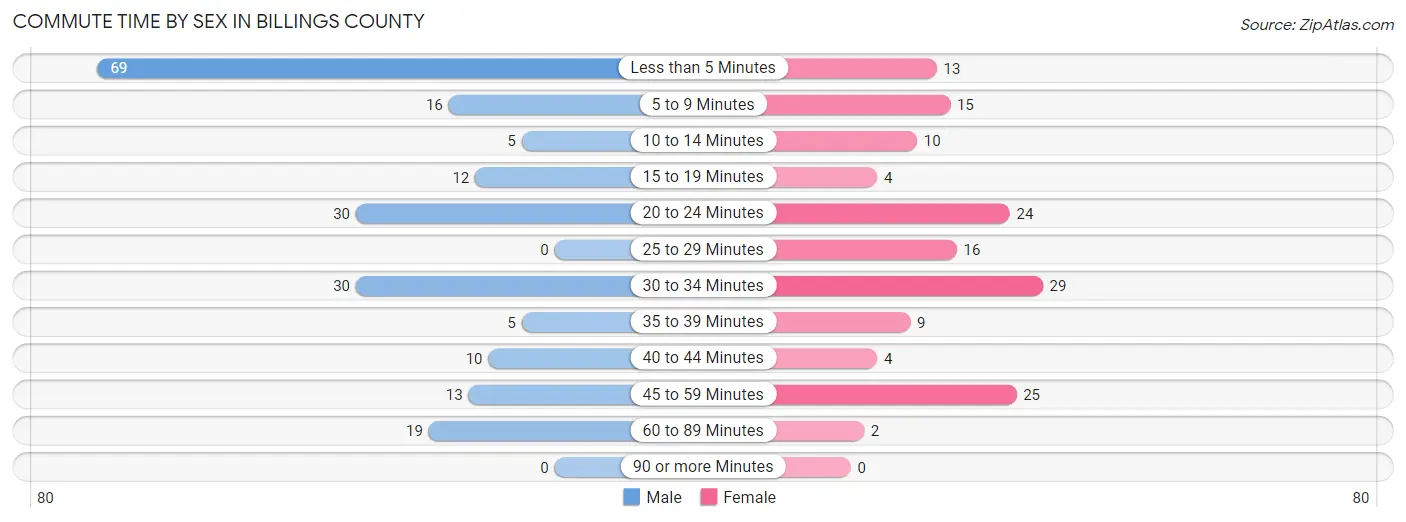
| Commute Time | Male | Female |
| Less than 5 Minutes | 69 (33.0%) | 13 (8.6%) |
| 5 to 9 Minutes | 16 (7.7%) | 15 (9.9%) |
| 10 to 14 Minutes | 5 (2.4%) | 10 (6.6%) |
| 15 to 19 Minutes | 12 (5.7%) | 4 (2.6%) |
| 20 to 24 Minutes | 30 (14.3%) | 24 (15.9%) |
| 25 to 29 Minutes | 0 (0.0%) | 16 (10.6%) |
| 30 to 34 Minutes | 30 (14.3%) | 29 (19.2%) |
| 35 to 39 Minutes | 5 (2.4%) | 9 (6.0%) |
| 40 to 44 Minutes | 10 (4.8%) | 4 (2.6%) |
| 45 to 59 Minutes | 13 (6.2%) | 25 (16.6%) |
| 60 to 89 Minutes | 19 (9.1%) | 2 (1.3%) |
| 90 or more Minutes | 0 (0.0%) | 0 (0.0%) |
Time of Departure to Work by Sex in Billings County
The most frequent times of departure to work in Billings County are 6:00 AM to 6:29 AM (52, 24.9%) for males and 7:30 AM to 7:59 AM (29, 19.2%) for females.
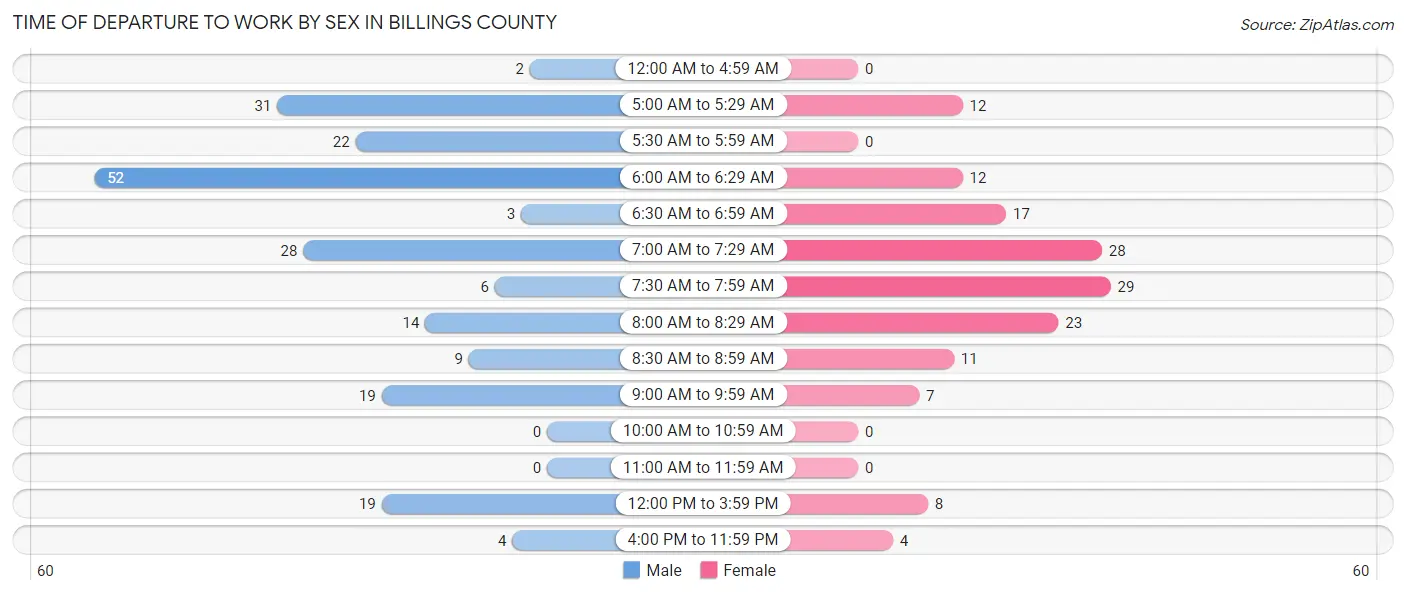
| Time of Departure | Male | Female |
| 12:00 AM to 4:59 AM | 2 (1.0%) | 0 (0.0%) |
| 5:00 AM to 5:29 AM | 31 (14.8%) | 12 (8.0%) |
| 5:30 AM to 5:59 AM | 22 (10.5%) | 0 (0.0%) |
| 6:00 AM to 6:29 AM | 52 (24.9%) | 12 (8.0%) |
| 6:30 AM to 6:59 AM | 3 (1.4%) | 17 (11.3%) |
| 7:00 AM to 7:29 AM | 28 (13.4%) | 28 (18.5%) |
| 7:30 AM to 7:59 AM | 6 (2.9%) | 29 (19.2%) |
| 8:00 AM to 8:29 AM | 14 (6.7%) | 23 (15.2%) |
| 8:30 AM to 8:59 AM | 9 (4.3%) | 11 (7.3%) |
| 9:00 AM to 9:59 AM | 19 (9.1%) | 7 (4.6%) |
| 10:00 AM to 10:59 AM | 0 (0.0%) | 0 (0.0%) |
| 11:00 AM to 11:59 AM | 0 (0.0%) | 0 (0.0%) |
| 12:00 PM to 3:59 PM | 19 (9.1%) | 8 (5.3%) |
| 4:00 PM to 11:59 PM | 4 (1.9%) | 4 (2.6%) |
| Total | 209 (100.0%) | 151 (100.0%) |
Housing Occupancy in Billings County
Occupancy by Ownership in Billings County
Of the total 320 dwellings in Billings County, owner-occupied units account for 237 (74.1%), while renter-occupied units make up 83 (25.9%).
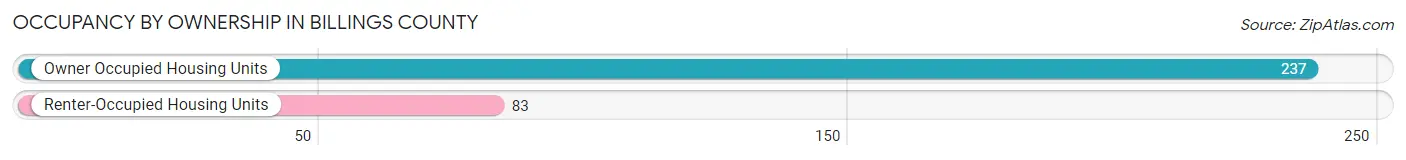
| Occupancy | # Housing Units | % Housing Units |
| Owner Occupied Housing Units | 237 | 74.1% |
| Renter-Occupied Housing Units | 83 | 25.9% |
| Total Occupied Housing Units | 320 | 100.0% |
Occupancy by Household Size in Billings County
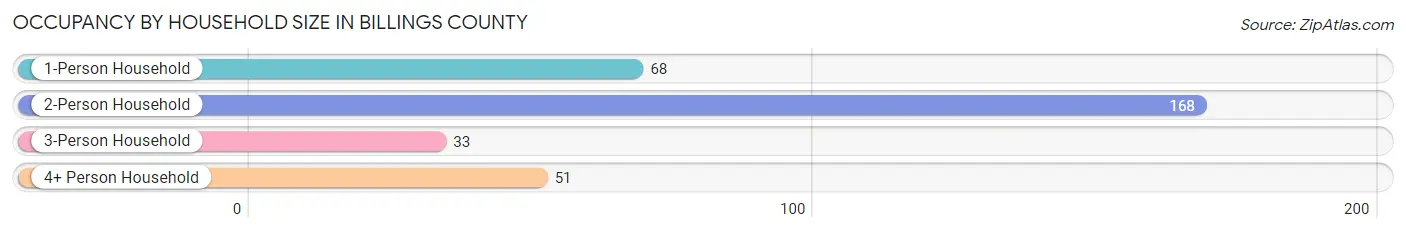
| Household Size | # Housing Units | % Housing Units |
| 1-Person Household | 68 | 21.2% |
| 2-Person Household | 168 | 52.5% |
| 3-Person Household | 33 | 10.3% |
| 4+ Person Household | 51 | 15.9% |
| Total Housing Units | 320 | 100.0% |
Occupancy by Ownership by Household Size in Billings County
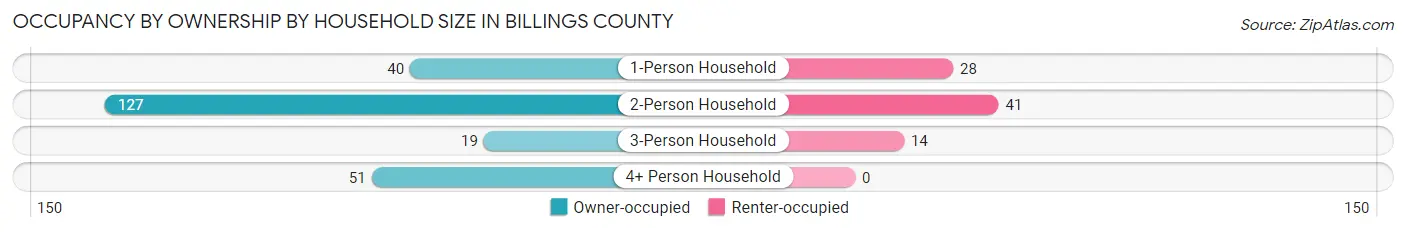
| Household Size | Owner-occupied | Renter-occupied |
| 1-Person Household | 40 (58.8%) | 28 (41.2%) |
| 2-Person Household | 127 (75.6%) | 41 (24.4%) |
| 3-Person Household | 19 (57.6%) | 14 (42.4%) |
| 4+ Person Household | 51 (100.0%) | 0 (0.0%) |
| Total Housing Units | 237 (74.1%) | 83 (25.9%) |
Occupancy by Educational Attainment in Billings County
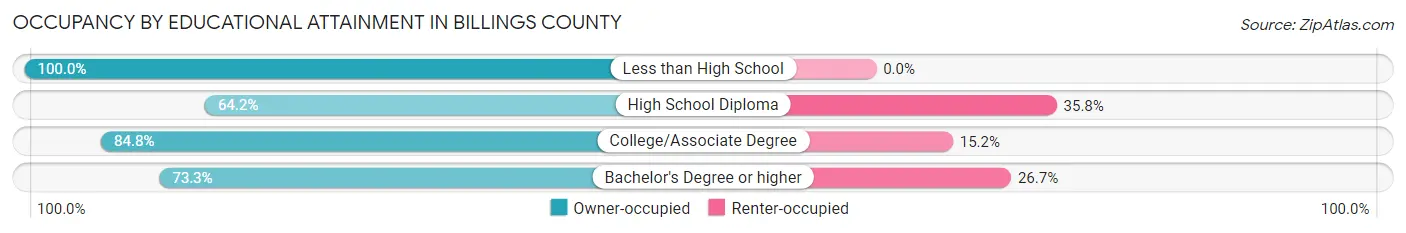
| Household Size | Owner-occupied | Renter-occupied |
| Less than High School | 17 (100.0%) | 0 (0.0%) |
| High School Diploma | 79 (64.2%) | 44 (35.8%) |
| College/Associate Degree | 67 (84.8%) | 12 (15.2%) |
| Bachelor's Degree or higher | 74 (73.3%) | 27 (26.7%) |
Occupancy by Age of Householder in Billings County
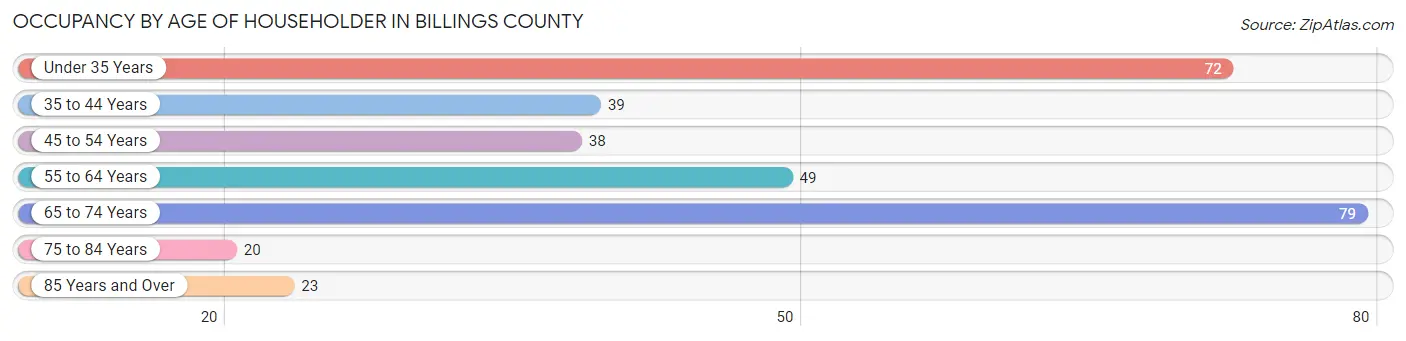
| Age Bracket | # Households | % Households |
| Under 35 Years | 72 | 22.5% |
| 35 to 44 Years | 39 | 12.2% |
| 45 to 54 Years | 38 | 11.9% |
| 55 to 64 Years | 49 | 15.3% |
| 65 to 74 Years | 79 | 24.7% |
| 75 to 84 Years | 20 | 6.2% |
| 85 Years and Over | 23 | 7.2% |
| Total | 320 | 100.0% |
Housing Finances in Billings County
Median Income by Occupancy in Billings County
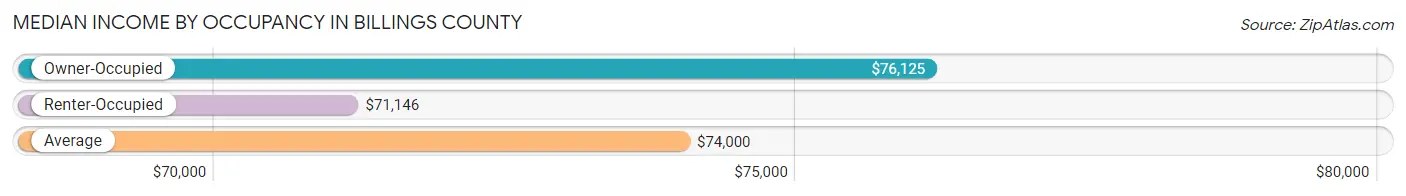
| Occupancy Type | # Households | Median Income |
| Owner-Occupied | 237 (74.1%) | $76,125 |
| Renter-Occupied | 83 (25.9%) | $71,146 |
| Average | 320 (100.0%) | $74,000 |
Occupancy by Householder Income Bracket in Billings County
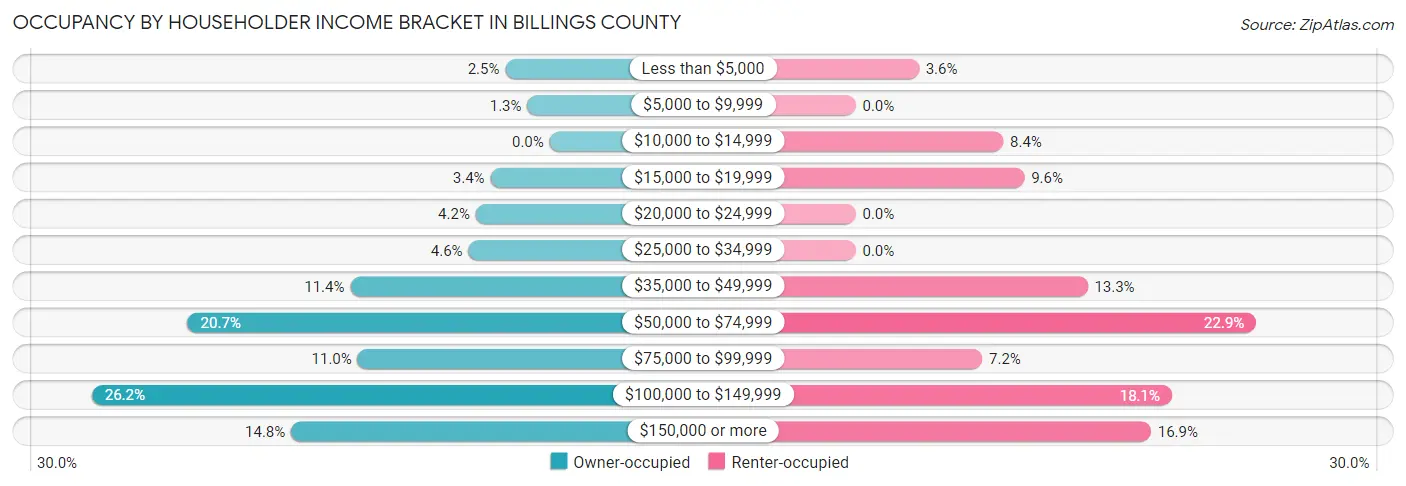
| Income Bracket | Owner-occupied | Renter-occupied |
| Less than $5,000 | 6 (2.5%) | 3 (3.6%) |
| $5,000 to $9,999 | 3 (1.3%) | 0 (0.0%) |
| $10,000 to $14,999 | 0 (0.0%) | 7 (8.4%) |
| $15,000 to $19,999 | 8 (3.4%) | 8 (9.6%) |
| $20,000 to $24,999 | 10 (4.2%) | 0 (0.0%) |
| $25,000 to $34,999 | 11 (4.6%) | 0 (0.0%) |
| $35,000 to $49,999 | 27 (11.4%) | 11 (13.3%) |
| $50,000 to $74,999 | 49 (20.7%) | 19 (22.9%) |
| $75,000 to $99,999 | 26 (11.0%) | 6 (7.2%) |
| $100,000 to $149,999 | 62 (26.2%) | 15 (18.1%) |
| $150,000 or more | 35 (14.8%) | 14 (16.9%) |
| Total | 237 (100.0%) | 83 (100.0%) |
Monthly Housing Cost Tiers in Billings County
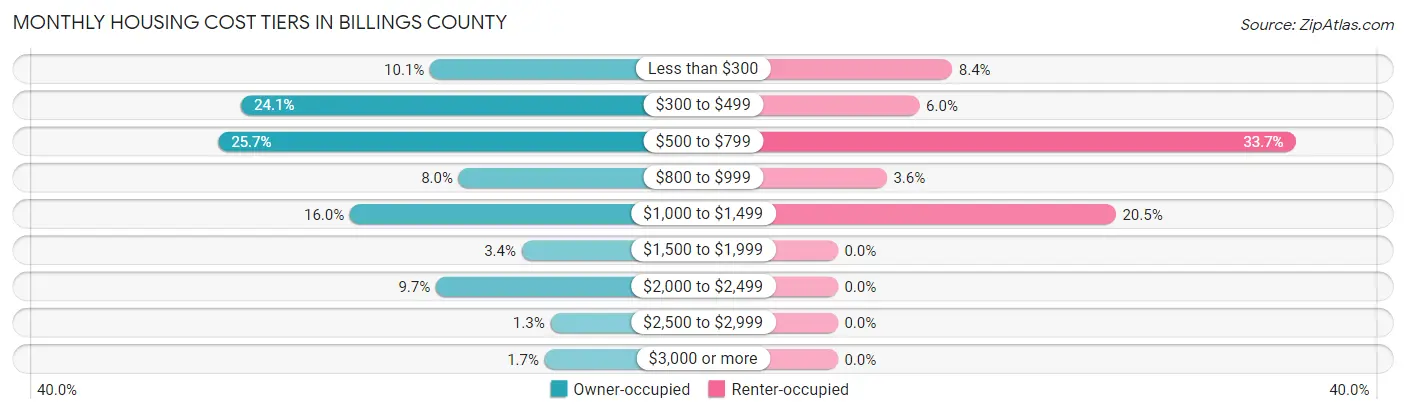
| Monthly Cost | Owner-occupied | Renter-occupied |
| Less than $300 | 24 (10.1%) | 7 (8.4%) |
| $300 to $499 | 57 (24.0%) | 5 (6.0%) |
| $500 to $799 | 61 (25.7%) | 28 (33.7%) |
| $800 to $999 | 19 (8.0%) | 3 (3.6%) |
| $1,000 to $1,499 | 38 (16.0%) | 17 (20.5%) |
| $1,500 to $1,999 | 8 (3.4%) | 0 (0.0%) |
| $2,000 to $2,499 | 23 (9.7%) | 0 (0.0%) |
| $2,500 to $2,999 | 3 (1.3%) | 0 (0.0%) |
| $3,000 or more | 4 (1.7%) | 0 (0.0%) |
| Total | 237 (100.0%) | 83 (100.0%) |
Physical Housing Characteristics in Billings County
Housing Structures in Billings County
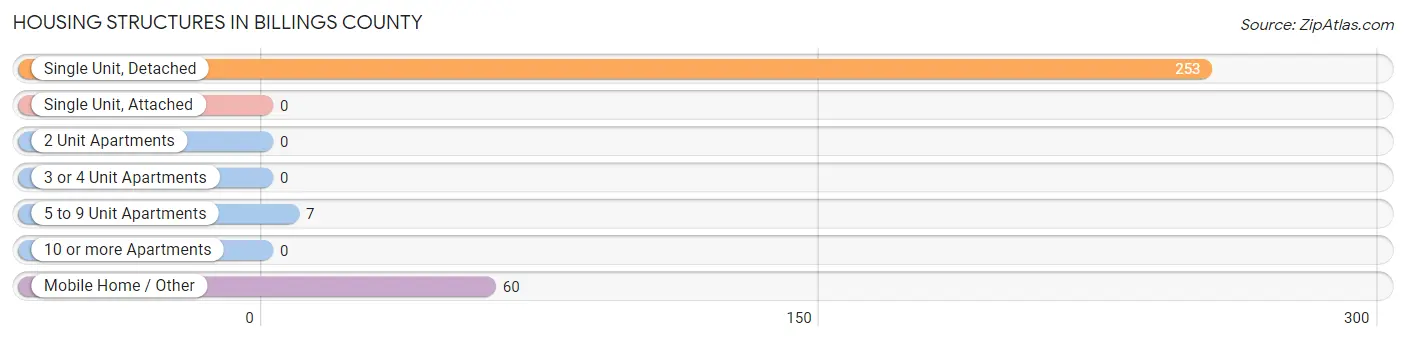
| Structure Type | # Housing Units | % Housing Units |
| Single Unit, Detached | 253 | 79.1% |
| Single Unit, Attached | 0 | 0.0% |
| 2 Unit Apartments | 0 | 0.0% |
| 3 or 4 Unit Apartments | 0 | 0.0% |
| 5 to 9 Unit Apartments | 7 | 2.2% |
| 10 or more Apartments | 0 | 0.0% |
| Mobile Home / Other | 60 | 18.8% |
| Total | 320 | 100.0% |
Housing Structures by Occupancy in Billings County
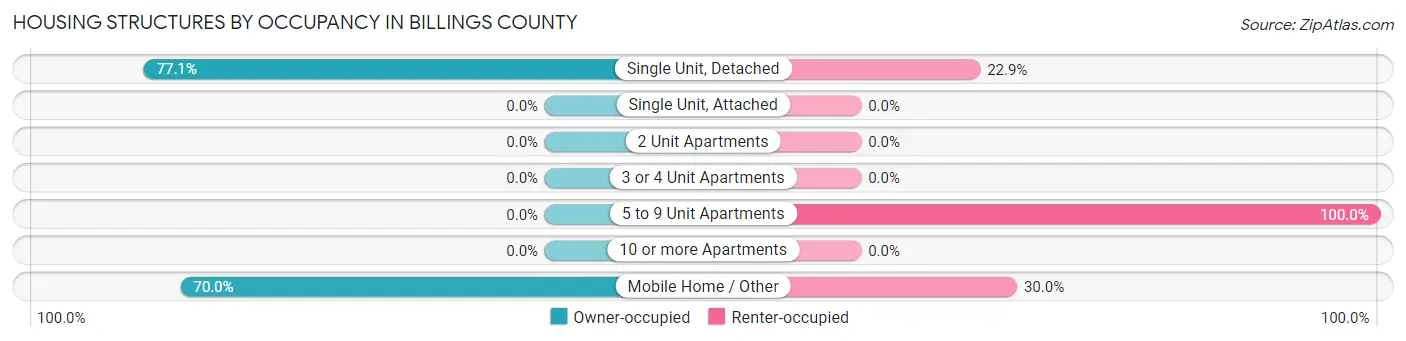
| Structure Type | Owner-occupied | Renter-occupied |
| Single Unit, Detached | 195 (77.1%) | 58 (22.9%) |
| Single Unit, Attached | 0 (0.0%) | 0 (0.0%) |
| 2 Unit Apartments | 0 (0.0%) | 0 (0.0%) |
| 3 or 4 Unit Apartments | 0 (0.0%) | 0 (0.0%) |
| 5 to 9 Unit Apartments | 0 (0.0%) | 7 (100.0%) |
| 10 or more Apartments | 0 (0.0%) | 0 (0.0%) |
| Mobile Home / Other | 42 (70.0%) | 18 (30.0%) |
| Total | 237 (74.1%) | 83 (25.9%) |
Housing Structures by Number of Rooms in Billings County
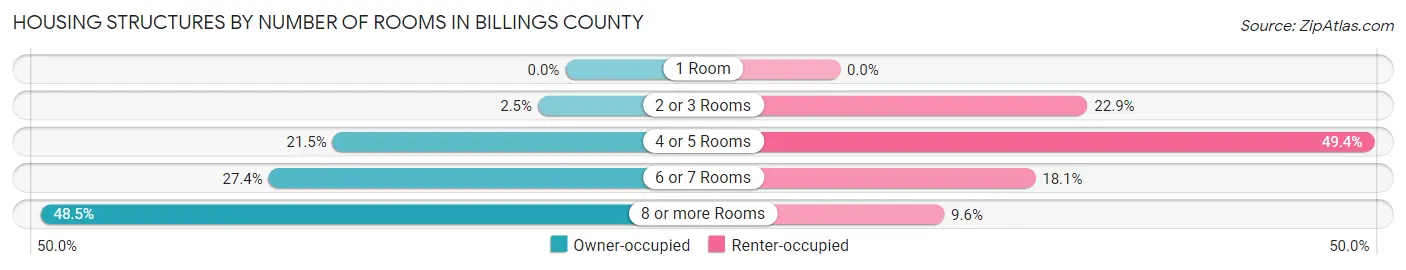
| Number of Rooms | Owner-occupied | Renter-occupied |
| 1 Room | 0 (0.0%) | 0 (0.0%) |
| 2 or 3 Rooms | 6 (2.5%) | 19 (22.9%) |
| 4 or 5 Rooms | 51 (21.5%) | 41 (49.4%) |
| 6 or 7 Rooms | 65 (27.4%) | 15 (18.1%) |
| 8 or more Rooms | 115 (48.5%) | 8 (9.6%) |
| Total | 237 (100.0%) | 83 (100.0%) |
Housing Structure by Heating Type in Billings County
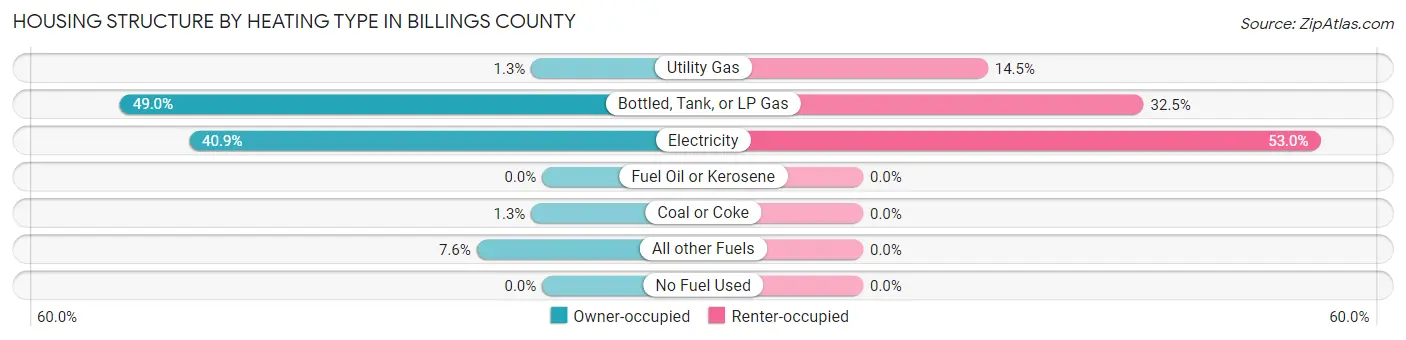
| Heating Type | Owner-occupied | Renter-occupied |
| Utility Gas | 3 (1.3%) | 12 (14.5%) |
| Bottled, Tank, or LP Gas | 116 (48.9%) | 27 (32.5%) |
| Electricity | 97 (40.9%) | 44 (53.0%) |
| Fuel Oil or Kerosene | 0 (0.0%) | 0 (0.0%) |
| Coal or Coke | 3 (1.3%) | 0 (0.0%) |
| All other Fuels | 18 (7.6%) | 0 (0.0%) |
| No Fuel Used | 0 (0.0%) | 0 (0.0%) |
| Total | 237 (100.0%) | 83 (100.0%) |
Household Vehicle Usage in Billings County
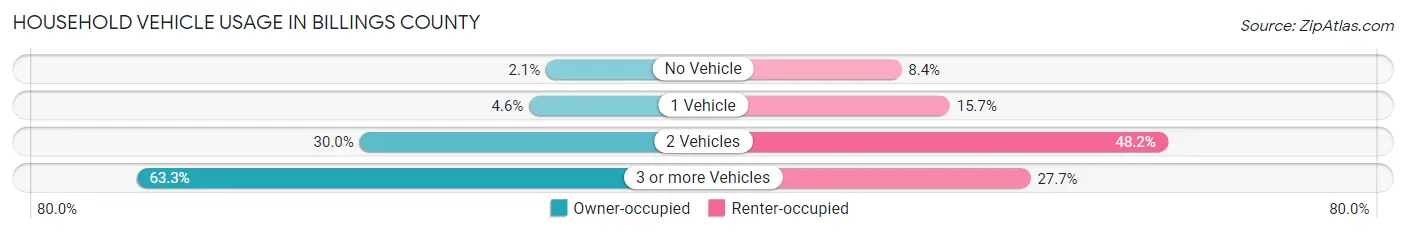
| Vehicles per Household | Owner-occupied | Renter-occupied |
| No Vehicle | 5 (2.1%) | 7 (8.4%) |
| 1 Vehicle | 11 (4.6%) | 13 (15.7%) |
| 2 Vehicles | 71 (30.0%) | 40 (48.2%) |
| 3 or more Vehicles | 150 (63.3%) | 23 (27.7%) |
| Total | 237 (100.0%) | 83 (100.0%) |
Real Estate & Mortgages in Billings County
Real Estate and Mortgage Overview in Billings County
| Characteristic | Without Mortgage | With Mortgage |
| Housing Units | 172 | 65 |
| Median Property Value | $200,000 | $285,900 |
| Median Household Income | $71,000 | $19 |
| Monthly Housing Costs | $528 | $4 |
| Real Estate Taxes | $975 | $0 |
Property Value by Mortgage Status in Billings County
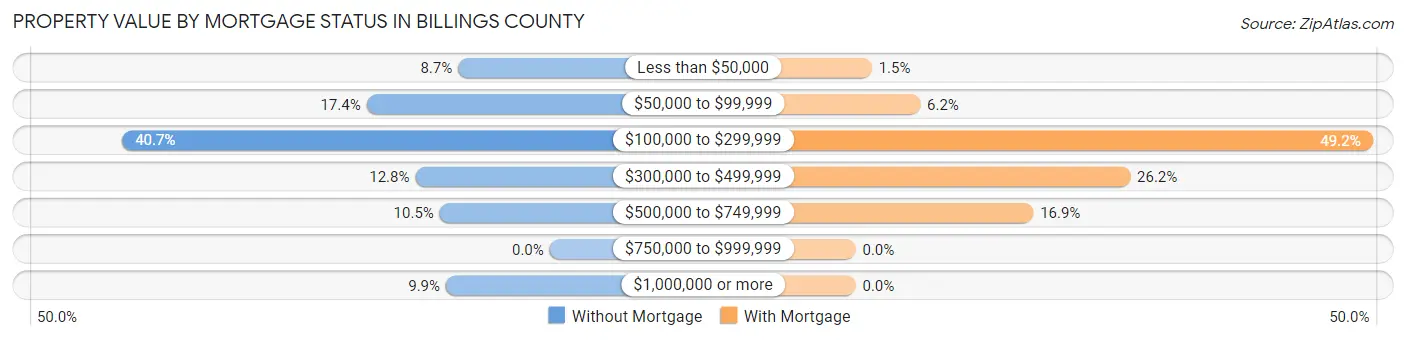
| Property Value | Without Mortgage | With Mortgage |
| Less than $50,000 | 15 (8.7%) | 1 (1.5%) |
| $50,000 to $99,999 | 30 (17.4%) | 4 (6.1%) |
| $100,000 to $299,999 | 70 (40.7%) | 32 (49.2%) |
| $300,000 to $499,999 | 22 (12.8%) | 17 (26.2%) |
| $500,000 to $749,999 | 18 (10.5%) | 11 (16.9%) |
| $750,000 to $999,999 | 0 (0.0%) | 0 (0.0%) |
| $1,000,000 or more | 17 (9.9%) | 0 (0.0%) |
| Total | 172 (100.0%) | 65 (100.0%) |
Household Income by Mortgage Status in Billings County
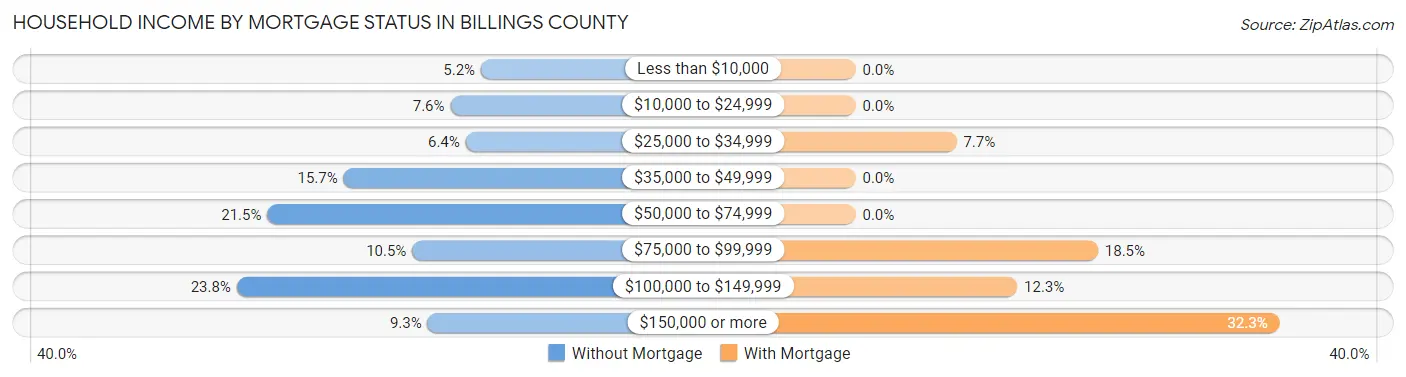
| Household Income | Without Mortgage | With Mortgage |
| Less than $10,000 | 9 (5.2%) | 0 (0.0%) |
| $10,000 to $24,999 | 13 (7.6%) | 0 (0.0%) |
| $25,000 to $34,999 | 11 (6.4%) | 5 (7.7%) |
| $35,000 to $49,999 | 27 (15.7%) | 0 (0.0%) |
| $50,000 to $74,999 | 37 (21.5%) | 0 (0.0%) |
| $75,000 to $99,999 | 18 (10.5%) | 12 (18.5%) |
| $100,000 to $149,999 | 41 (23.8%) | 8 (12.3%) |
| $150,000 or more | 16 (9.3%) | 21 (32.3%) |
| Total | 172 (100.0%) | 65 (100.0%) |
Property Value to Household Income Ratio in Billings County
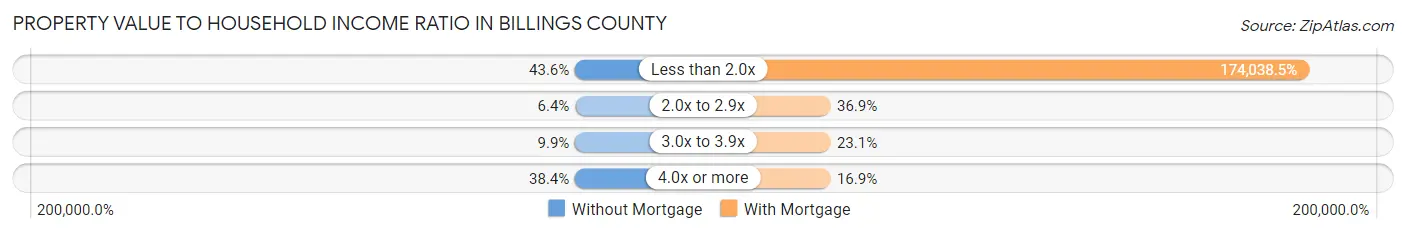
| Value-to-Income Ratio | Without Mortgage | With Mortgage |
| Less than 2.0x | 75 (43.6%) | 113,125 (174,038.5%) |
| 2.0x to 2.9x | 11 (6.4%) | 24 (36.9%) |
| 3.0x to 3.9x | 17 (9.9%) | 15 (23.1%) |
| 4.0x or more | 66 (38.4%) | 11 (16.9%) |
| Total | 172 (100.0%) | 65 (100.0%) |
Real Estate Taxes by Mortgage Status in Billings County
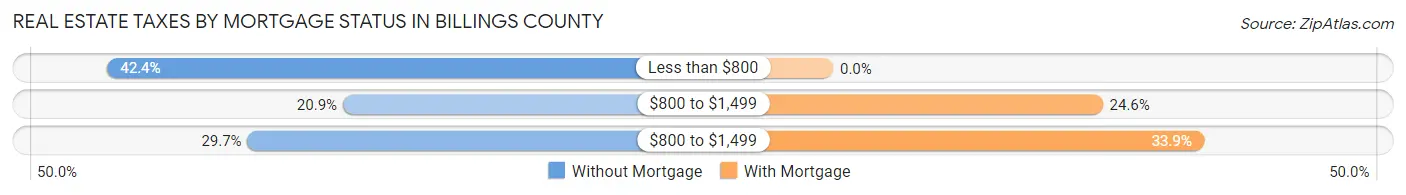
| Property Taxes | Without Mortgage | With Mortgage |
| Less than $800 | 73 (42.4%) | 0 (0.0%) |
| $800 to $1,499 | 36 (20.9%) | 16 (24.6%) |
| $800 to $1,499 | 51 (29.6%) | 22 (33.9%) |
| Total | 172 (100.0%) | 65 (100.0%) |
Health & Disability in Billings County
Health Insurance Coverage by Age in Billings County
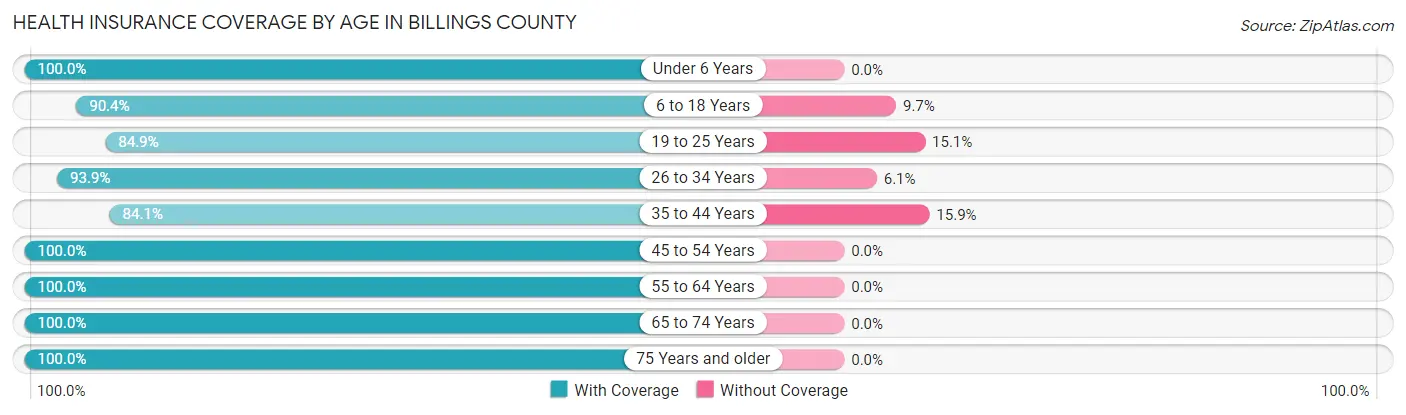
| Age Bracket | With Coverage | Without Coverage |
| Under 6 Years | 74 (100.0%) | 0 (0.0%) |
| 6 to 18 Years | 103 (90.3%) | 11 (9.7%) |
| 19 to 25 Years | 62 (84.9%) | 11 (15.1%) |
| 26 to 34 Years | 62 (93.9%) | 4 (6.1%) |
| 35 to 44 Years | 106 (84.1%) | 20 (15.9%) |
| 45 to 54 Years | 61 (100.0%) | 0 (0.0%) |
| 55 to 64 Years | 113 (100.0%) | 0 (0.0%) |
| 65 to 74 Years | 152 (100.0%) | 0 (0.0%) |
| 75 Years and older | 60 (100.0%) | 0 (0.0%) |
| Total | 793 (94.5%) | 46 (5.5%) |
Health Insurance Coverage by Citizenship Status in Billings County
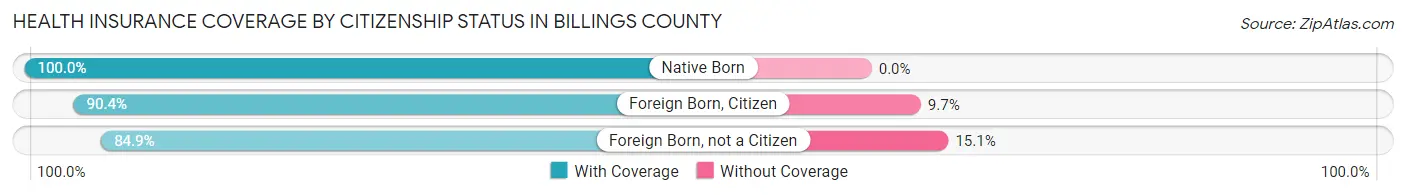
| Citizenship Status | With Coverage | Without Coverage |
| Native Born | 74 (100.0%) | 0 (0.0%) |
| Foreign Born, Citizen | 103 (90.3%) | 11 (9.7%) |
| Foreign Born, not a Citizen | 62 (84.9%) | 11 (15.1%) |
Health Insurance Coverage by Household Income in Billings County
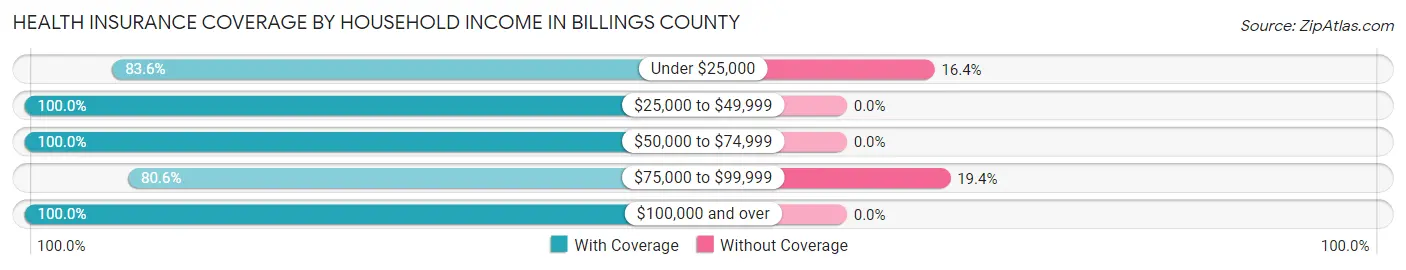
| Household Income | With Coverage | Without Coverage |
| Under $25,000 | 56 (83.6%) | 11 (16.4%) |
| $25,000 to $49,999 | 77 (100.0%) | 0 (0.0%) |
| $50,000 to $74,999 | 183 (100.0%) | 0 (0.0%) |
| $75,000 to $99,999 | 129 (80.6%) | 31 (19.4%) |
| $100,000 and over | 327 (100.0%) | 0 (0.0%) |
Public vs Private Health Insurance Coverage by Age in Billings County
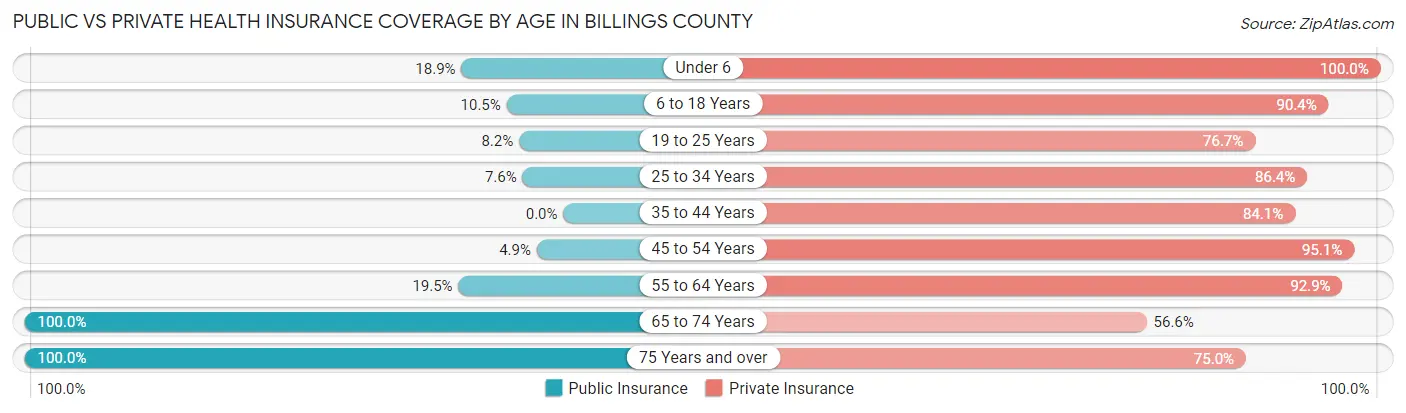
| Age Bracket | Public Insurance | Private Insurance |
| Under 6 | 14 (18.9%) | 74 (100.0%) |
| 6 to 18 Years | 12 (10.5%) | 103 (90.3%) |
| 19 to 25 Years | 6 (8.2%) | 56 (76.7%) |
| 25 to 34 Years | 5 (7.6%) | 57 (86.4%) |
| 35 to 44 Years | 0 (0.0%) | 106 (84.1%) |
| 45 to 54 Years | 3 (4.9%) | 58 (95.1%) |
| 55 to 64 Years | 22 (19.5%) | 105 (92.9%) |
| 65 to 74 Years | 152 (100.0%) | 86 (56.6%) |
| 75 Years and over | 60 (100.0%) | 45 (75.0%) |
| Total | 274 (32.7%) | 690 (82.2%) |
Disability Status by Sex by Age in Billings County
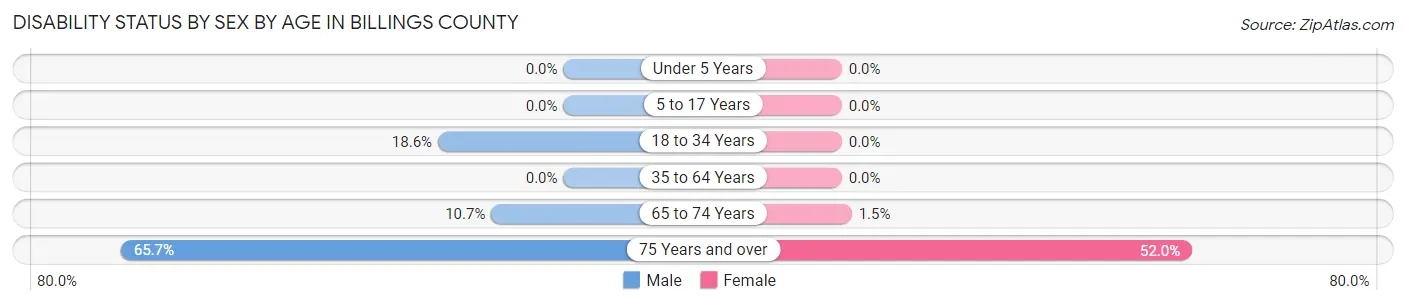
| Age Bracket | Male | Female |
| Under 5 Years | 0 (0.0%) | 0 (0.0%) |
| 5 to 17 Years | 0 (0.0%) | 0 (0.0%) |
| 18 to 34 Years | 19 (18.6%) | 0 (0.0%) |
| 35 to 64 Years | 0 (0.0%) | 0 (0.0%) |
| 65 to 74 Years | 9 (10.7%) | 1 (1.5%) |
| 75 Years and over | 23 (65.7%) | 13 (52.0%) |
Disability Class by Sex by Age in Billings County
Disability Class: Hearing Difficulty
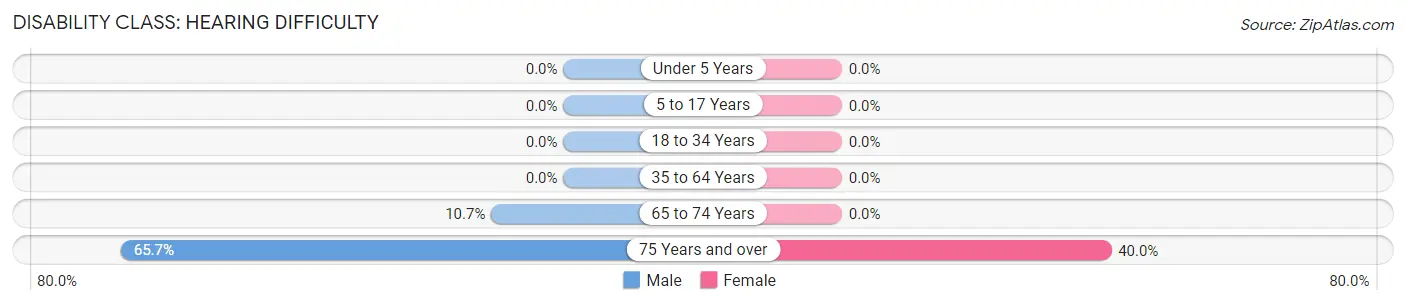
| Age Bracket | Male | Female |
| Under 5 Years | 0 (0.0%) | 0 (0.0%) |
| 5 to 17 Years | 0 (0.0%) | 0 (0.0%) |
| 18 to 34 Years | 0 (0.0%) | 0 (0.0%) |
| 35 to 64 Years | 0 (0.0%) | 0 (0.0%) |
| 65 to 74 Years | 9 (10.7%) | 0 (0.0%) |
| 75 Years and over | 23 (65.7%) | 10 (40.0%) |
Disability Class: Vision Difficulty
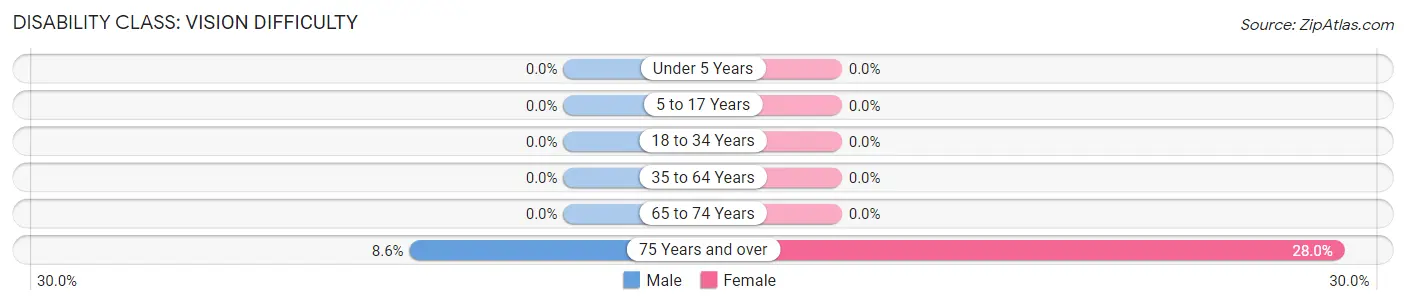
| Age Bracket | Male | Female |
| Under 5 Years | 0 (0.0%) | 0 (0.0%) |
| 5 to 17 Years | 0 (0.0%) | 0 (0.0%) |
| 18 to 34 Years | 0 (0.0%) | 0 (0.0%) |
| 35 to 64 Years | 0 (0.0%) | 0 (0.0%) |
| 65 to 74 Years | 0 (0.0%) | 0 (0.0%) |
| 75 Years and over | 3 (8.6%) | 7 (28.0%) |
Disability Class: Cognitive Difficulty
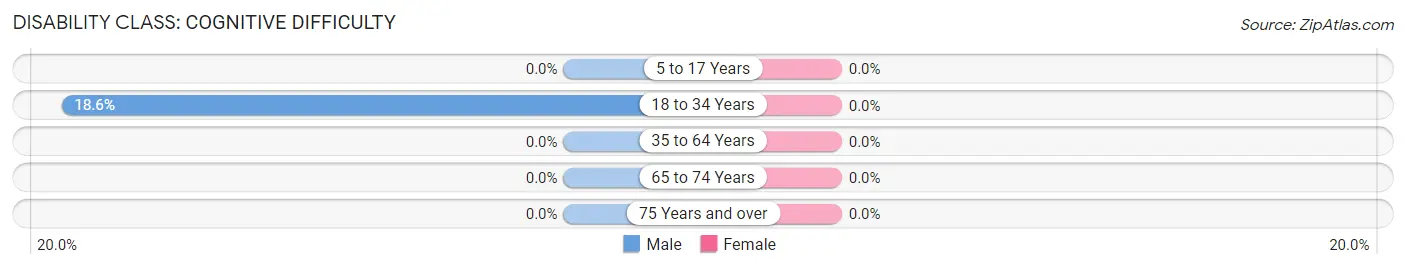
| Age Bracket | Male | Female |
| 5 to 17 Years | 0 (0.0%) | 0 (0.0%) |
| 18 to 34 Years | 19 (18.6%) | 0 (0.0%) |
| 35 to 64 Years | 0 (0.0%) | 0 (0.0%) |
| 65 to 74 Years | 0 (0.0%) | 0 (0.0%) |
| 75 Years and over | 0 (0.0%) | 0 (0.0%) |
Disability Class: Ambulatory Difficulty
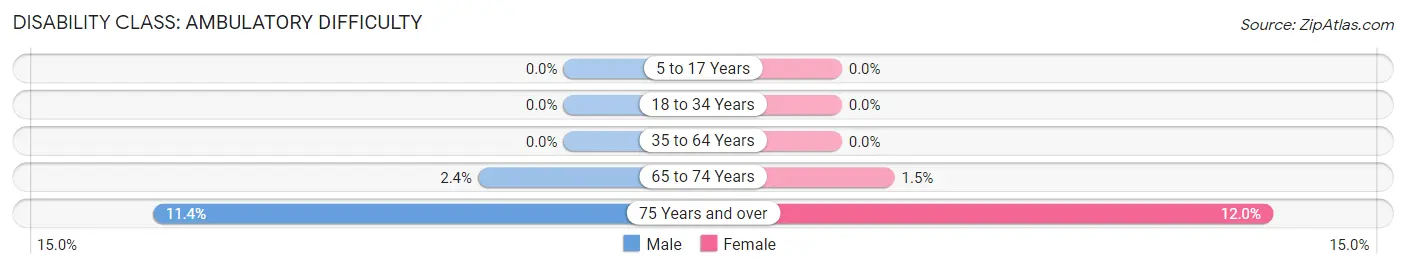
| Age Bracket | Male | Female |
| 5 to 17 Years | 0 (0.0%) | 0 (0.0%) |
| 18 to 34 Years | 0 (0.0%) | 0 (0.0%) |
| 35 to 64 Years | 0 (0.0%) | 0 (0.0%) |
| 65 to 74 Years | 2 (2.4%) | 1 (1.5%) |
| 75 Years and over | 4 (11.4%) | 3 (12.0%) |
Disability Class: Self-Care Difficulty
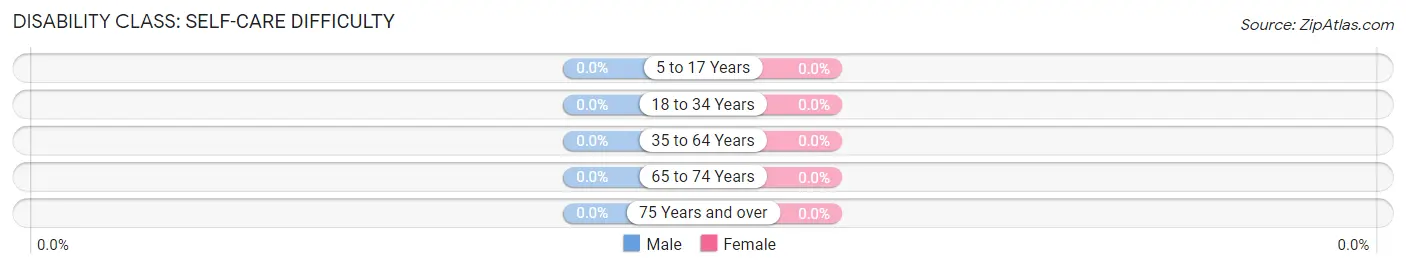
| Age Bracket | Male | Female |
| 5 to 17 Years | 0 (0.0%) | 0 (0.0%) |
| 18 to 34 Years | 0 (0.0%) | 0 (0.0%) |
| 35 to 64 Years | 0 (0.0%) | 0 (0.0%) |
| 65 to 74 Years | 0 (0.0%) | 0 (0.0%) |
| 75 Years and over | 0 (0.0%) | 0 (0.0%) |
Technology Access in Billings County
Computing Device Access in Billings County
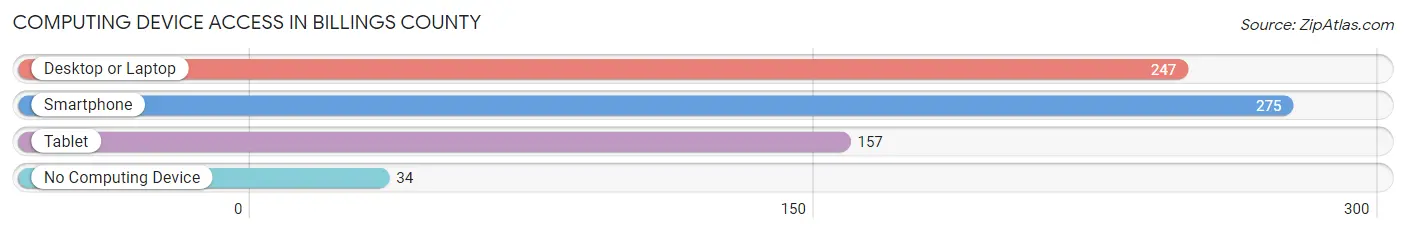
| Device Type | # Households | % Households |
| Desktop or Laptop | 247 | 77.2% |
| Smartphone | 275 | 85.9% |
| Tablet | 157 | 49.1% |
| No Computing Device | 34 | 10.6% |
| Total | 320 | 100.0% |
Internet Access in Billings County
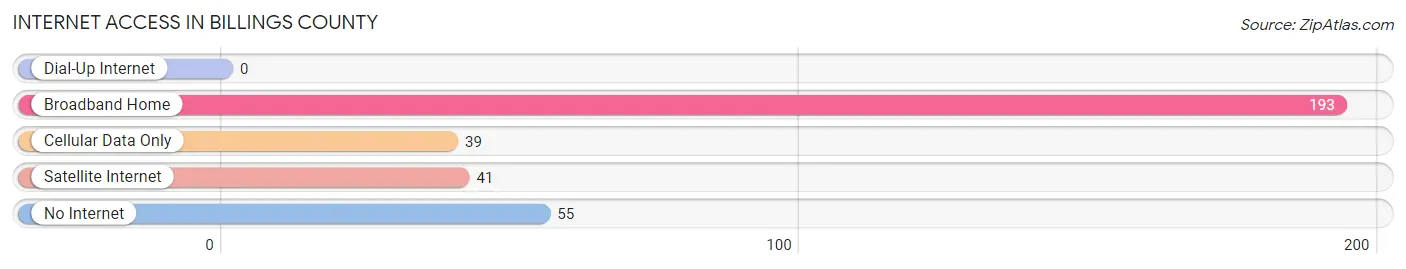
| Internet Type | # Households | % Households |
| Dial-Up Internet | 0 | 0.0% |
| Broadband Home | 193 | 60.3% |
| Cellular Data Only | 39 | 12.2% |
| Satellite Internet | 41 | 12.8% |
| No Internet | 55 | 17.2% |
| Total | 320 | 100.0% |
Billings County Summary
Billings County is located in the western part of North Dakota, and is the sixth largest county in the state. It is bordered by Stark County to the north, Bowman County to the east, Slope County to the south, and Montana to the west. The county seat is Medora, and the largest city is Belfield.
History
The area that is now Billings County was first inhabited by the Mandan and Hidatsa Native American tribes. The first white settlers arrived in the area in the late 1800s, and the county was officially established in 1879. The county was named after Frederick Billings, a former president of the Northern Pacific Railway.
The county experienced rapid growth in the early 1900s, as the railroad brought in new settlers and businesses. The county was also home to several large ranches, which helped to drive the local economy.
Geography
Billings County covers an area of 2,845 square miles, making it the sixth largest county in North Dakota. The county is located in the western part of the state, and is bordered by Montana to the west, Stark County to the north, Bowman County to the east, and Slope County to the south.
The terrain of the county is mostly flat, with some rolling hills in the western part of the county. The Little Missouri River runs through the county, and there are several small lakes and ponds scattered throughout the area.
Economy
The economy of Billings County is largely based on agriculture and ranching. The county is home to several large ranches, which produce beef, sheep, and other livestock. The county is also home to several large farms, which produce wheat, corn, and other crops.
In addition to agriculture, the county is also home to several oil and gas fields, which provide jobs and revenue for the county. The county is also home to several small businesses, including restaurants, retail stores, and other services.
Demographics
As of the 2010 census, the population of Billings County was 1,845. The population is spread out across the county, with the largest population centers being Belfield and Medora. The population is mostly white (94.3%), with small percentages of Native American (2.2%), African American (1.2%), and Asian (0.7%) residents.
The median household income in the county is $45,000, and the median home value is $125,000. The unemployment rate in the county is 4.2%, which is lower than the national average.
Conclusion
Billings County is a rural county located in the western part of North Dakota. The county is home to several large ranches and farms, as well as several oil and gas fields. The population of the county is mostly white, and the median household income is $45,000. The county is home to several small businesses, and the unemployment rate is lower than the national average.
Common Questions
What is Per Capita Income in Billings County?
Per Capita income in Billings County is $36,923.
What is the Median Family Income in Billings County?
Median Family Income in Billings County is $104,688.
What is the Median Household income in Billings County?
Median Household Income in Billings County is $74,000.
What is Income or Wage Gap in Billings County?
Income or Wage Gap in Billings County is 34.6%.
Women in Billings County earn 65.4 cents for every dollar earned by a man.
What is Family Income Deficit in Billings County?
Family Income Deficit in Billings County is $3,653.
Families that are below poverty line in Billings County earn $3,653 less on average than the poverty threshold level.
What is Inequality or Gini Index in Billings County?
Inequality or Gini Index in Billings County is 0.38.
What is the Total Population of Billings County?
Total Population of Billings County is 839.
What is the Total Male Population of Billings County?
Total Male Population of Billings County is 456.
What is the Total Female Population of Billings County?
Total Female Population of Billings County is 383.
What is the Ratio of Males per 100 Females in Billings County?
There are 119.06 Males per 100 Females in Billings County.
What is the Ratio of Females per 100 Males in Billings County?
There are 83.99 Females per 100 Males in Billings County.
What is the Median Population Age in Billings County?
Median Population Age in Billings County is 40.6 Years.
What is the Average Family Size in Billings County
Average Family Size in Billings County is 2.8 People.
What is the Average Household Size in Billings County
Average Household Size in Billings County is 2.5 People.
How Large is the Labor Force in Billings County?
There are 431 People in the Labor Forcein in Billings County.
What is the Percentage of People in the Labor Force in Billings County?
63.3% of People are in the Labor Force in Billings County.
What is the Unemployment Rate in Billings County?
Unemployment Rate in Billings County is 2.1%.