Zip Codes with the Highest Percentage of Households with Income Below $10,000 in New Bedford, MA
RELATED REPORTS & OPTIONS
Household Income | $0-10k
New Bedford
Compare Zip Codes
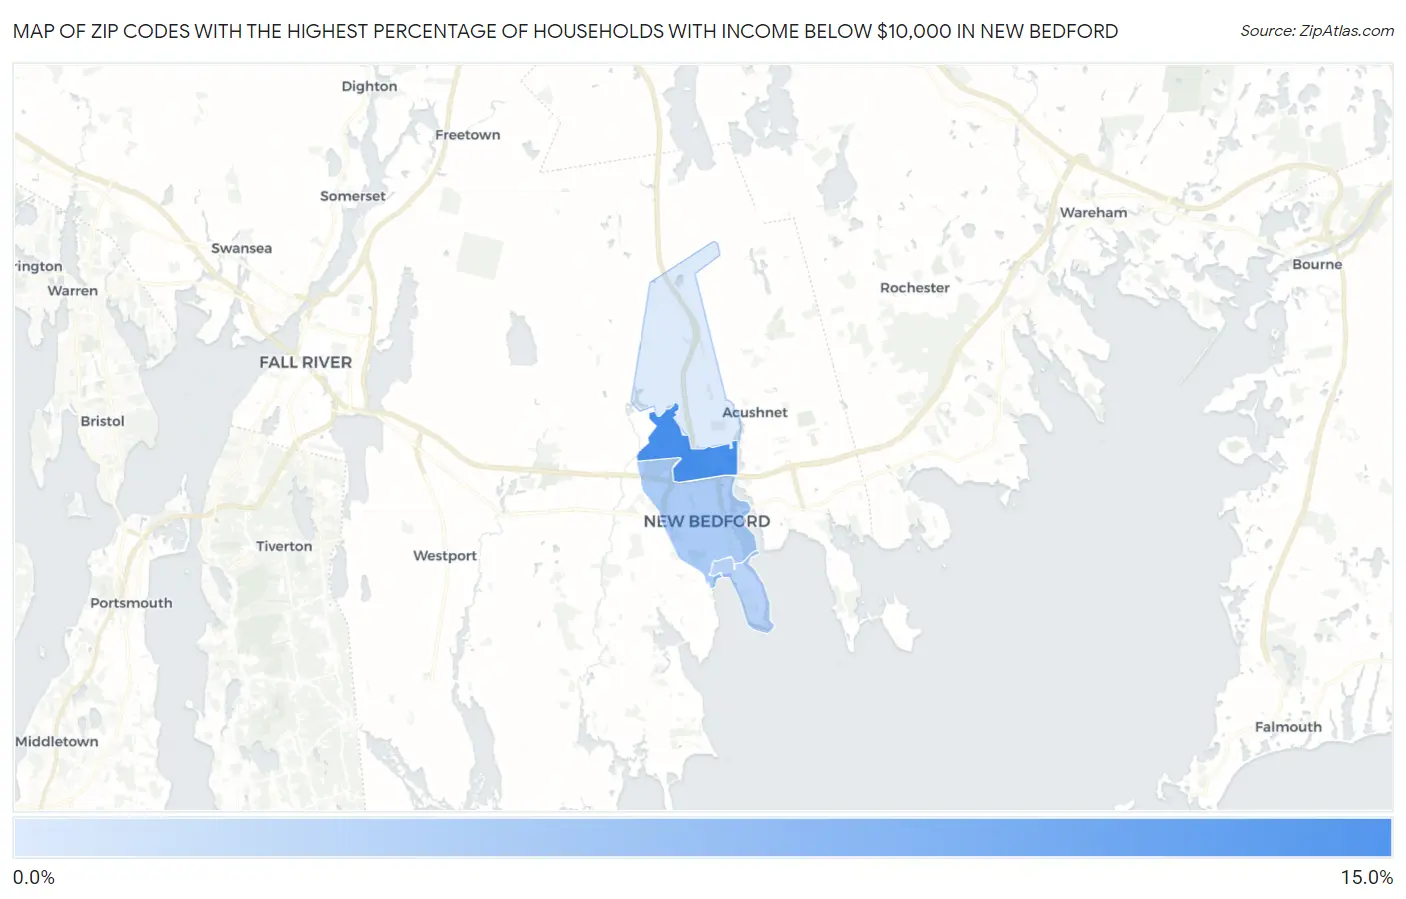
Map of Zip Codes with the Highest Percentage of Households with Income Below $10,000 in New Bedford
4.8%
12.5%
Zip Codes with the Highest Percentage of Households with Income Below $10,000 in New Bedford, MA
| Zip Code | Households with Income < $10k | vs State | vs National | |
| 1. | 02746 | 12.5% | 4.4%(+8.10)#21 | 4.9%(+7.60)#2,255 |
| 2. | 02740 | 7.4% | 4.4%(+3.00)#54 | 4.9%(+2.50)#6,337 |
| 3. | 02744 | 6.6% | 4.4%(+2.20)#74 | 4.9%(+1.70)#7,751 |
| 4. | 02745 | 4.8% | 4.4%(+0.400)#135 | 4.9%(-0.100)#12,337 |
1
Common Questions
What are the Top 3 Zip Codes with the Highest Percentage of Households with Income Below $10,000 in New Bedford, MA?
Top 3 Zip Codes with the Highest Percentage of Households with Income Below $10,000 in New Bedford, MA are:
What zip code has the Highest Percentage of Households with Income Below $10,000 in New Bedford, MA?
02746 has the Highest Percentage of Households with Income Below $10,000 in New Bedford, MA with 12.5%.
What is the Percentage of Households with Income Below $10,000 in New Bedford, MA?
Percentage of Households with Income Below $10,000 in New Bedford is 7.5%.
What is the Percentage of Households with Income Below $10,000 in Massachusetts?
Percentage of Households with Income Below $10,000 in Massachusetts is 4.4%.
What is the Percentage of Households with Income Below $10,000 in the United States?
Percentage of Households with Income Below $10,000 in the United States is 4.9%.